

Abstract
To date, the majority of neurovascular coupling studies focused on the thalamic afferents' activity in layer IV and the corresponding large spiking activity as responsible for functional hyperemia. This paper highlights the role of the secondary and late cortico-cortical transmission in neurovascular coupling. Simultaneous scalp electroencephalography (EEG) and diffuse optical imaging (DOI) measurements were obtained during multiple conditions of event-related electrical forepaw stimulation in 33 male Sprague-Dawley rats divided into 6 groups depending on the maintaining anesthetic - alpha-chloralose, pentobarbital, ketamine-xylazine, fentanyl-droperidol, isoflurane, or propofol. The somatosensory evoked potentials (SEP) were decomposed into four components and the question of which best predicts the hemodynamic responses was investigated. Results of the linear regression analysis show that the hemodynamic response is best correlated with the secondary and late cortico-cortical transmissions and not with the initial thalamic input activity in layer IV. Baseline cerebral blood flow (CBF) interacts with neural activity and influences the evoked hemodynamic responses. Finally, neurovascular coupling appears to be the same across all anesthetics used.
Introduction
Since its introduction in 1991 the role of functional magnetic resonance imaging (fMRI) in basic and clinical neuroscience has grown rapidly, with 2500 papers published in 2005 alone (Bandettini, 2007). Although fMRI is now widely used for non-invasive investigations of human brain function, we still do not have a clear understanding of how accurately these images based on vascular changes reflect neural activity (Bandettini, 2007; Iadecola, 2004; Shibasaki, 2008). Because of the growing number of functional studies with fMRI, quantification of the relationship between the hemoglobin signal and the underlying neural activity is becoming increasingly important.
Recently, significant effort has been devoted to invasive animal studies (Berwick et al., 2008; Devor et al., 2005; Mathiesen et al., 1998; Sheth et al., 2004). Such studies are typically performed using different anesthetics, which may alter the coupling between neural and vascular responses in different ways. While the effects of different anesthetics on electrical, metabolic, or vascular responses alone have been reported, only a few studies have investigated the effect of anesthetics on the relationship between the electrical and vascular functional imaging signals measured during neuronal activity (Austin et al., 2005; Maandag et al., 2007; Martin et al., 2006; Masamoto et al., 2009; Ueki et al., 1992). During event-related parametric electrical forepaw stimulation in rats, we investigated the neurovascular coupling using six different anesthetics (alpha-chloralose, isoflurane, pentobarbital, propofol, ketamine-xylazine, and fentanyl-droperidol).
Different anesthetics act differently on neurotransmitters and neuronal membrane polarization thresholds (Hyder et al., 2002; Maandag et al., 2007; Sibson et al., 1998; Sicard et al., 2003), and as a result modulate the measured EEG evoked signals differently (Antunes et al., 2003a; Antunes et al., 2003b). The main properties/characteristics of the anesthetics we chose for this study are briefly listed here.
Alpha-chloralose, pentobarbital, isoflurane, and propofol are mainly GABAergic anesthetics and prolong the evoked inhibitory postsynaptic currents mediated by γ-aminobutyric acid A (GABAA) by increasing channel conductance or channel open time (Belelli et al., 1999; Franks and Lieb, 1994). Of these four GABAergic anesthetics, alpha-chloralose is the most commonly used for functional hemodynamic studies because of its weaker effects on cardiovascular, respiratory, and reflex functions (Nakao et al., 2001), and more importantly, the evoked hemodynamic responses are larger with alpha-chloralose than with other anesthetics (Austin et al., 2005). Isoflurane is commonly used in electrophysiology studies due to its ease of use, even though it partially reduces neuronal excitation and cerebral metabolism like most volatile anesthetics. At doses higher than 1.6% isoflurane increases cerebral blood flow (CBF) (Eger, 1984) and for this reason it is not commonly used for hemodynamic functional studies. Pentobarbital and propofol are usually not used in functional studies as they depress the central nervous system as well as cortical and subcortical structures, and produce large decreases in EEG responses (Antognini et al., 2006; Crosby et al., 1983). Pentobarbital, a barbiturate, in contrast with other anesthetics, potentiates not only inhibitory but also excitatory postsynaptic receptors (Franks and Lieb, 1994). Propofol is the intravenous anesthetic of choice in surgery because of its favorable operating conditions and associated rapid recovery. It reduces heart rate (Wang et al., 2004) and baseline cerebral blood flow (Cenic et al., 2000; Veselis et al., 2005). With Propofol, a dose-dependent gradual reduction of SEP amplitude and prolonged latency has been measured in rats (Logginidou et al., 2003).
The other two combinations of anesthetics we used are not GABAergic. Ketamine, in particular, does not interact with GABA receptors (Franks and Lieb, 1994) but mainly inhibits excitatory glutamatergic neurotransmission, blocking N-methyl-D-aspartate (NMDA) receptors. Ketamine also acts on opioid, monoaminergic and muscarinic receptors (Hirota and Lambert, 1996). Ketamine is often used in functional electrophysiology studies because it does not suppress neural activity (Kochs and Bischoff, 1994), and also because animals do not need to be intubated for its use. In fact, with ketamine, there is minimal cardio-respiratory depression. Ketamine causes both increases and decreases in cerebral metabolism (glucose utilization) depending on the brain region. Decreases in metabolism occur in the somatosensory and auditory cortices (Crosby et al., 1982). It produces a dose-related clinical state of dissociative anesthesia in combination with analgesic properties, and is commonly used in conjunction with xylazine. Xylazine is a sedative and a muscle relaxant. It minimizes the side effects produced by ketamine alone, such as tremor, muscle rigidity, and excitement during recovery (Wright, 1982). Xylazine inhibits noradrenergic neurotransmission by activating presynaptic adrenergic alpha-2 receptors (Oria et al., 2008). Because it is an agonist for alpha-2-adrenoreceptors, xylazine decreases the heart rate, causes hypotension, decreases venous cerebral blood volume and intracranial pressure, and depresses the central nervous system (Greene and Thurmon, 1988). In addition, xylazine induces a reduction in CBF (Lei et al., 2001).
Fentanyl is a synthetic opiate analgesic used routinely in anesthesia procedures in humans. Fentanyl binds with high affinity to the morphine μ-opioid receptors (Villiger et al., 1983). Fentanyl produces a dose-related decrease in both CBF and cerebral metabolic rate of oxygen (CMRO2) (Carlsson et al., 1982). It is commonly used in conjunction with Droperidol to induce neuroleptanesthesia (Bissonnette et al., 1999). Droperidol is a neuroleptic drug and belongs to the butyrophenones; it has antipsychotic effects, which are produced by blocking dopamine receptors (Bissonnette et al., 1999). One of the advantages of droperidol is its lack of EEG effects, and although it reduces cerebral blood flow by vasoconstricting the cerebral vessels, the cerebral metabolic rate of oxygen remains unchanged. Clinical doses of droperidol decrease systemic blood pressure and cause reductions in tidal volume, airway resistance and functional residual capacity.
We used scalp electroencephalography (EEG) and diffuse optical imaging (DOI) for our functional measurements. These two modalities allow for non-invasive scalp measurements, interrogate large volumes of tissue, and can be easily integrated together for simultaneous measurements (Franceschini et al., 2008). While EEG offers only an indirect measure of the cascade of neuronal events during neural activity, it is the only modality other than MEG that can be used to monitor neural activity non-invasively in humans, and facilitates the translation of results obtained in animals using the same techniques to human studies. Much effort over the past 30 years has focused on determining the relationship between somatosensory evoked potentials (SEP), local field potentials (LFP), and neural activity. Anatomical data from the sites of specific thalamic inputs (White, 1979; White and Hersch, 1982) and the projection patterns of pyramidal axons between cortical layers (Thomson and Bannister, 2003) have confirmed that activation of the primary somatosensory cortex (SI) starts with the thalamic input in layers IV and VI and is followed by activation in layers III and II and then layer V. Response latencies increase in a systematic fashion from middle to superficial to deep cortical layers (Simons, 1978). In addition, when synaptic activity reaches the superficial layers, it propagates horizontally with a large amount of synapses between layers I-III. Evoked potential responses across primary cortices in rats, primates and humans have a similar structure, consisting first of a large and narrow positive component, P1, followed within 10 ms by a large negative component, N1, and then by two slow components, P2 and N2, tens of ms after N1 (Allison et al., 1989; Arezzo et al., 1981; Di and Barth, 1991; Kulics and Cauller, 1986). Current source density (CSD) analysis of laminar profiles of LFP link P1 to the largest and earliest current sinks in layers IV and VI. P1 is the primary evoked potential directly originated from SI-specific thalamocortical inputs (Mitzdorf, 1985), and reflects the initial depolarization of layer II and V pyramidal cells. Following this initial depolarization, population spikes are generated in layer Vb infragranular cells. Axon-collaterals of layer Vb pyramidal cells produce an enhanced activation of the supragranular pyramidal cells in layer I–II, which generates the secondary evoked potential N1 (Agmon and Connors, 1991; Jellema et al., 2004; Kulics and Cauller, 1986). P2 and N2 arise from activation of cortico-cortical connections originating in the superficial layers of the central column (Kublik et al., 2001; Wrobel et al., 1998), and derive from a combination of both inhibitory and repolarization processes (Steriade, 1984). While the neural origin of P1 and N1 is well established, the inconsistent source-sink patterns and absence of multi-unit activity (MUA) at longer times makes the functional significance of P2 and N2 unclear (Kulics and Cauller, 1986).
While most invasive animal studies have attempted to correlate the hemodynamic responses to the primary evoked potential, we believe that a substantial contribution of the hemodynamic response is derived from secondary and late cortical transmission. In fact, in a previous study using the same measurement modalities (EEG and DOI) and parametric electrical forepaw stimulation (Franceschini et al., 2008), we have found that the primary SEP component (P1) exhibits a weaker correlation with the hemodynamic response than the secondary (N1) and late (P2) SEP components. Similarly in humans, using DOI and MEG during median nerve stimulation experiments, we have obtained better hemoglobin response predictions using late (>30 ms) neural components (Ou et al., 2009). Parametric stimulation alone does not produce enough differences in the SEP components to distinguish the individual contributions of N1 and P2. Here, we tested whether the pharmacological manipulation produced by the different anesthetics on the SEP is sufficient to disentangle individual contributions of the secondary and late components to the hemodynamic response.
Determining whether the hemodynamic response from the SEP is driven by secondary or late cortico-cortico transmission rather than by afferent inputs to layer IV would have a profound effect on the clinical role of BOLD fMRI and DOI. In fact, the presence of a hemodynamic response to a sensory stimulus itself would confirm the integrity of the sensory system to the level of the cortico-cortical responses and indicate that sensory information had arrived and was processed to the point that it could pass to other areas of the cortex. However, if the presence of a hemodynamic response only confirms the integrity of the system to the level of the thalamic inputs, the hemodynamic response would only confirm that sensory information had reached the cortex; it would provide no information as to the potential for further processing. Therefore, if the hemodynamic response is a marker not just of information arrival from non-cortical areas but of local information processing, the hemodynamic response can serve as a biomarker for the functional integrity of cortical regions.
As discussed above, anesthetics also act on baseline cerebral blood flow, cerebral blood volume (CBV) and vascular reactivity (Hyder et al., 2002; Maandag et al., 2007; Sibson et al., 1998; Sicard et al., 2003). To account for the resulting effects on neurovascular coupling, in our experiments, in addition to functional electrical and vascular responses, we measured baseline blood flow and response to a hypercapnia challenge with each anesthetic. These measures allow us to determine the influence of baseline blood flow on the neurovascular coupling.
Materials and Methods
Animal Preparation
Six groups of male Sprague Dawley rats (5-6 rats in each anesthetic group), a total of 33 animals (298 ± 18 g), were included in this study. During all surgical procedures the animals were anesthetized with isoflurane (2-2.5%) administered via a facemask in a gas mixture of 80% air and 20% oxygen. After tracheotomy and cannulation of the femoral artery and vein, animals were mounted on a stereotactic frame. Heating blankets maintained core temperature at 36.5-37.5°C. Six different anesthetics were used, in different animals, to maintain anesthesia during the functional experiments: alpha-chloralose (40 mg/kg/hr, intra-venous (i.v.)) (Devor et al., 2008), pentobarbital (25 mg/kg, intra-peritoneal (i.p.)) (Oria et al., 2008), ketamine-xylazine (20 mg/kg/hr – 2 mg/kg/hr, i.v.) (Oria et al., 2008), fentanyl-droperidol (90 ug/kg/hr-4.5 mg/kg/hr, i.v.) (Safo et al., 1985), isoflurane (1.2% gas) (Masamoto et al., 2007), and propofol (50 mg/kg/hr i.v.) (Oria et al., 2008). Anesthetic doses were chosen based on what is typically used during functional studies, maximizing functional responses, maintaining blood gasses within normal ranges, and ensuring that the animal was not alert enough to respond to a tail pinch. We waited at least 45 minutes before beginning the measurements, to allow anesthetic transition. During the measurements, animals were mechanically ventilated with 80% air and 20% O2. Continuous monitoring of arterial blood pressure (MBP), arterial oxygen saturation (SaO2) and heart rate, and blood sample recording of arterial pH, PaO2, and PaCO2 at the beginning, middle and end of the experiment, assured maintenance of basic physiological parameters. Table 1 shows the doses of anesthetics used and the systemic physiological parameters measured in each group. All procedures were approved by the Massachusetts General Hospital Subcommittee on Research Animal Care.
Table 1.
Animal's anesthesia and physiological variables.
| Alpha-Chloralose | Pentobarbital | Ketamine-Xylazine | Fentanyl-Droperidol | Isoflurane | Propofol | |
|---|---|---|---|---|---|---|
| # of animals | 6 | 5 | 5 | 6 | 5 | 6 |
| # of meas. included | 11 | 10 | 9 | 11 | 10 | 12 |
| Anesthesia type | i.v. | i.p. | i.v. | i.v. | gas % | i.v. |
| Anesthesia maintaining dose | 40 mg/kg/hr | 25 mg/kg | 20 mg/kg/hr-2 mg/kg/hr | 90 ug/kg/hr-4.5 mg/kg/hr | 1.2% | 50 mg/kg/hr |
| Weight (g) | 300±50 | 275±10 | 320±18 | 285±60 | 290±20 | 320±30 |
| pH | 7.33±0.05 | 7.37±0.03 | 7.37±0.07 | 7.46±0.3 | 7.43±0.04 | 7.36±0.04 |
| PaCO2 (mmHg) | 41±6 | 33±3 | 37±8 | 38±6 | 34±5 | 40±7 |
| PaO2 (mmHg) | 180±15 | 185±20 | 160±20 | 165±20 | 190±15 | 170±20 |
| Resp. Rate (br./min) | 43 | 41 | 40 | 55 | 42 | 40 |
| Heart Rate (Hz) | 5.7±0.3 | 6.2±0.4 | 4.6±0.1 | 7.7±0.3 | 6.2±0.3 | 5.7±0.1 |
| MBP (mmHg) | 96±6 | 115±7 | 110±7 | 107±10 | 99±7 | 125±5 |
# of animal is the number of animals measured for each anesthetic. # of measurements indicates the number of measurements included in the data analysis. For each animal we stimulated left and right sensory cortices alternately and in a few cases had to discard one side because of low SNR or no functional response, either SEP or hemodynamic. Pentobarbital was administrated via intra-peritoneal injections (i.p.) every 30-45 min, Isoflurane was administrated with the inspired mixture of 80% air and 20% oxygen and the other 4 anesthetics were infused i.v.. pH, PaCO2, and PaO2 are the averages across animals and all three measurements during the functional experiments.
Measurement protocol
In all animals we performed parametric forepaw electrical stimulation using train durations of 1, 3, 5, 7, 9, 11, 13 s (7 conditions). The stimuli were applied using hypodermic needles inserted into the left and right forepaws of the animals. The stimuli were delivered in trains of 200-μs pulses at a 3-Hz repetition rate. The amplitude of the stimuli was adjusted just above the motor threshold by increasing the stimulation current until forepaw movement was visible (stimulation current 1.3±0.3 mA, never below 1mA or above 2mA). The stimuli were presented pseudo-randomly with an average inter-stimulus interval (ISI) of 12 s (the ISI ranged from 2 to 20 s) between the trains. In each animal we alternated 12-minute runs between the left and right forepaw, for a total of 5 runs in each paw. In the data analysis, we treated the results of each paw independently. At the end of the functional experiments, we performed a 5% hypercapnia challenge in all animals, and measured baseline CBF to evaluate vascular reactivity under different anesthetics. The hypercapnia challenge consisted of 10 min of data acquisition with an inspired mixture of 20% O2 and 80% air, followed by 10 minutes of adding 5% CO2 to the inspired gas mixture.
Electrophysiological recordings
The EEG data were obtained using 9 channels in a 40-channel monopolar digital amplifier system (NuAmps, NeuroScan, USA). Four Ag/Agcl disk-type EEG electrodes (4-mm diameter, Warner Instruments, Hamden CT, USA) were used to record the neuronal activity and were placed around the optical probe under the animal skin as in (Franceschini et al., 2008). Five additional electrodes (8-mm diameter, Warner Instruments, Hamden CT, USA) were positioned using paste as follows: a ground electrode was positioned above the nose of the animal, a reference electrode on the neck, 2 ECG electrodes on the left and right sides of the torso, and an additional ground electrode more posterior in the torso. We verified that the impedance of the electrodes was smaller than 5KΩ and that the cross talk between the stimulation and recording systems did not affect the features calculated from the EEG signals. The EEG and ECG measurements were acquired at a sampling frequency of 1 kHz.
The EEG data were processed off-line using software designed in-house and implemented in the MATLAB environment (Mathworks Inc., Natick, MA). Specifically, for each animal, the EEG data from the electrode in the contralateral SI cortex was high-pass filtered at a -3dB cutoff frequency of 3.5 Hz. A notch filter was applied to suppress 60 Hz interference and the ECG signal was used to reduce the arterial pulsation with a linear regression model. For each duration condition we calculated the average SEP responses, averaging across stimuli in the same run and across all runs. We isolated the SEP components (P1, N1, P2, N2) (see Fig. 1b) by evaluating the zero crossings of the SEP signal. We then determined the integrated SEP responses (ΣSEP) for each condition by calculating the area under each component and summing the response areas to each stimulus in the train. Finally, for each anesthetic group, we averaged the SEP responses across animals without any normalization to preserve the amplitude of the responses with each anesthetic.
Fig. 1.


Time traces of SEP responses under different anesthetics. (a) Average train responses. (b) Average of all stimuli. For each anesthetic, here the average is calculated as the average of responses to all conditions and all rats. Error bars in Fig. 1b represent standard deviation.
Diffuse optical imaging
DOI is a noninvasive technique that has been used for more than a decade to measure brain activity in humans (Hoshi et al., 1993; Villringer et al., 1993). The technique quantifies local cortical hemodynamic changes spectroscopically by measuring light absorbance changes at different wavelengths, and has been validated extensively against fMRI (Huppert et al., 2006a; Huppert et al., 2006b; Kleinschmidt et al., 1996; Strangman et al., 2002; Toronov et al., 2001). For our animal experiments, we used a continuous-wave imaging system (CW4, TechEn Inc., Milford, MA), as described in (Franceschini et al., 2008; Siegel et al., 2003). In this system, 18 laser diodes (nine emitting light at 690 nm, and nine at 830 nm) are frequency-encoded and their signals acquired simultaneously by 16 parallel detectors. Each detector's output is digitized at 40 kHz. The individual source signals are filtered off-line using an infinite-impulse-response filter with a 20-Hz bandpass frequency, which allows for a 10-Hz acquisition rate per image. The optical probe is comprised of a 4×4 grid of 16 detectors interleaved with a 3×3 grid of 9 sources (with each source including a 690- and a 830-nm laser), and covers a flat region of the rat head extending 7.5 mm to either side of the midline, and from 4 mm anterior to 11 mm posterior of the Bregma.
Thirty-six source-detector pairs at a 3.5-mm separation (nearest neighbors) were considered for the data analysis. The optical probe was secured in contact with the head and supported by metal posts. The CW4 system used here is the same as we typically use in human experiments but the source-detector separations used in the animal experiments were 10 times smaller (Franceschini et al., 2008). Previously, we verified that the hemoglobin response measured with this system and probe in rats is co-localized and temporally equivalent to the BOLD response measured with fMRI (Culver et al., 2003b; Siegel et al., 2003).
As a pre-analysis, for each animal, the DOI raw data was band-pass filtered between 0.02 and 0.5 Hz. Oxy- and deoxy-hemoglobin concentrations (HbO and HbR, respectively) were calculated using the modified Beer-Lambert law (Delpy et al., 1988) without any path-length correction. To obtain the average hemodynamic response for the seven conditions, the data were deconvolved with the stimulation onsets. In each rat and on each side, we identified the source-detector pair with the most statistically significant oxy-hemoglobin activation in the contralateral SI cortex (p-value < 0.05) and used it for the further data analysis. For each animal and each condition we calculated the area under the curve of the hemoglobin responses (ΣHbO and ΣHbR), and for each anesthetic group we calculated the grand average of ΣHbO and ΣHbR responses across animals without applying any normalization, as with the SEP responses.
Diffuse correlation spectroscopy
To measure baseline cerebral blood flow non-invasively through the scalp, at the end of the functional experiment and during the hypercapnia challenge, we used a relatively new optical technique: diffuse correlation spectroscopy (DCS) (Boas et al., 1995; Cheung et al., 2001). The instrument we used in our experiments is similar to the system developed by Dr. Arjun Yodh at the University of Pennsylvania (Durduran et al., 2004b) and tested in several animal (Cheung et al., 2001; Culver et al., 2003a; Durduran et al., 2004a; Zhou et al., 2009) and human experiments (Durduran et al., 2004b; Durduran et al., 2009). Our DCS system employs a solid-state long coherence length laser (785 nm, ∼70 mW of power) to illuminate the surface of the head and four photon-counting avalanche photodiodes connected to four single-mode optical fibers to collect the diffusely reflected light (Roche-Labarbe et al., 2009). The intensity auto-correlation function of each channel is computed by a digital correlator. We co-localized the source and four detector DCS fibers with the DOI fibers in the left SI. This four-channel system acquires data at 2Hz and the blood flow index (BFi) is obtained off-line by fitting the measured electric field autocorrelation functions with a model of dynamic light scattering in deep tissues (Cheung et al., 2001). In a human study we have demonstrated that the blood flow index is proportional to CBF as measured with Doppler ultrasound and can be compared across subjects (Roche-Labarbe et al., 2009).
Neurovascular coupling data analysis
We estimated linear regression models for predicting the area under the curve of the hemoglobin responses (ΣHbO and ΣHbR, average across animals for each anesthetic and each condition), given measured components of the neural responses (ΣSEP, average across animals for each anesthetic and each condition). Our linear regression model allows for the possibility of considering any number of the components of the neural response, as well as the interaction with baseline blood flow. It assumes that the vascular response is related to the components of the neural response by:
where Hb indicate either HbO or HbR, the index i is the number of included SEP components, BF is the baseline blood flow index (average across animals), and hHbi and hBF,Hbi are the regression coefficients for the ith component. The regression coefficients are estimated simultaneously for all stimulus conditions and all anesthetics. The goodness-of-fit was estimated by calculating the correlation coefficient, R, the coefficient of determination, R2, and to control for the degrees of freedom we also calculated the F-test statistic as:
where k is the number of parameters and n is the number of measurements. Statistical significance of predictions using less regressors with respect to predictions using all regressors were calculated using the F cumulative distribution function (p-value <0.05).
Results
Baseline CBF and CBF changes during hypercapnia for different anesthetics
As part of the protocol, we measured cerebral blood flow using the DCS system to evaluate the effects of the different anesthetics on the baseline vascular state, as well as the possible effects of different baseline vascular states on neurovascular coupling. As expected, isoflurane provided the largest baseline BFi, and ketamine-xylazine the lowest because of the action of xylazine on systemic blood flow (see Table 2). In all rats, in addition to baseline BFi, we measured BFi changes during hypercapnia at the end of the functional experiments, and evaluated CO2 reactivity (% change in BFi / ΔPaCO2) under different anesthetics to ensure vascular reactivity is preserved and as expected CO2 reactivity was lower for intravenous anesthetics and larger for volatile anesthetics (Eng et al., 1992; Smith and Wollman, 1972). We observed increases in BFi in response to hypercapnia with all of the anesthetics, with the largest CO2-induced BFi changes measured under isoflurane and the smallest under ketamine-xylazine and propofol (see Table 2). The enhanced CO2 reactivity under isoflurane is in agreement with previous studies (Drummond and Todd, 1985; Young et al., 1991).
Table 2.
Baseline blood flow and changes with hypercapnia.
| Alpha-Chloralose | Pentobarbital | Ketamine-Xylazine | Fentanyl-Droperidol | Isoflurane | Propofol | |
|---|---|---|---|---|---|---|
| BFi (au) | 1.9±0.3 | 1.1±0.2 | 0.7±0.1 | 1.7±0.2 | 2.4±0.2 | 1.9±0.4 |
| % BFi change 5% CO2 | 8 | 22 | 6 | 16 | 33 | 7 |
| %BFi/ΔPaCO2 (%/mmHg) | 0.7 | 1.8 | 0.5 | 0.9 | 7 | 0.6 |
For each anesthetic, grand average (±standard error) of blood flow index measured with the DCS system at the beginning, middle and the end of the functional measurements in all rats, blood flow changes with hypercapnia, and %BFi/ΔPaCO2 ratio with hypercapnia.
SEP and hemodynamic responses with different anesthetics
Figure 1 shows the average SEP responses for each anesthetic. In Fig. 1a we show the average train responses. Responses under isoflurane show long-term habituation, with responses to initial stimuli being much larger than responses to later stimuli in the train. Responses under alpha-chloralose show inter-stimuli habituation, with smaller responses for every other stimulus in the train. Fig. 1b shows the SEP response for all the stimuli averaged together. Differences between the amplitudes and latencies of the responses for the various SEP components are evident. For instance, the SEP responses under pentobarbital and propofol show a large P1 but very small N1 and P2. Responses under alpha-chloralose show the largest P1 and delayed N1 and P2 components with respect to the other anesthetics. Under ketamine-xylazine and fentanyl-droperidol, the SEP responses show a small P1 and a very pronounced P2 and in addition, these are the only anesthetics that show a pronounced N2 component. In a different group of animals (not reported here), we observed that with anesthetic dose within a 30-40% range of what is used here, the N2 component was always present with ketamine-xylazine and fentanyl-droperidol and never present with pentobarbital and propofol. For concentrations of isoflurane <1% and alpha-chloralose <30 mg/kg/hr we observed a small N2 component, but for such low doses animals were starting to respond to tail pinch. For higher doses of isoflurane or alpha-chloralose, N2 was negligible.
Similar differences in the amplitudes and latencies of the SEP components with anesthetics have been previously reported, and are due to the differences in action of the various anesthetics on neural conduction and synaptic transmission (Sloan, 1998).
The hemodynamic responses also differed across anesthetics (see Fig. 2). The largest HbO (right panel) and HbR (left panel) responses were observed under alpha-chloralose and isoflurane anesthesia; the smallest, under pentobarbital and propofol. Stronger habituation with train duration was observed under ketamine-xylazine and fentanyl-droperidol.
Fig. 2.

Time traces of ΔHbO (left panels) and ΔHbR (right panels) responses under different anesthetics. For each anesthetic, the average is calculated as the average of responses to all rats. Different colors and/or symbols represent different conditions. Error bars indicate standard error.
SEP responses (ΣSEP) vs. stimulus train duration were all fairly linear with R2>0.90 in the cases of P1 for ketamine-xylazine (R2=0.82) and P2 for pentobarbital and propofol (R2 0.86 and 0.82, respectively). Oxy- and deoxy-hemoglobin responses (ΣHbO and ΣHbR) vs. train duration had R2 <0.90 for ketamine-xylazine (R2 0.83 and 0.85), fentanyl-droperidol (R2 0.84 and 0.78), and propofol (R2 0.72 and 0.88).
SEP and DOI coupling
Figure 3 shows the scatter-plots between HbR and SEP responses to the 7 conditions for the 6 anesthetics (figures for HbO vs. SEP are very similar and are shown in the online supplemental material). By performing a linear regression analysis we evaluated how well each of the SEP component predicts the hemodynamic response independently for each anesthetic. The resulting correlation coefficients (R), the F test statistics, and the regression coefficients for HbR are reported in Table 3 (results for HbO are reported in an online supplemental Table). As expected, based on our previous work (Franceschini et al., 2008), by changing stimulus train duration, even if P1 has a slightly higher correlation coefficient on average (but a lower F), we did not find any statistically significant difference between the R or the F of the three SEP components across anesthetics (paired T test analysis, p-values>0.13). Also by performing the analysis on single animals, we verified that there is no statistically significant differences on predictions of single SEP components when considering animals from single anesthetic groups (paired T test analysis, p-values>0.05). This is because the hemodynamic and SEP responses are all quite linear with respect to stimulus train duration. By looking at the scatter-plots in Fig. 3, and at the regression coefficients in Table 3, we observed that hemoglobin changes vs. ΣP1 responses are quite scattered and have very different regression coefficients for different anesthetics, and that ΣHbR vs. ΣN1 and ΣP2 responses for the four GABAergic anesthetics (alpha-chloralose, isoflurane, pentobarbital and propofol) are grouped together and have very similar regression coefficients, while they deviate for ketamine-xylazine and fentanyl-droperidol. Interestingly, the two anesthetics with deviant responses exhibit a strong N2 component. In these cases by using both P2 and N2 as regressors, the regression coefficients for P2 (last column in table 3) are closer to the P2 from the GABAergic drugs.
Fig. 3.
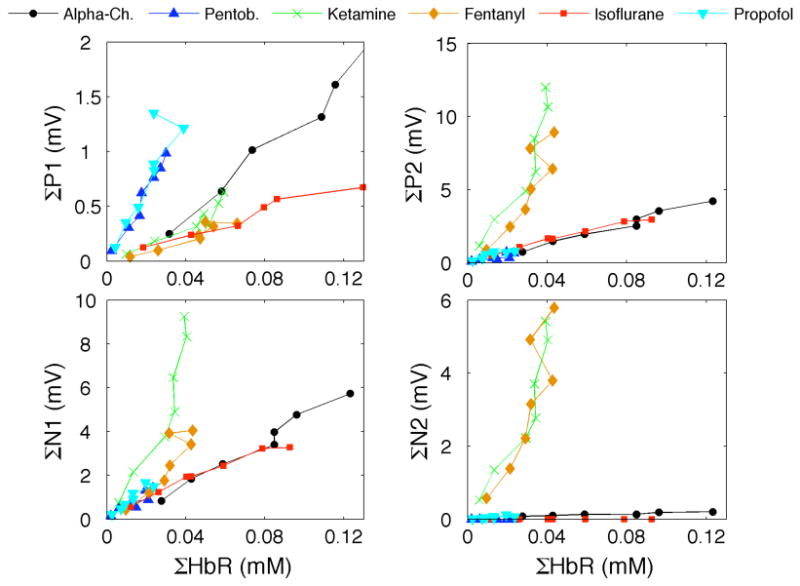
Scatter plot of ΣHbR vs. ΣSEP components for the 7 conditions (different points) and 6 anesthetics (different curves).
Table 3.
Correlation coefficients R, F test statistics and regression coefficients hHbR (10-7) of P1, N1, and P2 to predict HbR for each anesthetic and for combined anesthetics.
| R | F | hHbR | ||||||||
|---|---|---|---|---|---|---|---|---|---|---|
| HbR vs. | P1 | N1 | P2 | P1 | N1 | P2 | P1 | N1 | P2 | (P2,N2) |
| Alpha-Chloralose | 0.98 | 0.99 | 0.99 | 99 | 225 | 190 | 0.55 | 0.22 | 0.29 | |
| Pentobarbital | 0.95 | 0.90 | 0.80 | 45 | 20 | 9 | 0.25 | 0.17 | 0.36 | |
| Ketamine-Xylazine | 0.94 | 0.92 | 0.92 | 35 | 29 | 26 | 0.76 | 0.05 | 0.04 | (.09,-0.10) |
| Fentanyl | 0.90 | 0.89 | 0.89 | 21 | 19 | 18 | 1.22 | 0.11 | 0.05 | (.30,-0.39) |
| Isoflurane | 0.98 | 0.98 | 0.99 | 116 | 156 | 235 | 1.11 | 0.25 | 0.28 | |
| Propofol | 0.96 | 0.95 | 0.87 | 56 | 45 | 15 | 0.17 | 0.13 | 0.24 | |
| Regression all Anesthetics Combined | 0.69 | 0.56 | 0.32 | 37 | 18 | 4 | 0.50 | 0.11 | 0.07 | (.25,-0.38) |
| Regression GABAergic Anesthetics Combined | 0.71 | 0.97 | 0.99 | 26 | 498 | 1026 | 0.48 | 0.22 | 0.29 | |
We do not report results for N2 in this table because N2 is 0 for four of the six anesthetics. Last column report P2 and N2 regression coefficients when both P2 and N2 are used as regressors. Results for HbO are similar and shown in the online supplemental material.
In Table 3 we also report results of the linear regression analysis when combining all anesthetics together, or combining only the four GABAergic anesthetics. Correlation coefficients and F are low for any SEP component when we consider all anesthetics combined, as expected based on Fig. 3, and very good for P2 and N1 when we consider only the GABAergic drugs.
Since none of the SEP components alone can predict the hemodynamic responses of all anesthetics combined, we consider the effect of multiple SEP components and their interaction with baseline cerebral blood flow, which as shown in Table 2 changes with anesthetics. Table 4 reports the results of the linear regression analysis fitting all anesthetics simultaneously for all possible combinations of SEP components with or without baseline CBF interaction. Without CBF interaction, the largest R and F were obtained using all of the SEP components as regressors (Table 4 last row). This prediction using all of the SEP components was statistically significantly better than those using any other combination of SEP components except for the combination P2-N2.
Table 4.
Result of F test statistics and correlation coefficients for hemoglobin predictions
| All anesthetics | HbO fit | HbR fit | ||||||
|---|---|---|---|---|---|---|---|---|
| F | R | F | R | |||||
| no BF | BF | no BF | BF | no BF | BF | no BF | BF | |
| P1 | 28 | 17 | 0.64 | 0.69 | 37 | 21 | 0.69 | 0.72 |
| N1 | 19 | 193 | 0.57 | 0.95 | 18 | 148 | 0.56 | 0.94 |
| P2 | 5 | 14 | 0.33 | 0.65 | 4 | 12 | 0.32 | 0.62 |
| P1 N1 | 25 | 97 | 0.75 | 0.95 | 31 | 90 | 0.78 | 0.95 |
| P1 P2 | 22 | 27 | 0.73 | 0.86 | 28 | 29 | 0.77 | 0.87 |
| P1 N2 | 16 | 15 | 0.67 | 0.79 | 21 | 17 | 0.72 | 0.80 |
| N1 P2 | 19 | 152 | 0.70 | 0.97 | 20 | 144 | 0.71 | 0.97 |
| N1 N2 | 25 | 180 | 0.75 | 0.97 | 26 | 156 | 0.75 | 0.97 |
| P2 N2 | 39 | 309 | 0.82 | 0.98 | 37 | 239 | 0.81 | 0.98 |
| P1 N1 P2 | 16 | 147 | 0.75 | 0.98 | 20 | 109 | 0.79 | 0.97 |
| P1 N1 N2 | 19 | 166 | 0.77 | 0.98 | 23 | 132 | 0.81 | 0.98 |
| P1 P2 N2 | 32 | 219 | 0.84 | 0.98 | 36 | 160 | 0.86 | 0.98 |
| N1 P2 N2 | 32 | 203 | 0.85 | 0.98 | 26 | 156 | 0.82 | 0.98 |
| P1 N1 P2 N2 | 177 | 175 | 0.97 | 0.99 | 122 | 114 | 0.96 | 0.98 |
F test statistics and R of HbO and HbR predictions.
By considering the interaction between baseline blood flow and SEP, we were able to better predict the hemodynamic responses for all anesthetics (in general, higher R and F values than without the baseline CBF interaction terms), and the best predictions were obtained with P2-N2. Figure 4 shows the predictions of ΣHbR vs. measured ΣHbR for some of the possible SEP combinations with baseline CBF interactions (figures of predictions without baseline CBF interaction are reported in the on-line supplemental material). Interesting results from Table 4 are as follows: Predictions using P1 and P2 alone or combined did not improve by adding the blood flow interaction. Instead, predictions using N1 alone substantially improved by adding the interaction with blood flow. Including additional regressors did not improve the F test statistic for N1, and only slightly increased the correlation coefficients. The use of all regressors (P1, N1, P2, N2 and CBF interaction) did not produce statistically better predictions (p-value>0.05) than P2-N2 and N1-P2-N2 without CBF interaction and P2-N2, P1-N1-P2, P1-N1-N2, P1-P2-N2 and N1-P2-N2 with CBF interaction.
Fig. 4.
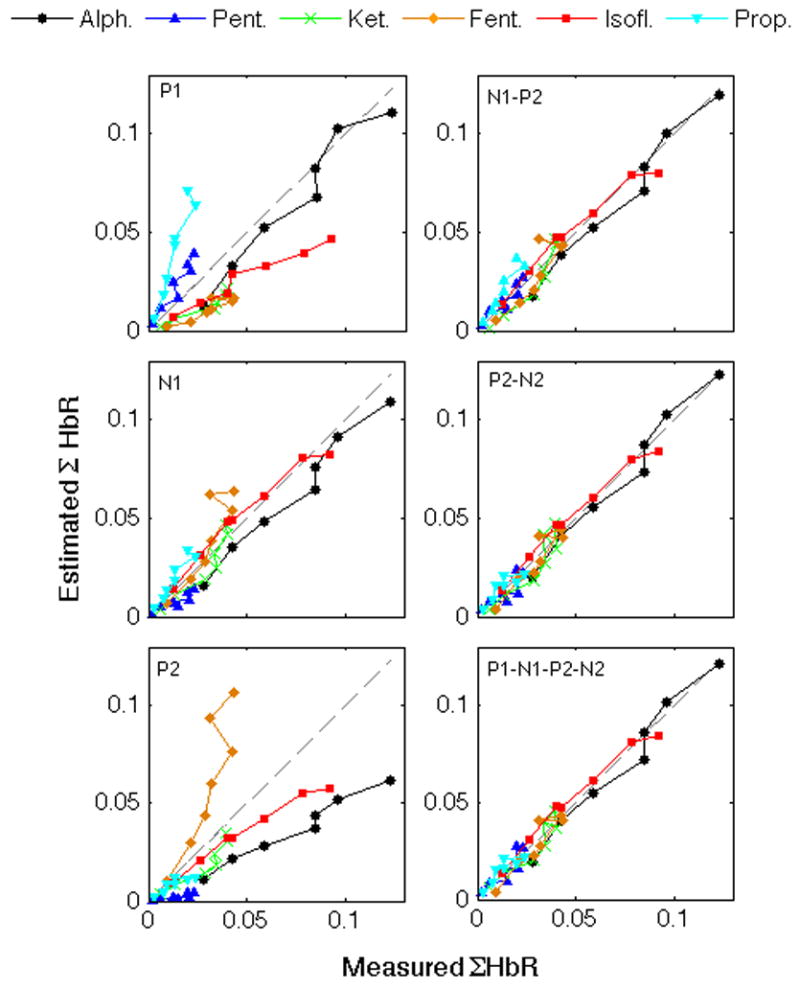
Measured and predicted ΣHbR using as regressors different SEP components and baseline blood flow interaction and fitting for all anesthetic simultaneously. Results for ΣHbO predictions are very similar and a corresponding Figure is reported in the online supplemental material.
Discussion and Conclusions
These results suggest that the hemodynamic response is not solely driven by thalamic afferent inputs (P1) but it is largely controlled by secondary and late cortical transmission and influenced by baseline blood flow. In fact, when using a linear regression model, the coupling between the thalamic afferent component P1 and the hemodynamic responses changes across anesthetics. In order to maintain the same neurovascular coupling relationship across different anesthetics we need to add secondary and late SEP components and their interaction with baseline CBF. In particular, the late SEP components P2-N2 alone (plus CBF interaction) are sufficient to predict the hemodynamic responses of all anesthetics simultaneously.
For any single anesthetic used, by changing stimulus train duration, predictions of the hemodynamic responses are good using any SEP component (Table 3). This is because all SEP components and hemodynamic responses increase linearly when varying stimulus train duration and there is insufficient variation to reach statistically significant differences, as we showed in (Franceschini et al., 2008). It is important to notice that by limiting the analysis to single SEP components, the regression coefficients change considerably across anesthetics (differences from 45% for N1, to 60% for P1). This result is consistent with previous studies using LFP and invasive microscopic imaging techniques. Huttunen et al. (Huttunen et al., 2008), during electrical forepaw stimulation at different frequencies, found linear relationships (R2 ∼ 0.85-0.87) between LFP and BOLD under alpha-chloralose and urethane anesthesia, but very different regression coefficients. Martin et al. (Martin et al., 2006) compared LFP and hemoglobin responses in awake and urethane-anesthetized rats over a large range of forepaw stimulation frequencies. While limiting the discussion to the principal LFP component, they found a very different coupling relationship between awake and anesthetize animals.
For the four GABAergic anesthetics, hemoglobin predictions using P2 have the same coupling relationship (P2 regression coefficients =0.42±0.04×10⁻⁷ for HbO and =0.29±0.05×10⁻⁷ for HbR) while P1 regression coefficients are very different (>60%). Ketamine-xylazine and fentanyl-droperidol have an additional SEP component N2 which is missing, or negligible, with GABAergic drugs within the concentrations used in this study. By combining N2 and P2 in the regression analysis, we obtain the same P2 regression coefficients (within a 35% range) for each of the 6 anesthetics. N1, P2 and N2 are generated by excitatory and inhibitory cortical events (Cauller and Kulics, 1991; Steriade, 1984) and the couple P2-N2 in particular describe cortico-cortical transmissions and thus it makes sense to consider them together. Several electrophysiology studies have shown that cortical transmissions are modulated by anesthetic agents more than the thalamic input (Adrian, 1941; Arezzo et al., 1981; Cauller and Kulics, 1988). The fact that P2 for different GABAergic agents has the same regression coefficient, and again the same coefficient when we add N2 as a regressor to predict hemoglobin responses under fentanyl-droperidol, suggests to us that its contribution, and the contribution of cortico-cortical transmission in general, should be considered when studying neurovascular coupling.
A more rigorous analysis is performed by combining all anesthetic agents together and testing for all possible combinations of SEP components with or without baseline blood flow interaction. We used the F-test statistic to take into account the different degrees of freedom when different numbers of regressors are used in the linear regression analysis to predict hemoglobin responses. Using all regressors (P1, N1, P2 and N2 with baseline CBF interaction) did not give statistically significant better predictions of hemoglobin responses than using P2-N2 (either with or without CBF interaction). The best F test statistic and R were obtained using P2-N2 and CBF interactions, confirming the above observation of the predominant involvement of P2-N2 in the hemodynamic response.
While alpha-chloralose and isoflurane produce the largest hemodynamic responses, we verified that they do not solely drive our results. In fact by excluding either one or both of those anesthetics from the combined analysis, P2-N2 still produces better hemoglobin predictions than P1 and N1.
These results suggest that the hemodynamic response is primarily driven by cortico-cortical transmissions and not by thalamic inputs in layer IV. This finding is in agreement with our previous results using parametric stimulation (Franceschini et al., 2008), but in contrast with the common belief that functional hyperemia is driven by the thalamic afferents' activity in layer IV. A retrograde vasodilation mechanism (Iadecola et al., 1997) controlled by layer IV thalamic afferent synaptic activity is necessary to support this common belief, since pial arteries regulate the local increase of blood flow into downstream branches (Iadecola, 2004). If the hemodynamic response is driven by synaptic activity in general, as our data suggest, and not just by the primary synaptic activity in layer IV, then synaptic activity in more superficial layers will initiate superficial vascular responses before any retrograde contribution from layer IV (∼100-400 ms delay vs. ∼1s delay to propagate ∼600 micron (Iadecola et al., 1997)). With diffuse optical imaging, while we detect hemodynamic changes in both superficial and deeper cortical layers with good temporal resolution, we do not have the spatial resolution to differentiate between cortical layers and cannot determine the origin of the hemodynamic responses. Several groups have tried to resolve laminar differences in the onset of the hemodynamic responses. Using high-resolution fMRI in rats, Silva and Koretsky (Silva and Koretsky, 2002) found BOLD signal onset starting in layer IV 0.5 sec before starting in layers II and III. Jin and Kim (Jin and Kim, 2008), in a recent fMRI study of the cat visual cortex, found that cerebral blood volume response (CBV) in superficial cortical layers has a faster time to peak than CBV in middle cortical layers, suggesting that arterial volume increase in the surface of the cortex precedes dilation of microvessels in deeper cortical layers. Using Laser Doppler and electrical stimulation of the trigeminal nerve of rats, Norup Nielsen and Lauritzen (Norup Nielsen and Lauritzen, 2001) found earlier CBF onset times in superficial layers than in layer IV. Recently, using optical coherence tomography (OCT) to measure blood volume changes in the rat forepaw cortex, Chen et al. (Chen et al., 2008) found constant signal onsets for cortical depths between 200-600 micron (layers II-IV), but significantly earlier with respect to the brain surface. The observation of no onset delays from depths of 200 to 600 micron supports the role of secondary and late synaptic activity in initiating vasodilation. We believe that technological advances of techniques such as OCT and two-photon microscopy may soon allow researchers to resolve the issue.
A few other papers indirectly support our finding that the hemodynamic response is driven by cortico-cortical transmissions and not by thalamic inputs. Anna Devor (Devor et al., 2005) has shown that the hemodynamic response in one cortical column cannot be explained solely by the neuronal activity in that column; rather, neuronal activity in the neighboring columns needs to be included. In the cerebellum, Mathiesen et al. (Mathiesen et al., 1998) have shown that the hemodynamic response is mostly sensitive to the level of synaptic activity. If functional hyperemia is controlled by the amount of synaptic activity, the larger number of activated synapses occurs not during the layer IV volley, but from the later cortico-cortical transmissions (Szentagothai, 1978).
Still, we do not rule out a smaller contribution of P1 to the hemodynamic response. In our measurements we observe that, during pentobarbital or propofol anesthesia, there is a large P1 response and smaller N1 and P2 responses. Yet we do observe a small change in the hemodynamic signals. This small hemodynamic response under pentobarbital and propofol may be driven by P1. Correlation coefficients between ΣSEP and ΣHb under these two anesthetics are higher for P1 than for N1 and P2 when we average all animals in the same anesthetic group together (Table 3). By carrying the analysis to single rats and single anesthetics under pentobarbital or propofol, the correlation coefficients of P1 are not statistically better than the ones of N1 or P2 (p-values>0.05). To isolate and evaluate the P1 contribution to the hemodynamic response, either more invasive methods with better SNR than DOI or EEG or perturbations that exclusively target one SEP component at a time need to be used. For example, by using topical drug application like MK801 (Hoffmeyer et al., 2007), one may be able to reduce secondary activity without affecting thalamic afferent inputs and estimate individual contributions to the hemodynamic response.
While our results, when fitting for all anesthetics combined, show that P1 does not correlate as well as the subsequent SEP components with the hemodynamic response, we are cautious in disentangling the roles of N1 and P2-N2 in the hemodynamic response. In general, P2-N2 better predicted the hemoglobin responses than N1 (note that using all regressors is statistically significantly better than using only N1 while using all regressors is not significantly better than using only P2-N2). However, the fact that P2 strongly covaries with N1 (Kulics, 1982; Wrobel et al., 1998) suggests a close relationship between N1 and P2-N2. This issue needs to be further investigated.
In these experiments, we modulated the stimulation by changing only the stimulus train duration and examined the variation in six groups of animals using six different anesthetics. Previously (Franceschini et al., 2008) using alpha-chloralose anesthesia and changing stimulus frequency or amplitude, we found that N1 and P2 better predicted the hemodynamic response than P1, by changing stimulus train duration we did not find statistically significant differences between the three SEP components. In part, we wanted to test if this negative result held across six individual anesthetics. While confirming this negative result, we did observe that the variation across anesthetics provided predictive power. It is possible that our results are specific to the duration stimulation paradigm. Experiments across anesthetics, by changing frequency, or amplitude of forepaw electrical stimulation, or stimulation of whisker or visual cortex need to be carried out before making our results more general.
We found that baseline cerebral blood flow has a significant interaction with neurovascular coupling. Specifically, adding baseline BFi to the SEP regressors substantially improves hemodynamic predictions (increased F and R values). The positive interaction between SEP and baseline cerebral blood flow indicates that, under a condition of constant neural activity, a higher baseline blood flow correlates with a higher hemodynamic evoked response (ΔHb). Apparently in contrast, Sicard et al. (Sicard and Duong, 2005) have shown that modulating baseline blood flow by changing inspired O2 or CO2 does not change the absolute magnitude of evoked hemoglobin changes (ΔBOLD and ΔCBF), but does decrease the relative changes. In Sicard et al. (Sicard and Duong, 2005), neural activity under different gas concentration was not measured, but assumed constant. This assumption may not be valid, since as shown by Jones et al. (Jones et al., 2005) neural activity is affected by hypercapnia. In their experiments they found that while increasing inspired CO2 increased baseline blood flow, it decreased neural activity and evoked hemoglobin responses. Reduction of neural activity with moderate hypercapnia has also been shown in nonhuman primates (Zappe et al., 2008). Sicard et al.'s (Sicard and Duong, 2005) finding of constant evoked hemodynamic changes for different baseline blood flow may be masked by changes of neural activity with CO2.
As expected, of the six anesthetics used, alpha-chloralose produced the largest hemodynamic responses. Hemodynamic responses under Isoflurane, at the concentration used here (∼1.2%), were only slightly smaller than responses under alpha-chloralose. This is because, at these concentrations of isoflurane, baseline CBF and CBV are not strongly affected. At higher concentrations (>1.6%), isoflurane becomes a strong vasodilator (Eger, 1984) and by either preventing further vasodilation or by saturating cortical tissue with oxygen it may reduce hemodynamic changes in response to stimulation.
We measured only small functional hemoglobin changes in animals under pentobarbital and propofol. Pentobarbital was previously used in a study by Ueki et al. (Ueki et al., 1992) and its effect on neural and metabolic activity was compared to that of alpha-chloralose and two other anesthetics. Similar to our findings, while they measured principal evoked responses under both pentobarbital and alpha-chloralose, they found an increase in the metabolic rate of glucose under alpha-chloralose anesthesia, but not under pentobarbital anesthesia. Our hemoglobin responses with pentobarbital are small but not zero. The difference may be due to the fact that they used a higher dose of pentobarbital than we did. In general, differences in dose of anesthetics used makes it difficult to compare hemodynamic responses reported in the literature, since hemodynamic responses (as well as electrical responses) depend on the amount of anesthesia used (Dueck et al., 2005; Purdon et al., 2009). The advantage of our approach is that we compare the electrical and vascular responses simultaneously and measure their correlation, which, within limits, should not be affected by anesthetic dosages.
The N2 SEP component was measured only with ketamine-xylazine and fentanyl-droperidol, and was not present with GABAergic anesthetics. In the regression model, the N2 contribution to the hemodynamic response was always negative (see Table 3 last column), suggesting a vasoconstrictive role for this component. More measurements are needed to link N2 activity (likely related to inhibitory interneurons since it disappears with GABAergic anesthetics) with vasoconstriction.
We used scalp electroencephalography (EEG) and diffuse optical imaging (DOI) as functional imaging techniques. These two modalities have poor spatial resolution and are sensitive to large tissue volumes and multiple cortical layers. The inferior spatial resolution with respect to invasive microscopic studies may be a disadvantage of our method, and parallel invasive studies need to be performed. But there are important advantages that justify our study. NIRS and scalp EEG allow for non-invasive measurements and can be directly translated to human studies (Mackert et al., 2008; Obrig and Villringer, 2003; Ou et al., 2009; Shibasaki, 2008). We believe that controlled animal studies with the same methodologies that are applicable in humans are necessary precursors to neurovascular studies in humans. Also, several invasive neurovascular coupling studies have suggested that the uncoupling between hemodynamic responses and electrophysiology may be an artifact arising from the limited field of view of microelectrodes with respect to the more extensive field of view of standard microscopic hemodynamic measures (Devor et al., 2005; Ureshi et al., 2005). We believe that experiments with both macroscopic and microscopic methodologies should be carried out to better understand neurovascular coupling.
Neural input affects secondary and late activity and different anesthetics differently affect neural input and secondary-late activity. With these experiments we found that the hemodynamic response better correlates with secondary-late activity than with the neural input. In conclusion, these results indicate that the magnitude of the hemodynamic response is proportional to the secondary and late SEP components, that baseline blood flow positively affects hemodynamic evoked responses, and that neurovascular coupling is constant across anesthetics. The cause of the effect of different anesthetics on the late SEP requires further investigation.
Supplementary Material
Acknowledgments
We would like to thank Anna Devor, Ellen Grant and John Marota for valuable discussions and Gary Boas for careful editing of the manuscript. This research is supported by the US National Institutes of Health (NIH) grants R01-EB001954 and R01-EB006385.
Footnotes
Publisher's Disclaimer: This is a PDF file of an unedited manuscript that has been accepted for publication. As a service to our customers we are providing this early version of the manuscript. The manuscript will undergo copyediting, typesetting, and review of the resulting proof before it is published in its final citable form. Please note that during the production process errors may be discovered which could affect the content, and all legal disclaimers that apply to the journal pertain.
References
- Adrian ED. Afferent discharges to the cerebral cortex from peripheral sense organs. J Physiol. 1941;100:159–191. doi: 10.1113/jphysiol.1941.sp003932. [DOI] [PMC free article] [PubMed] [Google Scholar]
- Agmon A, Connors BW. Thalamocortical responses of mouse somatosensory (barrel) cortex in vitro. Neuroscience. 1991;41:365–379. doi: 10.1016/0306-4522(91)90333-j. [DOI] [PubMed] [Google Scholar]
- Allison T, McCarthy G, Wood CC, Williamson PD, Spencer DD. Human cortical potentials evoked by stimulation of the median nerve. II. Cytoarchitectonic areas generating long-latency activity. J Neurophysiol. 1989;62:711–722. doi: 10.1152/jn.1989.62.3.711. [DOI] [PubMed] [Google Scholar]
- Antognini JF, Bravo E, Atherley R, Carstens E. Propofol, more than halothane, depresses electroencephalographic activation resulting from electrical stimulation in reticular formation. Acta Anaesthesiol Scand. 2006;50:993–998. doi: 10.1111/j.1399-6576.2006.01114.x. [DOI] [PubMed] [Google Scholar]
- Antunes LM, Golledge HD, Roughan JV, Flecknell PA. Comparison of electroencephalogram activity and auditory evoked responses during isoflurane and halothane anaesthesia in the rat. Vet Anaesth Analg. 2003a;30:15–23. doi: 10.1046/j.1467-2995.2003.00085.x. [DOI] [PubMed] [Google Scholar]
- Antunes LM, Roughan JV, Flecknell PA. Effects of different propofol infusion rates on EEG activity and AEP responses in rats. J Vet Pharmacol Ther. 2003b;26:369–376. doi: 10.1046/j.1365-2885.2003.00499.x. [DOI] [PubMed] [Google Scholar]
- Arezzo JC, Vaughan HG, Jr, Legatt AD. Topography and intracranial sources of somatosensory evoked potentials in the monkey. II. Cortical components. Electroencephalogr Clin Neurophysiol. 1981;51:1–18. doi: 10.1016/0013-4694(81)91505-4. [DOI] [PubMed] [Google Scholar]
- Austin VC, Blamire AM, Allers KA, Sharp T, Styles P, Matthews PM, Sibson NR. Confounding effects of anesthesia on functional activation in rodent brain: a study of halothane and alpha-chloralose anesthesia. NeuroImage. 2005;24:92–100. doi: 10.1016/j.neuroimage.2004.08.011. [DOI] [PubMed] [Google Scholar]
- Bandettini P. Functional MRI today. Int J Psychophysiol. 2007;63:138–145. doi: 10.1016/j.ijpsycho.2006.03.016. [DOI] [PubMed] [Google Scholar]
- Belelli D, Pistis M, Peters JA, Lambert JJ. General anaesthetic action at transmitter-gated inhibitory amino acid receptors. Trends Pharmacol Sci. 1999;20:496–502. doi: 10.1016/s0165-6147(99)01405-4. [DOI] [PubMed] [Google Scholar]
- Berwick J, Johnston D, Jones M, Martindale J, Martin C, Kennerley AJ, Redgrave P, Mayhew JE. Fine detail of neurovascular coupling revealed by spatiotemporal analysis of the hemodynamic response to single whisker stimulation in rat barrel cortex. J Neurophysiol. 2008;99:787–798. doi: 10.1152/jn.00658.2007. [DOI] [PMC free article] [PubMed] [Google Scholar]
- Bissonnette B, Swan H, Ravussin P, Un V. Neuroleptanesthesia: current status. Can J Anaesth. 1999;46:154–168. doi: 10.1007/BF03012550. [DOI] [PubMed] [Google Scholar]
- Boas DA, Campbell LE, Yodh AG. Scattering and Imaging with Diffusing Temporal Field Correlations. Phys Rev Lett. 1995;75:1855–1858. doi: 10.1103/PhysRevLett.75.1855. [DOI] [PubMed] [Google Scholar]
- Carlsson C, Smith DS, Keykhah MM, Englebach I, Harp JR. The effects of high-dose fentanyl on cerebral circulation and metabolism in rats. Anesthesiology. 1982;57:375–380. doi: 10.1097/00000542-198211000-00005. [DOI] [PubMed] [Google Scholar]
- Cauller LJ, Kulics AT. A comparison of awake and sleeping cortical states by analysis of the somatosensory-evoked response of postcentral area 1 in rhesus monkey. Exp Brain Res. 1988;72:584–592. doi: 10.1007/BF00250603. [DOI] [PubMed] [Google Scholar]
- Cauller LJ, Kulics AT. The neural basis of the behaviorally relevant N1 component of the somatosensory-evoked potential in SI cortex of awake monkeys: evidence that backward cortical projections signal conscious touch sensation. Exp Brain Res. 1991;84:607–619. doi: 10.1007/BF00230973. [DOI] [PubMed] [Google Scholar]
- Cenic A, Craen RA, Howard-Lech VL, Lee TY, Gelb AW. Cerebral blood volume and blood flow at varying arterial carbon dioxide tension levels in rabbits during propofol anesthesia. Anesth Analg. 2000;90:1376–1383. doi: 10.1097/00000539-200006000-00021. [DOI] [PubMed] [Google Scholar]
- Chen Y, Aguirre AD, Ruvinskaya L, Devor A, Boas DA, Fujimoto JG. Optical coherence tomography (OCT) reveals depth-resolved dynamics during functional brain activation. J Neurosci Methods. 2008 doi: 10.1016/j.jneumeth.2008.11.026. [DOI] [PMC free article] [PubMed] [Google Scholar]
- Cheung C, Culver JP, Takahashi K, Greenberg JH, Yodh AG. In vivo cerebrovascular measurement combining diffuse near-infrared absorption and correlation spectroscopies. Phys Med Biol. 2001;46:2053–2065. doi: 10.1088/0031-9155/46/8/302. [DOI] [PubMed] [Google Scholar]
- Crosby G, Crane AM, Jehle J, Sokoloff L. The local metabolic effects of somatosensory stimulation in the central nervous system of rats given pentobarbital or nitrous oxide. Anesthesiology. 1983;58:38–43. doi: 10.1097/00000542-198301000-00007. [DOI] [PubMed] [Google Scholar]
- Crosby G, Crane AM, Sokoloff L. Local changes in cerebral glucose utilization during ketamine anesthesia. Anesthesiology. 1982;56:437–443. doi: 10.1097/00000542-198206000-00005. [DOI] [PubMed] [Google Scholar]
- Culver JP, Durduran T, Furuya D, Cheung C, Greenberg JH, Yodh AG. Diffuse optical tomography of cerebral blood flow, oxygenation, and metabolism in rat during focal ischemia. J Cereb Blood Flow Metab. 2003a;23:911–924. doi: 10.1097/01.WCB.0000076703.71231.BB. [DOI] [PubMed] [Google Scholar]
- Culver JP, Siegel AM, Stott JJ, Boas DA. Volumetric diffuse optical tomography of brain activity. Opt Lett. 2003b;28:2061–2063. doi: 10.1364/ol.28.002061. [DOI] [PubMed] [Google Scholar]
- Delpy DT, Cope M, van der Zee P, Arridge S, Wray S, Wyatt J. Estimation of optical pathlength through tissue from direct time of flight measurement. Phys Med Biol. 1988;33:1433–1442. doi: 10.1088/0031-9155/33/12/008. [DOI] [PubMed] [Google Scholar]
- Devor A, Hillman EM, Tian P, Waeber C, Teng IC, Ruvinskaya L, Shalinsky MH, Zhu H, Haslinger RH, Narayanan SN, Ulbert I, Dunn AK, Lo EH, Rosen BR, Dale AM, Kleinfeld D, Boas DA. Stimulus-induced changes in blood flow and 2-deoxyglucose uptake dissociate in ipsilateral somatosensory cortex. J Neurosci. 2008;28:14347–14357. doi: 10.1523/JNEUROSCI.4307-08.2008. [DOI] [PMC free article] [PubMed] [Google Scholar]
- Devor A, Ulbert I, Dunn AK, Narayanan SN, Jones SR, Andermann ML, Boas DA, Dale AM. Coupling of the cortical hemodynamic response to cortical and thalamic neuronal activity. Proc Natl Acad Sci U S A. 2005;102:3822–3827. doi: 10.1073/pnas.0407789102. [DOI] [PMC free article] [PubMed] [Google Scholar]
- Di S, Barth DS. Topographic analysis of field potentials in rat vibrissa/barrel cortex. Brain Res. 1991;546:106–112. doi: 10.1016/0006-8993(91)91164-v. [DOI] [PubMed] [Google Scholar]
- Drummond JC, Todd MM. The response of the feline cerebral circulation to PaCO2 during anesthesia with isoflurane and halothane and during sedation with nitrous oxide. Anesthesiology. 1985;62:268–273. doi: 10.1097/00000542-198503000-00010. [DOI] [PubMed] [Google Scholar]
- Dueck MH, Petzke F, Gerbershagen HJ, Paul M, Hesselmann V, Girnus R, Krug B, Sorger B, Goebel R, Lehrke R, Sturm V, Boerner U. Propofol attenuates responses of the auditory cortex to acoustic stimulation in a dose-dependent manner: a FMRI study. Acta Anaesthesiol Scand. 2005;49:784–791. doi: 10.1111/j.1399-6576.2005.00703.x. [DOI] [PubMed] [Google Scholar]
- Durduran T, Burnett MG, Yu G, Zhou C, Furuya D, Yodh AG, Detre JA, Greenberg JH. Spatiotemporal quantification of cerebral blood flow during functional activation in rat somatosensory cortex using laser-speckle flowmetry. J Cereb Blood Flow Metab. 2004a;24:518–525. doi: 10.1097/00004647-200405000-00005. [DOI] [PubMed] [Google Scholar]
- Durduran T, Yu G, Burnett MG, Detre JA, Greenberg JH, Wang J, Zhou C, Yodh AG. Diffuse optical measurement of blood flow, blood oxygenation, and metabolism in a human brain during sensorimotor cortex activation. Opt Lett. 2004b;29:1766–1768. doi: 10.1364/ol.29.001766. [DOI] [PubMed] [Google Scholar]
- Durduran T, Zhou C, Edlow BL, Yu G, Choe R, Kim MN, Cucchiara BL, Putt ME, Shah Q, Kasner SE, Greenberg JH, Yodh AG, Detre JA. Transcranial optical monitoring of cerebrovascular hemodynamics in acute stroke patients. Opt Express. 2009;17:3884–3902. doi: 10.1364/oe.17.003884. [DOI] [PMC free article] [PubMed] [Google Scholar]
- Eger EI., 2nd The pharmacology of isoflurane. Br J Anaesth. 1984;56 1:71S–99S. [PubMed] [Google Scholar]
- Eng C, Lam AM, Mayberg TS, Lee C, Mathisen T. The influence of propofol with and without nitrous oxide on cerebral blood flow velocity and CO2 reactivity in humans. Anesthesiology. 1992;77:872–879. doi: 10.1097/00000542-199211000-00006. [DOI] [PubMed] [Google Scholar]
- Franceschini MA, Nissila I, Wu W, Diamond SG, Bonmassar G, Boas DA. Coupling between somatosensory evoked potentials and hemodynamic response in the rat. NeuroImage. 2008;41:189–203. doi: 10.1016/j.neuroimage.2008.02.061. [DOI] [PMC free article] [PubMed] [Google Scholar]
- Franks NP, Lieb WR. Molecular and cellular mechanisms of general anaesthesia. Nature. 1994;367:607–614. doi: 10.1038/367607a0. [DOI] [PubMed] [Google Scholar]
- Greene SA, Thurmon JC. Xylazine--a review of its pharmacology and use in veterinary medicine. J Vet Pharmacol Ther. 1988;11:295–313. doi: 10.1111/j.1365-2885.1988.tb00189.x. [DOI] [PubMed] [Google Scholar]
- Hirota K, Lambert DG. Ketamine: its mechanism(s) of action and unusual clinical uses. Br J Anaesth. 1996;77:441–444. doi: 10.1093/bja/77.4.441. [DOI] [PubMed] [Google Scholar]
- Hoffmeyer HW, Enager P, Thomsen KJ, Lauritzen MJ. Nonlinear neurovascular coupling in rat sensory cortex by activation of transcallosal fibers. J Cereb Blood Flow Metab. 2007;27:575–587. doi: 10.1038/sj.jcbfm.9600372. [DOI] [PubMed] [Google Scholar]
- Hoshi Y, Hazeki O, Tamura M. Oxygen dependence of redox state of copper in cytochrome oxidase in vitro. J Appl Physiol. 1993;74:1622–1627. doi: 10.1152/jappl.1993.74.4.1622. [DOI] [PubMed] [Google Scholar]
- Huppert TJ, Hoge RD, Dale AM, Franceschini MA, Boas DA. Quantitative spatial comparison of diffuse optical imaging with blood oxygen level-dependent and arterial spin labeling-based functional magnetic resonance imaging. J Biomed Opt. 2006a;11:064018. doi: 10.1117/1.2400910. [DOI] [PMC free article] [PubMed] [Google Scholar]
- Huppert TJ, Hoge RD, Diamond SG, Franceschini MA, Boas DA. A temporal comparison of BOLD, ASL, and NIRS hemodynamic responses to motor stimuli in adult humans. NeuroImage. 2006b;29:368–382. doi: 10.1016/j.neuroimage.2005.08.065. [DOI] [PMC free article] [PubMed] [Google Scholar]
- Huttunen JK, Grohn O, Penttonen M. Coupling between simultaneously recorded BOLD response and neuronal activity in the rat somatosensory cortex. NeuroImage. 2008;39:775–785. doi: 10.1016/j.neuroimage.2007.06.042. [DOI] [PubMed] [Google Scholar]
- Hyder F, Rothman DL, Shulman RG. Total neuroenergetics support localized brain activity: implications for the interpretation of fMRI. Proc Natl Acad Sci U S A. 2002;99:10771–10776. doi: 10.1073/pnas.132272299. [DOI] [PMC free article] [PubMed] [Google Scholar]
- Iadecola C. Neurovascular regulation in the normal brain and in Alzheimer's disease. Nat Rev Neurosci. 2004;5:347–360. doi: 10.1038/nrn1387. [DOI] [PubMed] [Google Scholar]
- Iadecola C, Yang G, Ebner TJ, Chen G. Local and propagated vascular responses evoked by focal synaptic activity in cerebellar cortex. J Neurophysiol. 1997;78:651–659. doi: 10.1152/jn.1997.78.2.651. [DOI] [PubMed] [Google Scholar]
- Jellema T, Brunia CH, Wadman WJ. Sequential activation of microcircuits underlying somatosensory-evoked potentials in rat neocortex. Neuroscience. 2004;129:283–295. doi: 10.1016/j.neuroscience.2004.07.046. [DOI] [PubMed] [Google Scholar]
- Jin T, Kim SG. Cortical layer-dependent dynamic blood oxygenation, cerebral blood flow and cerebral blood volume responses during visual stimulation. NeuroImage. 2008;43:1–9. doi: 10.1016/j.neuroimage.2008.06.029. [DOI] [PMC free article] [PubMed] [Google Scholar]
- Jones M, Berwick J, Hewson-Stoate N, Gias C, Mayhew J. The effect of hypercapnia on the neural and hemodynamic responses to somatosensory stimulation. NeuroImage. 2005;27:609–623. doi: 10.1016/j.neuroimage.2005.04.036. [DOI] [PubMed] [Google Scholar]
- Kleinschmidt A, Obrig H, Requardt M, Merboldt KD, Dirnagl U, Villringer A, Frahm J. Simultaneous recording of cerebral blood oxygenation changes during human brain activation by magnetic resonance imaging and near-infrared spectroscopy. J Cereb Blood Flow Metab. 1996;16:817–826. doi: 10.1097/00004647-199609000-00006. [DOI] [PubMed] [Google Scholar]
- Kochs E, Bischoff P. Ketamine and evoked potentials. Anaesthesist. 1994;43 2:S8–14. [PubMed] [Google Scholar]
- Kublik E, Musial P, Wrobel A. Identification of principal components in cortical evoked potentials by brief surface cooling. Clin Neurophysiol. 2001;112:1720–1725. doi: 10.1016/s1388-2457(01)00603-4. [DOI] [PubMed] [Google Scholar]
- Kulics AT. Cortical neural evoked correlates of somatosensory stimulus detection in the rhesus monkey. Electroencephalogr Clin Neurophysiol. 1982;53:78–93. doi: 10.1016/0013-4694(82)90108-0. [DOI] [PubMed] [Google Scholar]
- Kulics AT, Cauller LJ. Cerebral cortical somatosensory evoked responses, multiple unit activity and current source-densities: their interrelationships and significance to somatic sensation as revealed by stimulation of the awake monkey's hand. Exp Brain Res. 1986;62:46–60. doi: 10.1007/BF00237402. [DOI] [PubMed] [Google Scholar]
- Lei H, Grinberg O, Nwaigwe CI, Hou HG, Williams H, Swartz HM, Dunn JF. The effects of ketamine-xylazine anesthesia on cerebral blood flow and oxygenation observed using nuclear magnetic resonance perfusion imaging and electron paramagnetic resonance oximetry. Brain Res. 2001;913:174–179. doi: 10.1016/s0006-8993(01)02786-x. [DOI] [PubMed] [Google Scholar]
- Logginidou HG, Li BH, Li DP, Lohmann JS, Schuler HG, DiVittore NA, Kreiser S, Cronin AJ. Propofol suppresses the cortical somatosensory evoked potential in rats. Anesth Analg. 2003;97:1784–1788. doi: 10.1213/01.ANE.0000090318.16879.A8. [DOI] [PubMed] [Google Scholar]
- Maandag NJ, Coman D, Sanganahalli BG, Herman P, Smith AJ, Blumenfeld H, Shulman RG, Hyder F. Energetics of neuronal signaling and fMRI activity. Proc Natl Acad Sci U S A. 2007;104:20546–20551. doi: 10.1073/pnas.0709515104. [DOI] [PMC free article] [PubMed] [Google Scholar]
- Mackert BM, Leistner S, Sander T, Liebert A, Wabnitz H, Burghoff M, Trahms L, Macdonald R, Curio G. Dynamics of cortical neurovascular coupling analyzed by simultaneous DC-magnetoencephalography and time-resolved near-infrared spectroscopy. NeuroImage. 2008;39:979–986. doi: 10.1016/j.neuroimage.2007.09.037. [DOI] [PubMed] [Google Scholar]
- Martin C, Martindale J, Berwick J, Mayhew J. Investigating neural-hemodynamic coupling and the hemodynamic response function in the awake rat. NeuroImage. 2006;32:33–48. doi: 10.1016/j.neuroimage.2006.02.021. [DOI] [PubMed] [Google Scholar]
- Masamoto K, Fukuda M, Vazquez A, Kim SG. Dose-dependent effect of isoflurane on neurovascular coupling in rat cerebral cortex. Eur J Neurosci. 2009;30:242–250. doi: 10.1111/j.1460-9568.2009.06812.x. [DOI] [PMC free article] [PubMed] [Google Scholar]
- Masamoto K, Kim T, Fukuda M, Wang P, Kim SG. Relationship between neural, vascular, and BOLD signals in isoflurane-anesthetized rat somatosensory cortex. Cereb Cortex. 2007;17:942–950. doi: 10.1093/cercor/bhl005. [DOI] [PubMed] [Google Scholar]
- Mathiesen C, Caesar K, Akgoren N, Lauritzen M. Modification of activity-dependent increases of cerebral blood flow by excitatory synaptic activity and spikes in rat cerebellar cortex. J Physiol. 1998;512(Pt 2):555–566. doi: 10.1111/j.1469-7793.1998.555be.x. [DOI] [PMC free article] [PubMed] [Google Scholar]
- Mitzdorf U. Current source-density method and application in cat cerebral cortex: investigation of evoked potentials and EEG phenomena. Physiol Rev. 1985;65:37–100. doi: 10.1152/physrev.1985.65.1.37. [DOI] [PubMed] [Google Scholar]
- Nakao Y, Itoh Y, Kuang TY, Cook M, Jehle J, Sokoloff L. Effects of anesthesia on functional activation of cerebral blood flow and metabolism. Proc Natl Acad Sci U S A. 2001;98:7593–7598. doi: 10.1073/pnas.121179898. [DOI] [PMC free article] [PubMed] [Google Scholar]
- Norup Nielsen A, Lauritzen M. Coupling and uncoupling of activity-dependent increases of neuronal activity and blood flow in rat somatosensory cortex. J Physiol. 2001;533:773–785. doi: 10.1111/j.1469-7793.2001.00773.x. [DOI] [PMC free article] [PubMed] [Google Scholar]
- Obrig H, Villringer A. Beyond the visible--imaging the human brain with light. J Cereb Blood Flow Metab. 2003;23:1–18. doi: 10.1097/01.WCB.0000043472.45775.29. [DOI] [PubMed] [Google Scholar]
- Oria M, Chatauret N, Raguer N, Cordoba J. A new method for measuring motor evoked potentials in the awake rat: effects of anesthetics. J Neurotrauma. 2008;25:266–275. doi: 10.1089/neu.2007.0393. [DOI] [PubMed] [Google Scholar]
- Ou W, Nissila I, Radhakrishnan H, Boas DA, Hamalainen MS, Franceschini MA. Study of neurovascular coupling in humans via simultaneous magnetoencephalography and diffuse optical imaging acquisition. NeuroImage. 2009 doi: 10.1016/j.neuroimage.2009.03.008. [DOI] [PMC free article] [PubMed] [Google Scholar]
- Purdon PL, Pierce ET, Bonmassar G, Walsh J, Harrell PG, Kwo J, Deschler D, Barlow M, Merhar RC, Lamus C, Mullaly CM, Sullivan M, Maginnis S, Skoniecki D, Higgins HA, Brown EN. Simultaneous electroencephalography and functional magnetic resonance imaging of general anesthesia. Ann N Y Acad Sci. 2009;1157:61–70. doi: 10.1111/j.1749-6632.2008.04119.x. [DOI] [PMC free article] [PubMed] [Google Scholar]
- Roche-Labarbe N, Carp SA, Surova A, Patel M, Boas DA, Grant PE, Franceschini MA. Noninvasive optical measures of CBV, StO(2), CBF index, and rCMRO(2) in human premature neonates' brains in the first six weeks of life. Hum Brain Mapp. 2009 doi: 10.1002/hbm.20868. [DOI] [PMC free article] [PubMed] [Google Scholar]
- Safo Y, Young ML, Smith DS, Greenberg J, Carlsson C, Reivich M, Keykhah M, Harp JR. Effects of fentanyl on local cerebral blood flow in the rat. Acta Anaesthesiol Scand. 1985;29:594–598. doi: 10.1111/j.1399-6576.1985.tb02261.x. [DOI] [PubMed] [Google Scholar]
- Sheth SA, Nemoto M, Guiou M, Walker M, Pouratian N, Toga AW. Linear and nonlinear relationships between neuronal activity, oxygen metabolism, and hemodynamic responses. Neuron. 2004;42:347–355. doi: 10.1016/s0896-6273(04)00221-1. [DOI] [PubMed] [Google Scholar]
- Shibasaki H. Human brain mapping: hemodynamic response and electrophysiology. Clin Neurophysiol. 2008;119:731–743. doi: 10.1016/j.clinph.2007.10.026. [DOI] [PubMed] [Google Scholar]
- Sibson NR, Dhankhar A, Mason GF, Rothman DL, Behar KL, Shulman RG. Stoichiometric coupling of brain glucose metabolism and glutamatergic neuronal activity. Proc Natl Acad Sci U S A. 1998;95:316–321. doi: 10.1073/pnas.95.1.316. [DOI] [PMC free article] [PubMed] [Google Scholar]
- Sicard K, Shen Q, Brevard ME, Sullivan R, Ferris CF, King JA, Duong TQ. Regional cerebral blood flow and BOLD responses in conscious and anesthetized rats under basal and hypercapnic conditions: implications for functional MRI studies. J Cereb Blood Flow Metab. 2003;23:472–481. doi: 10.1097/01.WCB.0000054755.93668.20. [DOI] [PMC free article] [PubMed] [Google Scholar]
- Sicard KM, Duong TQ. Effects of hypoxia, hyperoxia, and hypercapnia on baseline and stimulus-evoked BOLD, CBF, and CMRO2 in spontaneously breathing animals. NeuroImage. 2005;25:850–858. doi: 10.1016/j.neuroimage.2004.12.010. [DOI] [PMC free article] [PubMed] [Google Scholar]
- Siegel AM, Culver JP, Mandeville JB, Boas DA. Temporal comparison of functional brain imaging with diffuse optical tomography and fMRI during rat forepaw stimulation. Phys Med Biol. 2003;48:1391–1403. doi: 10.1088/0031-9155/48/10/311. [DOI] [PubMed] [Google Scholar]
- Silva AC, Koretsky AP. Laminar specificity of functional MRI onset times during somatosensory stimulation in rat. Proc Natl Acad Sci U S A. 2002;99:15182–15187. doi: 10.1073/pnas.222561899. [DOI] [PMC free article] [PubMed] [Google Scholar]
- Simons DJ. Response properties of vibrissa units in rat SI somatosensory neocortex. J Neurophysiol. 1978;41:798–820. doi: 10.1152/jn.1978.41.3.798. [DOI] [PubMed] [Google Scholar]
- Sloan TB. Anesthetic effects on electrophysiologic recordings. J Clin Neurophysiol. 1998;15:217–226. doi: 10.1097/00004691-199805000-00005. [DOI] [PubMed] [Google Scholar]
- Smith AL, Wollman H. Cerebral blood flow and metabolism: effects of anesthetic drugs and techniques. Anesthesiology. 1972;36:378–400. doi: 10.1097/00000542-197204000-00015. [DOI] [PubMed] [Google Scholar]
- Steriade M. The excitatory-inhibitory response sequence in thalamic and neocortical cells: state-related changes and regulatory systems. In: Edelman GM, G W, Cohen WM, editors. Dynamic Aspects of Neocortical Function. John Wiley & Sons; New York: 1984. pp. 107–158. [Google Scholar]
- Strangman G, Culver JP, Thompson JH, Boas DA. A quantitative comparison of simultaneous BOLD fMRI and NIRS recordings during functional brain activation. NeuroImage. 2002;17:719–731. [PubMed] [Google Scholar]
- Szentagothai J. The Ferrier Lecture, 1977. The neuron network of the cerebral cortex: a functional interpretation. Proc R Soc Lond B Biol Sci. 1978;201:219–248. doi: 10.1098/rspb.1978.0043. [DOI] [PubMed] [Google Scholar]
- Thomson AM, Bannister AP. Interlaminar connections in the neocortex. Cereb Cortex. 2003;13:5–14. doi: 10.1093/cercor/13.1.5. [DOI] [PubMed] [Google Scholar]
- Toronov V, Webb A, Choi JH, Wolf M, Michalos A, Gratton E, Hueber D. Investigation of human brain hemodynamics by simultaneous near-infrared spectroscopy and functional magnetic resonance imaging. Med Phys. 2001;28:521–527. doi: 10.1118/1.1354627. [DOI] [PubMed] [Google Scholar]
- Ueki M, Mies G, Hossmann KA. Effect of alpha-chloralose, halothane, pentobarbital and nitrous oxide anesthesia on metabolic coupling in somatosensory cortex of rat. Acta Anaesthesiol Scand. 1992;36:318–322. doi: 10.1111/j.1399-6576.1992.tb03474.x. [DOI] [PubMed] [Google Scholar]
- Ureshi M, Kershaw J, Kanno I. Nonlinear correlation between field potential and local cerebral blood flow in rat somatosensory cortex evoked by changing the stimulus current. Neurosci Res. 2005;51:139–145. doi: 10.1016/j.neures.2004.10.008. [DOI] [PubMed] [Google Scholar]
- Veselis RA, Feshchenko VA, Reinsel RA, Beattie B, Akhurst TJ. Propofol and thiopental do not interfere with regional cerebral blood flow response at sedative concentrations. Anesthesiology. 2005;102:26–34. doi: 10.1097/00000542-200501000-00008. [DOI] [PubMed] [Google Scholar]
- Villiger JW, Ray LJ, Taylor KM. Characteristics of [3H]fentanyl binding to the opiate receptor. Neuropharmacology. 1983;22:447–452. doi: 10.1016/0028-3908(83)90162-4. [DOI] [PubMed] [Google Scholar]
- Villringer A, Planck J, Hock C, Schleinkofer L, Dirnagl U. Near infrared spectroscopy (NIRS): a new tool to study hemodynamic changes during activation of brain function in human adults. Neuroscience Letters. 1993;154:101–104. doi: 10.1016/0304-3940(93)90181-j. [DOI] [PubMed] [Google Scholar]
- Wang X, Huang ZG, Gold A, Bouairi E, Evans C, Andresen MC, Mendelowitz D. Propofol modulates gamma-aminobutyric acid-mediated inhibitory neurotransmission to cardiac vagal neurons in the nucleus ambiguus. Anesthesiology. 2004;100:1198–1205. doi: 10.1097/00000542-200405000-00023. [DOI] [PubMed] [Google Scholar]
- White EL. Thalamocortical synaptic relations: a review with emphasis on the projections of specific thalamic nuclei to the primary sensory areas of the neocortex. Brain Res. 1979;180:275–311. doi: 10.1016/0165-0173(79)90008-0. [DOI] [PubMed] [Google Scholar]
- White EL, Hersch SM. A quantitative study of thalamocortical and other synapses involving the apical dendrites of corticothalamic projection cells in mouse SmI cortex. J Neurocytol. 1982;11:137–157. doi: 10.1007/BF01258009. [DOI] [PubMed] [Google Scholar]
- Wright M. Pharmacologic effects of ketamine and its use in veterinary medicine. J Am Vet Med Assoc. 1982;180:1462–1471. [PubMed] [Google Scholar]
- Wrobel A, Kublik E, Musial P. Gating of the sensory activity within barrel cortex of the awake rat. Exp Brain Res. 1998;123:117–123. doi: 10.1007/s002210050552. [DOI] [PubMed] [Google Scholar]
- Young WL, Prohovnik I, Correll JW, Ostapkovich N, Ornstein E, Quest DO. A comparison of cerebral blood flow reactivity to CO2 during halothane versus isoflurane anesthesia for carotid endarterectomy. Anesth Analg. 1991;73:416–421. [PubMed] [Google Scholar]
- Zappe AC, Uludag K, Oeltermann A, Ugurbil K, Logothetis NK. The influence of moderate hypercapnia on neural activity in the anesthetized nonhuman primate. Cereb Cortex. 2008;18:2666–2673. doi: 10.1093/cercor/bhn023. [DOI] [PMC free article] [PubMed] [Google Scholar]
- Zhou C, Eucker SA, Durduran T, Yu G, Ralston J, Friess SH, Ichord RN, Margulies SS, Yodh AG. Diffuse optical monitoring of hemodynamic changes in piglet brain with closed head injury. J Biomed Opt. 2009;14:034015. doi: 10.1117/1.3146814. [DOI] [PMC free article] [PubMed] [Google Scholar]
Associated Data
This section collects any data citations, data availability statements, or supplementary materials included in this article.