

Abstract
Inositol 1,4,5-trisphosphate (IP3) receptors (IP3R) are intracellular Ca2+ channels. Their opening is initiated by binding of IP3 to the IP3-binding core (IBC; residues 224–604 of IP3R1) and transmitted to the pore via the suppressor domain (SD; residues 1–223). The major conformational changes leading to IP3R activation occur within the N terminus (NT; residues 1–604). We therefore developed a high-throughput fluorescence polarization (FP) assay using a newly synthesized analog of IP3, fluorescein isothiocyanate (FITC)-IP3, to examine the thermodynamics of IP3 and adenophostin A binding to the NT and IBC. Using both single-channel recording and the FP assay, we demonstrate that FITC-IP3 is a high-affinity partial agonist of the IP3R. Conventional [3H]IP3 and FP assays provide similar estimates of the KD for both IP3 and adenophostin A in cytosol-like medium at 4°C. They further establish that the isolated IBC retains the ability of full-length IP3R to bind adenophostin A with ∼10-fold greater affinity than IP3. By examining the reversible effects of temperature on ligand binding, we established that favorable entropy changes (TΔS) account for the greater affinities of both ligands for the IBC relative to the NT and for the greater affinity of adenophostin A relative to IP3. The two agonists differ more substantially in the relative contribution of ΔH and TΔS to binding to the IBC relative to the NT. This suggests that different initial binding events drive the IP3R on convergent pathways toward a similar open state.
Inositol 1,4,5-trisphosphate receptors (IP3R) are intracellular channels that mediate release of Ca2+ from the endoplasmic reticulum by IP3 (Foskett et al., 2007). All IP3R are tetrameric and each subunit of approximately 2700 residues has an IP3-binding core (IBC; residues 224–604 of rat IP3R1) near its N terminus and six transmembrane domains toward the C terminus (Fig. 1A). The last pair of transmembrane domains with their intervening luminal loops from the four subunits form the pore. All three subtypes of vertebrate IP3R and the single subtype in invertebrates share a similar structural organization. It remains unclear how IP3 binding to the IBC opens the pore, but the N-terminal suppressor domain (SD; residues 1–223) is involved. Removal of the SD uncouples IP3 binding from gating (Uchida et al., 2003), a region within the N terminus that includes the SD interacts directly with residues close to the pore (Boehning and Joseph, 2000), and conformational changes initiated by IP3 pass to the pore entirely via the SD (Rossi et al., 2009). These observations are presently supported by only limited knowledge of the structure of IP3R. There are high-resolution structures of the SD (Bosanac et al., 2005) and of the IBC with IP3 bound (Bosanac et al., 2002), and there are several, somewhat inconsistent low-resolution (∼30 Å) structures of the entire IP3R (Taylor et al., 2004). None of these structures can yet provide specific insight into the conformational changes evoked by IP3 binding, although small-angle X-ray scattering analyses are consistent with the idea that IP3 causes the SD and IBC to adopt a more compact structure (Chan et al., 2007). Our recent results, derived from analysis of the energetics of agonist binding to IP3R and its N-terminal fragments, suggest that major, as-yet-undefined conformational changes associated with activation of IP3R by IP3 occur within the N terminus (NT; residues 1–604) (Rossi et al., 2009).
Fig. 1.

FITC-IP3 is a partial agonist. Key domains within a single subunit of IP3R1, showing the NT, which comprises the IBC and SD and transmembrane domains (TMD) (A). The structure of the IBC with its α and β domains is shown with IP3 bound (Protein Data Bank ID 1N4K), highlighting the 2-O-atom (arrow, and enlarged alongside) to which fluorescein is attached by a short linker in FITC-IP3. Structures of IP3, FITC-IP3, and adenophostin A (B). Effects of the indicated concentrations of FITC-IP3 on specific binding of [3H]IP3 (0.75 nM) to the NT (4 μg, 10 nM) and IBC (1.1 μg, 1 nM) in CLM (C and D). Results are means ± S.E.M., n = 3. Typical recordings from excised nuclear patches from DT40-IP3R1 cells stimulated with 10 μM IP3 or FITC-IP3 in the pipette (E). C denotes the closed state, and the holding potential was 40 mV. Current (i)-voltage (V) relationship for single IP3R stimulated with IP3 or FITC-IP3 (10 μM) (F). Single channel open probability (Po) and mean channel open time (τo) for IP3R stimulated with IP3 or FITC-IP3 (10 μM) (F). Results (F and G) are means ± S.E.M., n = 3–5.
Adenophostin A is a high-affinity agonist of IP3R in which the essential bisphosphate moiety of IP3 is retained but attached to a glucose rather than an inositol ring. The 2′-phosphate of adenophostin A mimics, at least in part, the 1-phosphate of IP3 (Fig. 1B). Despite considerable effort, fuelled by synthesis of many adenophostin A-related analogs (Borissow et al., 2005; Mochizuki et al., 2006; Sureshan et al., 2008), the structural basis of the high-affinity binding of adenophostin A to IP3R is unresolved. We have suggested that a cation-π interaction between the adenine moiety of adenophostin A and Arg-504 within the IBC may contribute to this high-affinity binding (Sureshan et al., 2009).
The thermodynamics of reversible ligand-receptor interactions can provide insight into ligand recognition and associated conformational changes (Borea et al., 2000) that may not be apparent in even high-resolution structures (Chaires, 2008; Olsson et al., 2008). For a spontaneous process, the entropy of the universe must increase (i.e., ΔG <0) (Keeler and Wothers, 2006). This free energy change (ΔG = ΔH − TΔS) comprises the entropy change of the system (ΔS), arising from changes in the motions of water, ligand, and receptor and changes in the entropy of the surroundings (ΔH/T) arising from changes in bonding (Williams et al., 2004). Because ΔG (and thereby KD) is often a balance between larger ΔH and TΔS, ligand-receptor interactions that differ minimally in ΔG may nevertheless be distinguished by measurements of ΔH and ΔS (Luque and Freire, 1998). But ΔS and ΔH are not independent because stronger bonds (large ΔH) more severely restrict the motions of the ligand, receptor, and perhaps water molecules (reduced ΔS); this is known as enthalpy-entropy compensation (Williams et al., 2004; Olsson et al., 2008). Despite the difficulty of trying to relate ΔH and ΔS directly to receptor-ligand structures (Chaires, 2008; Olsson et al., 2008), for at least some receptors these thermodynamic parameters distinguish agonist and antagonist binding (Weiland et al., 1979; Borea et al., 2000). See Calculation of ΔS and ΔH from KD for full definitions of these terms.
Fluorescence polarization (FP) provides one means of examining the thermodynamics of ligand binding. When a rigid fluorophore is excited by plane-polarized light and it remains immobile during its fluorescence lifetime [4 ns for fluorescein 5-isothiocyanate (FITC) (French et al., 1997], 60% of emitted light will be detected in the plane of the exciting light, and the anisotropy (A; see Materials and Methods) will be 0.4 (Serdyuk et al., 2007). But if the molecule rotates during its fluorescence lifetime, less emitted light will be aligned with the excitation plane, and A will be <0.4 (A = 0 if the fluorophore randomly reorients). Because the speed of tumbling is inversely proportional to molecular volume, binding of a small fluorescent probe (such as FITC-IP3, 0.85 kDa) to a much larger IP3R fragment (IBC or NT, 43–67 kDa) increases A. FP measures this change in A as a fluorescent ligand binds. It thereby allows nondestructive quantification of binding without the need to separate bound from free ligand: binding is measured without perturbing the equilibrium. This is useful for measurement of low-affinity interactions in which rapid ligand dissociation during separation of bound and free ligand compromises analysis. Additional advantages of FP include the opportunity to make many measurements from the same sample under different conditions (different temperatures in this analysis), cost-effectiveness, applicability to high-throughput analyses, and avoidance of radioligands. Here we synthesize FITC-IP3 and use it to develop a FP binding assay for N-terminal fragments of IP3R. We use the FP assay to examine the thermodynamics of IP3 and adenophostin A interactions with the NT and IBC.
Materials and Methods
Materials.
Sources of most reagents were described previously (Rossi et al., 2009). Adenophostin A (Marwood et al., 2000) was synthesized and characterized as previously reported. IP3 was from Alexis Biochemicals (Nottingham, UK). The structures of the ligands used are shown in Fig. 1B. [3H]IP3 (681 GBq/mmol) was from PerkinElmer Life and Analytical Sciences (Beaconsfield, Buckinghamshire, UK). Pop-Culture was from Novagen (Beeston, UK). Glutathione Sepharose 4B beads, PD-10 columns, and GST-tagged PreScission protease were from GE Healthcare (Chalfont St. Giles, Buckinghamshire, UK).
Synthesis of FITC-IP3.
We used FITC to label IP3 because FITC derivatives are available as isomerically pure 5- or 6-isomers at practical cost. To minimize the length of the linker for optimal FP, 2-O-(2-aminoethyl)-IP3 (Riley et al., 2004) was used for the conjugation with FITC. The short linker holds the reacting amine group close to the charged phosphate groups of IP3. This makes conjugation reactions of 2-O-(2-aminoethyl)-IP3 with active esters of dyes, such as succinimides, quite challenging under standard conditions because in aqueous buffer, the reaction is slow, leading to competing hydrolysis of activated dye, which must therefore be used in large excess. However, we found that in dry methanol with triethylamine as base, FITC reacted cleanly and selectively with 2-O-(2-aminoethyl)-IP3. The reaction was carried out in deuterated methanol in an NMR tube and monitored by 31P NMR spectroscopy.
To a solution of 2-O-(2-aminoethyl)-IP3 (Riley et al., 2004) (15 mg of triethylammonium salt, 20 μmol) in dry tetradeuteromethanol (0.75 ml) in an NMR tube was added dry triethylamine (50 μl) and a trace of EDTA (Na+ salt). A 1H-decoupled 31P NMR spectrum taken at this stage showed three sharp signals at 5.0, 3.9, and 1.7 ppm. FITC (11.7 mg of solid, 30 μmol) was added, and the tube was sealed and shaken, then kept in the dark. A second 31P NMR spectrum taken after 4 h showed three new signals (5.1, 4.3, and 1.1 ppm) and indicated that the conjugation reaction was ∼60% complete as judged by peak integrals. A third 31P NMR spectrum taken after 20 h showed that the reaction had progressed further (∼70% complete). Additional FITC (8.3 mg, 20 μmol) was added. The next day (total time 48 h), the reaction was judged to be complete; only three signals remained in the 31P NMR spectrum. The contents of the NMR tube were washed into a round-bottomed flask with methanol and concentrated under reduced pressure. The residue was taken up in deionized water (10 ml) and applied to a column of Q Sepharose Fast Flow resin (8 × 2 cm, bicarbonate form) that was protected from light. The column was washed well with deionized water, followed by aqueous triethylammonium bicarbonate (TEAB) until all unconjugated dye had eluted. This required a large volume of 0.6 M TEAB buffer (∼1 L) until the eluent ran colorless. The column was then eluted using a linear gradient of TEAB (0.6–2.0 M over 250 ml) collecting 10-ml fractions. The target compound eluted between 0.9 and 1.2 M TEAB. The most intensely fluorescent fractions (five tubes) were combined and concentrated to give FITC-IP3 (triethylammonium salt) (Fig. 1B) as an orange glass. This was redissolved in deionized water, applied to a column of Chelex-100 resin (Na+ form, 2.5 ml), and eluted with deionized water. The product was lyophilized to give FITC-IP3 as the Na+ salt (20 mg), which was accurately quantified by total phosphate assay (Ames and Dubin, 1960) (16 μmol, 80% yield); 1H NMR (Na+ salt, D2O, 270 MHz) δ 7.82 (br s, 1H), 7.63 (br dd, J ∼ 8, 2 Hz, 1H), 7.33 to 7.27 (m, 3H), 6.68 to 6.62 (m, 4H), 4.26 (ddd, appears as q, J = 9.6, 9.4, 8.4 Hz, 1H), 4.12 (br s, 1H), 4.15 to 3.76 (m, 7H), 3.74 (dd, J = 9.6, 2.7 Hz, 1H); 31P NMR (D2O, 109 MHz) δ 5.56 (1P), 5.18 (1P), 4.10 (1P); high-resolution mass spectometry (m/z) [M]− calculated for C29H31N2O20P3S, 851.0331; found, 851.0330.
Expression and Purification of N-Terminal Fragments of IP3R1.
The N-terminal fragments of rat IP3R1 (NT; residues 1–604; IBC, residues 224–604) were amplified by PCR from the full-length clone lacking the S1 splice site. PCR used primers P1 and P2 for the NT and P2 and P3 for the IBC. The sequences of all primers are listed in Supplemental Fig. 1A. The fragments are numbered by reference to the full-length (S1+) rat IP3R1 (GenBank accession number GQ233032). Insertion of the S1 splice region into the IBC fragment used QuikChange mutagenesis kit (Stratagene, La Jolla, CA) with P4 and P5 primers (Supplemental Fig. 1A). The PCR products were ligated into the pGEX-6P-2 vectors (GE Healthcare) as BamHI/XhoI fragments to give pGEX-NT and pGEX-IBC. Both pGEX-NT and pGEX-IBC include an N-terminal GST linked to the IP3R fragment by a PreScission cleavage site. The sequences of all constructs were confirmed by DNA sequencing. The presence of the S1 splice site does not affect the KD of the IBC for IP3 (Supplemental Fig. 1B). After cleavage from GST, the IP3R fragments retain only five non-native N-terminal residues (Fig. 2A). These are unlikely to affect IP3 binding because the KD of the NT and IBC for IP3 are similar for these fragments and those prepared using thrombin cleavage of His6-tagged proteins (Rossi et al., 2009), in which only two non-native N-terminal residues (Gly-Ser) remain (data not shown). The constructs were transformed into Escherichia coli AVB101, 1 ml of the culture was grown for 12 h at 37°C in Luria-Bertani medium with 100 μg/ml ampicillin and then at 22°C until the OD600 reached 1 to 1.5. Protein expression was induced by addition of isopropyl-β-d-thiogalactoside at 15°C for 20 h. Cells were harvested (6000g, 5 min), and the pellet was suspended in Tris/EDTA medium (TEM; 50 mM Tris and 1 mM EDTA, pH 8.3) supplemented with 10% Pop-Culture, 1 mM 2-mercaptoethanol, and protease inhibitor cocktail (Complete protease inhibitor, 1 tablet/50 ml; Roche Applied Science, Mannheim, Germany). The suspension was incubated with lysozyme (100 μg/ml) and RNAase (10 μg/ml) for 30 min on ice, and the lysate was then sonicated (Transonic T420 bath, 20 s; CamLab, Over, Cambridge). After centrifugation (30,000g, 60 min), 50 ml of supernatant was incubated with constant rotation for 30 min at 20°C with 0.5 ml of glutathione Sepharose 4B beads. The beads were transferred into an empty PD-10 column and washed five times with 10 ml of Ca2+-free cytosol-like medium (CLM; 140 mM KCl, 20 mM NaCl, 2 mM MgCl2, 1 mM EGTA, and 20 mM PIPES, pH 7.0) supplemented with 1 mM dithiothreitol at 4°C. The beads were then incubated with 0.5 ml (1 bed volume) of CLM supplemented with 1 mM dithiothreitol and 120 units/ml GST-tagged PreScission protease at 4°C for 12 h and the eluted IP3R fragment, free of PreScission, was collected. Protein concentrations were measured using the detergent-compatible assay with γ-globulin as standard (Bio-Rad Laboratories, Hemel Hempstead, Hertfordshire, UK). Cloning and expression of His6-tagged IBC and NT fragments have been described previously (Rossi et al., 2009).
Fig. 2.

Properties of the NT and IBC used for FP assays. The constructs used showing the N-terminal GST tag used for purification, the PreScission cleavage site (arrow), and the N terminus of the protein after cleavage with the residual non-native residues underlined (A). Silver-stained gel (left) and Western blot using antipeptide antiserum to residues 62 to 75 (right) for purified NT (4 μg, 5.1 pmol) (B). Silver-stained gel (left) and immunoblot with antipeptide antiserum to residues 326 to 343 (right) for purified IBC (4 μg, 1.7 pmol) (C). Gels and blots (B and C) are typical of at least three analyses. Positions of molecular mass markers (kDa) are shown alongside each gel. Saturation binding of [3H]IP3 to the NT determined in TEM (30 ng total protein) shown as a Scatchard plot (D). Equilibrium competition binding of IP3 and [3H]IP3 (0.75 nM) to the NT in TEM (150 ng total protein) and CLM (4 μg total protein) (E). Results (D and E) show means ± S.E.M., n = 3.
Protein samples were separated using NuPage precast 4-to-12% gels (Invitrogen). Samples were either silver-stained (Pierce Silver Stain Kit II; Thermo Fisher Scientfic, Waltham, MA) or transferred to nitrocellulose membranes using the iBlot system (Invitrogen, Carlsbad, CA). The NT and IBC were identified using antisera raised to peptides corresponding to residues 62 to 75 (Cardy et al., 1997) or 326 to 343 (the first splice site) (Rossi et al., 2009) of IP3R1, respectively.
[3H]IP3 Binding.
Equilibrium-competition binding assays were performed at 4°C in a final volume of 500 μl of CLM containing [3H]IP3 (0.75 nM), purified protein (1–4 μg), and competing ligands. For some experiments, CLM was replaced by TEM. After 10 min, reactions were terminated by addition of 500 μl of ice-cold CLM containing 30% poly(ethylene glycol) 8000 and γ-globulin (600 μg) followed by centrifugation (20,000g, 5 min, 4°C). Pellets were solubilized in 200 μl of CLM containing 2% Triton X-100, mixed with EcoScintA scintillation cocktail (National Diagnostics, Atlanta, GA) and the radioactivity was determined. Nonspecific binding determined by addition of 10 μM IP3 or by extrapolation of competition binding curves to infinite IP3 concentration gave indistinguishable results. Binding results were fitted to a Hill equation (Prism ver. 5; GraphPad Software, San Diego, CA) from which the IC50, and thereby the KD and Bmax, were calculated (Kenakin, 1997).
Fluorescence Polarization.
FP measurements were performed in 96-well, half-area, black round-bottomed polystyrene microplates (Greiner Bio-One, Gloucester, UK) using a Pherastar plate reader (BMG Labtech, Aylesbury, UK) in a temperature-controlled chamber. An automated liquid-handling system (Qiagility; QIAGEN, Crawley, West Sussex, UK) was used to prepare dilutions and to make most additions to plates. Periodic assessment established that the precision and reproducibility of the automated system (typically <5% error after eight serial dilutions) exceeded that of manual pipetting.
For saturation assays, serially diluted protein in CLM (0.3–400 nM IP3-binding sites) was mixed with FITC-IP3 (0.5 nM) in a final volume of 50 μl. For competition assays, serially diluted ligands in CLM were mixed with FITC-IP3 (0.5 nM) and protein (80 nM for NT and 15 nM for IBC). Optimization of these conditions is described under Results. The plate was equilibrated at each temperature (4–37°C) for 20 min before measuring FP. There was negligible change in the pH of CLM across this temperature range (7.05 to 6.98), and because Ca2+ was omitted from the medium, there was no change in free [Ca2+]. Samples were excited by vertically polarized light at 485 nm, and emission was simultaneously measured at 538 nm in the horizontal and vertical planes. Each FP measurement was the average from 300 flashes delivered over ∼5 s.
Fluorescence measurements were corrected for background fluorescence (<15% for the highest protein concentration, Supplemental Fig. 2) determined at each protein concentration in the absence of FITC-IP3. Anisotropy (A) was calculated from these corrected fluorescence emission intensities in the vertical (Iv) and horizontal (Ih) planes (Jameson and Sawyer, 1995): A = (Iv − Ih)/(Iv + 2Ih).
Anisotropy of free FITC-IP3 (AF) was determined in the absence of added protein, and anisotropy of bound FITC-IP3 (AB) was determined in the presence of saturating concentrations of IBC (100 nM) or NT (300 nM). The fraction of bound FITC-IP3 (FB) is related to the measured anisotropy (AM) by the following equation (Jameson and Sawyer, 1995): FB = (AM − AF)/(AB − AF).
Anisotropy caused by nonspecific binding (ANS) was determined by measuring anisotropy at each protein concentration in the presence of a saturating concentration of IP3 (10 μM) (AI). Because the free FITC-IP3 concentration is substantially reduced when it binds to the NT or IBC, AI overestimates the nonspecific binding in the absence of saturating IP3. Our correction assumes that nonspecific binding is linearly related to the free FITC-IP3 concentration: ANS = (AI − AF)/(1 − FB).
Anisotropy caused by specific binding (AS) of FITC-IP3 to IP3R fragments was then calculated from AS = AM − ANS, from which the fraction of specifically bound FITC-IP3 (FBS) was calculated and used for all subsequent analyses: FBS = (AS − AF)/(AB − AF).
Calculation of Equilibrium Dissociation Constants from FP Analyses.
To determine the KD of FITC-IP3 for the IBC and NT, a fixed concentration of FITC-IP3 (0.5 nM) was incubated with various concentrations of protein. The total protein concentration required to cause 50% of FITC-IP3 (0.25 nM in our experiments) to be bound (R50) was then determined. The free protein concentration required to bind 50% of FITC-IP3 (KD) was then calculated by correcting for the amount of bound protein: KD = R50 − 0.25 nM. The KD for IP3 and adenophostin A were measured in equilibrium competition binding assays with FITC-IP3. From the total concentration of competing ligand that caused a 50% decrease in specifically bound FITC-IP3 (IC50), the KD for competing ligands (KI) was determined at each temperature (Kenakin, 1997):
where KD = KD for FITC-IP3 at each temperature; LT = total [FITC-IP3]; RT = total [NT] or total [IBC]; B = [NT/IBC − FITC-IP3 complex] at IC50, calculated from B = LT × FBS; and I = free [competing ligand] at IC50, calculated from I = IC50 − 0.5RT.
Calculation of ΔS and ΔH from KD.
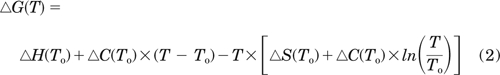
The KD is related to changes of Gibbs free energy: ΔG = R · T lnKD, where R is the gas constant and T is absolute temperature. Assuming that the change in heat capacity (ΔC) is temperature-independent, the enthalpy change (ΔH), entropy change (ΔS), ΔC, ΔG, and T are related to the reference temperature (To, 296 K in our experiments) (Wittmann et al., 2009).
 |
Values for ΔH, ΔS, and ΔC were determined by ordinary least-squares curve-fitting of ΔG versus T (Prism software) (Motulsky and Christopoulos, 2003). Where ΔH is unaffected by temperature (i.e., ΔC = 0) (Borea et al., 2000), the equation simplifies to the van't Hoff equation (Wittmann et al., 2009), such that
From which ΔH/R can be determined from the slope of the plot of lnKD versus 1/T.
Single Channel Recording.
Currents were recorded from patches excised from the outer nuclear envelope of DT40 cells expressing recombinant rat IP3R1 using symmetrical cesium methanesulfonate (200 mM) as the charge carrier. The composition of recording solutions and methods of analysis were otherwise as described previously (Rahman et al., 2009).
Results
FITC-IP3 Is a Partial Agonist of IP3R.
We used FITC-IP3 (Fig. 1B) as the fluorescent ligand for FP assays. Fluorescein has an appropriate fluorescence lifetime (4 ns), synthesis of FITC-IP3 is economical (see Materials and Methods), and FITC-IP3 is relatively small (0.85 kDa) and so tumbles rapidly (it has a large rotational relaxation time).
Fluorescein was linked to IP3 via its 2-O-position because the structure of the IBC with IP3 bound has shown that the 2-hydroxyl of IP3 is exposed and makes no significant contacts with the IBC (Bosanac et al., 2002) (Fig. 1A). This is consistent with structure-activity studies using full-length IP3R and its N-terminal fragments in which 2-O-modified analogs of IP3 retain biological activity (Potter and Lampe, 1995; Rossi et al., 2009). In equilibrium-competition binding assays in TEM to full-length IP3R1 (KD for FITC-IP3 = 3.25 ± 0.07 nM), the NT (1.34 ± 0.24 nM), or IBC (0.28 ± 0.06 nM), FITC-IP3 completely displaced specific [3H]IP3 binding with high affinity (Supplemental Fig. 3). In subsequent analyses, we focus on the NT (KD for FITC-IP3 = 11.8 ± 0.2 nM) and IBC (2.0 ± 0.2 nM) in CLM (Fig. 1, C and D, and Table 1).
TABLE 1.
Comparison of KD determined by [3H]IP3 binding and FP assays
The KD for each ligand was determined in CLM at 4°C either by competition binding with [3H]IP3 or by FP. Results are means ± S.E.M., n = 3.
| IBC |
NT |
|||
|---|---|---|---|---|
| [3H]IP3 | FP | [3H]IP3 | FP | |
| nM | ||||
| FITC-IP3 | 2.0 ± 0.2 | 3.0 ± 0.1 | 11.8 ± 0.2 | 12.5 ± 0.6 |
| IP3 | 8.7 ± 1.8 | 9.2 ± 0.8 | 65.2 ± 8.2 | 94.8 ± 7.1 |
| Adenophostin A | 0.7 ± 0.1 | 0.9 ± 0.1 | 6.2 ± 1.6 | 8.6 ± 0.2 |
Our recent analysis of 2-O-modified IP3 analogs established that they are partial agonists of IP3R (Rossi et al., 2009). Single channel recordings from IP3R1 expressed in the nuclear envelope of DT40 cells (Rahman et al., 2009) showed that FITC-IP3 is also a partial agonist (Fig. 1E). FITC-IP3 and IP3 caused IP3R to open to the same single-channel Cs+ conductance (γCs ∼220 pS; Fig. 1F), but the single-channel open probability (Po) was lower with a maximally effective concentration of FITC-IP3 (0.057 ± 0.01, n = 4) than with IP3 (0.41 ± 0.04, n = 5) (Fig. 1G). The mean channel open time (τo ∼10 ms, Fig. 1, E and G) was the same for IP3R stimulated with IP3 and FITC-IP3, indicating that IP3R differ in the rates of channel opening when bound to the different ligands. IP3R activated by the 2-O-modified partial agonists that we characterized previously also had τo similar to those activated by IP3, but the partial agonists less effectively promoted channel opening (Rossi et al., 2009). We have suggested that the 2-O-substitutents of these partial agonists disrupt transmission of an essential conformational change from the IBC to the SD and thereby reduce the amount of binding energy that is diverted into conformational changes of the protein. The lesser effect of removing the SD on FITC-IP3 binding to the NT, relative to its effects on IP3 and adenophostin A binding (Table 1), is consistent with FITC-IP3 also disrupting communication between the IBC and SD. FITC-IP3 is the weakest partial agonist of the IP3R yet identified.
These results establish that IP3 and FITC-IP3 interact with the same binding site on the IP3R and that FITC-IP3 is a partial agonist. FITC-IP3 is therefore a fluorescent ligand suitable for analysis of IP3R behavior. In subsequent analysis, we use FITC-IP3 to develop an FP assay to measure ligand binding to IP3R fragments. We focus on the IBC and NT of IP3R1 because the IBC is the minimal structure that binds IP3 and its analogs (Bosanac et al., 2002), and major conformational changes associated with IP3R activation occur within the NT (Rossi et al., 2009).
Optimization of a FP Assay for IP3R.
In radioligand binding assays, ligand depletion can be minimized by ensuring that the ligand concentration considerably exceeds that of the receptor. But the signal from a FP assay depends on a considerable fraction of the ligand (FITC-IP3) being bound. This dictates that the concentration of ligand-binding sites is known accurately to allow both saturation binding analyses (where the fraction of bound FITC-IP3 is determined as a function of protein concentration) and to compute free ligand concentrations in competition experiments. A second requirement for FP is therefore an accurately defined concentration of functional receptor.
After expression in bacteria, purification on glutathione Sepharose, and cleavage by PreScission (see Materials and Methods and Fig. 2A), the purified NT had the expected molecular mass (67 kDa) after SDS-polyacrylamide gel electrophoresis (Fig. 2B). Additional bands with lower molecular mass (∼35 and ∼50 kDa) were also detected by both silver staining and immunoblotting with an antiserum to residues 62 to 75 (Fig. 2B). The relative intensities of the three major bands were similar in immunoblots and after silver staining, indicating that the smaller proteins correspond to C-terminally truncated fragments of the NT. The largest of these (∼51 kDa) probably terminates at approximately residue 456. Because the minimal IP3-binding fragment terminates at residue 578 (Yoshikawa et al., 1996), only the complete NT (28 ± 7% of immunoreactive staining; equivalent to 37 ± 9% of total protein) is likely to bind IP3. Similar analyses of purified IBC, where any truncation would abolish IP3 binding (Yoshikawa et al., 1996), demonstrate that 24 ± 7% of the IP3R1 immunoreactivity (32 ± 9% of total protein) has the size expected of the IBC (43 kDa) (Fig. 2C). Because heparin is a competitive antagonist of IP3 at IP3R, these interpretations are consistent with only the largest fragments being retained on heparin-agarose columns (Supplemental Fig. 4).
The concentration of functional NT was determined from [3H]IP3 binding in both saturation binding (in TEM, Fig. 2D), where the reliability of the specific activity of [3H]IP3 is critical, and in competition binding (in TEM and CLM, Fig. 2E), where the reliability of the unlabeled IP3 concentration is more critical. In parallel comparisons from a single preparation of NT (in TEM to maximize sensitivity), both assays provided similar estimates of the KD and Bmax (Table 2). For both the IBC and NT, the Hill coefficient for IP3 binding was ∼1 (Table 2), consistent with noncooperative binding of IP3 to a single class of site. These results confirm that equilibrium competition binding assays can be used reliably to determine the concentration of functional IP3-binding sites in our preparations of the NT and IBC. In all subsequent analyses, concentrations of NT and IBC are derived from equilibrium competition binding with [3H]IP3 in CLM (Table 2) and expressed as the concentration of IP3-binding sites.
TABLE 2.
IP3 binding to the NT and IBC determined by saturation and competition binding assays
To increase the sensitivity of the assay, the direct comparison of [3H]IP3 saturation and competition binding assays was determined in TEM (Fig. 2, D and E). For comparison, results are shown for competition binding assays in CLM (Fig. 3 and Supplemental Fig. 5); these were used to determine the concentration of IP3-binding sites in each preparation of NT and IBC. The KD, Bmax, and Hill coefficient values are shown for each assay. Results are means ± S.E.M., n = 3.
| TEM |
CLM |
|||
|---|---|---|---|---|
| Saturation NT | Competition NT | Competition NT | Competition IBC | |
| KD (nM) | 2.2 ± 0.5 | 1.7 ± 0.2 | 65.2 ± 8.2 | 8.7 ± 1.8 |
| Bmax (nmol/mg) | 1.5 ± 0.1 | 1.2 ± 0.1 | 1.3 ± 0.1 | 0.44 ± 0.03 |
| Hill coefficient | 0.8 ± 0.1 | 1.1 ± 0.1 | 0.9 ± 0.1 | 0.9 ± 0.1 |
A high concentration of FITC-IP3 is desirable to minimize background fluorescence (Checovich et al., 1995), but unless the concentration of FITC-IP3 is kept well below its KD, there will be substantial depletion of free receptors in saturation binding experiments, and competition binding experiments will require high concentrations of precious protein and ligands. Supplemental Fig. 2 summarizes our optimization of protein and FITC-IP3 concentrations for the FP assay. We use 0.5 nM FITC-IP3 in all subsequent experiments, and the concentrations of IBC and NT described below.
Conventional and FP Analyses Provide Similar Estimates of KD.
The KD (12.5 ± 0.6 nM, n = 3) of the NT for FITC-IP3 was determined by measuring the A of FITC-IP3 (0.5 nM) as a function of increasing concentration of NT in CLM at 4°C (Fig. 3A). This KD is similar to that obtained under identical conditions in competition with [3H]IP3 (11.8 ± 0.2 nM) (Fig. 3B).
Fig. 3.

Comparison of binding analyses using [3H]IP3 and FP. FP experiment at 4°C using 0.5 nM FITC-IP3 and showing corrected A as a function of increasing concentration of NT (A). Equilibrium competition binding experiments with [3H]IP3 (0.75 nM), NT (4 μg), and the indicated concentrations of FITC-IP3 (B). FP competition binding assay with FITC-IP3 (0.5 nM), NT (80 nM), and the indicated concentrations of IP3 (C) or adenophostin A (D). Results (A–D) are means ± S.E.M., n = 3. All binding analyses (A–D) were performed in CLM. Equivalent analyses with the IBC are shown in Supplemental Fig. 5.
From Fig. 3A, the lowest concentration of NT to give an almost maximal A is ∼80 nM. Subsequent competition assays therefore used 0.5 nM FITC-IP3 and 80 nM NT. Figure 3, C and D, shows FP competition assays with IP3 and adenophostin A from which the KD for each was calculated (Table 1). These and similar results with the IBC (Supplemental Fig. 5) establish that when measured under identical conditions (CLM at 4°C), the FP and radioligand binding assays provide similar estimates of KD for the three key ligands (Table 1). The consistency persists across two different FP assays: saturation binding (for FITC-IP3; Fig. 3A) and competition binding (for IP3 and adenophostin A; Fig. 3, C and D). These results establish the utility of our FITC-IP3-based FP assay for high-throughput analyses of ligand binding to IP3R fragments. In subsequent experiments, we exploit the uniquely nondestructive nature of the FP assay together with its ability to measure low-affinity interactions to examine the thermodynamics of ligand interactions with the IBC and NT in CLM.
The IBC Retains High Affinity for Adenophostin A.
Adenophostin A has ∼10-fold lower KD than IP3 for both the NT and IBC whether assessed by FP or in competition with [3H]IP3 (Table 1). The 10-fold difference is similar to that of the affinities of the two ligands for full-length IP3R1 and to their relative potencies in evoking Ca2+ release (Rossi et al., 2009). We reported previously that the NT and IBC differed more modestly in their relative affinities for IP3 and adenophostin A (∼3-fold) (Morris et al., 2002), and others obtained similar results with a shorter NT fragment (residues 1–581) (Vanlingen et al., 2000). But both studies were performed in TEM-like media, and our study (Morris et al., 2002) used IP3R fragments with an N-terminal His6-tag, which we have shown to reduce substantially the affinity for IP3 (Rossi et al., 2009). Our present results are significant because they demonstrate that both the NT (Glouchankova et al., 2000) and IBC retain the structural determinants of high-affinity adenophostin A binding. Furthermore, both IP3 and adenophostin A bind with ∼10-fold greater affinity to the IBC than to the NT (Table 1). This is consistent with our suggestion that full agonists of IP3R, such as IP3 and adenophostin A, divert substantial binding energy into rearrangement of the SD (Rossi et al., 2009). We conclude that interactions between the IBC and adenophostin A are sufficient to account for adenophostin A binding with ∼10-fold greater affinity than IP3 to IP3R and that IP3 and adenophostin A divert similar amounts of binding energy (∼6 kJ/mol) into rearranging the relationship between the IBC and SD.
Thermodynamics of Ligand Binding Analyzed by FP.
The KD for IP3 in CLM at 4°C determined in competition with FITC-IP3 is similar whether determined after 10 or 120 min from repetitive measurements of the same plate; the KD values (mean ± S.E.M.) for 10, 20, 30, 60, 90, and 120 min were 92 ± 23, 85 ± 16, 101 ± 22, 86 ± 11, 93 ± 19, and 97 ± 12 nM, respectively. This confirms the stability of the biological samples and establishes that equilibrium is attained within 10 min. A 20-min incubation was used for all subsequent analyses. To minimize variability in the thermodynamic analyses of ligand binding, we measured A from the same plate at different temperatures (4–37°C). The KD of IP3 for the NT measured at 4°C (89 ± 7 nM, n = 3) was indistinguishable from that measured after first incubating the plate at 37°C for 20 min (KD = 490 ± 40 nM) and restoring it to 4°C (KD = 86 ± 9 nM). This shows that the effects of temperature on KD are fully reversible and justifies our use of the same plate for measurements at each temperature.
Figure 4 shows FP analyses for IP3 binding to the NT and IBC at different temperatures. The results for the two full agonists, IP3 and adenophostin A (Supplemental Fig. 6), are summarized in Table 3. With rare exceptions (Hannaert-Merah et al., 1994; Li et al., 2009), most analyses of ligand binding to IP3R have been performed at 4°C and in media similar to TEM that have low ionic strength and/or high pH to maximize specific [3H]IP3 binding. Our results provide the first quantitative analysis of ligand binding to IP3R at different temperatures in cytosol-like media.
Fig. 4.

Thermodynamics of IP3 and adenophostin A binding. FP competition binding assays with FITC-IP3 (0.5 nM), IP3, and either the NT (A, 80 nM) or IBC (B, 15 nM) at the indicated temperatures. Similar analyses for adenophostin A are shown in Supplemental Fig. 6. All results are summarized in Table 3. Effects of temperature on ΔG for IP3 and adenophostin A binding to the NT and IBC (C). The lines are fitted using eq. 2 van't Hoff plots for IP3 and adenophostin A binding to the IBC and NT, where KA = 1/KD (D). All binding analyses (A–D) were performed in CLM. Results (A–D) are means ± S.E.M. from three independent experiments, each with two replicates (many error bars are smaller than the symbols).
TABLE 3.
Temperature dependence of the KD for agonist binding to the NT and IBC
FP was used to measure the KD for each ligand for the IBC and NT at the indicated temperatures in CLM. Results are means ± S.E.M., n = 3.
|
K
D
|
||||||
|---|---|---|---|---|---|---|
| 277 K | 283 K | 289 K | 296 K | 303 K | 310 K | |
| nM | ||||||
| IP3 | ||||||
| IBC | 9 ± 0.6 | 12.6 ± 1.2 | 18.4 ± 2.2 | 23.5 ± 2.0 | 31.3 ± 2.2 | 52.9 ± 4.4 |
| NT | 95 ± 7 | 119 ± 10 | 191 ± 23 | 281 ± 23 | 377 ± 38 | 490 ± 40 |
| Adenophostin A | ||||||
| IBC | 0.9 ± 0.1 | 1.3 ± 0.2 | 1.8 ± 0.3 | 1.9 ± 0.2 | 2.2 ± 0.4 | 2.6 ± 0.4 |
| NT | 8.6 ± 0.2 | 10.7 ± 0.2 | 16.6 ± 0.5 | 20.9 ± 0.3 | 27.9 ± 0.6 | 36.9 ± 3.2 |
For three of the four interactions, the relationship between ΔG and temperature was approximately linear (ΔC ∼0). But there was some curvature in the relationship for binding of adenophostin A to the IBC (ΔC >0) (Fig. 4C), perhaps suggesting increased exposure of a hydrophobic surface in the adenophostin A-IBC complex. Supplemental Table 1 provides our estimates of ΔC (derived from eq. 2), but the variances are large because calculating ΔC from the effect of temperature on KD introduces compound errors that compromise the analysis (Borea et al., 1998; Wittmann et al., 2009).
We also analyzed the data using van't Hoff plots (which assume that ΔC = 0; eq. 3) (Table 4, Fig. 4D). Estimates of ΔH and ΔS obtained by the two analyses (eqs. 2 and 3) were not significantly different (Table 4 and Supplemental Table 1). Both analyses indicate that changes in ΔS are the major component of the increased affinity of IP3 and adenophostin A for the IBC relative to the NT (Fig. 5A) and the major component of the increased affinity of adenophostin A relative to IP3 (Table 4, Fig. 5B).
TABLE 4.
Thermodynamics of IP3 and adenophostin A binding to the NT and IBC
From the effects of temperature on IP3 and adenophostin A binding to the IBC and NT in CLM (Table 3, Fig. 4, and Supplemental Fig. 6), ΔG was determined (ΔG = R · T lnKD) and thereby ΔH and ΔS (eq. 3, assuming ΔC = 0). A similar analysis in which ΔC was not fixed to 0 provided indistinguishable results (Supplemental Table 1). −TΔS is also shown for 296 K. Results are means ± S.E.M., from three separate van't Hoff plots.
| ΔG a | ΔH | ΔS | −TΔS a | |
|---|---|---|---|---|
| kJ/mol | J/mol·K | kJ/mol | ||
| IP3 | ||||
| NT | −37.1 ± 0.1 | −37.0 ± 1.1 | 0.9 ± 3.7 | −0.3 ± 1.1 |
| IBC | −43.2 ± 0.1 | −36.8 ± 0.3 | 21.3 ± 1.5 | −6.3 ± 0.4 |
| Adenophostin A | ||||
| NT | −43.5 ± 0.02 | −32.1 ± 1.1 | 35.6 ± 3.7 | −10.5 ± 1.1 |
| IBC | −49.4 ± 0.2 | −21.9 ± 1.0 | 93 ± 3.6 | −27.5 ± 1.1 |
296 K.
Fig. 5.

Differential contributions of ΔH and TΔS to IP3 and adenophostin A binding to the NT and IBC. From the results summarized in Table 4, the difference in ΔG [Δ(ΔG)], −TΔS [Δ(−TΔS)] and ΔH [Δ(ΔH)] for each ligand binding to the NT and IBC (NT-IBC) (A) and for IP3 and adenophostin A binding to each IP3R fragment (IP3-adenophostin A) (B) were calculated. Results are means ± S.E.M., n = 3.
Discussion
We have synthesized a fluorescent ligand of IP3R (FITC-IP3; Fig. 1B), demonstrated that it is a high-affinity weak partial agonist of IP3R (Fig. 1), and used it to establish an FP assay that provides a high-throughput assay for analyses of ligand binding to IP3R (Figs. 2 and 3). We have used this FP assay to examine the thermodynamics of ligand binding to the IBC and NT of IP3R (Figs. 4 and 5). We have shown by both FP and conventional competition binding assays that the IBC alone is sufficient for high-affinity binding of adenophostin A (Table 1) and that for both IP3 and adenophostin A, similar amounts of binding energy (∼6 kJ/mol) are diverted into rearranging the SD (Table 4 and Fig. 5A) (Rossi et al., 2009). Establishing the exact nature of this structural rearrangement will require high-resolution structures of the NT with and without ligand bound (see Introduction). FITC-IP3, by contrast, diverts less binding energy (∼3.3 kJ/mol) into rearranging the SD. We suggest, by analogy with our extensive analyses of other 2-O-modified analogs of IP3 (Rossi et al., 2009), that FITC-IP3 is a partial agonist because the FITC moiety blocks effective communication between the IBC and SD, causing the channel to open less effectively.
The difference in affinities of IP3 and adenophostin A for the IBC [Δ(ΔG) ∼6 kJ/mol] (Fig. 5B) is comparable with the additional stability provided by a cation-π interaction (ΔG ∼2–10 kJ/mol) (Meyer et al., 2003) and is therefore consistent with our suggestion that only adenophostin A forms a cation-π interaction with the IBC. Binding of the two ligands to the IBC also differs in the relative contribution from ΔH and TΔS. IP3 binding is largely enthalpy-driven, whereas adenophostin A binding also involves a substantial entropy gain (Table 4, Fig. 5B). It is more difficult, without comparable studies of many additional analogs of IP3 and adenophostin A, to account specifically for these different contributions of ΔH and TΔS to ligand binding. The large enthalpy change for both ligands is likely to result from bonding between the phosphate groups of the ligands and charged residues in the IBC. We can consider several possible explanations for the substantial entropy gain associated with adenophostin A binding. Although some studies have correlated cation-π interactions with favorable ΔH (Sörme et al., 2005), ab initio analyses of cation-π interactions between adenine and an Arg residue suggest that the cation pair vibrates over larger distances than do the isolated partners (Biot et al., 2003). This increase in vibrational entropy might explain, at least in part, the increased entropy gain associated with adenophostin A binding. The larger TΔS for adenophostin A relative to IP3 binding would also be consistent with the larger apolar surface of adenophostin A, causing a greater entropy gain from ligand desolvation and hydrophobic interactions during binding (Teilum et al., 2009).
Adenophostin A binds to both the IBC and NT with 10-fold greater affinity than IP3. The contributions of ΔH and TΔS for binding of IP3 and adenophostin A to the IBC are rather different. However, these contributions are more similar for the two ligands binding to the NT (Fig. 5B). This is consistent with the idea that both ligands are full agonists that bind differently but ultimately cause the channel to adopt an indistinguishable open state (Rossi et al., 2009).
Supplementary Material
Acknowledgments
We thank Dr. Nunilo Cremades (Department of Chemistry, Cambridge) for helpful discussions.
The online version of this article (available at http://molpharm.aspetjournals.org) contains supplemental material.
This work was supported by the Wellcome Trust [Grants 085295, 082837]; the Biotechnology and Biological Sciences Research Council [Grant BB/E004660]; and the Isaac Newton Trust (Cambridge).
Z.D. and A.M.Ro. contributed equally to this work.
Article, publication date, and citation information can be found at http://molpharm.aspetjournals.org.
doi:10.1124/mol.109.062596.
- IP3R
- inositol 1,4,5-trisphosphate receptor
- IBC
- IP3-binding core (residues 224–604 of IP3R1)
- SD
- suppressor domain (residues 1–223 of IP3R1)
- NT
- N-terminal (residues 1–604 of IP3R1)
- FP
- fluorescence polarization
- FITC
- fluorescein 5-isothiocyanate
- GST
- glutathione transferase
- TEAB
- triethylammonium bicarbonate
- TEM
- Tris/EDTA medium
- CLM
- Ca2+-free cytosol-like medium
- PIPES
- piperazine-N,N′-bis(2-ethanesulfonic acid)
- P o
- single channel open probability
- τo
- mean channel open time
- A
- anisotropy
- B max
- concentration of binding sites.
References
- Ames BN, Dubin DT. (1960) The role of polyamines in the neutralization of bacteriophage deoxyribonucleic acid. J Biol Chem 235:769–775 [PubMed] [Google Scholar]
- Biot C, Buisine E, Rooman M. (2003) Free-energy calculations of protein-ligand cation-π and amino-π interactions: from vacuum to proteinlike environments. J Am Chem Soc 125:13988–13994 [DOI] [PubMed] [Google Scholar]
- Boehning D, Joseph SK. (2000) Direct association of ligand-binding and pore domains in homo- and heterotetrameric inositol 1,4,5-trisphosphate receptors. EMBO J 19:5450–5459 [DOI] [PMC free article] [PubMed] [Google Scholar]
- Borea PA, Dalpiaz A, Varani K, Gilli P, Gilli G. (2000) Can thermodynamic measurements of receptor binding yield information on drug affinity and efficacy? Biochem Pharmacol 60:1549–1556 [DOI] [PubMed] [Google Scholar]
- Borea PA, Varani K, Gessi S, Gilli P, Gilli G. (1998) Binding thermodynamics at the human neuronal nicotine receptor. Biochem Pharmacol 55:1189–1197 [DOI] [PubMed] [Google Scholar]
- Borissow CN, Black SJ, Paul M, Tovey SC, Dedos SG, Taylor CW, Potter BV. (2005) Adenophostin A and analogues modified at the adenine moiety: synthesis, conformational analysis and biological activity. Org Biomol Chem 3:245–252 [DOI] [PubMed] [Google Scholar]
- Bosanac I, Alattia JR, Mal TK, Chan J, Talarico S, Tong FK, Tong KI, Yoshikawa F, Furuichi T, Iwai M, et al. (2002) Structure of the inositol 1,4,5-trisphosphate receptor binding core in complex with its ligand. Nature 420:696–700 [DOI] [PubMed] [Google Scholar]
- Bosanac I, Yamazaki H, Matsu-Ura T, Michikawa T, Mikoshiba K, Ikura M. (2005) Crystal structure of the ligand binding suppressor domain of type 1 inositol 1,4,5-trisphosphate receptor. Mol Cell 17:193–203 [DOI] [PubMed] [Google Scholar]
- Cardy TJ, Traynor D, Taylor CW. (1997) Differential regulation of types-1 and -3 inositol trisphosphate receptors by cytosolic Ca2+. Biochem J 328:785–793 [DOI] [PMC free article] [PubMed] [Google Scholar]
- Chaires JB. (2008) Calorimetry and thermodynamics in drug design. Annu Rev Biophys 37:135–151 [DOI] [PubMed] [Google Scholar]
- Chan J, Whitten AE, Jeffries CM, Bosanac I, Mal TK, Ito J, Porumb H, Michikawa T, Mikoshiba K, Trewhella J, et al. (2007) Ligand-induced conformational changes via flexible linkers in the amino-terminal region of the inositol 1,4,5-trisphosphate receptor. J Mol Biol 373:1269–1280 [DOI] [PubMed] [Google Scholar]
- Checovich WJ, Bolger RE, Burke T. (1995) Fluorescence polarization—a new tool for cell and molecular biology. Nature 375:254–256 [DOI] [PubMed] [Google Scholar]
- Foskett JK, White C, Cheung KH, Mak DO. (2007) Inositol trisphosphate receptor Ca2+ release channels. Physiol Rev 87:593–658 [DOI] [PMC free article] [PubMed] [Google Scholar]
- French T, So PT, Weaver DJ, Jr, Coelho-Sampaio T, Gratton E, Voss EW, Jr, Carrero J. (1997) Two-photon fluorescence lifetime imaging microscopy of macrophage-mediated antigen processing. J Microsc 185:339–353 [DOI] [PubMed] [Google Scholar]
- Glouchankova L, Krishna UM, Potter BV, Falck JR, Bezprozvanny I. (2000) Association of the inositol-(1,4,5) trisphosphate receptor ligand binding site with phosphatidylinositol (4,5)-bisphosphate and adenophostin A. Mol Cell Biol Res Commun 3:153–158 [DOI] [PubMed] [Google Scholar]
- Hannaert-Merah Z, Coquil JF, Combettes L, Claret M, Mauger JP, Champeil P. (1994) Rapid kinetics of myo-inositol trisphosphate binding and dissociation in cerebellar microsomes. J Biol Chem 269:29642–29649 [PubMed] [Google Scholar]
- Jameson DM, Sawyer WH. (1995) Fluorescence anisotropy applied to biomolecular interactions. Methods Enzymol 246:283–300 [DOI] [PubMed] [Google Scholar]
- Keeler J, Wothers P. (2006) Why Chemical Reactions Happen, Oxford University Press, Oxford, UK [Google Scholar]
- Kenakin TP. (1997) Pharmacologic Analysis of Drug-Receptor Interactions, Lippincott Williams & Wilkins, Philadelphia [Google Scholar]
- Li C, Chan J, Haeseleer F, Mikoshiba K, Palczewski K, Ikura M, Ames JB. (2009) Structural insights into Ca2+-dependent regulation of inositol 1,4,5-trisphosphate receptors by CaBP1. J Biol Chem 284:2472–2481 [DOI] [PMC free article] [PubMed] [Google Scholar]
- Luque I, Freire E. (1998) Structure-based prediction of binding affinities and molecular design of peptide ligands. Methods Enzymol 295:100–127 [DOI] [PubMed] [Google Scholar]
- Marwood RD, Correa V, Taylor CW, Potter BVL. (2000) Synthesis of adenophostin A. Tetrahedron Asymmetry 11:397–403 [Google Scholar]
- Meyer EA, Castellano RK, Diederich F. (2003) Interactions with aromatic rings in chemical and biological recognition. Angew Chem Int Ed Engl 42:1210–1250 [DOI] [PubMed] [Google Scholar]
- Mochizuki T, Kondo Y, Abe H, Tovey SC, Dedos SG, Taylor CW, Paul M, Potter BV, Matsuda A, Shuto S. (2006) Synthesis of adenophostin A analogues conjugating an aromatic group at the 5′-position as potent IP3 receptor ligands. J Med Chem 49:5750–5758 [DOI] [PubMed] [Google Scholar]
- Morris SA, Nerou EP, Riley AM, Potter BV, Taylor CW. (2002) Determinants of adenophostin A binding to inositol trisphosphate receptors. Biochem J 367:113–120 [DOI] [PMC free article] [PubMed] [Google Scholar]
- Motulsky H, Christopoulos A. (2003) Fitting Models to Biological Data Using Linear and Nonlinear Regression, Oxford University Press, New York [Google Scholar]
- Olsson TS, Williams MA, Pitt WR, Ladbury JE. (2008) The thermodynamics of protein-ligand interaction and solvation: insights for ligand design. J Mol Biol 384:1002–1117 [DOI] [PubMed] [Google Scholar]
- Potter BV, Lampe D. (1995) Chemistry of inositol lipid mediated cellular signaling. Angew Chem Int Ed Engl 34:1933–1972 [Google Scholar]
- Taufiq-Ur-Rahman, Skupin A, Falcke M, Taylor CW. (2009) Clustering of IP3 receptors by IP3 retunes their regulation by IP3 and Ca2+. Nature 458:655–659 [DOI] [PMC free article] [PubMed] [Google Scholar]
- Riley AM, Dozol H, Spiess B, Potter BV. (2004) 2-O-(2-aminoethyl)-myo-inositol 1,4,5-trisphosphate as a novel ligand for conjugation: physicochemical properties and synthesis of a new Ins(1,4,5)P3 affinity matrix. Biochem Biophys Res Commun 318:444–452 [DOI] [PubMed] [Google Scholar]
- Rossi AM, Riley AM, Tovey SC, Rahman T, Dellis O, Taylor EJ, Veresov VG, Potter BV, Taylor CW. (2009) Synthetic partial agonists reveal key steps in IP3 receptor activation. Nat Chem Biol 5:631–639 [DOI] [PMC free article] [PubMed] [Google Scholar]
- Serdyuk I, Zaccia N, Zaccai J. (2007) Methods in Molecular Biophysics. Structure, Dynamics and Function Cambridge University Press, Cambridge, UK [Google Scholar]
- Sörme P, Arnoux P, Kahl-Knutsson B, Leffler H, Rini JM, Nilsson UJ. (2005) Structural and thermodynamic studies on cation-π interactions in lectin-ligand complexes: high-affinity galectin-3 inhibitors through fine-tuning of an arginine-arene interaction. J Am Chem Soc 127:1737–1743 [DOI] [PubMed] [Google Scholar]
- Sureshan KM, Riley AM, Rossi AM, Tovey SC, Dedos SG, Taylor CW, Potter BV. (2009) Activation of IP3 receptors by synthetic bisphosphate ligands. Chem Commun (Camb) 2009:1204–1206 [DOI] [PMC free article] [PubMed] [Google Scholar]
- Sureshan KM, Trusselle M, Tovey SC, Taylor CW, Potter BV. (2008) 2-Position base-modified analogues of adenophostin A as high-affinity agonists of the d-myo-inositol trisphosphate receptor: in vitro evaluation and molecular modeling. J Org Chem 73:1682–1692 [DOI] [PubMed] [Google Scholar]
- Taylor CW, da Fonseca PC, Morris EP. (2004) IP3 receptors: the search for structure. Trends Biochem Sci 29:210–219 [DOI] [PubMed] [Google Scholar]
- Teilum K, Olsen JG, Kragelund BB. (2009) Functional aspects of protein flexibility. Cell Mol Life Sci 66:2231–2247 [DOI] [PMC free article] [PubMed] [Google Scholar]
- Uchida K, Miyauchi H, Furuichi T, Michikawa T, Mikoshiba K. (2003) Critical regions for activation gating of the inositol 1,4,5-trisphosphate receptor. J Biol Chem 278:16551–16560 [DOI] [PubMed] [Google Scholar]
- Vanlingen S, Sipma H, De Smet P, Callewaert G, Missiaen L, De Smedt H, Parys JB. (2000) Ca2+ and calmodulin differentially modulate myo-inositol 1,4,5-trisphosphate (IP3)-binding to the recombinant ligand-binding domains of the various IP3 receptor isoforms. Biochem J 346:275–280 [PMC free article] [PubMed] [Google Scholar]
- Weiland GA, Minneman KP, Molinoff PB. (1979) Fundamental difference between the molecular interactions of agonists and antagonists with the β-adrenergic receptor. Nature 281:114–117 [DOI] [PubMed] [Google Scholar]
- Williams DH, Stephens E, O'Brien DP, Zhou M. (2004) Understanding noncovalent interactions: ligand binding energy and catalytic efficiency from ligand-induced reductions in motion within receptors and enzymes. Angew Chem Int Ed Engl 43:6596–6616 [DOI] [PubMed] [Google Scholar]
- Wittmann HJ, Seifert R, Strasser A. (2009) Contribution of binding enthalpy and entropy to affinity of antagonist and agonist binding at human and guinea pig histamine H1-receptor. Mol Pharmacol 76:25–37 [DOI] [PubMed] [Google Scholar]
- Yoshikawa F, Morita M, Monkawa T, Michikawa T, Furuichi T, Mikoshiba K. (1996) Mutational analysis of the ligand binding site of the inositol 1,4,5-trisphosphate receptor. J Biol Chem 271:18277–18284 [DOI] [PubMed] [Google Scholar]
Associated Data
This section collects any data citations, data availability statements, or supplementary materials included in this article.