Abstract
Motivation: High-throughput data is providing a comprehensive view of the molecular changes in cancer tissues. New technologies allow for the simultaneous genome-wide assay of the state of genome copy number variation, gene expression, DNA methylation and epigenetics of tumor samples and cancer cell lines.
Analyses of current data sets find that genetic alterations between patients can differ but often involve common pathways. It is therefore critical to identify relevant pathways involved in cancer progression and detect how they are altered in different patients.
Results: We present a novel method for inferring patient-specific genetic activities incorporating curated pathway interactions among genes. A gene is modeled by a factor graph as a set of interconnected variables encoding the expression and known activity of a gene and its products, allowing the incorporation of many types of omic data as evidence. The method predicts the degree to which a pathway's activities (e.g. internal gene states, interactions or high-level ‘outputs’) are altered in the patient using probabilistic inference.
Compared with a competing pathway activity inference approach called SPIA, our method identifies altered activities in cancer-related pathways with fewer false-positives in both a glioblastoma multiform (GBM) and a breast cancer dataset. PARADIGM identified consistent pathway-level activities for subsets of the GBM patients that are overlooked when genes are considered in isolation. Further, grouping GBM patients based on their significant pathway perturbations divides them into clinically-relevant subgroups having significantly different survival outcomes. These findings suggest that therapeutics might be chosen that target genes at critical points in the commonly perturbed pathway(s) of a group of patients.
Availability:Source code available at http://sbenz.github.com/Paradigm
Contact: jstuart@soe.ucsc.edu
Supplementary information: Supplementary data are available at Bioinformatics online.
1 INTRODUCTION
A central premise in modern cancer treatment is that patient diagnosis, prognosis, risk assessment and treatment response prediction can be improved by stratification of cancers based on genomic, transcriptional and epigenomic characteristics of the tumor alongside relevant clinical information gathered at the time of diagnosis (e.g. patient history, tumor histology and stage) as well as subsequent clinical follow-up data (e.g. treatment regimens and disease recurrence events). While several high-throughput technologies have been available for probing the molecular details of cancer, only a handful of successes have been achieved based on this paradigm. For example, 25% of breast cancer patients presenting with a particular amplification or overexpression of the ERBB2 growth factor receptor tyrosine kinase can now be treated with trastuzumab, a monoclonal antibody targeting the receptor (Vogel et al., 2001). However, even this success story is clouded by the fact that <50% of patients with ERBB2-positive breast cancers actually achieve any therapeutic benefit from trastuzumab, emphasizing our incomplete understanding of this well-studied oncogenic pathway and the many therapeutic-resistant mechanisms intrinsic to ERBB2-positive breast cancers (Park et al., 2008). This overall failure to translate modern advances in basic cancer biology is in part due to our inability to comprehensively organize and integrate all of the omic features now technically acquirable on virtually any type of cancer. Despite overwhelming evidence that histologically similar cancers are in reality a composite of many molecular subtypes, each with significantly different clinical behavior, this knowledge is rarely applied in practice due to the lack of robust signatures that correlate well with prognosis and treatment options.
Cancer is a disease of the genome that is associated with aberrant alterations that lead to disregulation of the cellular system. What is not clear is how genomic changes feed into genetic pathways that underlie cancer phenotypes. High-throughput functional genomics investigations have made tremendous progress in the past decade (Alizadeh et al., 2000; Golub et al., 1999; van de Vijver et al., 2002). However, the challenges of integrating multiple data sources to identify reproducible and interpretable molecular signatures of tumorigenesis and progression remain elusive. Recent pilot studies by TCGA and others (Parsons et al., 2008; TCGA, 2008) make it clear that a pathway-level understanding of genomic perturbations is needed to understand the changes observed in cancer cells. These findings demonstrate that even when patients harbor genomic alterations or aberrant expression in different genes, these genes often participate in a common pathway. In addition, and even more striking, is that the alterations observed (e.g. deletions versus amplifications) often alter the pathway output in the same direction, either all increasing or all decreasing the pathway activation.
Approaches for interpreting genome-wide cancer data have focused on identifying gene expression profiles that are highly correlated with a particular phenotype or disease state, and have led to promising results (Allison et al., 2006; Dudoit and Fridlyand, 2002; Tusher et al., 2001). Methods using analysis of variance (Kerr et al., 2000), false-discovery (Storey and Tibshirani, 2003) and non-parametric methods (Troyanskaya et al., 2002) have been proposed.
Several pathway-level approaches use statistical tests based on overrepresentation of genesets to detect whether a pathway is perturbed in a disease condition. In these approaches, genes are ranked based on their degree of differential activity, for example, as detected by either differential expression or copy number alteration. A probability score is then assigned reflecting the degree to which a pathway's genes rank near the extreme ends of the sorted list, such as is used in gene set enrichment analysis (GSEA) (Subramanian et al., 2005). Other approaches include using a hypergeometric test-based method to identify Gene Ontology (Ashburner et al., 2000) or MIPS mammalian protein–protein interaction (Pagel et al., 2005) categories enriched in differentially expressed genes (Tamayo et al., 1999).
Overrepresentation analyses are limited in their efficacy because they do not incorporate known interdependencies among genes in a pathway that can increase the detection signal for pathway relevance. In addition, they treat all gene alterations as equal, which is not expected to be valid for many biological systems. Because of these factors, overrepresentation analyses often miss functionally-relevant pathways whose genes have borderline differential activity. They can also produce many false positives when only a single gene is highly altered in a small pathway.
Our collective knowledge about the detailed interactions between genes and their phenotypic consequences is growing rapidly. While the knowledge was traditionally scattered throughout the literature and hard to access systematically, new efforts are cataloging pathway knowledge into publicly available databases. Some of the databases that include pathway topology are Reactome (Joshi-Tope et al., 2005), KEGG (Ogata et al., 1999), and the National Cancer Institute (NCI) Pathway Interaction Database(PID). Updates to these databases are expected to improve our understanding of biological systems by explicitly encoding how genes regulate and communicate with one another. A key hypothesis is that the interaction topology of these pathways can be exploited for the purpose of interpreting high-throughput datasets.
Until recently, few computational approaches were available for incorporating pathway knowledge to interpret high-throughput datasets. However, several newer approaches (Efroni et al., 2007) have been proposed that incorporate pathway topology. One approach, called signaling pathway impact analysis (SPIA) (Tarca et al., 2009), uses a method analogous to Google's PageRank to determine the influence of a gene in a pathway. In SPIA, more influence is placed on genes that link out to many other genes. SPIA was successfully applied to different cancer datasets (lung adenocarcinoma and breast cancer) and shown to outperform overrepresentation analysis and GSEA for identifying pathways known to be involved in these cancers. While SPIA represents a major step forward in interpreting cancer datasets using pathway topology, it is limited to using only a single type of genome-wide data. New computational approaches are needed to connect multiple genomic alterations such as copy number, DNA methylation, somatic mutations, mRNA expression and microRNA expression. Integrated pathway analysis is expected to increase the precision and sensitivity of causal interpretations for large sets of observations since no single data source is likely to provide a complete picture on its own.
In the past several years, approaches in probabilistic graphical models (PGMs) have been developed for learning causal networks compatible with multiple levels of observations. Efficient algorithms are available to learn pathways automatically from data (Friedman and Goldszmidt, 1997; Murphy et al., 1999) and are well adapted to problems in genetic network inference (Friedman, 2004). As an example, graphical models have been used to identify sets of genes that form ‘modules’ in cancer biology (Segal et al., 2005). They have also been applied to elucidate the relationship between tumor genotype and expression phenotypes (Lee et al., 2006), and infer protein signal networks (Sachs et al., 2005) and recombinatorial gene regulatory code (Beer and Tavazoie, 2004). In particular, factor graphs have been used to model expression data (Gat-Viks et al., 2005; Gat-Viks and Shamir, 2007; Gat-Viks et al., 2006).
We describe a PGM framework based on factor graphs (Kschischang et al., 2001) that can integrate any number of genomic and functional genomic datasets to infer the molecular pathways altered in a patient sample. We tested the model using copy number variation and gene expression data for both a glioblastoma and breast cancer dataset. The activities inferred using a structured pathway model successfully stratify the glioblastoma patients into clinically-relevant subtypes. The results suggest that the pathway-informed inferences are more informative than using gene-level data in isolation. In addition to providing better prognostics and diagnostics, integrated pathway activations offer important clues about potential therapeutics that could be used to abrogate disease progression.
2 METHODS
2.1 Data sources
Breast cancer copy number data from Chin et al. (2007) was obtained from NCBI Gene Expression Omnibus (GEO) under accessions GPL5737 with associated array platform annotation from GSE8757. Probe annotations were converted to BED15 format for display in the UCSC Cancer Genomics Browser (Zhu et al., 2009) and subsequent analysis. Array data were mapped to probe annotations via probe ID. Matched expression data from Naderi et al. (2007) was obtained from MIAMIExpress at EBI using accession number E-UCon-1. Platform annotation information for Human1A (V2) was obtained from the Agilent website. Expression data was probe-level median-normalized and mapped via probe ID to HUGO gene names. All data were non-parametrically normalized using a ranking procedure including all sample-probe values and each gene-sample pair was given a signed P-value based on the rank. A maximal P-value of 0.05 was used to determine gene-samples pairs that were significantly altered. The glioblastoma data from TCGA (2008) was obtained from the TCGA data portal providing gene expression for 230 patient samples and 10 adjacent normal tissues on the Affymetrix U133A platform. The probes for the patient samples were normalized to the normal tissue by subtracting the median normal value of each probe. In addition, CBS segmented (Olshen et al., 2004) copy number data for the same set of patients were obtained. Both datasets were non-parametrically normalized using the same procedure as the breast cancer data.
2.2 Pathway compendium
We collected the set of curated pathways available from the (NCI PID) (Schaefer et al., 2009). Each pathway represents a set of interactions logically grouped together around high-level biomolecular processes describing intrinsic and extrinsic sub-cellular-, cellular-, tissue- or organism-level events and phenotypes. BioPAX (BioPAX working group, 2004) level 2 formatted pathways were downloaded on September 15, 2009. All entities and interactions were extracted with Simple Protocol and RDF Query Language (SPARQL) queries using the Rasqal RDF engine.
We extracted five different types of biological entities including three physical entities (protein-coding genes, small molecules and complexes), gene families and abstract processes. A gene family was created whenever the cross-reference for a BioPAX protein listed proteins from distinct genes. Gene families represent collections of genes in which any single gene is sufficient to perform a specific function. For example, homologs with redundant roles and genes found to functionally compensate for one another are combined into families. The extraction produced a list of every entity and interaction used in the pathway with annotations describing their different types. We also extracted abstract processes, such as ‘apoptosis,’ that refer to general processes that can be found in the NCI collection. For example, pathways detailing the interactions involving the p53 tumor suppressor gene include links into apoptosis and senescence that can be leveraged as features for machine-learning classification.
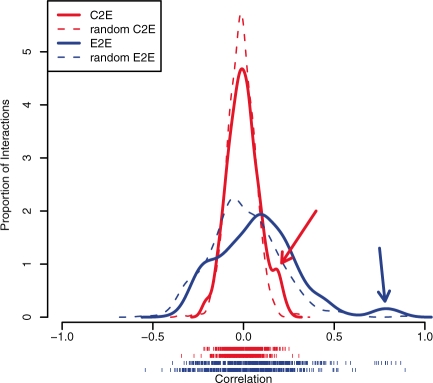
One hypothesis of pathway-based approaches is that the genetic interactions found in pathway databases carry information for interpreting correlations between gene expression changes detected in cancer. For example, if a cancer-related pathway includes a link from a transcriptional activator A to a target gene T, we expect the expression of A to be positively correlated with the expression of T (E2E correlation). Likewise, we also expect a positive correlation between A's copy number and T's expression (C2E correlation). Further, we expect C2E correlation to be weaker than E2E correlation because amplification in A does not necessarily imply A is expressed at higher levels, which in turn is necessary to upregulate B. In this way, each link in a pathway provides an expectation about the data; pathways with many consistent links may be relevant for further consideration. We tested these assumptions and found that the NCI pathways contain many interactions predictive of the recent TCGA GBM data (The TCGA research network 2008) (Fig. 1). As expected, C2E correlations were moderate, but had a striking enrichment for positive correlations among activating interactions than expected by chance (Fig. 1). E2E correlations were even stronger and similarly enriched. Thus, even in this example of a cancer that has eluded characterization, a significant subset of pathway interactions connect genomic alterations to modulations in gene expression, supporting the idea that a pathway-level approach is worth pursuing.
Fig. 1.
NCI Pathway interactions in TCGA GBM data. For all (n=462) pairs where A was found to be an upstream activator of gene B in NCI-Nature Pathway Database, the Pearson correlation (x-axis) computed from the TCGA GBM data was calculated in two different ways. The histogram plots the correlations between the A's copy number and B's expression (C2E, solid red) and between A's expression and B's expression (E2E, blue). A histogram of correlations between randomly paired genes is shown for C2E (dashed red) and E2E (dashed blue). Arrows point to the enrichment of positive correlations found for the C2E (red) and E2E (blue) correlation.
2.3 PARADIGM model
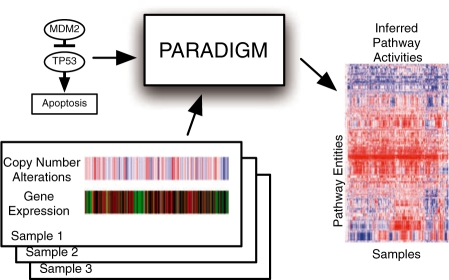
We developed an approach called PARADIGM (PAthway Recognition Algorithm using Data Integration on Genomic Models) to infer the activities of genetic pathways from integrated patient data. Figure 2 illustrates the overview of the approach. Multiple genome-scale measurements on a single patient sample are combined to infer the activities of genes, products and abstract process inputs and outputs for a single NCI pathway. PARADIGM produces a matrix of integrated pathway activities (IPAs) A where Aij represents the inferred activity of entity i in patient sample j. The matrix A can then be used in place of the original constituent datasets to identify associations with clinical outcomes.
Fig. 2.
Overview of the PARADIGM method. PARADIGM uses a pathway schematic with functional genomic data to infer genetic activities that can be used for further downstream analysis.
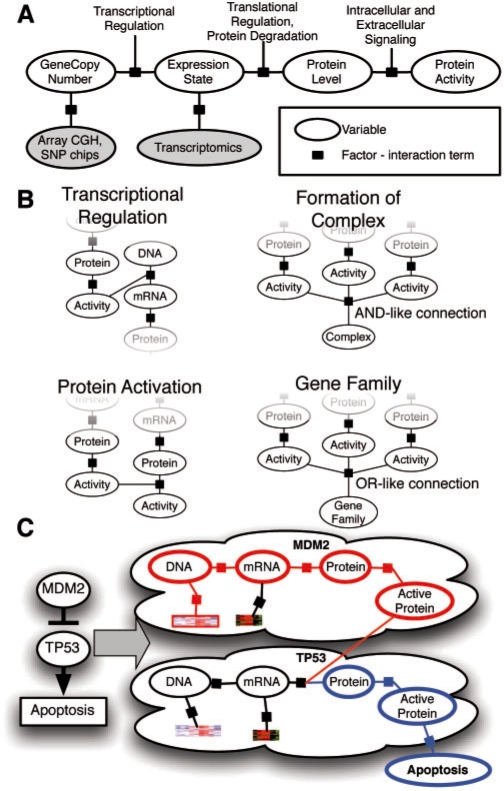
We first convert each NCI pathway into a distinct probabilistic model. A toy example of a small fragment of the p53 apoptosis pathway is shown in Figure 3. A pathway diagram from NCI was converted into a factor graph that includes both hidden and observed states. The factor graph integrates observations on gene- and biological process-related state information with a structure describing known interactions among the entities.
Fig. 3.
Conversion of a genetic pathway diagram into a PARADIGM model. A. Data on a single patient is integrated for a single gene using a set of four different biological entities for the gene describing the DNA copies, mRNA and protein levels, and activity of the protein. B. PARADIGM models various types of interactions across genes including transcription factors to targets (upper-left), subunits aggregating in a complex (upper-right), post-translational modification (lower-left) and sets of genes in a family performing redundant functions (lower-right). C. Toy example of a small sub-pathway involving P53, an inhibitor MDM2, and the high level process, apoptosis as represented in the model.
To represent a biological pathway with a factor graph, we use variables to describe the states of entities in a cell, such as a particular mRNA or complex, and use factors to represent the interactions and information flow between these entities. These variables represent the differential state of each entity in comparison with a ‘control’ or normal level rather than the direct concentrations of the molecular entities. This representation allows us to model many high-throughput datasets, such as gene expression detected with DNA microarrays, that often either directly measure the differential state of a gene or convert direct measurements to measurements relative to matched controls. It also allows for many types of regulatory relationships among genes. For example, the interaction describing MDM2 mediating ubiquitin-dependent degradation of p53 can be modeled as activated MDM2 inhibiting p53's protein level.
The factor graph encodes the state of a cell using a random variable for each entity X={x1, x2,…, xn} and a set of m non-negative functions, or factors, that constrain the entities to take on biologically meaningful values as functions of one another. The j-th factor ϕj defines a probability distribution over a subset of entities Xj⊂X. The entire graph of entities and factors encodes the joint probability distribution over all of the entities as:
| (1) |
where Z=∏j ∑S⊏Xj ϕj(S) is a normalization constant and S ⊏ X denotes that S is a ‘setting’ of the variables in X.
Each entity can take on one of three states corresponding to activated, nominal or deactivated relative to a control level (e.g. as measured in normal tissue) and encoded as 1, 0 or −1 respectively. The states may be interpreted differently depending on the type of entity (e.g. gene, protein, etc). For example, an activated mRNA entity represents overexpression, while an activated genomic copy entity represents more than two copies that are present in the genome. Figure 3 shows the conceptual model of the factor graph for a single protein-coding gene. For each protein-coding gene G in the pathway, entities are introduced to represent the copy number of the genome (GDNA), mRNA expression (GmRNA), protein level (Gprotein) and protein activity (Gactive) (ovals labeled ‘DNA’, ‘mRNA’, ‘protein’ and ‘active’ in Fig. 3). For every compound, protein complex, gene family and abstract process in the pathway, we include a single variable with molecular type ‘active.’ While the example in Figure 3 shows only one process variable (‘Apoptosis’), in reality pathways can have several, representing various descriptions of cellular state ranging from inputs (e.g. ‘DNA damage’) to outputs (e.g. ‘Apoptosis’ and ‘Senescence’) of gene activity.
In order to simplify the construction of factors, we first convert the pathway into a directed graph, with each edge in the graph labeled with either positive or negative influence. First, for every protein coding gene G, we add edges with a label ‘positive’ from GDNA to GmRNA, from GmRNA to Gprotein and from Gprotein to Gactive to reflect the expression of the gene from its number of copies to the presence of an activated form of its protein product. Every interaction in the pathway is converted to a single edge in the directed graph.
Using this directed graph, we then construct a list of factors to specify the factor graph. For every variable xi, we add a single factor ϕ(Xi), where Xi={xi}∪{Parents(xi)} and Parents(xi) refers to all the parents of xi in the directed graph. The value of the factor for a setting of all values is dependent on whether xi is in agreement with its expected value due to the settings of Parents(xi). For this study, the expected value was set to the majority vote of the parent variables. If a parent is connected by a positive edge it contributes a vote of +1 times its own state to the value of the factor. Conversely, if the parent is connected by a negative edge, then the variable votes −1 times its own state. The variables connected to xi by an edge labeled ‘minimum’ get a single vote, and that vote's value is the minimum value of these variables, creating an AND-like connection. Similarly the variables connected to xi by an edge labeled ‘maximum’ get a single vote, and that vote's value is the maximum value of these variables, creating an OR-like connection. Votes of zero are treated as abstained votes. If there are no votes the expected state is zero. Otherwise, the majority vote is the expected state, and a tie between 1 and −1 results in an expected state of −1 to give more importance to repressors and deletions.
Given this definition of expected state, ϕi(xi, Parents(xi)) is specified as:
For the results shown here, ϵ was set to 0.001, but orders of magnitude differences in the choice of epsilon did not significantly affect results.
Finally, we add observation variables and factors to the factor graph to complete the integration of pathway and multi-dimensional functional genomics data (Fig. 3). Each discretized functional genomics dataset is associated with one of the molecular types of a protein-coding gene. Array CGH/SNP estimates of copy number alteration are associated with the ‘genome’ type. Gene expression data is associated with the ‘mRNA’ type. Though not presented in the results here, future expansion will include DNA methylation data with the ‘mRNA’ type, and proteomics and gene-resequencing data with the ‘protein’ and ‘active’ types. Each observation variable is also ternary valued. The factors associated with each observed type of data are shared across all entities and learned from the data, as described next.
2.4 Inference and parameter estimation
Let the set of assignments D={x1=s1, x2=s2,…, xk=sk} represent a complete set of data for a patient on the observed variables indexed 1 through k. Let {S⊏D X} represent the set of all possible assignments to a set of variables X that are consistent with the assignments in D; i.e. any observed variable xi is fixed to its assignment in D while hidden variables may vary.
Given patient data, we would like to estimate whether a particular hidden entity xi is likely to be in state a. For example, how likely TP53's protein activity is −1 (inactivated) or ‘Apoptosis’ is+1 (activated). To do this, we first compute the prior probability of the event prior to observing the patient's data. If Ai(a) represents the singleton assignment set {xi=a} and Φ is the fully specified factor graph, this prior probability is:
| (2) |
where Z is the normalization constant introduced in Equation (1). Similarly, the probability that xi is in state a along with all of the observations made for the patient is:
| (3) |
For the majority of pathways, we use the junction tree inference algorithm with HUGIN updates to infer the probabilities in equations. For pathways that take longer than 3 s of inference per patient, we use Belief Propagation with sequential updates, a convergence tolerance of 10−9, and a maximum of 10 000 iterations. All inference was performed in the real domain, as opposed to the log domain, and was performed with libDAI (Mooij, 2009).
To learn the parameters of the observation factors we use the expectation-maximization (EM) algorithm (Dempster et al., 1977). Briefly, EM learns parameters in models with hidden variables by iterating between inferring the probabilities of hidden variables and changing parameters to maximize the likelihood given the probabilities of the hidden variables. To perform EM, we extended the libDAI library; the contributed code is now available as part of the open source distribution. For each pathway, we created a factor graph for each patient, applied the patient's data and ran EM until the likelihood changed <0.1%. We averaged the parameters learned from each pathway, and then used these parameters to calculate final posterior beliefs for each variable.
After inference, we output an IPA for each variable that has an ‘active’ molecular type. We compute a log-likelihood ratio using the quantities from equations 2 and 3 that reflects the degree to which a patient's data increases our belief that entity i's activity is up or down:
 |
(4) |
We then compute a single IPA for gene i based on the log-likelihood ratio as:
| (5) |
Intuitively, the IPA score is a signed analog of the log-likelihood ratio, L. If the gene is more likely to be activated, the IPA is set to L. Alternatively, if the gene is more likely to be inactivated, the IPA is set to −L and 0 otherwise. Because each pathway is analyzed independently of other pathways, a gene can be associated with multiple inferences, one for each pathway in which it appears. Differing inferences for the same gene can be viewed as alternative interpretations of the data as a function of the gene's pathway context.
2.5 Significance assessment
We assess the significance of IPA scores by two different permutations of the data. For the ‘within’ permutation, a permuted data sample is created by choosing a new tuple of data (i.e. matched gene expression and gene copy number) first by choosing a random real sample, and then by choosing a random gene from within the same pathway, until tuples have been chosen for each gene in the pathway. For the ‘any’ permutation, the procedure is the same, but the random gene selection step could choose a gene from anywhere in the genome. For both permutation types, 1000 permuted samples are created, and the perturbation scores for each permuted sample is calculated. The distribution of perturbation scores from permuted samples is used as a null distribution to estimate the significance of true samples.
2.6 SPIA
SPIA from Tarca et al. (2009) was implemented in C to reduce runtime and to be compatible with our analysis environment. We also added the ability to offer more verbose output so that we could directly compare SPIA and PARADIGM outputs. Our version of SPIA can output the accumulated perturbation and the perturbation factor for each entity in the pathway. This code is available upon request.
2.7 Decoy pathways
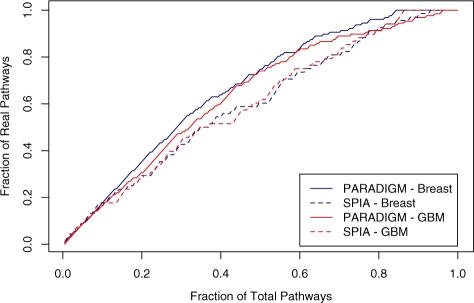
A set of decoy pathways was created for each cancer dataset. Each NCI pathway was used to create a decoy pathway which consisted of the same structure but where every gene in the pathway was substituted for a random gene in RefGene. All complexes and abstract processes were kept the same and the significance analysis for both PARADIGM and SPIA was run on the set of pathways containing both real and decoy pathways. The pathways were ranked within each method and the fraction of real versus total pathways was computed and visualized.
2.8 Clustering and Kaplan–Meier analysis
Uncentered correlation hierarchical clustering with centroid linkage was performed on the glioblastoma data using the methods from Eisen et al. (1998). Only IPAs with a signal of at least 0.25 across 75 patient samples were used in the clustering. By visual inspection, four obvious clusters appeared and were used in the Kaplan–Meier analysis. The Kaplan–Meier curves were computed using R and P-values were obtained via the log-rank statistic.
3 RESULTS
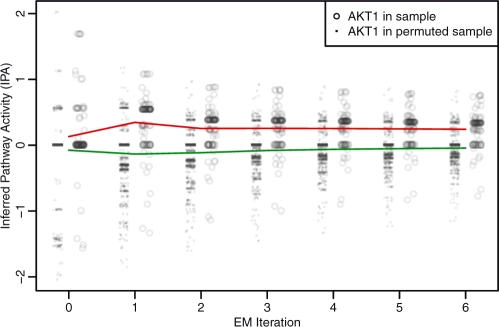
To assess the quality of the EM training procedure, we compared the convergence of EM using the actual patient data relative to a null dataset in which tuples of gene expression and copy number (E,C) were permuted across the genes and patients. As expected, PARADIGM converged much more quickly on the true dataset relative to the null. As an example, we plotted the IPAs for the gene AKT1 as a function of the EM iteration (Fig. 4). One can see that the activities quickly converge in the first couple of iterations. EM quickly converged to an activated level when trained with the actual patient data, whereas it converged to an unchanged activity when given random data. The convergence suggests that the pathway structures and inference are able to successfully identify patterns of activity in the integrated patient data.
Fig. 4.
Learning parameters for AKT1. IPAs are shown at each iteration of the EM algorithm until convergence. Dots show IPAs from permuted samples and circles show IPAs from real samples. The red line denotes the mean IPA in real samples and the green line denotes the mean IPA of null samples.
We next ran PARADIGM on both breast cancer and GBM cohorts. We developed a statistical simulation procedure to determine which IPAs are significantly different than what would be expected from a negative distribution. We constructed the negative distribution by permuting across all of the patients and across the genes in the pathway. Empirically, we found that permuting only among genes in the pathway was necessary to help correct for the fact that each gene has a different topological context determined by the network. In the breast cancer dataset, 56 172 IPAs (7% of the total) were found to be significantly higher or lower than the matched negative controls. On average, NCI pathways had 497 significant entities per patient and 103 out of 127 pathways had at least one entity altered in 20% or more of the patients. In the GBM dataset, 141 682 IPAs (9% of the total) were found to be significantly higher or lower than the matched negative controls. On average, NCI pathways had 616 significant entities per patient and 110 out of 127 pathways had at least one entity altered in 20% or more of the patients.
As another control, we asked whether the integrated activities could be obtained from arbitrary genes connected in the same way as the genes in the NCI pathways. To do this, we estimated the false discovery rate and compared it with SPIA (Tarca et al., 2009). Because many genetic networks have been found to be implicated in cancer, we chose to use simulated ‘decoy’ pathways as a set of negative controls. For each NCI pathway, we constructed a decoy pathway by connecting random genes in the genome together using the same network structure as the NCI pathway. We then ran PARADIGM and SPIA to derive IPAs for both the NCI and decoy pathways. For PARADIGM, we ranked each pathway by the number of IPAs found to be significant across the patients after normalizing by the pathway size. For SPIA, pathways were ranked according to their computed impact factor.
We found that PARADIGM excludes more decoy pathways from the top-most activated pathways compared with SPIA (Fig. 5). For example, in breast cancer, PARADIGM ranks 1 decoy in the top 10, 2 in the top 30 and 4 in the top 50. In comparison, SPIA ranks 3 decoys in the top 10, 12 in the top 30 and 22 in the top 50. The overall distribution of ranks for NCI IPAs are higher in PARADIGM than in SPIA, observed by plotting the cumulative distribution of the ranks (P<0.009, Kolmogorov-Smirnov test).
Fig. 5.
Distinguishing decoy from real pathways with PARADIGM and SPIA. Decoy pathways were created by assigning a new gene name to each gene in a pathway. PARADIGM and SPIA were then used to compute the perturbation of every pathway. Each line shows the receiver-operator characteristic for distinguishing real from decoy pathways using the perturbation ranking. In breast cancer, the areas under the curve (AUCs) are 0.669 and 0.602 for PARADIGM and SPIA, respectively. In GBM, the AUCs are 0.642 and 0.604, respectively.
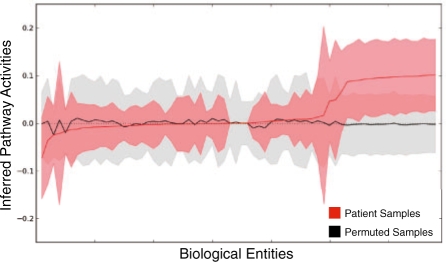
We sorted the NCI pathways according to their average number of significant IPAs per entity detected by our permutation analysis and tabulated the top 15 in breast cancer (Table 1) and GBM (Table 2). Several pathways among the top 15 have been previously implicated in their respective cancers. In breast cancer, both SPIA and PARADIGM were able to detect the estrogen- and ErbB2-related pathways. In a recent major meta-analysis study, authors from Wirapati et al. (2008) found that estrogen receptor and ErbB2 status were two of only three key prognostic signatures in breast cancer. PARADIGM was also able to identify an AKT1-related PI3K signaling pathway as the top-most pathway with significant IPAs in several samples (Fig. 6). The anti-apoptotic AKT1 serine–threonine kinase is known to be involved in breast cancer and interacts with the ERBB2 pathway (Ju et al., 2007). In GBM, both FOXM1 and HIF-1-alpha transcription factor networks have been studied extensively and shown to be overexpressed in high-grade glioblastomas versus lower-grade gliomas (Liu et al., 2006; Semenza, 2000).
Table 1.
Top PARADIGM pathways in breast cancer
| Rank | Name | Avg.a | SPIA?b |
|---|---|---|---|
| 1 | Class I PI3K signaling events mediated by Akt | 20.7 | No |
| 2 | Nectin adhesion pathway | 14.1 | No |
| 3 | Insulin-mediated glucose transport | 13.8 | No |
| 4 | ErbB2/ErbB3 signaling events | 12.1 | Yes |
| 5 | p75(NTR)-mediated signaling | 11.5 | No |
| 6 | HIF-1-alpha transcription factor network | 10.7 | No |
| 7 | Signaling events mediated by PTP1B | 10.7 | No |
| 8 | Plasma membrane estrogen receptor signaling | 10.6 | Yes |
| 9 | TCR signaling in naive CD8+ T cells | 10.6 | No |
| 10 | Angiopoietin receptor Tie2-mediated signaling | 10.1 | No |
| 11 | Class IB PI3K non-lipid kinase events | 10.0 | No |
| 13 | Osteopontin-mediated events | 9.9 | Yes |
| 12 | IL4-mediated signaling events | 9.8 | No |
| 14 | Endothelins | 9.8 | No |
| 15 | Neurotrophic factor-mediated Trk signaling | 9.7 | No |
aAverage number of samples in which significant activity was detected per entity.
bYes if the pathway was also ranked in SPIA's top 15; No otherwise.
Table 2.
Top PARADIGM pathways in GBM
| Rank | Name | Avg.a | SPIA?b |
|---|---|---|---|
| 1 | Signaling by Ret tyrosine kinase | 46.0 | No |
| 2 | Signaling events activated by Hepatocyte GFR | 43.7 | No |
| 3 | Endothelins | 42.5 | Yes |
| 4 | Arf6 downstream pathway | 42.3 | No |
| 5 | Signaling events mediated by HDAC Class III | 36.3 | No |
| 6 | FOXM1 transcription factor network | 35.9 | Yes |
| 7 | IL6-mediated signaling events | 33.2 | No |
| 8 | FoxO family signaling | 31.3 | No |
| 9 | LPA receptor mediated events | 30.7 | Yes |
| 10 | ErbB2/ErbB3 signaling events | 30.1 | No |
| 11 | Signaling mediated by p38-alpha and p38-beta | 28.1 | No |
| 12 | HIF-1-alpha transcription factor network | 27.6 | Yes |
| 13 | Non-genotropic Androgen signaling | 27.3 | No |
| 14 | p38 MAPK signaling pathway | 27.2 | No |
| 15 | IL2 signaling events mediated by PI3K | 26.9 | No |
aAverage number of samples in which significant activity was detected per entity.
bYes if the pathway was also ranked in SPIA's top 15; No otherwise.
Fig. 6.
Patient sample IPAs compared with ‘within’ permutations for Class I PI3K signaling events mediated by Akt in breast cancer. Biological entities were sorted by mean IPA in the patient samples (red) and compared with the mean IPA for the permuted samples. The colored areas around each mean denote the of SD each set. IPA's on the right include AKT1, CHUK and MDM2.
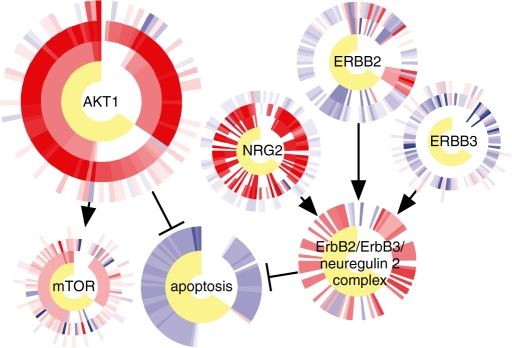
To visualize the results of PARADIGM inference, we developed a ‘CircleMap’ visualization to display multiple datasets centered around each gene in a pathway (Fig. 7). In this display, each gene is associated with all of its data across the cohort by plotting concentric rings around the gene, where each ring corresponds to a single type of measurement or computational inference. Each tick in the ring corresponds to a single patient sample while the color corresponds to activated (red), deactivated (blue) or unchanged (white) levels of activity. We plotted CircleMaps for a subset of the ErbB2 pathway and included ER status, IPAs, expression and copy number data from the breast cancer cohort.
Fig. 7.
CircleMap display of the ErbB2 pathway. For each node, ER status, IPAs, expression data and copy-number data are displayed as concentric circles, from innermost to outermost, respectively. The apoptosis node and the ErbB2/ErbB3/neuregulin 2 complex node have circles only for ER status and for IPAs, as there are no direct observations of these entities. Each patient's data is displayed along one angle from the circle center to edge.
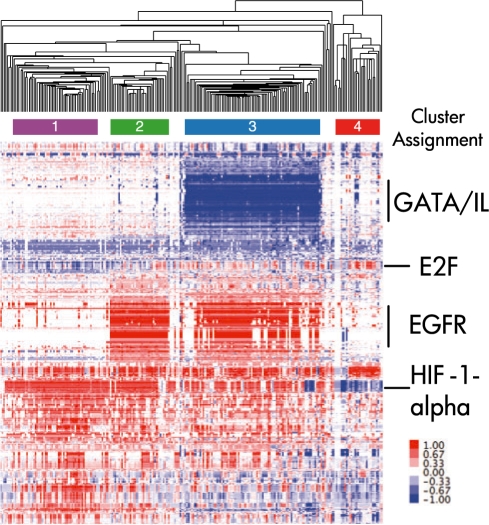
Gene expression data have been used successfully to define molecular subtypes for various cancers. Cancer subtypes have been found that correlate with different clinical outcomes such as drug sensitivity and overall survival. We asked whether we could identify informative subtypes for GBM using PARADIGM IPAs rather than the raw expression data. The advantage of using IPAs is that they provide a summarization of copy number, expression and known interactions among the genes and may therefore provide more robust signatures for elucidating meaningful patient subgroups. We first determined all IPAs that were at least moderately recurrently activated across the GBM samples and found that 1755 entities had IPAs of 0.25 in at least 75 of the 229 samples. We collected all of the IPAs for these entities in an activity matrix. The samples and entities were then clustered using hierarchical clustering with uncentered Pearson correlation and centroid linkage (Fig. 8). Visual inspection revealed four obvious subtypes based on the IPAs with the fourth subtype clearly distinct from the first three.
Fig. 8.
Clustering of IPAs for TCGA GBM. Each column corresponds to a single sample, and each row to a biomolecular entity. Color bars beneath the hierarchical clustering tree denote clusters used for Figure 9.
The fourth cluster exhibits clear downregulation of HIF-1-alpha transcription factor network as well as overexpression of the E2F transcription factor network. HIF-1-alpha is a master transcription factor involved in regulation of the response to hypoxic conditions. In contrast, two of the first three clusters have elevated EGFR signatures and an inactive MAP kinase cascade involving the GATA interleukin transcriptional cascade. Interestingly, mutations and amplifications in EGFR have been associated with high grade gliomas as well as glioblastomas (Kuan et al., 2001). Amplifications and certain mutations can create a constitutively active EGFR either through self stimulation of the dimer or through ligand-independent activation. The constitutive activation of EGFR may promote oncogenesis and progression of solid tumors. Gefitinib, a molecule known to target EGFR, is currently being investigated for its efficacy in other EGFR-driven cancers. Thus, qualitatively, the clusters appeared to be honing in on biologically meaningful themes that can stratify patients.
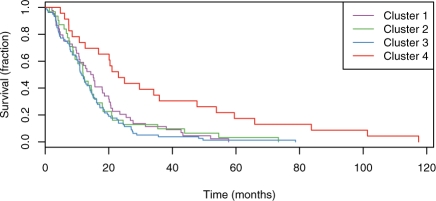
To quantify these observations, we asked whether the different GBM subtypes identified by PARADIGM coincided with different survival profiles. We calculated Kaplan–Meier curves for each of the four clusters by plotting the proportion of patients surviving versus the number of months after initial diagnosis. We plotted Kaplan–Meier survival curves for each of the four clusters to see if any cluster associated with a distinct IPA signature was predictive of survival outcome (Fig. 9). The fourth cluster is significantly different from the other clusters (P < 2.11 × 10⁻⁵; Cox proportional hazards test). Half of the patients in the first three clusters survive past 18 months; the survival is significantly increased for cluster 4 patients where half survive past 30 months. In addition, over the range of 20–40 months, patients in cluster 4 are twice as likely to survive as patients in the other clusters.
Fig. 9.
Kaplan-Meier survival plots for the clusters from Figure 8.
The survival analysis revealed that the patients in cluster 4 have a significantly better survival profile. Cluster 4 was found to have an upregulation of E2F, which acts with the retinoblastoma tumor suppressor. Upregulation of E2F is therefore consistent with an active suppression of cell cycle progression in the tumor samples from the patients in cluster 4. In addition, cluster 4 was associated with an inactivity of the HIF-1-alpha transcription factor. The inactivity in the fourth cluster may be a marker that the tumors are more oxygenated, suggesting that they may be smaller or newer tumors. Thus, PARADIGM IPAs provide a meaningful set of profiles for delineating subtypes with markedly different survival outcomes.
For comparison, we also attempted to cluster the patients using only expression data or CNA data to derive patient subtypes. No obvious groups were found from clustering using either of these data sources, consistent with the findings in the original TCGA analysis of this dataset (TCGA, 2008), (Supplementary Fig. 1). This suggests that the interactions among genes and resulting combinatorial outputs of individual gene expression may provide a better predictor of such a complex phenotype as patient outcome.
4 DISCUSSION
The PARADIGM method integrates diverse high-throughput genomics information with known signaling pathways to provide patient-specific genomic inferences on the state of gene activities, complexes and cellular processes. The core of the method uses a factor graph to leverage inference for combining the various data sources. The use of such inferences in place of, or in conjunction with, the original high-throughput datasets improves our ability to classify samples into clinically relevant subtypes. Clustering the GBM patients based on the PARADIGM-integrated activities revealed patient subtypes correlated with different survival profiles. In contrast, clustering the samples either using the expression data or the copy-number data did not reveal any significant clusters in the dataset.
PARADIGM produces pathway inferences of significantly altered gene activities in tumor samples from both GBM and breast cancer. Compared to a competing pathway activity inference approach called SPIA, our method identifies altered activities in cancer-related pathways with fewer false-positives.
For computational efficiency, PARADIGM currently uses the NCI pathways as is. While it infers hidden quantities using EM, it makes no attempt to infer new interactions not already present in an NCI pathway. One can imagine expanding the approach to introduce new interactions that increase the likelihood function. While this problem is intractable in general, heuristics such as structural EM (Friedman and Goldszmidt, 1997) can be used to identify interactions using computational search strategies. Rather than searching for novel connections de novo one could speed up the search significantly by proposing interactions derived from protein–protein interaction maps or gene pairs correlated in a significant number of expression datasets.
The power of the pathway-based approach is that it may provide clues about the possible mechanisms underlying the differences in observed survival. Informative IPAs may be useful for suggesting therapeutic targets or to select the most appropriate patients for clinical trials. For example, the ErbB2 amplification is a well-known marker of particular forms of breast cancer that are treatable by the drug trastuzumab. However, some patients with the ErbB2 amplification have tumors that are refractory to treatment. Inspection of a CircleMap display could identify patients with ErbB2 amplifications but have either inactive or unchanged IPAs as inferred by PARADIGM. Patients harboring the ErbB2 amplification but without predicted activity could be considered for alternative treatment. As more multidimensional datasets become available in the future, it will be interesting to test whether such pathway inferences provide robust biomarkers that generalize across cohorts.
Supplementary Material
ACKNOWLEDGEMENTS
We thank the ISPY TRIAL and TCGA Consortiums for providing prepublication data to tune our tools. We thank the UCSC Genome Browser team, Jorge Garcia, Erich Weiler, Alexander Wolfe and Victoria Lin for comments and support. D.H. is a Howard Hughes Medical Institute investigator.
Funding: The National Institutes of Health Grants U24 CA143858 and R21 CA135937; University of California Cancer Research Coordinating Committee (UC CRCC) Research Grant; the NIH Training Grant T32 GM070386; the Investigation of Serial Studies to Predict Your Therapeutic Response with Imaging And moLecular Analysis (I-SPY TRIAL) Consortium, California QB3 and its INformatics Supporting Therapy in INdividualized Clinical Trials (INSTINCT) program.
Conflict of Interest: none declared.
REFERENCES
- Alizadeh AA, et al. Distinct types of diffuse large B-cell lymphoma identified by gene expression profiling. Nature. 2000;403:503–511. doi: 10.1038/35000501. [DOI] [PubMed] [Google Scholar]
- Allison DB, et al. Microarray data analysis: from disarray to consolidation and consensus. Nat. Rev. Genet. 2006;7:55–65. doi: 10.1038/nrg1749. [DOI] [PubMed] [Google Scholar]
- Ashburner M, et al. Gene ontology: tool for the unification of biology. the gene ontology consortium. Nat. Genet. 2000;25:25–29. doi: 10.1038/75556. [DOI] [PMC free article] [PubMed] [Google Scholar]
- Beer MA, Tavazoie S. Predicting gene expression from sequence. Cell. 2004;117:185–198. doi: 10.1016/s0092-8674(04)00304-6. [DOI] [PubMed] [Google Scholar]
- BioPAX working group. BioPAX–biological pathways exchange language. Documentation. 2004 [Google Scholar]
- Chin S, et al. High-resolution ACGH and expression profiling identifies a novel genomic subtype of ER negative breast cancer. Genome Biol. 2007;8:R215. doi: 10.1186/gb-2007-8-10-r215. [DOI] [PMC free article] [PubMed] [Google Scholar]
- Dempster AP, et al. Maximum likelihood from incomplete data via the EM algorithm. J. Roy. Stat. Soc. Series B (Methodol.) 1977;39:1–38. [Google Scholar]
- Dudoit S, Fridlyand J. A prediction-based resampling method for estimating the number of clusters in a dataset. Genome Biol. 2002;3 doi: 10.1186/gb-2002-3-7-research0036. RESEARCH0036. [DOI] [PMC free article] [PubMed] [Google Scholar]
- Efroni S, et al. Identification of key processes underlying cancer phenotypes using biological pathway analysis. PLoS ONE. 2007;2 doi: 10.1371/journal.pone.0000425. [DOI] [PMC free article] [PubMed] [Google Scholar]
- Eisen MB, et al. Cluster analysis and display of genome-wide expression patterns. Proc. Natl Acad. Sci. USA. 1998;95:14863–14868. doi: 10.1073/pnas.95.25.14863. [DOI] [PMC free article] [PubMed] [Google Scholar]
- Friedman N, Goldszmidt M. Procedings of the 13th Conference on Uncertainty in Artificial Intelligence (UAI'97) Morgan Kaufmann Publishers; 1997. Sequential update of bayesian network structure; pp. 165–174. [Google Scholar]
- Friedman N. Inferring cellular networks using probabilistic graphical models. Science. 2004;303:799–805. doi: 10.1126/science.1094068. [DOI] [PubMed] [Google Scholar]
- Gat-Viks I, Shamir R. Refinement and expansion of signaling pathways: the osmotic response network in yeast. Genome Res. 2007;17:358–367. doi: 10.1101/gr.5750507. [DOI] [PMC free article] [PubMed] [Google Scholar]
- Gat-Viks I, et al. RECOMB. Berlin/Heidelberg: Springer; 2005. The factor graph network model for biological systems; pp. 31–47. [Google Scholar]
- Gat-Viks I, et al. A probabilistic methodology for integrating knowledge and experiments on biological networks. J. Computat. Biol. 2006;13:165–181. doi: 10.1089/cmb.2006.13.165. [DOI] [PubMed] [Google Scholar]
- Golub TR, et al. Molecular classification of cancer: class discovery and class prediction by gene expression monitoring. Science. 1999;286:531–537. doi: 10.1126/science.286.5439.531. [DOI] [PubMed] [Google Scholar]
- Joshi-Tope G, et al. Reactome: a knowledgebase of biological pathways. Nucleic Acids Res. 2005;33:D428–32. doi: 10.1093/nar/gki072. [DOI] [PMC free article] [PubMed] [Google Scholar]
- Ju X, et al. Akt1 governs breast cancer progression in vivo. Proc. Natl Acad. Sci. USA. 2007;104:7438–7443. doi: 10.1073/pnas.0605874104. [DOI] [PMC free article] [PubMed] [Google Scholar]
- Kerr MK, et al. Analysis of variance for gene expression microarray data. J. Comput. Biol. 2000;7:819–837. doi: 10.1089/10665270050514954. [DOI] [PubMed] [Google Scholar]
- Kschischang FR, et al. Factor graphs and the sum-product algorithm. IEEETIT: IEEE Trans. Inf. Theory. 2001;47:498–519. [Google Scholar]
- Kuan CT, et al. EGF mutant receptor VIII as a molecular target in cancer therapy. Endocr. Relat. Cancer. 2001;8:83–96. doi: 10.1677/erc.0.0080083. [DOI] [PubMed] [Google Scholar]
- Lee S.-I. Identifying regulatory mechanisms using individual variation reveals key role for chromatin modification. Proc. Nati Acad. Sci. USA. 2006;103:14062–14067. doi: 10.1073/pnas.0601852103. [DOI] [PMC free article] [PubMed] [Google Scholar]
- Liu M, et al. FoxM1B is overexpressed in human glioblastomas and critically regulates the tumorigenicity of glioma cells. Cancer Res. 2006;66:3593–3602. doi: 10.1158/0008-5472.CAN-05-2912. [DOI] [PubMed] [Google Scholar]
- Mooij JM. libDAI 0.2.3: A free/open source C++ library for Discrete Approximate Inference. 2009 Available at http://www.libdai.org/ (last accessed date December 21, 2009) [Google Scholar]
- Murphy KP, et al. Proceedings of 15th Conference on Uncertainity in Artifical Intelligence. Morgan Kaufmann; 1999. Loopy belief propagation for approximate inference: an empirical study; pp. 467–475. [Google Scholar]
- Naderi A, et al. A gene-expression signature to predict survival in breast cancer across independent data sets. Oncogene. 2007;26:1507–1516. doi: 10.1038/sj.onc.1209920. [DOI] [PubMed] [Google Scholar]
- Ogata H, et al. Kegg: Kyoto encyclopedia of genes and genomes. Nucleic Acids Res. 1999;27:29–34. doi: 10.1093/nar/27.1.29. [DOI] [PMC free article] [PubMed] [Google Scholar]
- Olshen AB, et al. Circular binary segmentation for the analysis of array-based DNA copy number data. Biostatistics. 2004;5:557–572. doi: 10.1093/biostatistics/kxh008. [DOI] [PubMed] [Google Scholar]
- Pagel P, et al. The MIPS mammalian protein-protein interaction database. Bioinformatics. 2005;21:832–834. doi: 10.1093/bioinformatics/bti115. [DOI] [PubMed] [Google Scholar]
- Park JW, et al. Unraveling the biologic and clinical complexities of HER2. Clin. Breast Cancer. 2008;8:392–401. doi: 10.3816/CBC.2008.n.047. [DOI] [PubMed] [Google Scholar]
- Parsons DW, et al. An integrated genomic analysis of human glioblastoma multiforme. Science. 2008;321:1807–1812. doi: 10.1126/science.1164382. [DOI] [PMC free article] [PubMed] [Google Scholar]
- Sachs K, et al. Causal protein-signaling networks derived from multiparameter single-cell data. Science. 2005;308:523–529. doi: 10.1126/science.1105809. [DOI] [PubMed] [Google Scholar]
- Schaefer CF, et al. PID: the pathway interaction database. Nucleic Acids Res. 2009;37:D674–D679. doi: 10.1093/nar/gkn653. [DOI] [PMC free article] [PubMed] [Google Scholar]
- Segal E, et al. From signatures to models: understanding cancer using microarrays. Nat. Genet. 2005;37(Suppl 6):S38–S45. doi: 10.1038/ng1561. [DOI] [PubMed] [Google Scholar]
- Semenza GL. HIF-1 and human disease: one highly involved factor. Genes Dev. 2000;14:1983–1991. [PubMed] [Google Scholar]
- Storey JD, Tibshirani R. Statistical methods for identifying differentially expressed genes in DNA microarrays. Methods Mol. Biol. 2003;224:149–157. doi: 10.1385/1-59259-364-X:149. [DOI] [PubMed] [Google Scholar]
- Subramanian A, et al. Gene set enrichment analysis: a knowledge-based approach for interpreting genome-wide expression profiles. Proc. Natl Acad. Sci. USA. 2005;102:15545–15550. doi: 10.1073/pnas.0506580102. [DOI] [PMC free article] [PubMed] [Google Scholar]
- Tamayo P, et al. Interpreting patterns of gene expression with self-organizing maps: methods and application to hematopoietic differentiation. Proc. Natl Acad. Sci. USA. 1999;96:2907–2912. doi: 10.1073/pnas.96.6.2907. [DOI] [PMC free article] [PubMed] [Google Scholar]
- Tarca AL, et al. A novel signaling pathway impact analysis. Bioinformatics. 2009;25:75–82. doi: 10.1093/bioinformatics/btn577. [DOI] [PMC free article] [PubMed] [Google Scholar]
- TCGA. Comprehensive genomic characterization defines human glioblastoma genes and core pathways. Nature. 2008;455:1061–1068. doi: 10.1038/nature07385. [DOI] [PMC free article] [PubMed] [Google Scholar]
- Troyanskaya OG, et al. Nonparametric methods for identifying differentially expressed genes in microarray data. Bioinformatics. 2002;18:1454–1461. doi: 10.1093/bioinformatics/18.11.1454. [DOI] [PubMed] [Google Scholar]
- Tusher VG, et al. Significance analysis of microarrays applied to the ionizing radiation response. Proc. Natl Acad. Sci. USA. 2001;98:5116–5121. doi: 10.1073/pnas.091062498. [DOI] [PMC free article] [PubMed] [Google Scholar]
- van de Vijver MJ, et al. A gene-expression signature as a predictor of survival in breast cancer. N. Engl. J. Med. 2002;347:1999–2009. doi: 10.1056/NEJMoa021967. [DOI] [PubMed] [Google Scholar]
- Vogel C, et al. First-line, single-agent herceptin(r) (trastuzumab) in metastatic breast cancer. a preliminary report. Eur. J. Cancer. 2001;37(Suppl. 1):25–29. [PubMed] [Google Scholar]
- Wirapati P, et al. Meta-analysis of gene expression profiles in breast cancer: toward a unified understanding of breast cancer subtyping and prognosis signatures. Breast Cancer Res. 2008;10:R65. doi: 10.1186/bcr2124. [DOI] [PMC free article] [PubMed] [Google Scholar]
- Zhu J, et al. The UCSC cancer genomics browser. Nat. Methods. 2009;6:239–240. doi: 10.1038/nmeth0409-239. [DOI] [PMC free article] [PubMed] [Google Scholar]
Associated Data
This section collects any data citations, data availability statements, or supplementary materials included in this article.


