

Abstract
While milk proteins have been studied for decades, strikingly little effort has been applied to determining how the post-translational modifications (PTMs) of these proteins may change during the course of lactation. PTMs, particularly glycosylation, can greatly influence protein structure, function, and stability and can particularly influence the gut where their degradation products are potentially bioactive. In this work, previously undiscovered temporal variations in both expression and glycosylation of the glycoproteome of human milk are observed. Lactoferrin, one of the most abundant glycoproteins in human milk, is shown to be dynamically glycosylated during the first ten days of lactation. Variations in expression or glycosylation levels are also demonstrated for several other abundant whey proteins, including tenascin, bile salt-stimulated lipase, xanthine dehydrogenase, and mannose receptor.
Keywords: Breast milk, Glycoprotein, Lactation, Milk, Post-translational modification
INTRODUCTION
Breast milk is the remarkable product of the mammary gland emerging from evolutionary pressure as the exclusive food for the growing infant 1-11. Because it serves as the sole source of nutrition in early life, milk has been widely studied to better understand the quantities and bioavailabilities of essential nutrients. Milk not only delivers nutrients, but also provides the infant with a number of physiological advantages such as enhanced immunity 9, 12 and the development and maintenance of a complex microflora in the gastrointestinal tract 11, 13-15. In light of these varied and extensive benefits, it is critical to study the structure-function relationship of different components in milk and how they confer advantages to the infant.
Proteins make up a major component of human milk. Proteins as a whole are the fourth most abundant component of human milk after lactose, lipids and oligosaccharides. Total protein concentrations are typically in the 10-20 mg/mL range, and have been shown to decrease during the lactation period, reaching a minimum after approximately one week. This change is also correlated with a drastic increase in total milk production, and a change in overall protein composition. A more detailed study of these dynamic behaviors is especially interesting because milk proteins and their degradation products have been associated with a number of important biological activities. These include immunomodulatory 16, antibacterial 17, and pathogen binding 18 activities.
The rapidly developing infant requires a dynamic and complex source of nutrients and the overall health, development and protection of the infant is enhanced by a variety of bioactivities also present in milk. To understand these activities, research in this group has examined the behavior of important components in human milk during the course of the lactation period. We have recently quantified HMOs during the lactation period in these samples and have found them to remain relatively constant for all components 19 during lactation. One proposed role of HMOs is as a prebiotic 15, 20 and the constant production of oligosaccharides is consistent with that role.
Variation of protein expression is similarly important given the many roles of proteins in the infant diet. While thorough conventional proteomic studies have been performed on both the whey 4, 21 and the milk fat globule membrane 22-23 fractions of human milk, there are very few studies that address any variation in post-translational modifications. Even fewer studies address milk protein glycosylation, although there have been a few notable exceptions. In 2002, Charlwood et al. 23 described the N-glycosylation of four abundant milk fat globule membrane proteins. This study interrogated samples from a wide range of lactation stages, yet reported neither any temporal variations in glycan abundance that are apparent in this study nor variations in protein abundances.
While there have been studies establishing the variation in both total protein quantity and protein composition in human milk, little progress has been made in determining any qualitative or quantitative variations in glycosylation of the major milk glycoproteins. Protein glycosylation is one of the most commonly occurring post-translational modifications, and directly affects protein structure, function and recognition. Protein glycosylation is particularly relevant to milk, as it has been shown to have direct implications in pathogen binding 8, infant development and proteolytic susceptibility 24.
In this work, glycosylation of specific milk proteins is shown to vary during lactation. The work presented here both outlines a strategy for rapidly determining gross protein glycosylation profiles over time, and demonstrates that there are dynamically glycosylated glycoproteins in human milk. Dynamic protein glycosylation suggests many interesting biological roles for individual proteins. An extensive review has been published on the potential roles of protein-linked glycosylation 25. As changes in protein glycosylation can significantly affect protein function, stability, and structure 26-28, tracking these changes could facilitate discovery of additional bioactive species in milk.
The degradation products from these compounds may be equally as important as the intact protein, as they have been shown to perform various biological functions both in vivo and in vitro 8, 12, 29-30. Whereas glycosylation will greatly influence the function, identity and quantities of these degradation products, a more thorough understanding of temporal variations of protein glycosylation is clearly necessary. As the neonate’s intestinal microflora, immune system, and digestive systems change the most rapidly during the first few days of life, understanding changes in protein expression and glycosylation are critically important.
MATERIALS AND METHODS
Materials
Organic solvents (all HPLC grade or higher) were purchased from Burdick and Jackson. Sequencing-grade trypsin (modified by reductive methylation to reduce autolysis) was purchased from Promega. Bisacrylamide gels, Bradford reagent and Coomassie brilliant blue G-250 were purchased from Bio-Rad. All water used was 18 MΩ deionized water. Pro-Q emerald 300 was purchased from Invitrogen. Glycerol-free Peptide: N-glycosidase F (PNGaseF) was purchased from New England Biolabs. Porous graphitized carbon cartridges were obtained from Glygen. All other reagents were purchased from Sigma-Aldrich.
Samples
Human milk samples were obtained from four healthy women. Overall, samples from the first, second, fifth, tenth, fifteenth, sixteenth, seventeenth, and thirtieth, thirty-first or thirty-second days of lactation were interrogated in this study although none of the individuals provided milk for all time points. Quantitative comparisons were made with a minimum of three samples for each time point, and days 15, 16, and 17 were grouped for this comparison as were days 30, 31, and 32. All milk samples were manually expressed and immediately frozen. Samples were then transferred to a -80° C freezer within three hours and stored there until analysis.
Protein Extraction
One half milliliter of raw milk was centrifuged at 4° C for 30 minutes and the fat and cellular layers removed. Residual lipids were removed by the method of Wessel and Flugge 31. Briefly, three volumes (1.5 mL) of 2:1 chloroform / methanol were added, agitated and the supernatant was retained. An ethanol precipitation of protein from the supernatant was performed overnight at 4° C by adding 5 mL of HPLC grade ethanol, and following centrifugation the supernatant was removed. Precipitates were resuspended in 50 mM ammonium bicarbonate buffer (pH 7.5), and protein quantities were determined by the Bradford method. The precipitated protein was stored at -20° C until analysis.
Soduim Dodecyl Sulfate Polyacrylamide Gel Electrophoresis (SDS-PAGE)
An aliquot containing 10 μg of protein was mixed 1:1 (v/v) with Laemmli sample buffer containing 350 mM dithiothreitol 32, and was denatured and reduced by 2 minutes of heating at 95° C. SDS-PAGE separations were achieved with discontinuous gradient 10-20% bisacrylamide gels, and constant 20 mA running conditions. Following separations, gels were washed four times for 10 minutes with water. Subsequent staining with Coomassie brilliant blue and the glycoprotein-specific Pro-Q Emerald 300 were performed in parallel on duplicate gels according to manufacturer’s instructions. Gels were scanned using an HP ScanJet 4890 scanner (in the case of Coomassie stained gels) or a Bio-Rad transilluminating scanner (in the case of Pro-Q Emerald stained gels).
In-Gel Trypsin Digestion
Selected gel bands were thoroughly washed with deionized water and gently agitated for a total of 1 hour. Gel pieces were cut into 1 mm wide cubes, and dried in a vacuum centrifuge. Washed, dehydrated gel pieces were incubated with 10 mM dithiothreitol (DTT) at 55° C for 1 hour and 55 mM iodoacetamide (IoAA) at room temperature in the dark for 45 minutes. Gel pieces were then washed with 100 mM ammonium bicarbonate with gentle agitation for 10 minutes, and briefly dehydrated with acetonitrile. This wash step was repeated twice, and gel pieces were dried. Proteins were then digested with 0.5 μg of trypsin in 100 mM ammonium bicarbonate at 37° C for 16 hours. Following digestion, peptides were extracted with acetonitrile, water, and 50% ethanol and dried in a vacuum centrifuge. Samples were reconstituted with deionized water, desalted using a zip-tip C18 microtip and eluted into 5 uL of 50% acetonitrile. One microliter was used for subsequent matrix-assisted laser desorption/ionization (MALDI) mass spectrometry (MS) analysis, as described below.
Peptide Mass Fingerprinting Analysis with MALDI MS
Tryptic peptides were analyzed on an IonSpec ProMALDI 7.0 Tesla Fourier transform ion cyclotron resonance mass spectrometer (FT-ICR MS) equipped with an external MALDI source and capable of external ion accumulation with vibrational cooling. All spectra were internally calibrated using the InCAS technique 33 and a mixture of standard peptides to increase mass accuracy. The peptides used were Bradykinin fragment peptide 1-7, angiotensin II, P14R, human adrenocorticotropic hormone fragment peptide 18-39, and oxidized B chain of bovine insulin. Protonated, monoisotopic masses for the calibrant peptides were m/z 757.39915, 1046.54179, 1533.85765, 2465.19833, and 3494.65077 respectively. Spectra were deisotoped using the IonSpec PeakHunter software, and the monoisotopic mass lists were then relieved of known contaminants and non-peptide masses using the Mass Sieve approach 34.
MASCOT Database Searching
Processed mass lists were submitted to MASCOT 35 for protein identification. Carbamidomethylation of cysteine residues was selected as a fixed modification. No variable modifications were included in the searches. Peptide mass tolerances were set to 10 ppm. All proteins were identified above the 95% confidence interval (CI), and mass errors for all assigned peptides were less than 5 ppm. Each band identified only one protein (discounting splice variants) at that confidence level.
LC MS/MS Analyses
A total of eleven samples were examined via LC MS/MS. One hundred micrograms of extracted milk proteins were dried and solubilized with 60 μL 8M urea. Samples were then reduced with DTT and alkylated with IoAA. After dilution in 180 μL of water, an overnight digestion with trypsin was performed. Peptides were then concentrated and desalted using C18 zip-tip before LC separation and online tandem mass spectrometry.
A nanoLC-2D system (Eksigent, Dublin, CA) coupled with an LTQ ion trap mass spectrometer (Thermo Finnigan) was used with a home-made fritless reverse phase microcapillary column (75 μm×180 mm; packed with Magic C18AQ, 3 μm 100 Å: Michrom Bio Resources) and vented column configuration. Digested samples were transferred from the autosampler to the on-line trap column (0.15 mm×20 mm; packed with Magic C18AQ, 3 μm 100 Å) and desalted. Peptides were eluted from the trap and separated on the capillary column using a reverse-phase gradient at a flow rate of 300 nL/min, and directly electrosprayed into the mass spectrometer. A cycle of one MS survey scan followed by ten MS/MS scans was repeatedly acquired over the LC gradient. Dynamic exclusion for 1 min duration was utilized. Buffers were 0.1% formic acid in water (buffer A) and 0.1% formic acid in acetonitrile (buffer B). A 107 min gradient (2-40% B for 95 minutes, followed by 40-80% B for 12 minutes) was used.
Protein identification based on LC-MS/MS was performed using X! Tandem with a fragment ion mass tolerance of 0.40 Da and a parent ion tolerance of 1.8 Da. Iodoacetamide derivatization of cysteine was specified as a fixed modification. Deamidation of asparagine and glutamine, oxidation of methionine and tryptophan, sulphonation of methionine, tryptophan oxidation to formylkynurenin of tryptophan, acetylation of lysine and the N-terminus, and phosphorylation of serine, threonine and tyrosine were specified as variable modifications.
Scaffold software was used to validate MS/MS based peptide and protein identifications. Peptide identifications were accepted if they could be established at greater than 95.0% probability as specified by the Peptide Prophet algorithm 36. Protein identifications were accepted if they could be established at greater than 99.0% probability and contained at least 2 identified peptides. Protein probabilities were assigned by the Protein Prophet 37.
In-Gel Deglycosylation and MALDI FTICR-MS Analysis
To verify changes in lactoferrin glycosylation, 10 ug of milk protein corresponding to lactation days 2 and 5 were reduced, alkylated and loaded on to 10% polyacrylamide gels (86×68×1mm). After separation, protein visualization was performed using Bio-Safe coomassie blue staining. Lactoferrin gel bands were excised and destained with 5% methanol-7% acetic acid in water and frozen overnight. After extensive washing with acetonitrile and 50 mM NH4HCO3, glycans were released using 750 units of PNGaseF at 37 C for 16 hours. Released glycans were extracted from gel pieces by washing them with 200 ul of water, followed by 200ul of acetonitrile, with a 10 minute sonication step following each addition. Supernatants obtained in each step were recovered and combined. This wash cycle was repeated 3 times and supernatants were dried down in a vacuum centrifuge.
Samples were reconstituted in deionized water and oligosaccharides purified by solid phase extraction using porous graphitized carbon cartridges. Hypercarb carbon cartridges were conditioned with 3 column-volumes of deionized water, followed by 3 volumes of 80% acetonitrile in 0.10% aqueous trifluoroacetic acid (TFA) (v/v) and with another 3 vol of deionized water. The samples were loaded onto the cartridge, incubated for 10 min at room temperature, washed with 3 vol of deionized water, eluted with 3 volumes of 40% acetonitrile, 0.1% TFA in water (v/v) and dried in vacuo. Glycans were reconstituted in 5 μL of water. MALDI –FTICR MS was then performed as described previously, using a mixture of maltooligosaccharides as an external calibrant38. All oligosaccharide compositions were identified by accurate mass, utilizing a 10 ppm tolerance, and five replicate spectra were acquired for each sample.
RESULTS
Gel Electrophoretic Analyses of Milk Proteins
Gel electrophoresis was used to determine semi-quantitative changes in expression of the major milk proteins. Samples from the first, fifteenth, and thirtieth days of lactation were examined in these studies. Total protein amount was determined, and ten microgram aliquots were investigated via SDS-PAGE. Shown in Figure 1 are representative SDS-PAGE analyses. The ten abundant proteins indicated were identified using in-gel digestion and peptide mass fingerprinting. The assignments are summarized in Figure 1 and Table 1, along with pertinent identification parameters such as the number of peptides matched (nP), the probability of a stochastic assignment, and the score of the next best protein identification (ΔSM). For reference, a significant match at the 95% CI corresponds to a score of 65. All proteins were identified with scores of 69 or higher under the Mascot protocol. In addition, these results are characterized by large values of ΔSM which is indicative of a high level of discrimination and a low likelihood of false positive identification afforded by accurate mass analysis 39.
Figure 1.
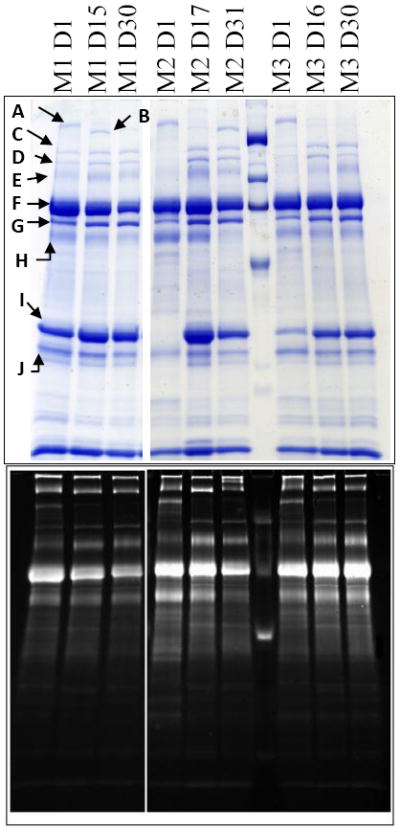
Coomassie (top) or glycoprotein-specific (bottom) stained SDS-PAGE separations for 3 mothers at varying time points. Indicated protein bands identified by peptide mass fingerprinting are annotated in Table 1 below, along with several measures of the quality of the identification. Abbreviations are: M, mother code; D, lactation day; MWM, molecular weight markers. Markers for coomassie stain are, from top, 203, 120, 95, and 49 kDa. For pro-Q stain, markers are 180, 82, and 42 kDa. Protein K is alpha-lactalbumin.
Table 1.
Summary of all proteins identified by peptide mass fingerprinting. Several parameters relating to the quality of the identification are also tabulated as follows: SM, Mowse score; ΔSM, difference between the top two highest scoring protein identifications; np, number of peptides identified; SC (%); percent sequence coverage of the protein identified; and eRMS (ppm), root mean square mass error of identified peptides, in parts per million. The identification for Ig Kappa chain C has no ΔSM listed because all other proteins identified at a nonstochastic level were splice variants.
| Gel Band | Protein Identity | MW (kDa) | SM | ΔSM | nP | SC (%) | eRMS (ppm) |
|---|---|---|---|---|---|---|---|
| A | Tenascin | 240.6 | 163 | 135 | 30 | 24 | 3 |
| B | Fatty acid synthase | 275.5 | 143 | 111 | 30 | 20 | 2 |
| C | Mannose Receptor | 168.9 | 93 | 61 | 19 | 19 | 4 |
| D | Xanthine dehydrogenase | 148.4 | 80 | 42 | 10 | 12 | 4 |
| E | Bile salt-stimulated lipase | 66.6 | 94 | 71 | 12 | 25 | 2 |
| F | Lactoferrin | 79.8 | 97 | 69 | 15 | 29 | 3 |
| G | Serum Albumin | 67.7 | 178 | 147 | 22 | 48 | 1 |
| H | Ig α-1 chain C | 54.3 | 73 | 32 | 6 | 20 | 2 |
| I | Kappa-casein | 20.4 | 75 | 37 | 5 | 45 | 1 |
| J | Ig kappa light chain | 23.5 | 71 | N/A | 5 | 41 | 2 |
To explore the glycosylation status of the abundant milk proteins, gels were run in duplicate and stained with colloidal coomassie brilliant blue G-250 (for total protein) and Pro-Q Emerald 300 (for glycan content) stains separately. To obtain quantitative information, each gel lane was examined by an in-house image processing program. Several proteins were shown to change in total coomassie signal intensity during lactation. These trends are demonstrated in Figure 2, which shows an overlay of three SDS-PAGE electropherograms generated from a single individual at differing lactation times. Upon examination it is clear that the expression level of the heavy chain of IgA (immunoglobulin alpha-1 chain C, IGHA1) is decreasing for this mother over the first lactation month, as expected. In addition to IGHA1, there are four other proteins detailed below whose abundances are found to vary during the first month of lactation
Figure 2.
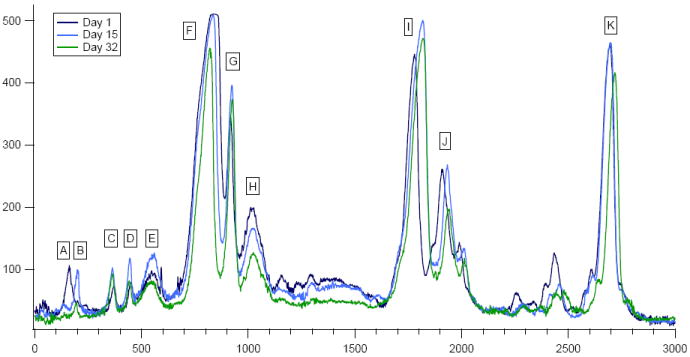
Electropherograms of SDS-PAGE separated, coomassie stained proteins with annotated identifications as detailed in Table 1. Protein K is alpha-lactalbumin.
All quantitative comparisons of protein and glycan-level variations were made using background-subtracted integrals of coomassie or pro-Q stained electrophoretic peaks, respectively. The dynamic behaviors of five glycoproteins including tenascin, xanthine dehydrogenase (XD), BSSL, lactoferrin, and IGHA1 protein are shown in Figure 3. These proteins were selected for this comparison because they each signaled under both the coomassie and the glycoprotein-specific stains. The upper bar graph shows the averaged glycoprotein-specific stain intensity and the lower graph the averaged coomassie response at days 1, 15, and 30 for each protein. Proteins were identified as differentially glycosylated or expressed if the response to the appropriate stain was significantly different between two time points at greater than the 90% CI. Remarkably, tenascin, IGHA1 protein, XD and lactoferrin expression levels all decrease significantly from colostrum to mature milk in these samples. Interestingly, XD expression peaks at two weeks lactation time and drops to approximately half of peak concentration by one month lactation time, while lactoferrin, IGHA1, and tenascin decrease from colostrum to mature milk. Mannose receptor and Ig kappa light chain both increase from the first to the thirtieth lactation days (data not shown). Mannose receptor and XD are each potential N-glycoproteins by virtue of the presence of the consensus sequence for N-glycosylation. XD responds to the glycoprotein-specific stain used in this study. There is no corresponding response from mannose receptor.
Figure 3.

Glycosylation (upper) or expression (lower trace) levels of selected human milk glycoproteins. Singly, doubly, or triply marked entries are statistically different at the 90, 95, or 99% confidence interval from the corresponding day 1 entry. Standard deviations for each measurement are shown as error bars. When necessary, signals were scaled by the factor in parentheses to enable direct comparison between highly and moderately abundant glycoproteins.
Interestingly, there are also glycoproteins that exhibit disparate behavior under protein- or glycan-specific staining. A small section of the SDS-PAGE gel band is shown for illustrative purpose in Figure 4, with samples from the first 10 days of lactation shown. This detailed examination was intended to determine if any interesting dynamic behavior was missed between days 1 and 15 as examined previously. The CBB stain intensities suggest that the gross quantity of lactoferrin remained relatively constant over the first ten days of lactation. Surprisingly, the total glycan stain intensity decreases by approximately 60% over that time. By day 15, this decrease in glycosylation is restored to near its previous levels. As one of the most abundant glycoproteins in milk, this trend represents a significant change in the total glycoconjugate content present in the infant’s digestive system. Additionally, while the expression level of XD peaks at two weeks and decreases afterwards (day 15 and 30 are different at the 95% CI); the glycosylation level is largely unchanged from two to four weeks, suggesting an increase in the degree of glycosylation of this glycoprotein during this time.
Figure 4.
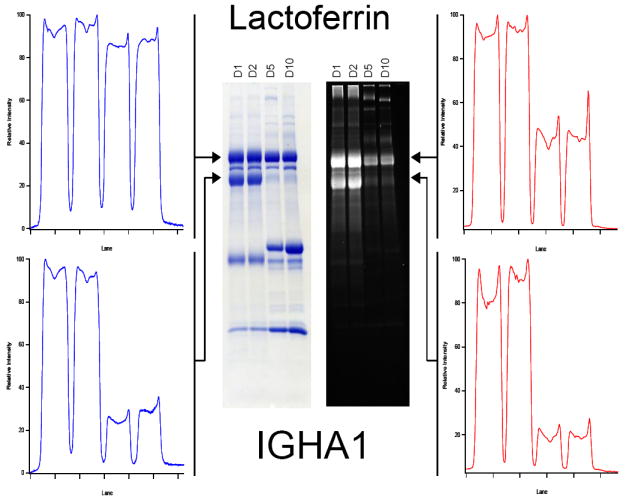
Image line profiles of isolated milk proteins stained with either Coomassie (left) or Pro-Q (right) stains. Proteins were isolated from a single mother on lactation days 1, 2, 5, and 10. While lactoferrin is shown to have a relatively constant total protein level (top left), the degree of glycosylation at day 10 is approximately 40% of that present at day 1 (top right). The lower two traces showing Ig α-1 chain C behavior show little variation.
Although the CBB and glycan-specific staining methods have previously both been shown to be valid quantitative platforms 40-41 the changes in lactoferrin glycosylation were also verified by another method. Enzymatic release of N-glycans followed by analysis by mass spectrometry was used both to verify the gross glycosylation trends that were observed via the glycan-specific visualization and to identify the compositions of the N-glycans. Shown in Figure 5 are the mass spectra obtained from enzymatic release of electrophoretically separated lactoferrin from different lactation days. The glycosylation trends obtained from the Pro-Q Emerald d 300 staining approximate the total glycan intensity changes observed via high-resolution, high mass accuracy FTICR-MS. The glycans observed were primarily biantennary, complex-type and fucosylated, and compositions for each peak are labeled on the spectra. A decrease in both the total level of glycosylation and the degree of fucosylation was observed between days 2 and 5, although this change was largely nullified by day 15.
Figure 5.
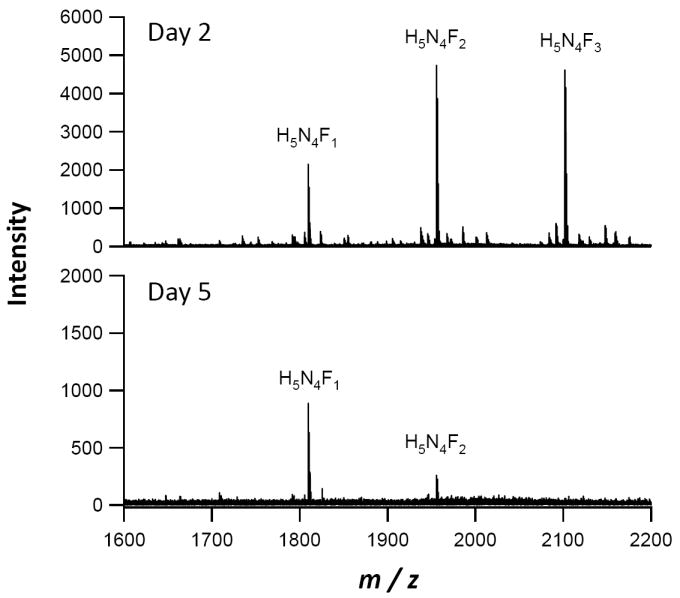
Variations of lactoferrin glycosylation during lactation. Representative mass spectra of enzymatically released lactoferrin N-glycans from lactation days 2 (top) and 5 (bottom) from a single individual are shown. Monosaccharide compositions of the major peaks are annotated as H, Hexose; N, N-acetyl hexosamine; and F, deoxyhexose. A dramatic decrease in both quantity and diversity of glycosylation is observed between lactation days 2 and 5, as shown by the glycosylation-specific Pro-Q staining.
Shotgun Proteomics Analysis of Milk Proteins
LC MS/MS analyses were performed to determine the gross protein and glycoprotein content in milk. As expected, the shotgun analyses identified significantly more proteins than the gel-based analyses. The LC-MS/MS analyses identified a total of 55 proteins present in 11 samples analyzed. Identified proteins were searched in Swiss-prot to determine their annotated glycosylation status. Shown in Table 2 are the proteins identified along with their potential for glycosylation. Of the 55 proteins identified, 27 are glycosylated, and an additional 12 are potentially N-glycosylated based on the presence of the consensus sequence NXS or NXT, where X is any amino acid except proline. O-glycosylation can occur at essentially any serine or threonine residue, so there is no analogous classification for potential O-glycosylated proteins, as essentially no filter exists based on amino acid sequence.
Table 2.
All proteins identified in the LC MS/MS experiments, listed with corresponding glycosylation status as annotated in the SwissProt database. Abbreviations are: M.W., molecular weight in kDa; #U.P., number of unique peptides; Seq. coverage, % sequence coverage of identified protein. Abbreviations for glycosylation status are: N, known N-linked glycoprotein; O, known O-linked glycoprotein, N, O, known N-and O- linked glycoprotein; P, potential N-linked glycoprotein; X, no potential N-glycosylation and no known O-linked glycans. Proteins are identified as potentially N-glycosylated if they possess the consensus amino acid sequence required for N-glycosylation, NX(S/T), where X is any amino acid except proline.
| Protein Name | M.W. (kDa) | Swiss-Prot # | # U.P. | Seq. coverage | Glycosylation Status |
|---|---|---|---|---|---|
| actin, cytoplasmic 1 | 42 | P63261 | 4 | 12% | X |
| adipose differentiation-related protein | 48 | Q99541 | 2 | 11% | P |
| alpha-1 antichymotrypsin | 48 | Q2TU88 | 4 | 17% | N |
| alpha-1 antitrypsin | 47 | P01009 | 6 | 23% | N |
| alpha-lactalbumin | 16 | P00709 | 21 | 68% | N |
| alpha-s1 casein | 22 | P47710 | 10 | 51% | X |
| anti-streptococcal Ig lambda chain variable region | 10 | Q96SB0 | 2 | 31% | P |
| Apolipoprotein A-1 | 31 | P02647 | 3 | 16% | X |
| Beta-1,4-galactosyltransferase 1 | 44 | P15291 | 6 | 28% | P |
| Beta-2-microglobulin | 14 | P61769 | 2 | 27% | X |
| Beta-casein | 25 | P05814 | 31 | 92% | X |
| Bile salt-stimulated lipase | 79 | P19835 | 17 | 29% | N, O |
| Butyrophilin, subfamily 1 member A1 | 59 | Q4VAN2 | 5 | 14% | P |
| CD59 glycoprotein | 14 | P13987 | 2 | 20% | N, O |
| Chordin-related protein 2 variant III | 50 | Q6WN33 | 5 | 20% | P |
| Clusterin | 58 | Q5HYC1 | 10 | 25% | N |
| Complement C3 | 187 | P01024 | 11 | 11% | N |
| Complement C4 | 193 | P0C0L4 | 2 | 1% | N |
| Fatty acid synthase | 273 | P49327 | 26 | 20% | P |
| fatty acid-binding protein | 15 | P05413 | 4 | 28% | X |
| Follistatin-related protein-1 | 35 | Q12841 | 3 | 11% | N |
| fructose-1,6-biphosphate adolase A | 39 | Q6FI10 | 2 | 13% | X |
| Galectin-3-binding protein | 65 | Q08380 | 5 | 18% | X |
| Gamma-enolase | 47 | P09104 | 2 | 11% | P |
| Haptoglobin | 38 | P00738 | 2 | 8% | N |
| Ig kappa chain V-II | 13 | P06310 | 2 | 35% | X |
| Ig kappa chain V-III | 13 | P18135 | 3 | 34% | X |
| Ig lambda constant 2 | 22 | Q8N355 | 8 | 40% | X |
| IgG heavy chain locus; IGHG1 | 54 | Q569J1 | 19 | 38% | N |
| IGHG1 immunoglobulin heavy constant gamma 1 | 41 | Q6N030 | 9 | 37% | N |
| Immunoglobulin heavy chain variant (fragment) | 37 | Q9NPP6 | 4 | 16% | P |
| Immunoglobulin J chain | 18 | P01591 | 4 | 25% | N |
| Immunoglobulin kappa variable 1-5 | 23 | Q6GMX8 | 11 | 44% | X |
| Insulin-like growth factor-binding protein precursor 2 | 35 | P18065 | 7 | 19% | X |
| kappa-casein | 20 | P07498 | 13 | 55% | O |
| Lactadherin | 43 | Q08431 | 9 | 33% | P |
| Lactoferrin | 78 | P02788 | 66 | 81% | N |
| Leucine-rich alpha-2-glycoprotein | 38 | P02750 | 2 | 14% | N, O |
| lipoprotein lipase | 53 | P06858 | 4 | 17% | P |
| lysozyme C | 17 | P61626 | 8 | 40% | X |
| Mannose Receptor, C-type | 166 | Q5VSK2 | 6 | 6% | P |
| monocyte differentiation antigen CD14 | 40 | P08571 | 4 | 20% | N |
| Oroscomucoid | 24 | P02763 | 4 | 20% | N, O |
| Osteopontin | 35 | P10451 | 11 | 25% | N, O |
| Platelet glycoprotein 4 | 53 | P16671 | 4 | 29% | N |
| Polymeric Ig Receptor | 83 | P01833 | 45 | 13% | N |
| Prolactin-inducible protein | 17 | P12273 | 2 | 47% | N |
| Selenium binding protein 1 | 52 | Q13228 | 2 | 19% | X |
| Serotransferrin | 77 | P02787 | 8 | 21% | N |
| Serum Albumin | 69 | P02768 | 35 | 65% | X |
| Similar to Ig gamma-2 chain C region | 22 | Q49AS2 | 4 | 46% | N |
| Tenascin C | 231 | P24821 | 40 | 30% | N |
| Trefoil factor 3 | 14 | Q07654 | 2 | 14% | X |
| Xanthine dehydrogenase/oxidase | 146 | P47989 | 8 | 1% | N |
| Zinc Alpha-2-glycoprotein 1 | 34 | P25311 | 7 | 30% | N |
DISCUSSION
While are a small number of published studies (<10) that detail the proteomics of the milk globule membrane, there have been surprisingly few contemporary reports on the proteomic analysis of the whey protein in human milk. However, there are a few notable exceptions. Using a combination of casein removal, immunodepletion, PMF analysis, and MudPit 42, Palmer et al. identified 151 proteins in colostrum, 83 of which were identified for the first time. Interestingly, the authors identified 27 proteins that are implicated in defense, 10 that have growth-modulating activities, and several that are involved in vitamin or mineral transport, supporting the hypothesis proposed by many researchers that milk is a multifunctional food. Regrettably, due to the difficulty in attaining a sufficient quantity of high quality colostrum samples they were limited to a single pooled sample from one hundred donors and could not examine any temporal or individual variations of milk protein. However, their study was fundamental to the emerging view of milk as a vanguard of human health and development.
The work presented here shifts the focus from what has historically been done in mass spectrometry-based analyses of milk (identifying a large number of proteins) to identifying the dynamic behavior of the most abundant proteins and glycoproteins during lactation. Glycosylation has been shown to influence protein function, stability, susceptibility to proteolysis and cell-cell interactions, therefore changes in glycosylation could greatly influence both the function and degradation state of glycoproteins in the infant’s gut. As the degradation of the most abundant glycoproteins will have the greatest impact on the identity of potentially bioactive glycopeptides, tracking glycosylation changes in these species is essential.
Of the 10 abundant proteins identified via PMF in this study, eight are glycosylated or potentially glycosylated. Five proteins (tenascin, BSSL, Lactoferrin, Ig A and kappa-casein) are well characterized glycoproteins. In addition, alpha-lactalbumin is highly abundant but seldom (~1%) glycosylated 43 and xanthine dehydrogenase was only recently identified as a glycoprotein 44. Most of these abundant glycoproteins are also found to change in concentration during the first month of lactation. Only one of these has previously been shown to vary in glycosylation during the course of lactation, namely BSSL 45. Its glycosylation was shown to vary greatly between the first and the sixth month of lactation, both in absolute quantity of monosaccharide residues and in identity of glycans. BSSL was found to eventually be replaced by a completely nonglycosylated analog during late lactation.
In this study, we examine glycosylation changes of BSSL during the first month, and show that there is dynamic glycosylation during this time as well. While the protein amount does not show significantly different changes in the samples examined here, the glycosylation amount does, showing a two-fold increase from the first to the fifteenth lactation days. This increase is maintained until the thirtieth day, despite an apparent decrease in the total amount of BSSL expression at the thirtieth day of lactation. Whereas BSSL glycosylation will facilitate transport of the active form of the enzyme through the infant’s stomach, these changes may influence the efficiency of lipid digestion and absorption, a critical energy source for the neonate. BSSL glycans contain Lewis epitopes and have been shown to contribute to host defense both through the presence of these epitopes and by virtue of the enzyme’s lipolytic activity 46. Therefore, BSSL glycosylation affects host defense both directly (via acting as a receptor analogue) and indirectly by preserving enzymatic activity of BSSL in the infant’s digestive tract.
Ig A is one of the most abundant glycoproteins in colostrum, but decreases to much lower levels a few days after the onset of lactation. Ig A is commonly believed to augment the infant’s own nascent immune system. Gross glycosylation profiles of Ig A vary in the same manner as the total protein expression, meaning that the degree of Ig A glycosylation shows little variation. Despite the apparent lack of dynamic Ig A glycosylation, the decrease in protein amount leads to a dramatic reduction of the total glycoconjugate during early lactation.
Lactoferrin presents a compelling glycosylation transformation. During the first ten days of lactation, it has been well established that both the concentration of lactoferrin and the total protein concentration decrease in similar fashion. In the present study, a constant mass of protein was analyzed for each sample, and the amount of lacroferrin was unchanged. Despite a constant amount of lactoferrin analyzed, we have found a significant change in both the identity and the extent of glycosylation present. These changes in glycosylation provide another dimension to this well studied glycoprotein that has not been examined in any detail, and at this point biological implications of this change can only be hypothesized. Compellingly, lactoferrin’s digestion products include peptides that have been shown to be antimicrobial 30, and as glycosylation has been shown to influence lactoferrin’s susceptibility to proteolysis 47, the modification could directly influence the generation of these antimicrobial species. It has also been shown that the identity of oligosaccharide present on lactoferrin can affect the efficiency of brush border binding and iron transport in vitro 48, so changes in glycosylation during lactation will directly affect both the identity of the microbiota and the availability of essential minerals in the infant’s digestive system via regulating the degree of digestion of lactoferrin during early life. In addition to demonstrating an overall drop in degree of glycosylation, FTICR-MS based analyses show a decrease in N-glycan fucosylation between days 2 and 5.
Based on global LC-MS/MS analyses we estimate that 70% of the abundant proteins identified here are likely glycosylated, which is larger than estimates of overall glycosylation in human serum proteins 49. What makes human milk especially unique however is the large amount of total glycosylation in the proteins. With eight of the ten most abundant proteins being glycosylated, the absolute quantity of protein-linked oligosaccharide is extremely high. Combined with the highly abundant HMOs (present at 10-20 g/L), there is a predominance of indigestible carbohydrate present in early lactation. Evolutionary pressures suggest that these compounds are present to increase the survival of the infant, as the mother is synthesizing and excreting them at significant personal cost. While models have been established for the presence of HMO, more research is needed to elucidate all the roles of protein linked glycosylation. However, the dynamic nature of this glycosylation suggests that it adjusts to meet the needs of the infant and may suggest what roles these glycans may play biologically.
In summary, milk glycoproteins are both prevalent and abundant. Contrary to the view of milk proteins functioning solely as a source of amino acids for digestion and mineral absorption, the predominance of protein glycosylation implies a more structure-specific role. Research to date has provided evidence that these glycoproteins and their digestive products provide an important source of bioactive compounds with diverse beneficial properties. We have demonstrated in this work that milk presents a dynamic glycoprotein component to the infant. Compellingly, several abundant glycoproteins are shown to vary in expression and glycosylation in an independent fashion.
Acknowledgments
Funding provided by UC Discovery, California Dairy Research Foundation and Dairy Management Incorporated is gratefully acknowledged. This research was also supported in part by NIEHS Superfund (grant P42 ES04699), and by the CHARGE study (grant P01 ES11269). The authors would also like to thank the UC Davis proteomics staff for assistance with the shotgun experiments. Also, thanks to Dr. Milady Niñonuevo, Caroline Chu, and Larry Lerno for helpful advice. Thanks to Scott Kronewitter for assistance with the image analysis software.
Abbreviations used
- BSSL
bile salt-stimulated lipase
- CI
Confidence interval
- HMOs
Human Milk Oligosaccharides
- IGHA1
Immunoglobulin alpha-1 chain C
- XD
Xanthine dehydrogenase
- PNGase F
Peptide: N-glycosidase F
References
- 1.Binns C, Lee A, Harding H, Gracey M, Barclay D. The CUPDAY Study: prebiotic-probiotic milk product in 1-3-year-old children attending childcare centres. Acta Paediatr. 2007;96(11):1646–50. doi: 10.1111/j.1651-2227.2007.00508.x. [DOI] [PubMed] [Google Scholar]
- 2.Colome G, Sierra C, Blasco J, Garcia MV, Valverde E, Sanchez E. Intestinal permeability in different feedings in infancy. Acta Paediatr. 2007;96(1):69–72. doi: 10.1111/j.1651-2227.2007.00030.x. [DOI] [PubMed] [Google Scholar]
- 3.Kokinopoulos D, Photopoulos S, Varvarigou N, Kafegidakis L, Xanthou M. The effect of human milk, protein-fortified human milk and formula on immunologic factors of newborn infants. Adv Exp Med Biol. 1991;310:77–85. doi: 10.1007/978-1-4615-3838-7_8. [DOI] [PubMed] [Google Scholar]
- 4.Kverka M, Burianova J, Lodinova-Zadnikova R, Kocourkova I, Cinova J, Tuckova L, Tlaskalova-Hogenova H. Cytokine profiling in human colostrum and milk by protein array. Clin Chem. 2007;53(5):955–62. doi: 10.1373/clinchem.2006.077107. [DOI] [PubMed] [Google Scholar]
- 5.Lonnerdal B. Nutritional and physiologic significance of human milk proteins. Am J Clin Nutr. 2003;77(6):1537S–1543S. doi: 10.1093/ajcn/77.6.1537S. [DOI] [PubMed] [Google Scholar]
- 6.Lonnerdal B, Lien EL. Nutritional and physiologic significance of alpha-lactalbumin in infants. Nutr Rev. 2003;61(9):295–305. doi: 10.1301/nr.2003.sept.295-305. [DOI] [PubMed] [Google Scholar]
- 7.Moro GE, Arslanoglu S. Reproducing the bifidogenic effect of human milk in formula-fed infants: why and how? Acta Paediatr Suppl. 2005;94(449):14–7. doi: 10.1111/j.1651-2227.2005.tb02148.x. [DOI] [PubMed] [Google Scholar]
- 8.Newburg DS. Human milk glycoconjugates that inhibit pathogens. Curr Med Chem. 1999;6(2):117–27. [PubMed] [Google Scholar]
- 9.Newburg DS, Ruiz-Palacios GM, Morrow AL. Human milk glycans protect infants against enteric pathogens. Annu Rev Nutr. 2005;25:37–58. doi: 10.1146/annurev.nutr.25.050304.092553. [DOI] [PubMed] [Google Scholar]
- 10.Packard VS. Human milk and infant formula. Academic Press; New York: 1982. pp. x–269. [Google Scholar]
- 11.Parracho H, McCartney AL, Gibson GR. Probiotics and prebiotics in infant nutrition. Proc Nutr Soc. 2007;66(3):405–11. doi: 10.1017/S0029665107005678. [DOI] [PubMed] [Google Scholar]
- 12.Hakansson A, Zhivotovsky B, Orrenius S, Sabharwal H, Svanborg C. Apoptosis induced by a human milk protein. Proc Natl Acad Sci U S A. 1995;92(17):8064–8. doi: 10.1073/pnas.92.17.8064. [DOI] [PMC free article] [PubMed] [Google Scholar]
- 13.Ziegler E, Vanderhoof JA, Petschow B, Mitmesser SH, Stolz SI, Harris CL, Berseth CL. Term infants fed formula supplemented with selected blends of prebiotics grow normally and have soft stools similar to those reported for breast-fed infants. J Pediatr Gastroenterol Nutr. 2007;44(3):359–64. doi: 10.1097/MPG.0b013e31802fca8c. [DOI] [PubMed] [Google Scholar]
- 14.Ward RE, Ninonuevo M, Mills DA, Lebrilla CB, German JB. In vitro fermentation of breast milk oligosaccharides by Bifidobacterium infantis and Lactobacillus gasseri. Appl Environ Microbiol. 2006;72(6):4497–9. doi: 10.1128/AEM.02515-05. [DOI] [PMC free article] [PubMed] [Google Scholar]
- 15.Boehm G, Stahl B, Jelinek J, Knol J, Miniello V, Moro GE. Prebiotic carbohydrates in human milk and formulas. Acta Paediatr Suppl. 2005;94(449):18–21. doi: 10.1111/j.1651-2227.2005.tb02149.x. [DOI] [PubMed] [Google Scholar]
- 16.Moriuchi M, Moriuchi H. A milk protein lactoferrin enhances human T cell leukemia virus type I and suppresses HIV-1 infection. J Immunol. 2001;166(6):4231–6. doi: 10.4049/jimmunol.166.6.4231. [DOI] [PubMed] [Google Scholar]
- 17.Li YM, Tan AX, Vlassara H. Antibacterial activity of lysozyme and lactoferrin is inhibited by binding of advanced glycation-modified proteins to a conserved motif. Nat Med. 1995;1(10):1057–61. doi: 10.1038/nm1095-1057. [DOI] [PubMed] [Google Scholar]
- 18.Naarding MA, Dirac AM, Ludwig IS, Speijer D, Lindquist S, Vestman EL, Stax MJ, Geijtenbeek TB, Pollakis G, Hernell O, Paxton WA. Bile salt- stimulated lipase from human milk binds DC-SIGN and inhibits human immunodeficiency virus type 1 transfer to CD4+ T cells. Antimicrob Agents Chemother. 2006;50(10):3367–74. doi: 10.1128/AAC.00593-06. [DOI] [PMC free article] [PubMed] [Google Scholar]
- 19.Ninonuevo MR, Perkins PD, Francis J, Lamotte LM, LoCascio RG, Freeman SL, Mills DA, German JB, Grimm R, Lebrilla CB. Daily variations in oligosaccharides of human milk determined by microfluidic chips and mass spectrometry. J Agric Food Chem. 2008;56(2):618–26. doi: 10.1021/jf071972u. [DOI] [PubMed] [Google Scholar]
- 20.Coppa GV, Bruni S, Morelli L, Soldi S, Gabrielli O. The first prebiotics in humans: human milk oligosaccharides. J Clin Gastroenterol. 2004;38(6 Suppl):S80–3. doi: 10.1097/01.mcg.0000128926.14285.25. [DOI] [PubMed] [Google Scholar]
- 21.Palmer DJ, Kelly VC, Smit AM, Kuy S, Knight CG, Cooper GJ. Human colostrum: Identification of minor proteins in the aqueous phase by proteomics. Proteomics. 2006;6(7):2208–2216. doi: 10.1002/pmic.200500558. [DOI] [PubMed] [Google Scholar]
- 22.Cavaletto M, Giuffrida MG, Conti A. The proteomic approach to analysis of human milk fat globule membrane. Clin Chim Acta. 2004;347(1-2):41–8. doi: 10.1016/j.cccn.2004.04.026. [DOI] [PubMed] [Google Scholar]
- 23.Charlwood J, Hanrahan S, Tyldesley R, Langridge J, Dwek M, Camilleri P. Use of proteomic methodology for the characterization of human milk fat globular membrane proteins. Anal Biochem. 2002;301(2):314–24. doi: 10.1006/abio.2001.5498. [DOI] [PubMed] [Google Scholar]
- 24.Brines RD, Brock JH. The effect of trypsin and chymotrypsin on the in vitro antimicrobial and iron-binding properties of lactoferrin in human milk and bovine colostrum. Unusual resistance of human apolactoferrin to proteolytic digestion. Biochim Biophys Acta. 1983;759(3):229–35. doi: 10.1016/0304-4165(83)90317-3. [DOI] [PubMed] [Google Scholar]
- 25.Varki A. Biological roles of oligosaccharides: all of the theories are correct. Glycobiology. 1993;3(2):97–130. doi: 10.1093/glycob/3.2.97. [DOI] [PMC free article] [PubMed] [Google Scholar]
- 26.Wormald MR, Dwek RA. Glycoproteins: glycan presentation and protein-fold stability. Structure. 1999;7(7):R155–60. doi: 10.1016/s0969-2126(99)80095-1. [DOI] [PubMed] [Google Scholar]
- 27.O’Connor SE, Imperiali B. Modulation of protein structure and function by asparagine-linked glycosylation. Chemistry & biology. 1996;3(10):803–12. doi: 10.1016/s1074-5521(96)90064-2. [DOI] [PubMed] [Google Scholar]
- 28.Imperiali B, Rickert KW. Conformational implications of asparagine-linked glycosylation. Proceedings of the National Academy of Sciences of the United States of America. 1995;92(1):97–101. doi: 10.1073/pnas.92.1.97. [DOI] [PMC free article] [PubMed] [Google Scholar]
- 29.Lopez-Exposito I, Recio I. Protective effect of milk peptides: antibacterial and antitumor properties. Adv Exp Med Biol. 2008;606:271–93. doi: 10.1007/978-0-387-74087-4_11. [DOI] [PubMed] [Google Scholar]
- 30.Jones EM, Smart A, Bloomberg G, Burgess L, Millar MR. Lactoferricin, a new antimicrobial peptide. The Journal of applied bacteriology. 1994;77(2):208–14. doi: 10.1111/j.1365-2672.1994.tb03065.x. [DOI] [PubMed] [Google Scholar]
- 31.Wessel D, Flugge UI. A method for the quantitative recovery of protein in dilute solution in the presence of detergents and lipids. Anal Biochem. 1984;138(1):141–3. doi: 10.1016/0003-2697(84)90782-6. [DOI] [PubMed] [Google Scholar]
- 32.Laemmli UK. Cleavage of structural proteins during the assembly of the head of bacteriophage T4. Nature. 1970;227(5259):680–5. doi: 10.1038/227680a0. [DOI] [PubMed] [Google Scholar]
- 33.O’Connor PB, Costello CE. Internal calibration on adjacent samples (InCAS) with Fourier transform mass spectrometry. Anal Chem. 2000;72(24):5881–5. doi: 10.1021/ac000770t. [DOI] [PubMed] [Google Scholar]
- 34.Dodds ED, An HJ, Hagerman PJ, Lebrilla CB. Enhanced peptide mass fingerprinting through high mass accuracy: Exclusion of non-peptide signals based on residual mass. J Proteome Res. 2006;5(5):1195–203. doi: 10.1021/pr050486o. [DOI] [PubMed] [Google Scholar]
- 35.Perkins DN, Pappin DJ, Creasy DM, Cottrell JS. Probability-base1 d protein identification by searching sequence databases using mass spectrometry data. Electrophoresis. 1999;20(18):3551–67. doi: 10.1002/(SICI)1522-2683(19991201)20:18<3551::AID-ELPS3551>3.0.CO;2-2. [DOI] [PubMed] [Google Scholar]
- 36.Keller A, Nesvizhskii AI, Kolker E, Aebersold R. Empirical statistical model to estimate the accuracy of peptide identifications made by MS/MS and database search. Anal Chem. 2002;74(20):5383–92. doi: 10.1021/ac025747h. [DOI] [PubMed] [Google Scholar]
- 37.Nesvizhskii AI, Keller A, Kolker E, Aebersold R. A statistical model for identifying proteins by tandem mass spectrometry. Anal Chem. 2003;75(17):4646–58. doi: 10.1021/ac0341261. [DOI] [PubMed] [Google Scholar]
- 38.Clowers BH, Dodds ED, Seipert RR, Lebrilla CB. Dual polarity accurate mass calibration for electrospray ionization and matrix-assisted laser desorption/ionization mass spectrometry using maltooligosaccharides. Analytical Biochemistry. 2008;381(2):205–213. doi: 10.1016/j.ab.2008.06.041. [DOI] [PMC free article] [PubMed] [Google Scholar]
- 39.Dodds ED, Clowers BH, Hagerman PJ, Lebrilla CB. Systematic characterization of high mass accuracy influence on false discovery and probability scoring in peptide mass fingerprinting. Anal Biochem. 2008;372(2):156–66. doi: 10.1016/j.ab.2007.10.009. [DOI] [PMC free article] [PubMed] [Google Scholar]
- 40.Steinberg TH, Pretty On Top K, Berggren KN, Kemper C, Jones L, Diwu Z, Haugland RP, Patton WF. Rapid and simple single nanogram detection of glycoproteins in polyacrylamide gels and on electroblots. Proteomics. 2001;1(7):841–55. doi: 10.1002/1615-9861(200107)1:7<841::AID-PROT841>3.0.CO;2-E. [DOI] [PubMed] [Google Scholar]
- 41.Vincent SG, Cunningham PR, Stephens NL, Halayko AJ, Fisher JT. Quantitative densitometry of proteins stained with coomassie blue using a Hewlett Packard scanjet scanner and Scanplot software. Electrophoresis. 1997;18(1):67–71. doi: 10.1002/elps.1150180114. [DOI] [PubMed] [Google Scholar]
- 42.Washburn MP, Wolters D, Yates JR., 3rd Large-scale analysis of the yeast proteome by multidimensional protein identification technology. Nat Biotechnol. 2001;19(3):242–7. doi: 10.1038/85686. [DOI] [PubMed] [Google Scholar]
- 43.Giuffrida MG, Cavaletto M, Giunta C, Neuteboom B, Cantisani A, Napolitano L, Calderone V, Godovac-Zimmermann J, Conti A. The unusual amino acid triplet Asn-Ile-Cys is a glycosylation consensus site in human alpha-lactalbumin. J Protein Chem. 1997;16(8):747–53. doi: 10.1023/a:1026359715821. [DOI] [PubMed] [Google Scholar]
- 44.Picariello G, Ferranti P, Mamone G, Roepstorff P, Addeo F. Identification of N-linked glycoproteins in human milk by hydrophilic interaction liquid chromatography and mass spectrometry. Proteomics. 2008;8(18):3833–47. doi: 10.1002/pmic.200701057. [DOI] [PubMed] [Google Scholar]
- 45.Landberg E, Huang Y, Stromqvist M, Mechref Y, Hansson L, Lundblad A, Novotny MV, Pahlsson P. Changes in glycosylation of human bile-salt-stimulated lipase during lactation. Arch Biochem Biophys. 2000;377(2):246–54. doi: 10.1006/abbi.2000.1778. [DOI] [PubMed] [Google Scholar]
- 46.Hernell O, Ward H, Blackberg L, Pereira MEA. Killing of Giardia-Lamblia by Human-Milk Lipases - an Effect Mediated by Lipolysis of Milk Lipids. J Infect Dis. 1986;153(4):715–720. doi: 10.1093/infdis/153.4.715. [DOI] [PubMed] [Google Scholar]
- 47.van Veen HA, Geerts ME, van Berkel PH, Nuijens JH. The role of N-linked glycosylation in the protection of human and bovine lactoferrin against tryptic proteolysis. Eur J Biochem. 2004;271(4):678–84. doi: 10.1111/j.1432-1033.2003.03965.x. [DOI] [PubMed] [Google Scholar]
- 48.Davidson LA, Lonnerdal B. Specific binding of lactoferrin to brush-border membrane: ontogeny and effect of glycan chain. The American journal of physiology. 1988;254(4 Pt 1):G580–5. doi: 10.1152/ajpgi.1988.254.4.G580. [DOI] [PubMed] [Google Scholar]
- 49.Apweiler R, Hermjakob H, Sharon N. On the frequency of protein glycosylation, as deduced from analysis of the SWISS-PROT database. Biochim Biophys Acta. 1999;1473(1):4–8. doi: 10.1016/s0304-4165(99)00165-8. [DOI] [PubMed] [Google Scholar]