

Abstract
Immune homeostasis is dependent on tight control over the size of a population of regulatory T (Treg) cells capable of suppressing over-exuberant immune responses. The Treg cell subset is comprised of cells that commit to the Treg lineage by upregulating the transcription factor Foxp3 either in the thymus (tTreg) or in the periphery (iTreg)1,2. Considering a central role for Foxp3 in Treg cell differentiation and function3,4, we proposed that conserved non-coding DNA sequence (CNS) elements at the Foxp3 locus encode information defining the size, composition and stability of the Treg cell population. Here we describe the function of three Foxp3 CNS elements (CNS1–3) in Treg cell fate determination in mice. The pioneer element CNS3, which acts to potently increase the frequency of Treg cells generated in the thymus and the periphery, binds c-Rel in in vitro assays. In contrast, CNS1, which contains a TGF-β–NFAT response element, is superfluous for tTreg cell differentiation, but has a prominent role in iTreg cell generation in gut-associated lymphoid tissues. CNS2, although dispensable for Foxp3 induction, is required for Foxp3 expression in the progeny of dividing Treg cells. Foxp3 binds to CNS2 in a Cbf-β–Runx1 and CpG DNA demethylation-dependent manner, suggesting that Foxp3 recruitment to this ‘cellular memory module’ facilitates the heritable maintenance of the active state of the Foxp3 locus and, therefore, Treg lineage stability. Together, our studies demonstrate that the composition, size and maintenance of the Treg cell population are controlled by Foxp3 CNS elements engaged in response to distinct cell-extrinsic or -intrinsic cues.
To determine cis-elements that are potentially involved in the control of Treg cell fate, we first examined permissive (mono-methylated histone H3 at Lys4 (H3K4me1), di-methylated H3K4 (H3K4me2), H3K4me3, H3K36me3, and acetylated H3K9/14 (H3K9/14Ac)) and non-permissive (H3K9me2, H3K9me3 and H3K27me3) modifications of histone H3 bound to three Foxp3 CNS elements (CNS1–3; Fig. 1a) in CD4+CD25−Foxp3− naive T cells (TN), CD4+CD25+Foxp3+ Treg cells, and B220+ B cells isolated from C57BL/6 mice (Fig. 1b–e and data not shown). Chromatin immunoprecipitation (ChIP) showed 5′-end enrichment for H3K4me3 and H3K9/14Ac—chromatin marks characteristic of actively transcribed genes5—at the Foxp3 locus exclusively in Treg cells (Fig. 1b, c). Notably, discrete peaks of H3K4me2 and H3K4me1, but not H3K4me3, were observed at CNS3 in Foxp3− CD4 T cells, but not in B cells (Fig. 1c–e). Furthermore, H3K4me1 was also markedly enriched at CNS3 in CD4+CD8−Foxp3− and CD4+CD8+Foxp3− thymocyte subsets serving as thymic Treg precursors (Fig. 1f). These H3K4 features, characteristic of active or poised distal regulatory elements6,7, suggested that CNS3 facilitates Foxp3 induction during thymic and peripheral Treg cell differentiation. Recent studies suggested that synergistic binding of Smad3 and NFAT to CNS1, and binding of both CREB and STAT5 to CNS2, are essential for Foxp3 induction8–10. However, the absence of permissive CNS1- and CNS2-associated chromatin features in Treg precursors indicated that CNS3 probably acts earlier than these two elements during Foxp3 induction.
Figure 1. Conserved non-coding sequences and chromatin modifications at the Foxp3 locus.
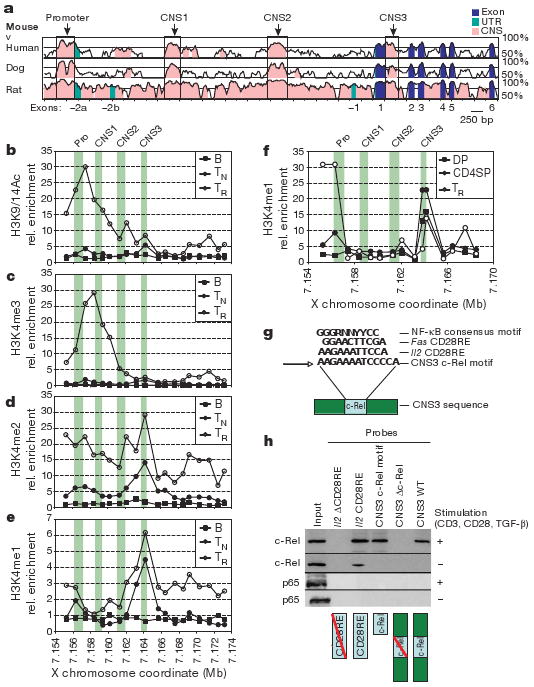
a, Comparison of mouse Foxp3 genomic sequence to human, dog and rat. b–e, Map of permissive chromatin modifications at the Foxp3 locus by ChIP–qPCR with primers spaced at ∼1-kb intervals for B220+ B cells (B), CD4+CD25− TN cells, and CD4+CD25+ Treg (TR) cells. Relative (rel.) enrichment data are shown for H3K9/14Ac (b), H3K4me3 (c), H3K4me2 (d) and H3K4me1 (e). f, H3K4me1 ChIP–qPCR as in e, for CD4+CD8+ (double positive, DP) and CD4+CD8− (CD4 single positive, CD4SP) thymocytes, and Treg cells. In b–f, green bars denote the promoter (Pro) and CNS1–3. g, NF-κB consensus motif in CNS3 (core motif in bold) and homologous CD28RE motifs from Il2 and Fas. N, any base; R, purine; Y, pyrimidine. h, Binding of NF-κB family member c-Rel but not p65 to the CD28RE-like element at CNS3. Nuclear lysates from unstimulated or stimulated (1 μg ml−1 CD3 and CD28 antibodies, 2 ng ml−1 TGF-β) TN cells were incubated with biotinylated double-stranded (ds)DNA probes containing the full-length CNS3 sequence (CNS3 WT), the full-length CNS3 sequence with the mutated core c-Rel motif (CNS3 Δc-Rel), the core CNS3 c-Rel motif, Il2 CD28RE (positive control), and Il2 ΔCD28RE (negative control). dsDNA probes and bound protein were precipitated by streptavidin beads and subjected to c-Rel and p65 western blot analysis.
In silico analysis of CNS3 revealed a motif (AGAAAATCC), resembling the CD28 response element (CD28RE) in the Il2 locus, known to bind c-Rel homodimers11 (Fig. 1g). Using nuclear extracts of stimulated TN cells, we demonstrated c-Rel binding to the full-length CNS3 probe, the core CD28RE-like CNS3 element, and the IL2 CD28RE (positive control), but not to a full-length CNS3 probe containing a mutated CD28RE-like sequence (Fig. 1h). Neither p50 (also known as Nfkb1) nor p65 (also known as Rela) bound the core CNS3 CD28RE-like sequence (Fig. 1h and data not shown) suggesting that c-Rel binds to CNS3 as a homodimer. CNS3 did not show enhancer activity in a luciferase reporter assay, in contrast to the stimulation-dependent increase in luciferase activity in the presence of CNS2 and the TGF-β-dependent increase in the presence of CNS1 (Supplementary Fig. 1)8,9. Thus, it is possible that CNS3 binding by c-Rel after its T-cell receptor (TCR)- and CD28-induced activation may facilitate opening of the Foxp3 locus in a manner similar to its function in the remodelling and activation of the Il2 locus11.
To determine the in vivo function of the three CNS elements, we generated mice containing individual CNS deletions combined with insertion of a green fluorescent protein (GFP) reporter: Foxp3ΔCNS1-gfp (CNS1-KO), Foxp3ΔCNS2-gfp (CNS2-KO) and Foxp3ΔCNS3-gfp (CNS3-KO) (Supplementary Fig. 2). CNS deletions did not cause gross alterations in histone modifications or DNA methylation across the Foxp3 locus, suggesting that its overall organization was not non-specifically perturbed (Supplementary Figs 3 and 4). Consistent with the hypothesis that CNS3 acts as a pioneer element, we observed a ∼5-fold decrease in the frequency of Foxp3+ CD4 single-positive (CD4SP) thymocytes with CNS3 deletion, whereas the amount of Foxp3 on a per cell basis was unaffected (Fig. 2a and Supplementary Figs 5 and 6). Marked decreases in CNS3-deficient Treg cells were also observed in female Foxp3ΔCNS3-gfp/wt heterozygous mice containing CNS3-deficient and -sufficient Foxp3+ cells, whereas control heterozygous Foxp3gfp/wt mice expressed each allele at roughly equal frequencies (Supplementary Fig. 7). Notably, numbers of proliferating Ki67+Foxp3+ thymocytes and peripheral cells were increased in CNS3-KO mice compared to controls (Fig. 2b). Thus, expansion of small numbers of Foxp3+ cells is partially compensating a severe impairment in Foxp3 induction in the absence of CNS3. Consistent with this notion, peripheral Treg cell frequencies were only moderately diminished in Foxp3ΔCNS3-gfp mice (Fig. 2a and Supplementary Fig. 5). It seems unlikely that this recovery was due to increased generation of iTreg cells because we observed substantial impairment in TGF-β-mediated Foxp3 induction in CNS3-deficient peripheral CD4 TN cells (Supplementary Fig. 8). Therefore, CNS3 potently increases the probability of Foxp3 gene expression during thymic and peripheral differentiation of Treg cells.
Figure 2. CNS3 controls de novo Foxp3 expression.
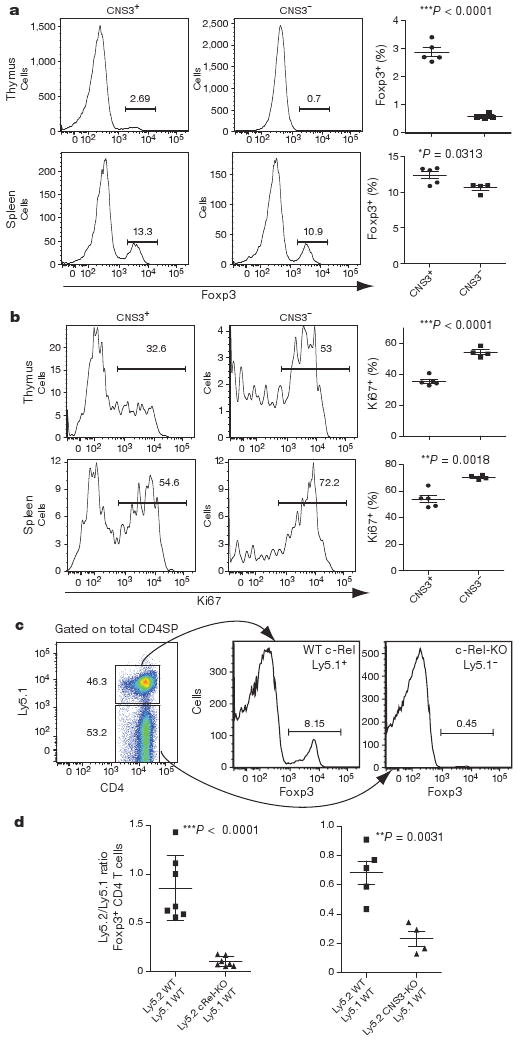
a, Frequency of Foxp3+ Treg cells among CD4+CD8− cells from thymus and spleen of 2-week-old CNS3-KO mice or littermate controls. b, Frequency of Ki67+ dividing thymic or splenic Foxp3+ Treg cells from same mice as in a. c, d, Analysis of c-Rel-KO (Ly5.2) and wild-type (WT; Ly5.1) mixed bone marrow chimaeras and CNS3-KO (Ly5.2) and wild-type (Ly5.1) mixed bone marrow chimaeras. c, Frequency of Foxp3 expressing cells among CD4SP thymocytes of wild-type (Ly5.1+) or c-Rel-KO (Ly5.2+) origin. d, Ratio of Ly5.2+ (wild-type and c-Rel-KO, left, or wild-type and CNS3-KO, right) cells to Ly5.1+ (wild-type) cells within thymic CD4SP Foxp3+ population. Error bars (a, b, d) denote mean ± s.d.
To evaluate the cell-intrinsic role of c-Rel in the induction of Foxp3 we transferred bone marrow cells from Ly5.2+ wild-type, c-Rel-KO, or CNS3-KO mice, mixed at a 1:1 ratio with bone marrow from Ly5.1+ wild-type mice, into irradiated Rag1−/− recipients. In the resulting chimaeras, c-Rel-deficient thymocytes and peripheral T cells showed severely impaired Foxp3 expression similar to CNS3-KO cells, whereas wild-type precursors generated Foxp3+ Treg cells at expected frequencies (Fig. 2c, d and data not shown). These results indicate that c-Rel, activated in response to TCR and CD28 triggering, engages the poised regulatory element CNS3 to facilitate Foxp3 expression and Treg cell differentiation.
Recent studies have suggested that TGF-β may be important for the differentiation of both thymic and peripheral Treg cells8,12. However, we found that Foxp3ΔCNS1-gfp mice have no defect in tTreg generation (Fig. 3a). Furthermore, female heterozygous Foxp3ΔCNS1-gfp/wt mice contain equal frequencies of CNS1-deficient and -sufficient CD4SP and CD4+ CD8+ double-positive Foxp3+ thymocytes (Supplementary Fig. 9). Thus, CNS1 is dispensable for thymic Treg cell differentiation. However, we observed markedly impaired in vitro induction of Foxp3 in CNS1-deficient TN cells (Fig. 3b). To examine peripheral induction of Foxp3 in vivo, we co-transferred CNS1-sufficient and -deficient Ly5.2+ CD4 TN cells with wild-type Ly5.1+ Treg cells into T-cell-deficient recipients. CNS1-deficient CD4 TN cells were defective in their ability to induce Foxp3, that is, generate iTreg cells, most prominently in gut-associated lymphoid tissues (GALT) (Fig. 3c). These observations led us to examine the frequency of Foxp3+ Treg in GALT and mesenteric lymph nodes (MLN)—sites of TGF-β-dependent iTreg generation—in unmanipulated Foxp3ΔCNS1-gfp mice. Although Foxp3+ Treg cell numbers were largely unaffected in the spleen and non-gut draining lymph nodes in Foxp3ΔCNS1-gfp mice, we observed a marked decrease in the size of the CNS1-deficient Treg subsets in GALT and MLN compared to littermate controls (Fig. 3d and Supplementary Fig. 10). Furthermore, we failed to observe a characteristic age-dependent increase in the frequency of Treg cells in the absence of CNS1 (Fig. 3d and Supplementary Fig. 10). This defect was due to impaired iTreg generation, because we did not observe any defect in the ability of mature CNS1-KO Treg cells to maintain Foxp3 expression after their transfer into lymphopenic recipients (Supplementary Fig. 11). Together these studies indicate that CNS1 is critical for peripheral induction of Foxp3, occurring primarily in GALT and MLN. The profound defect in iTreg generation in CNS1-KO mice suggests that CNS1 functions solely in the induction of Foxp3 in peripheral CD4 TN cells in response to TGF-β, probably in cooperation with CNS3.
Figure 3. CNS1 controls peripheral, but not thymic, induction of Foxp3 expression.

a, Frequency of Foxp3+ Treg cells among thymic CD4SP cells in CNS1-KO mice or littermate controls. NS, not significant. b, Frequency of Foxp3+ iTreg cells generated after stimulation of TN cells from CNS1-KO or littermate control mice with anti-CD3 (1 μg ml−1), TGF-β (2 ng ml−1) and Ly5.1+ irradiated (20 Gy) T-cell-depleted splenocytes for 72h. c, Frequency of in vivo generated Foxp3+ iTreg cells among CD4+ cells in spleen, Peyer's patches, intraepithelial lymphocytes (IELs), and lamina propria lymphocytes (LPLs). CNS1-KO or wild-type Ly5.2+CD4+Foxp3− naive T cells were co-transferred with wild-type Ly5.1+Foxp3+ Treg cells into T-cell-deficient recipient mice. Ten weeks later, Ly5.2+Foxp3+ cell populations were analysed by flow cytometry. Error bars denote mean ± s.d. d, Frequency of Foxp3+ Treg cells among CD4+ T cells in peripheral lymph nodes (LN; ‘non-mesenteric’), and Peyer's patches of 8–11-month-old CNS1-KO or littermate control mice.
Despite impaired iTreg cell generation and significantly reduced Treg cell presence in GALT, no significant immune-mediated lesions were observed in the colon, small intestine, or elsewhere in CNS1-KO mice up to 1 year of age (Supplementary Fig. 12). These observations were rather unexpected considering the current view that a block in iTreg differentiation should result in increased inflammation owing to enhanced TH17 differentiation. However, despite a marked decrease in Foxp3+ cells in the MLN of CNS1-deficient mice, the frequencies of TH17 cells were unaffected, but IL10-producing Foxp3− (Tr1) cell numbers were increased (Supplementary Fig. 13). This observation raises an intriguing possibility that Tr1 and iTreg cells represent alternative fates of T-cell differentiation, and that their immunoregulatory function may be partially redundant in GALT. In agreement with this idea, we found comparable weight loss in CNS1-deficient and -sufficient mice in both acute and chronic models of dextran sulphate sodium (DSS)-induced colitis (Supplementary Fig. 14). Thus, our results indicate different mechanistic requirements for the differentiation of peripheral and thymic Treg cells and their distinct biological functions.
Owing to the non-permissive chromatin configuration at CNS2 in Foxp3− cells and the methylated state of CNS2 CpG motifs in both Foxp3− T cells and in in vitro generated Foxp3+ iTreg cells13, we expected CNS2 to function primarily in ‘mature’ Treg cells, in which this CpG island is demethylated. Indeed, Foxp3ΔCNS2-gfp mice exhibited normal numbers of Foxp3+ thymocytes and Foxp3 expression on a per cell basis (Fig. 4a and Supplementary Fig. 15), and showed unimpeded TGF-β-dependent Foxp3 induction (Supplementary Fig. 16). However, the frequency of Foxp3+ Treg cells was significantly decreased among splenocytes of 6-month-old or older (Fig. 4a), but not younger, CNS2-deficient mice (data not shown), suggesting a role for CNS2 in the maintenance of Foxp3 expression in mature Treg cells. To examine this possibility, we co-transferred fluorescence-activated cell sorting (FACS)-purified CNS2-deficient or -sufficient Ly5.2+ Foxp3+ Treg cells with wild-type Ly5.1+ Foxp3− TN cells into T-cell-deficient recipients. Indeed, CNS2 deficiency markedly impaired maintenance of Foxp3 expression (Fig. 4b and Supplementary Fig. 17). In contrast, CNS1- and CNS3-deficient Treg cells were not compromised in their ability to maintain Foxp3 expression (Supplementary Fig. 11 and data not shown). Furthermore, division of carboxy fluorescein succinimidyl ester (CFSE)-labelled CNS2-deficient Treg cells stimulated with CD3 and CD28 antibodies in the presence of IL2 resulted in a progressive decrease in the frequency of Foxp3+ cells and amount of Foxp3 per cell, whereas wild-type Treg cells showed expected increases in both (Fig. 4c). Thus, CNS2 is responsible for heritable Foxp3 expression in dividing mature Treg cells and resembles ‘cellular memory modules’ regulating gene expression during Drosophila development14.
Figure 4. CNS2 controls the heritable maintenance of Foxp3 expression.
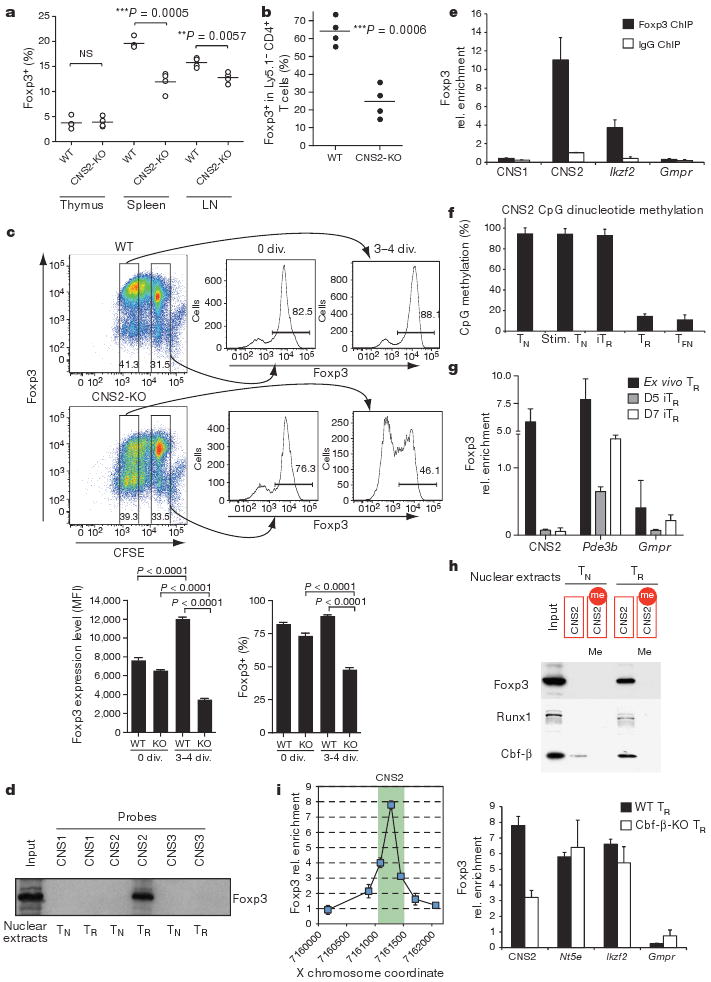
a, Frequency of Foxp3+ Treg cells among CD4SP thymocytes or splenic and lymph node CD4+ cells in 6-month-old CNS2-KO mice or littermate controls. b, Maintenance of Foxp3 expression in Treg cells from Ly5.2+ CNS2-KO or wild-type mice 4 weeks after co-transfer with wild-type Ly5.1+CD4+Foxp3− cells into T-cell-deficient recipient mice. c, Cell division (div.) results in lower Foxp3 expression level and frequency in CNS2-KO Treg cells compared to wild-type Treg cells. CFSE-labelled CNS2-KO or wild-type Foxp3+ Treg cells were cultured in vitro for 3 days before flow cytometric analysis of Foxp3 expression. MFI, mean fluorescence intensity. d, Foxp3 binds to dsDNA probes containing CNS2 sequences. Biotinylated dsDNA probes containing CNS1–3 sequences were incubated with nuclear extracts from TN or TR cells, precipitated with streptavidin beads and subjected to Foxp3 western blot analysis. e, Anti-Foxp3 ChIP was performed using wild-type CD4+CD25+ Treg cells to detect Foxp3 binding to CNS regions in vivo. The Foxp3 target gene Ikzf2 was used as a positive control, Gmpr as a non-Foxp3-binding negative control. f, Percentages of CpG dinucleotide methylation at CNS2 determined by bisulphite pyrosequencing in TN cells, TN cells stimulated for 72 h with anti-CD3 and anti-CD28 antibodies (stim. TN), purified Foxp3+ induced Treg (iTR, TN stimulated as above with 2 ng ml−1 TGF-β), CD4+CD25+ Treg (TR) cells, and TFN from Foxp3gfpko mice. g, Foxp3 ChIP at CNS2, the Foxp3 target gene Pde3b (positive control), and Gmpr (negative control) in ex vivo Treg cells and iTreg cells collected on days (D) 5 and 7 of culture with 1μg ml−1 plate-bound CD3 and CD28 antibodies and 2 ng ml−1 TGF-β. h, CpG methylation-sensitive-binding of Foxp3, Runx1 and Cbf-β was determined using methylated and demethylated biotinylated dsDNA CNS2 probes incubated with nuclear extracts from TN and TR before streptavidin precipitation and western blot analysis as in d. i, High-resolution Foxp3 ChIP–qPCR at CNS2 (for primer sequences see Supplementary Table 2) (left) and Foxp3 ChIP in wild-type and Cbf-β-deficient Treg cells from Cbfbfl/flFoxp3Cre mice (right). Green bar denotes the CNS2 region. Foxp3 binding to Nt5e and Ikzf2 served as positive and to Gmpr as negative controls. Error bars (c, e–g, i) denote mean ± s.d.
Next, we sought to explore the trans-acting factors that may facilitate heritable maintenance of Foxp3 expression after binding to CNS2. CREB and STAT5, previously reported to bind CNS2 (refs 8, 15), were unlikely candidates because retroviral expression of a dominant-negative mutant of CREB in Treg cells did not affect Foxp3 expression, and the STAT5-deficient Treg population isolated from Foxp3CreStat5fl/fl mice maintained frequencies of Foxp3+ cells similar to wild-type controls when transferred into Treg-depleted recipients (data not shown). In contrast, GFP+ Foxp3-null T cells (TFN) expressing a Foxp3 reporter ‘null’ allele (Foxp3gfpko), exhibit unstable GFP expression3. To determine whether TFN cells have a similar defect to CNS2-deficient Treg cells in the maintenance of Foxp3 expression we transferred purified GFP+ TFN cells, or GFP+ Treg cells from Foxp3gfp or Foxp3ΔCNS2-gfp mice together with Ly5.1+ CD4 T cells into T-cell-deficient recipients. A profound decrease in the frequency of GFP+ TFN and CNS2-deficient Treg cells in comparison with CNS2-sufficient Treg cells (Supplementary Fig. 18) suggested a potential role for Foxp3 in maintaining its own expression through binding to CNS2. Indeed, Foxp3 from Treg nuclear extracts bound robustly to CNS2 probes (Fig. 4d), and Foxp3 ChIP showed its occupancy of CNS2 in Treg cells (Fig. 4e). Because both demethylation of the CpG island in CNS2 and Foxp3 binding to CNS2 are associated with stable expression of Foxp3, we next explored whether CNS2 demethylation is dependent on Foxp3 binding and vice versa. In GFP+ TFN cells lacking Foxp3 protein, and in wild-type Treg cells, CNS2 was similarly demethylated (Fig. 4f), suggesting that CpG demethylation within CNS2 is not dependent on Foxp3. Furthermore, Foxp3 was not bound to CNS2 in purified Foxp3+ iTreg cells, whereas Foxp3 binding to a control Foxp3 target gene, Pde3b, was readily detectable by ChIP (Fig. 4g). In agreement with previous findings9, the CNS2 CpG island remained methylated in iTreg cells (Fig. 4f). Additionally, Foxp3 failed to bind to fully methylated CNS2 probes in vitro (Fig. 4h). These results indicate that Foxp3 binding to CNS2 occurs after, and is dependent on, demethylation of CNS2, and suggests that the lack of stable Foxp3 expression in iTreg cells may be attributable to a lack of CNS2 demethylation-dependent Foxp3 autoregulation.
Recent studies showed that Foxp3 protein forms large complexes that include Runx1–Cbf-β16. Similar to TFN cells lacking Foxp3 protein and CNS2-deficient Treg cells, Cbf-β-deficient Treg cells progressively lose Foxp3 expression after transfer into lymphopenic mice17. We found that, as with Foxp3, Runx1–Cbf-β binding to CNS2 (refs 18, 19) was CpG demethylation dependent (Fig. 4h). Fine mapping of the Foxp3–Runx1–Cbf-β complex binding site by Foxp3 ChIP and quantitative PCR (qPCR) using primer sets that tile CNS2 sequence at 200-base-pair (bp) intervals localized the Foxp3-binding peak to a small region containing a conserved Runx1-binding motif (Fig. 4i and Supplementary Fig. 19). Foxp3 binding to this region was impaired in Cbf-β-deficient Treg cells, suggesting that Foxp3 binds to CNS2 in a Runx1- and Cbf-β-dependent manner (Fig. 4i). In contrast, Foxp3 binding to control target genes (Nt5e and Ikzf2) was not affected in the absence of Cbf-β (Fig. 4i). Thus, it seems probable that maintenance of the active state of the Foxp3 locus in the progeny of dividing Treg cells is dependent on recruitment of Foxp3–Runx1–Cbf-β complexes to CNS2 after demethylation of the CNS2 CpG island. The proposed recruitment of a lineage-determining factor, such as Foxp3, to a cellular memory module element, which becomes accessible only in a fully differentiated state, represents a simple strategy to ensure the stability of cell fate.
Methods Summary
Mice
C57BL/6 (B6) and Ly5.1+ B6 congenic mice were purchased from the Jackson Laboratory; Foxp3gfp mice have been previously described20. Generation of Foxp3 CNS1 knockout Foxp3ΔCNS1-gfp, CNS2 knockout Foxp3ΔCNS2-gfp, and CNS3 knockout Foxp3ΔCNS3-gfp mice are described in Methods. Relative to the Foxp3 transcription start site, locations of deleted CNS regions are: CNS1, +2003 to +2707; CNS2, +4262 to +4787; and CNS3, +6909 to +7103. All mice were maintained in the University of Washington SPF animal facility in accordance with institutional regulations.
Cell isolation
CD4+CD25− naive T cells, CD4+CD25+ regulatory T cells and B220+ B cells were purified from B6 mouse lymph nodes and spleens using magnetic beads (Miltenyi Biotec). Foxp3–GFP+ and Foxp3–GFP− cells were isolated by sorting on a FACS-Aria cell sorter (Becton Dickinson).
Foxp3 induction assay
In vitro Foxp3 induction was performed using FACS-sorted CD4+CD62Lhi Foxp3–GFP− naive T cells from Foxp3gfp or CNS-KO mice co-cultured with irradiated Ly5.1+ wild-type T-cell-depleted splenocytes for 3 days in the presence of soluble CD3 antibody (1 μg ml−1) and TGF-β (2 ngml−1), after which Foxp3 and CD4 expression were assessed by flow cytometry.
In vivo Treg maintenance assay
Five-hundred-thousand FACS-sorted Ly5.1−CD4+Foxp3–GFP+ Treg cells from Foxp3gfp or CNS-KO mice were co-injected with 2.5 × 10⁶ Ly5.1+CD4+CD62LhiFoxp3–GFP− naive T cells from Foxp3gfp into Rag1−/− recipient mice. Four weeks after transfer, Ly5.1−Foxp3+ and Ly5.1−Foxp3− cell populations were analysed by flow cytometry.
dsDNA probe pull-down and western blot analysis
Nuclear lysates were prepared from CD4+CD25+ Treg cells or CD4+CD25− TN cells isolated ex vivo or stimulated for 24h with plate-bound CD3 and CD28 antibodies (1 μg ml−1) in the presence of TGF-β (2 ng ml−1). After pre-clearance using streptavidin-conjugated magnetic beads (Invitrogen), nuclear lysates were incubated with biotinylated dsDNA probes (Supplementary Table 1) followed by incubation with streptavidin-conjugated beads each for 30min at 4°C. After 2–4 washes, the precipitated proteins were subjected to SDS–PAGE and western blot analysis.
Methods
Mice
C57BL/6 and Ly5.1+ B6 congenic mice were purchased from the Jackson Laboratory. Foxp3gfp mice have been previously described20. All mice were maintained in the University of Washington SPF animal facility in accordance with institutional regulations.
Generation of Foxp3 CNS knockout mice
All three CNS-targeting constructs were generated on the basis of the previously described Foxp3gfp construct1. For CNS2 and CNS3 constructs, a 8.5-kb SphI fragment of the Foxp3 gene containing exons 1–7 was obtained from a cosmid containing the complete Foxp3 genomic sequence. DNA containing enhanced GFP (eGFP) coding sequence was PCR amplified to delete the stop codon and add an NheI site at the 5′ end and an AvrII site at 3′ end at the same time. The modified eGFP open reading frame (ORF) was subcloned in-frame into the AvrII site in exon1 of the Foxp3 gene to generate the Foxp3gfp construct.
Starting from the Foxp3gfp construct, the CNS2-targeting construct was made by insertion of a FRT-PGK-Neo-BGHpA-FRT-LoxP cassette at a ClaI site 5′ of CNS2, and a single loxP sequence insertion at a NcoI site 3′ of CNS2 (Supplementary Fig. 2).
The CNS3-targeting construct was generated by modifying the Foxp3gfp construct in two steps. First, a single loxP sequence was inserted into the XhoI site upstream of CNS3. Because of the absence of a unique restriction enzyme site, a recombineering technique21 was used to insert the FRT-PGK-Neo-BGHpA-FRT-LoxP cassette downstream of CNS3. The principle and protocol of recombineering are described in detail at http://recombineering.ncifcrf.gov/. Two recombineering arms flanking the insertion point downstream of CNS3 were PCR cloned into a PL451 shuttle vector. A single recombineering step was carried out using standard protocol to insert the FRT-PGK-Neo-BGHpA-FRT-LoxP cassette downstream of CNS3 (Supplementary Fig. 2).
To generate the CNS1 construct, a further 2kb Foxp3 genomic DNA was inserted upstream of the 8.5-kb SphI fragment. An eGFP cassette was inserted in-frame as described earlier. Three recombineering steps were used to insert loxP and the FRT-PGK-Neo-BGHpA-FRT-LoxP cassette flanking CNS1 region. First, a loxP-Neo-loxP cassette was inserted upstream of CNS1 using a PL452 shuttle vector. Second, the Neo cassette was popped out in a CRE-recombinase-inducible Escherichia coli strain, leaving behind a single loxP site upstream of CNS1. Third, a FRT-PGK-Neo-BGHpA-FRT-LoxP cassette was inserted downstream of CNS1 using a PL451 shuttle vector.
All CNS-targeting constructs were electroporated into embryonic stem (ES) cell line R1, and selected for G418 and diphtheria-toxin-resistant colonies. Positive ES cell clones were first screened out by PCR, and confirmed by Southern blot. Confirmed positive ES cell clones were injected into B6 blastocysts to generate chimaerical mice, which are then bred with B6 mice for germ-line transmission. CNS-targeted germ-line transmitted mice were bred with FLPeR mouse, which carries FLP recombinase expressed under control of the ROSA26 locus, to delete the Neo cassette and generate CNS-floxed alleles. Finally, CNS-floxed mice were bred with Mox2-Cre mouse, which carries CRE recombinase expressed under control of the Meox2 (also known as Mox) locus, to induce germ-line deletion of CNS regions to generate CNS knockout mice.
Cell isolation
CD4+CD25− naive T cells, CD4+CD25+ Treg cells and B220+ B cells were purified from B6 mouse lymph nodes and spleens using MACS isolation kits as per the manufacturer's protocol (Miltenyi Biotec). Peripheral Foxp3–GFP+ and Foxp3–GFP− CD4+ T cells and Foxp3–GFP− CD4+CD8− and Foxp3–GFP− CD4+CD8+ thymocytes were isolated by sorting on a BD FACS-Aria cell sorter.
In vitro Foxp3 induction and stability assays
In vitro Foxp3 induction assays were performed using FACS-Aria sorted CD4+CD62Lhi Foxp3–GFP− naive T cells from Foxp3gfp or CNS-KO mice. Naive CD4 T cells were co-cultured with irradiated Ly5.1+ T-cell-depleted splenocytes for 3 days in the presence of soluble anti-CD3 antibody (1 μg ml−1) and TGF-β (2 ng ml−1), before being stained with anti-CD4 antibody and analysed by flow cytometry. For CFSE-labelled Treg cell stimulation assays, FACS-sorted Foxp3–GFP+ Treg cells (>98% purity) were labelled with CFSE (5 μM) in serum-free RPMI for 10 min at 37°C before washing with cold complete RPMI containing 10% FBS. Labelled Treg cells were cultured for 3 days in 96-well plates with plate-coated CD3 and CD28 antibodies (1 μg ml−1) in the presence of recombinant IL2 (500U ml−1). Cells were stained with CD4 and Foxp3 antibodies before flow cytometry analysis.
In vivo Treg maintenance assay
Five-hundred-thousand FACS-Aria sorted Ly5.1−CD4+ Foxp3–GFP+ Treg cells from Foxp3gfp or CNS-KO mice were co-injected with 2.5 × 10⁶ Ly5.1+CD4+CD62Lhi Foxp3–GFP− naive T cells from Ly5.1+Foxpgfp mice into Rag1−/− recipient mice. Four weeks after cell transfer, Ly5.1−Foxp3+ and Ly5.1−Foxp3− cell populations in recipient mice were analysed by flow cytometry.
dsDNA probe pull-down and western blot analysis
Ex vivo isolated CD4+CD25+ Treg cells or CD4+CD25− T cells were either unstimulated or stimulated for 24 h with plate-coated anti-CD3 and anti-CD28 antibodies (1 μg ml−1) in the presence of TGF-β (2 ng ml−1). Cells were then lysed and nuclear extracts were made. Extracts were pre-cleared using streptavidin-conjugated magnetic beads (Invitrogen) for 30 min at 4 °C, followed by incubation with biotinylated dsDNA probes (Supplementary Table 1) for 30 min at 4 °C on a rotator. Magnetic streptavidin beads were then added to the extracts and incubated at 4 °C for 30 min. The beads were collected using a magnet and washed two to four times. 2×SDS-loading buffer was added and the extracts were subjected to SDS–PAGE and western blot analysis.
Sequence conservation analysis
Comparisons of mouse Foxp3 genomic sequences to human, rat and dog were conducted using VISTA algorithm (visualization tool for alignment)22 according to the instruction on the VISTA website (http://genome.lbl.gov/vista/index.shtml).
ChIP and CpG dinucleotide methylation analysis
Foxp3 and histone ChIP have been described previously23. Antibodies specific for different histone modifications were from Upstate Biotechnology (H3K4me3/me2, H3K9/14ac, H3K9me3 and H3K27me3) and Abcam (H3K4me1, H3K36). The relative abundance of regions of interest in precipitated DNA was measured by qPCR using Power SYBR Green PCR master mix (Applied Biosystems). Real-time PCR primer sequences are listed in Supplementary Table 2. CpG dinucleotide methylation analysis was determined by bisulphite treatment of RNase-treated genomic DNA, followed by PCR amplification and pyrosequencing (Pyro Q-CpG, Qiagen). Pyro Q-CpG was performed by EpigenDX. Sequences analysed were: Foxp3 promoter, Foxp3 CNS2, Foxp3 3′ region, and Ppp1r3f promoter.
Isolation of IEL and LPL cells
Isolation of IEL and LPL cells has been described previously24. In brief, intestine was cut longitudinally and then into 2-cm pieces, washed three times with CMF (Ca2+- and Mg2+-free HBSS containing 1 mM HEPES, 2.5mM NaHCO, and 2% FCS, pH7.3). Washed intestinal pieces were stirred at 37 °C for 20 min in CMF containing 10% FCS and 1 mM dithiothreitol (DTT). IELs in supernatant were filtered through a cell strainer and separated by centrifugation on a 44–67% Percoll gradient. To isolate LPLs, the remaining intestinal pieces were washed three times in cold RPMI, and added to 50 ml of RPMI containing 1 mM MgCl2, 1 mM CaCl2, 1× HGPG (111.9 mg ml−1 HEPES, 29.2 mg ml−1 l-glutamine, 1,000U ml−1 penicillin, 1 mg ml−1 streptomycin, and 10 mg ml−1 gentamycin), and 150U ml−1 collagenase. Intestinal pieces were stirred at 37 °C for 1h, and released cells were then filtered through a cell strainer. LPLs were then separated by centrifugation on a 44–67% Percoll gradient.
Supplementary Material
Acknowledgments
We thank T.-T. Chu and L. Karpik for expert technical assistance and mouse colony management, S. Roh for embryonic stem cell culture and screening, J. Rasmussen and A. Kas for bioinformatics support, A. Beg for providing c-Rel knockout mice, P. Treuting for histopathology analysis, J. Gerard for assistance in luciferase reporter assays, and C. Wilson, S. Tarakhovsky and L.-F. Lu for critical comments on the manuscript. This work was supported by grants from the National Institutes of Health (to A.Y.R.). Y.Z. and A.C. were supported by the CRI-Irvington Institute postdoctoral fellowship. S.Z.J. was supported by the CRI pre-doctoral training grant. A.Y.R. is an investigator with the Howard Hughes Medical Institute.
Footnotes
Full Methods and any associated references are available in the online version of the paper at www.nature.com/nature.
Supplementary Information is linked to the online version of the paper at www.nature.com/nature.
Author Contributions Y.Z. and S.J. performed and analysed the experiments, with assistance from A.C. in oligonucleotide pull-down and from X.P.P. in ChIP experiments. K.F. assisted with blastocysts injections. S.J., Y.Z. and A.Y.R. designed experiments and wrote the paper.
Author Information Reprints and permissions information is available at www.nature.com/reprints. The authors declare no competing financial interests.
References
- 1.Sakaguchi S, Yamaguchi T, Nomura T, Ono M. Regulatory T cells and immune tolerance. Cell. 2008;133:775–787. doi: 10.1016/j.cell.2008.05.009. [DOI] [PubMed] [Google Scholar]
- 2.Zheng Y, Rudensky AY. Foxp3 in control of the regulatory T cell lineage. Nature Immunol. 2007;8:457–462. doi: 10.1038/ni1455. [DOI] [PubMed] [Google Scholar]
- 3.Gavin MA, et al. Foxp3-dependent programme of regulatory T-cell differentiation. Nature. 2007;445:771–775. doi: 10.1038/nature05543. [DOI] [PubMed] [Google Scholar]
- 4.Williams LM, Rudensky AY. Maintenance of the Foxp3-dependent developmental program in mature regulatory T cells requires continued expression of Foxp3. Nature Immunol. 2007;8:277–284. doi: 10.1038/ni1437. [DOI] [PubMed] [Google Scholar]
- 5.Ruthenburg AJ, Allis CD, Wysocka J. Methylation of lysine 4 on histone H3: intricacy of writing and reading a single epigenetic mark. Mol Cell. 2007;25:15–30. doi: 10.1016/j.molcel.2006.12.014. [DOI] [PubMed] [Google Scholar]
- 6.Birney E, et al. Identification and analysis of functional elements in 1% of the human genome by the ENCODE pilot project. Nature. 2007;447:799–816. doi: 10.1038/nature05874. [DOI] [PMC free article] [PubMed] [Google Scholar]
- 7.Heintzman ND, et al. Distinct and predictive chromatin signatures of transcriptional promoters and enhancers in the human genome. Nature Genet. 2007;39:311–318. doi: 10.1038/ng1966. [DOI] [PubMed] [Google Scholar]
- 8.Tone Y, et al. Smad3 and NFAT cooperate to induce Foxp3 expression through its enhancer. Nature Immunol. 2007;9:194–202. doi: 10.1038/ni1549. [DOI] [PubMed] [Google Scholar]
- 9.Kim HP, Leonard WJ. CREB/ATF-dependent T cell receptor-induce FoxP3 gene expression: a role for DNA methylation. J Exp Med. 2007;204:1543–1551. doi: 10.1084/jem.20070109. [DOI] [PMC free article] [PubMed] [Google Scholar]
- 10.Burchill MA, Yang J, Vogtenhuber C, Blazar BR, Farrar MA. IL-2 receptor β-dependent STAT5 activation is required for the development of Foxp3+ regulatory T cells. J Immunol. 2007;178:280–290. doi: 10.4049/jimmunol.178.1.280. [DOI] [PubMed] [Google Scholar]
- 11.Rao S, Gerondakis S, Woltring D, Shannon MF. c-Rel is required for chromatin remodeling across the IL-2 gene promoter. J Immunol. 2003;170:3724–3731. doi: 10.4049/jimmunol.170.7.3724. [DOI] [PubMed] [Google Scholar]
- 12.Liu Y, et al. A critical function for TGF-β signaling in the development of natural CD4+CD25+Foxp3+ regulatory T cells. Nature Immunol. 2008;9:632–640. doi: 10.1038/ni.1607. [DOI] [PubMed] [Google Scholar]
- 13.Polansky JK, et al. DNA methylation control Foxp3 gene expression. Eur J Immunol. 2008;38:1654–1663. doi: 10.1002/eji.200838105. [DOI] [PubMed] [Google Scholar]
- 14.Maurange C, Paro R. A cellular memory module conveys epigenetic inheritance of hedgehog expression during Drosophila wing imaginal disc development. Genes Dev. 2002;16:2672–2683. doi: 10.1101/gad.242702. [DOI] [PMC free article] [PubMed] [Google Scholar]
- 15.Yao Z, et al. Nonredundant roles for Stat5a/b in directly regulatin Foxp3. Blood. 2007;109:4368–4375. doi: 10.1182/blood-2006-11-055756. [DOI] [PMC free article] [PubMed] [Google Scholar]
- 16.Ono M, et al. Foxp3 controls regulatory T-cell function by interacting with AML1/Runx1. Nature. 2007;446:685–689. doi: 10.1038/nature05673. [DOI] [PubMed] [Google Scholar]
- 17.Rudra D, et al. Runx-CBFβ complexes control expression of the transcription factor Foxp3 in regulatory T cells. Nature Immunol. 2009;10:1170–1177. doi: 10.1038/ni.1795. [DOI] [PMC free article] [PubMed] [Google Scholar]
- 18.Kitoh A, et al. Indispensable role of the Runx1-Cbfβ transcription complex for in vivo-suppressive function of Foxp3+ regulatory T cells. Immunity. 2009;31:609–620. doi: 10.1016/j.immuni.2009.09.003. [DOI] [PubMed] [Google Scholar]
- 19.Bruno L, et al. Runx proteins regulate Foxp3 expression. J Exp Med. 2009;206:2329–2337. doi: 10.1084/jem.20090226. [DOI] [PMC free article] [PubMed] [Google Scholar]
- 20.Fontenot JD, et al. Regulatory T cell lineage specification by the forkhead transcription factor Foxp3. Immunity. 2005;22:329–341. doi: 10.1016/j.immuni.2005.01.016. [DOI] [PubMed] [Google Scholar]
- 21.Lee EC, et al. A highly efficient Escherichia coli-based chromosome engineering system adapted for recombinogenic targeting and subcloning of BAC DNA. Genomics. 2001;73:56–65. doi: 10.1006/geno.2000.6451. [DOI] [PubMed] [Google Scholar]
- 22.Dubchak I, Ryaboy DV. VISTA family of computational tools for comparative analysis of DNA sequences and whole genomes. Methods Mol Biol. 2006;338:69–89. doi: 10.1385/1-59745-097-9:69. [DOI] [PubMed] [Google Scholar]
- 23.Zheng Y, et al. Genome-wide analysis of Foxp3 target genes in developing and mature regulatory T cells. Nature. 2007;445:936–940. doi: 10.1038/nature05563. [DOI] [PubMed] [Google Scholar]
- 24.Sather BD, et al. Altering the distribution of Foxp3+ regulatory T cells results in tissue-specific inflammatory disease. J Exp Med. 2007;204:1335–1347. doi: 10.1084/jem.20070081. [DOI] [PMC free article] [PubMed] [Google Scholar]
Associated Data
This section collects any data citations, data availability statements, or supplementary materials included in this article.