Abstract
Poly(amidoamine) (PAMAM) dendrimer nanobiotechnology shows great promise in targeted drug delivery and gene therapy. Because of the involvement of cell membrane lipids with the pharmacological activity of dendrimer nanomedicines, the interactions between dendrimers and lipids are of particular relevance to the pharmaceutical applications of dendrimers. In this study, solid-state NMR was used to obtain a molecular image of the complex of generation 5 PAMAM dendrimer with the lipid bilayer. Using 1H radio frequency driven dipolar recoupling (RFDR) and 1H magic angle spinning (MAS) nuclear Overhauser effect spectroscopy (NOESY) techniques, we show that dendrimers are thermodynamically stable when inserted into zwitterionic lipid bilayers. 14N and 31P NMR experiments on static samples and measurements of the mobility of C–H bonds using a 2D proton detected local field protocol under MAS corroborate these results. The localization of dendrimers in the hydrophobic core of lipid bilayers restricts the motion of bilayer lipid tails, with the smaller G5 dendrimer having more of an effect than the larger G7 dendrimer. Fragmentation of the membrane does not occur at low dendrimer concentrations in zwitterionic membranes. Because these results show that the amphipathic dendrimer molecule can be stably incorporated in the interior of the bilayer (as opposed to electrostatic binding at the surface), they are expected to be useful in the design of dendrimer-based nanobiotechnologies.
Keywords: nanotherapeutics, poly(amidoamine) dendrimers, solid-state NMR, lipids
INTRODUCTION
Poly(amidoamine) (PAMAM) dendrimers are hyperbranched polymers that adopt a spherical architecture in aqueous environments with the potential to greatly extend the capabilities of modern therapeutics.1–3 The "branches" of dendrimers are composed of ethylenediamine repeat units and natively terminated with amine groups but may be chemically modified to alter the molecular properties of dendrimers in a well-defined manner.4–6 The sheer range of compounds that might be used to terminate dendrimers makes these polymers versatile for nanotherapeutic applications.4–6
Because of their potential as nanotherapeutics, interactions between PAMAM dendrimers and biomaterials relevant to these dendrimers' in vivo behavior are of great interest. Amine-terminated PAMAM dendrimers are known to interact with lipid membranes and are therefore not biologically inert.7–11 These PAMAM dendrimer-biomembrane interactions may aid in certain medicinal applications, drawing these polycationic compounds closer to bacterial and cancer cells whose outer membranes generally carry negative charge, but may interfere with other applications, such as the specific binding of dendrimers to their targeted receptors in targeted drug delivery applications.10,12–13 Therefore, understanding PAMAM dendrimers’ interactions with membranes will aid the development of more effective dendrimer-based therapeutic nanodevices.
Some features of the PAMAM dendrimer-biomembrane interaction have been characterized despite the difficulty inherent in structural studies on membrane and polymer systems.7–9,11,14–19 Earlier, we have shown that suspending a dendrimer solution over a lipid bilayer supported on a mica surface results in both the expansion of bilayer defects as well as the formation of new defects.11 31P NMR has previously shown that at high concentrations, PAMAM dendrimers fragment the lipid bilayer, producing a soluble lipid-containing component that tumbles isotropically in solution.11 The size of the new defects in supported lipid bilayers induced by dendrimers is reported to be within the range of what would be expected if dendrimer-filled lipid vesicles were abstracted from the supported lipid bilayer, suggesting that the formation of new defects might be the result of abstraction of dendrimer-filled lipid vesicles from the supported lipid bilayer.7 Thermodynamic arguments suggested abstraction occurs as the result of the formation of lipid-dendrimer aggregates composed of a central dendrimer core surrounded by a phospholipid bilayer.11,15,20 Recently, Kelly et al. investigated the mechanism whereby PAMAM dendrimers interact with fluid phase lipids. They concluded that when PAMAM dendrimers interact with negatively charged lipids, dendrimer-filled lipid vesicles form at higher concentration of dendrimers. However, they detected no heat release upon PAMAM dendrimers' addition to fluid phase zwitterionic lipids and were therefore unable to definitively characterize the mechanism whereby these dendrimers disrupt zwitterionic lipid membranes. Notably, it has been shown that PAMAM dendrimers interact with zwitterionic lipids by experimental techniques such as vesicle leakage,21–22 whole-cell leakage,14,23 differential scanning calorimetry (DSC),24–26 electron paramagnetic resonance (EPR),27–28 and Raman spectroscopy.25
Experimental atomic-resolution structural information on the dendrimer-zwitterionic lipid complex remains elusive, but molecular dynamics (MD) simulations have suggested that dendrimers with charged terminal groups flatten when interacting with biomembranes in order to maximize the number of favorable dendrimer-lipid interactions.9 Mesoscopic dynamics simulations further show that dendrimers do not flatten completely and may therefore force membranes to pucker to adapt to their natural curvature. This curvature strain may be relieved by the formation of toroidal pores, or pores that have a worm hole-like structure.29–30 It has been shown that toroidal pores will form in lipid bilayers in response to the curvature strain induced by antimicrobial peptides such as magainin2 and pexiganan (MSI-78).29–30 The induction of curvature strain in lipid bilayers is an important phenomenon in the pathology of various amyloid peptides.31,32 Coarse grained molecular dynamics simulations have also suggested that it may be possible for dendrimers to insert into lipid bilayers without forming pores.17–18
In this study, we use solid-state NMR spectroscopy to gain atomic-level insights into the structure of the zwitterionic lipid bilayer-dendrimer complex. This approach reveals details of this non-soluble, non-crystalline supramolecular structure at an unprecedented atomistic resolution. Furthermore, the impact of dendrimer size on the dendrimer-lipid bilayer interaction is also studied. Multilamellar vesicles (MLVs), which mimic the natural curvature of cell and organelle membranes, are used as a model membrane to examine the membrane interactions of generation-5 and generation-7 dendrimers (see the molecular structures of dendrimers given in figure 1). 31P and 14N NMR experiments are used under static conditions and R-PDLF, NOESY, RFDR, and 1H NMR are used under MAS to elucidate the structural and dynamical properties of a model lipid biomembrane in the presence of dendrimers. Our results indicate that dendrimers localize in the interior of lipid bilayers in our samples enabling the intercalation of lipid acyl chains into the dendrimer interior is in agreement with previous EPR studies that have shown that PAMAM dendrimers are likely to insert in zwitterionic lipid bilayers.28 We expect that these results will aid in the development of new and powerful nanomedicinal treatments for a wide variety of diseases, specifically advanced dendrimer-based nanocarriers that encapsulate hydrophobic drugs and deliver them to the interior of biomembranes.
Figure 1.
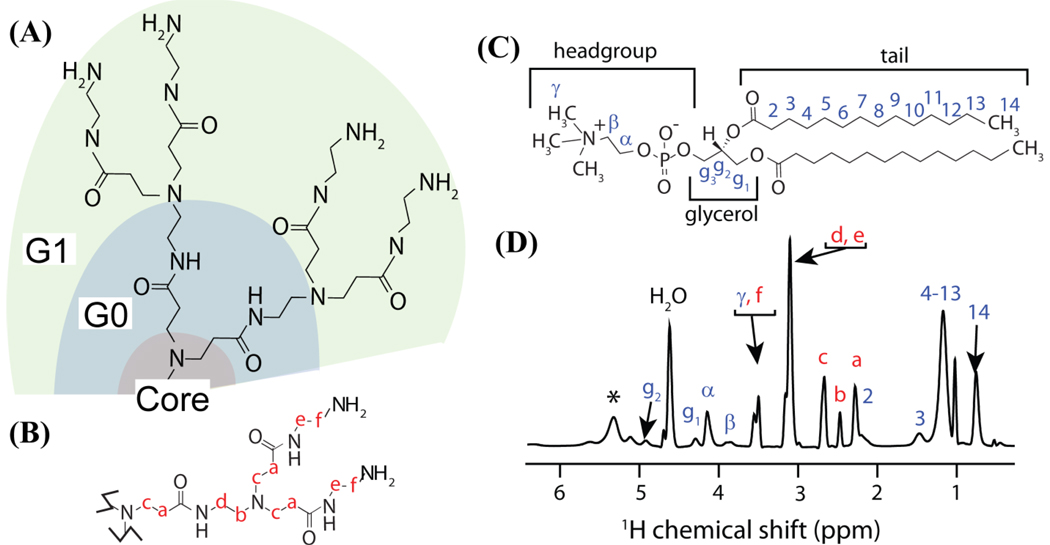
(A) One-half of a G1 PAMAM dendrimer. The generation number may be visually assessed by counting the number of forks per branch of the dendrimer, excluding the fork of the core ethylenediamine molecule. The core, zeroth, and first generation parts of the dendrimer are labeled. (B) A branch of the dendrimer with its carbon atoms labeled in red. (C) A DMPC molecule. (D) A 1H MAS NMR spectrum of DMPC mixed with 0.1 mol % G5 PAMAM dendrimer (sample B2; see methods and materials); spinning sideband is indicated with an asterisk. The mixture was 50 % hydrated by weight. Proton resonances originating from the dendrimer and lipid are labeled in red and blue respectively; resonances were assigned based on previous NMR studies.38,62
METHODS AND MATERIALS
All lipids were purchased from Avanti Polar Lipids (Alabaster, AL). Chloroform and methanol were procured from Aldrich Chemical Inc. (Milwaukee, WI). All the chemicals, unless noted otherwise, were used without further purification.
Preparation of PAMAM dendrimers
Generation 5 and 7 PAMAM dendrimers were purchased from Dendritech Inc. To remove lower molecular weight impurities and trailing generations, the dendrimers were dialyzed with a 10,000 MWCO membrane (generation 5) or 50,000 MWCO membrane (generation 7) against deionized water for two days with four water exchanges. The purified dendrimer was lyophilized for three days, resulting in a white solid. The number average molecular weight and polydispersity index were determined by gel permeation chromatography (28,460 g/mol and 1.011 ± 0.010 respectively for generation 5 and 105,600 g/mol and 1.053 ± 0.012 for generation 7). The mean number of terminal primary amines per dendrimer (112 for generation 5 and 486 for generation 7) were determined from the number average molecular weight by potentiometric titration as described by Majoros et al.33 An illustration of the branched structure of the dendrimer along with the labeling convention used in this study is provided in Figure 1.
Preparation of samples for R-PDLF and 14N solid-state NMR experiments
For the R-PDLF and 14N experiments, partially hydrated lipid and PAMAM dendrimer samples were prepared (approximately 10 water molecules per lipid). Relatively drier samples were used as the dipolar couplings are larger in such samples and therefore the differences between the dipolar couplings are larger which improves the resolution of our 2D SLF experiments in the indirect dimension. Therefore DMPC and dendrimer samples prepared at low hydration levels by first dissolving 70 mg of DMPC powder in methanol with 3 wt % PAMAM dendrimer (either G7-amine, also referred to as sample A3, or G5-amine, also referred to as sample A2) in a culture tube. The sample was then dried under a stream of N2 and placed under vacuum overnight. The sample was then placed under 95% humidity at 37 °C and hydrated until approximately 10 water molecules per lipid molecule were present as established by comparing the lipid γ carbon’s protons' peak area with that of the water protons’ in a 1H MAS NMR experiment (see figure S1 in the Supporting Information). A litmus test indicated that our sample was at approximately neutral pH, indicating that the terminal amines are protonated but the interior tertiary amine groups are not.43 A control sample of DMPC without dendrimer was also prepared (also referred to as sample A1). The contents were then transferred to a 4 mm diameter NMR rotor.
R-PDLF and 14N NMR experiments
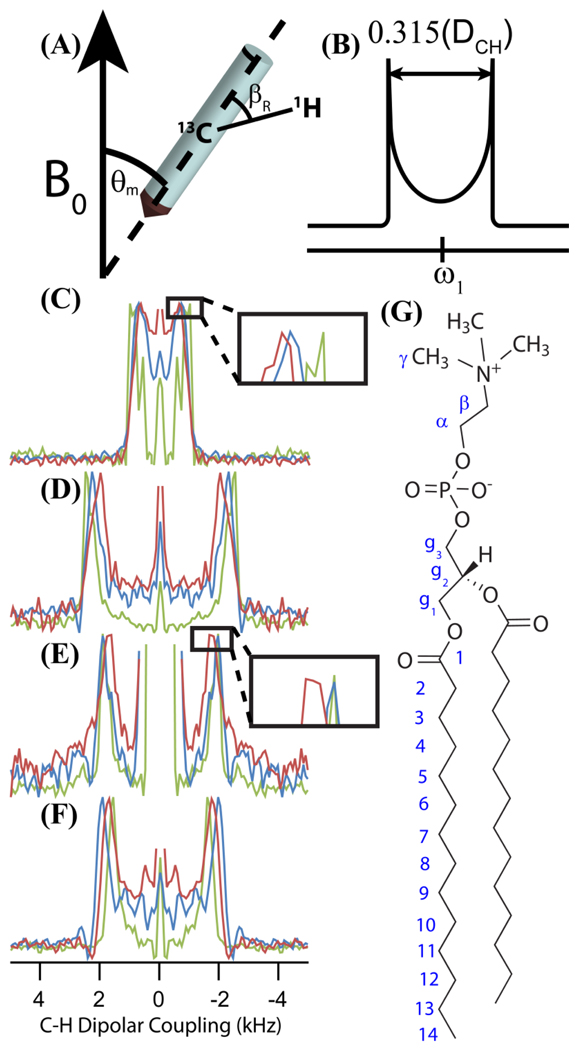
The dynamics of the lipid molecules and G5 and G7 dendrimers were probed using a combination of a 2D MAS technique, R-PDLF, which correlates 13C chemical shifts to their associated 13C-1H dipolar couplings, and static 14N NMR spectroscopy. In the R-PDLF experiment, the intrinsic lipid 13C-1H dipolar couplings are motionally averaged by the flexibility of the acyl chains within the bilayer. The observed dipolar couplings therefore reflect the local order S|CH| associated with different regions of the phospholipid molecules. The local order parameter is defined as the observed dipolar coupling divided by the scaling factor for the rotor-synchronized C–H recoupling sequence, 0.315, and the rigid lattice directly binded C–H dipolar coupling, 21.5 kHz (for a bond length of ~1.1 Ǻ).
R-PDLF spectroscopy incorporates R-type recoupling34 into the proton detected local field (PDLF) protocol.35 Since the refocused-INEPT pulse sequence renders high spin pair selectivity,36 it was used for the 1H to 13C polarization transfer. The 1H field strengths during dipolar recoupling and heteronuclear decoupling were typically 45 and 28 kHz, respectively. The 2D spectra were acquired using typically 128 scans and 200 increments in the t1-dimension. A 5 s recycling delay was employed with MAS at 5.15 kHz stabilized to ± 2 Hz accuracy. Further details of the R-PDLF method can be found elsewhere.37,38
The R-PDLF and 14N NMR experiments were performed on a Varian Infinity 400 MHz solid-state NMR spectrometer. Each sample was equilibrated at 37 °C for at least 30 minutes before starting the experiment. The 14N spectra were obtained with a recycle delay of 3 s and 50 kHz of spectral width. The recoupled C–H dipolar coupling is sensitive to the molecular conformation of the lipid phosphatidyl choline (PC) headgroup as follows:
| Eq. 1 |
where η is the angle between the C–H bond and the motional axis (the long axis of the lipid molecule) and Sf is an order parameter representing wobbling motions about the membrane long axis.39
To study the PC headgroup tilt, the angle (θP—N) that the P–N vector originating at the phosphorus nucleus and pointing to the nitrogen nucleus of DMPC makes with the membrane normal is assessed. According to previous studies, θP—N can be approximated from η according to the equation:
| Eq. 2 |
Based on the hydration level of our pure lipid (DMPC) sample (nw~10, see figure S1) and the results of Ulrich et al.,40 we estimate θP—N to be ~62° for our pure DMPC sample.40–42 We calculated Sf to be ~ 0.44 after solving for η using Eq. 1 and substituting our experimental results for SCH into Eq. 1. Using this information, we were able to calculate θP—N and estimate how the addition of dendrimers to lipid bilayers changes the tilt of DMPC headgroup, which is associated with changes in the lipid bilayer electrostatics. The tilt angles were calculated using the average of the experimentally determined Cα-H and Cβ-H dipolar couplings.
Preparation of fully-hydrated DMPC multilamellar vesicles samples for 2D NOESY and RFDR experiments
For the 1H MAS NOESY and 1H RFDR experiments, 35 mg of DMPC powder was dissolved in methanol with 1.7 mg of G5 PAMAM diagnostic grade dendrimer in methanol solution purchased from Sigma-Aldrich in a culture tube (also referred to as sample B2). The sample was dried under a stream of N2 and then placed under vacuum overnight. 30 µL 10 mM of sodium phosphate buffer at pH 7.3 was added to the mixture and 5 µL D2O was added for sample referencing. The pH of the sample prepared for NOESY and RFDR experiments was 8–9.5 (tested using litmus paper). By inspection of the titration curves provided in figure 2 of reference 43, upper (89%) and lower (25)% bound estimates of the fraction of protonated terminal groups could be obtained. At physiological pH (7.4) all of the terminal amine groups are expected to be protonated. None of the tertiary amine groups were protonated at either pH level (7.4 or 8–9.5).43 The mixture was freeze-thawed three times before being transferred to a 3.2 mm (~50 µL volume) NMR rotor for NMR experiments using a Nanoprobe™. A control sample of fully hydrated pure DMPC lipid MLVs without dendrimer was also prepared (also referred to as sample B1).
Figure 2.
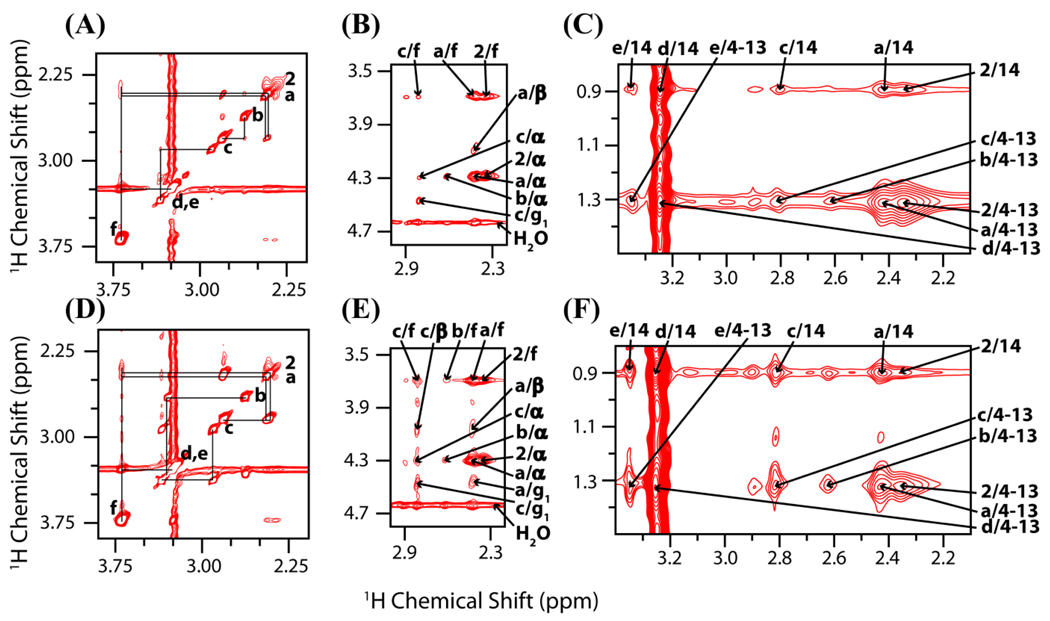
The 2D 1H-1H MAS NOESY and RFDR spectra of the dendrimer and lipid mixture (acquired on samples B1 and B2; see methods and materials). Different regions of the NOESY spectrum acquired with a 150 ms mixing time showing (A) dendrimer intramolecular crosspeaks, (B) dendrimer-lipid headgroup crosspeaks, and (C) dendrimer-lipid tail crosspeaks. Bottom: Different regions of the 1H RFDR spectrum acquired with a 30 ms mixing time showing (D) dendrimer intramolecular crosspeaks, (E) dendrimer-lipid headgroup crosspeaks, and (F) dendrimer-lipid tail crosspeaks. The crosspeaks are numbered according to the scheme described in Figure 1.
NOESY and RFDR experiments on the fully-hydrated DMPC multilamellar vesicles sample
The 1H RFDR and 1H MAS NOESY experiments were performed on a Varian UNITY INOVA 600 MHz spectrometer. A 3.2 mm Nanoprobe™ was used for these experiments. Each sample was equilibrated at 37 °C for at least 30 minutes before starting the experiment. MAS at 2.5 kHz stabilized to ± 1 Hz was employed for the 1H MAS NOESY and 1H RFDR experiments; other experimental details of these techniques can be found elsewhere.44 An 8 kHz pulse on the water 1H resonance was applied for 1.5 s before the preparation pulse to suppress the strong water-proton signal, 128 t1 increments were acquired, with a spectral width of 6 kHz in the indirect dimension. Typical RF power used was 25 kHz. 1H MAS NOESY and 1H RFDR spectra of similarly prepared (same hydration level, buffer, pH) pure dendrimer and pure lipid samples were also obtained using similar experimental conditions.
31P NMR spectra of the G5 dendrimer and DMPC lipid and the pure DMPC lipid samples were obtained under 10 kHz MAS using a spin-echo sequence (90°-τ-180°-τ-acq with τ=100 µs), with a 40 kHz proton decoupling RF field, 50 kHz spectral width, 3.1 µs 90°-pulse length, and a recycle delay of ~4 seconds. A typical spectrum required the co-addition of 100–1000 transients. Chemical shifts were referenced by setting the isotropic chemical shift peak of phosphoric acid to 0 ppm. In the resulting pure lipid sample and G5 dendrimer sample spectra, the buffer 31P NMR peak overlapped with the 31P NMR peaks originating from DMPC lipids. Static 31P NMR spectra were obtained in a water mixture (as opposed to using buffer). We expect the conditions for this sample to be comparable to the conditions under which atomic force microscopy (AFM) experimental results were obtained earlier.11 Static spectra were acquired for G7 dendrimer and lipid, G5 dendrimer and lipid, and pure DMPC lipid samples. Experimental data were processed using either the Spinsight (Chemagnetics/Varian) software on a Sun Sparc workstation using NMR Pipe.
RESULTS
2D 1H-1H NOESY and RFDR under MAS show that generation 5 PAMAM dendrimers are thermodynamically stable when inserted into lipid bilayers
To determine the location of the dendrimer on the bilayer, we probed the contacts between the dendrimer and the bilayer at Å-level resolution by 1H-1H chemical shift correlation NMR experiments on G5 dendrimers. In these experiments, the crosspeak intensity, which is a function of the amounts of magnetization transferred between pairs of 1H nuclei, is monitored. Under certain conditions, this information can then be translated into estimates of the distances between pairs of 1H nuclei. However, this interpretation can be complicated by the dependence of the magnetization transfer on the motions of the 1H nuclear pairs. To overcome this complication, two complementary experiments (2D 1H-1H NOESY and RFDR under MAS) with different magnetization transfer steps and different time dependencies were used. In an RFDR experiment, magnetization is transferred via 1H-1H dipolar coupling, which is reduced by motions occurring on a timescale faster than a few milliseconds. On the other hand, the magnetization transfer in a NOESY experiment is mediated by NOE cross-relaxation which in this system is predominantly caused by lipid lateral diffusive motions occurring on a timescale of ~170 ns in an unperturbed lipid bilayer.45–46 A concurrence between NOESY and RFDR results is therefore a strong indication that distance, and not the molecular motion of either the dendrimer or the bilayer, is responsible for the observed effect.
Generally, the crosspeaks between the lipid tails and the dendrimer interior are more intense than those of between the lipid headgroup and the dendrimer interior in both the NOESY and RFDR spectra as shown in figure 2. For example, in both the NOESY and RFDR spectra, the c/14 crosspeaks are more intense than the c/α crosspeaks. This is an indication that the dendrimer interior is closer to the interior of the bilayer than the surface of the bilayer. This conclusion is strengthened by the agreement of RFDR and NOESY results, because it appears that regardless of the dependence of magnetization transfer on the motions of the 1H-1H spin pair, the intensity of crosspeaks between 1H nuclei in the dendrimer interior and the lipid tail is higher than that of between 1H nuclei in the dendrimer's interior and the lipid's headgroups. Since the same result was obtained with both methods, it is likely that the G5 dendrimer is located in the hydrophobic interior of the zwitterionic DMPC lipid bilayer as opposed to lying on the surface under these experimental conditions. Note that insertion here refers to the proximity of the dendrimer to the hydrophobic core of the bilayer, actual intercalation of the lipid tails into the interior of the dendrimer cannot be determined from these results.
Dendrimers are immobilized in a membrane environment
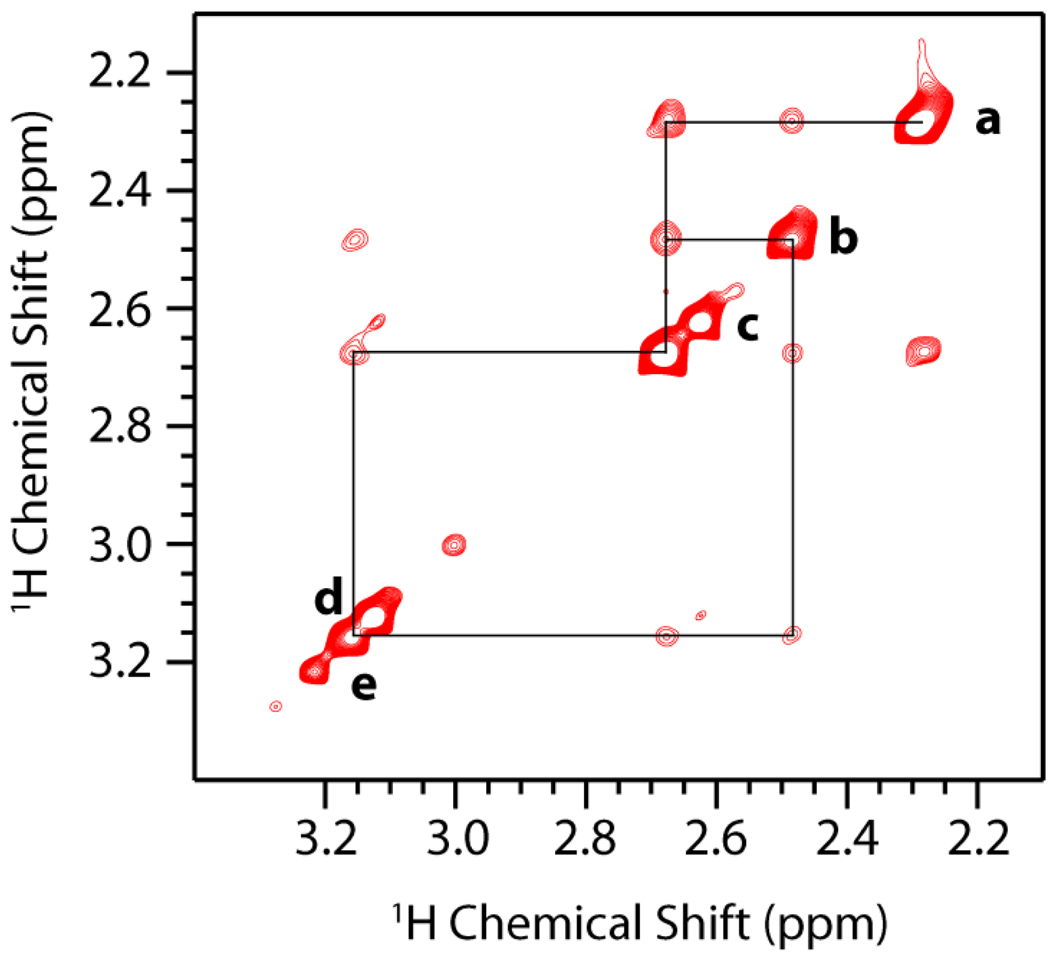
Although the lipid-dendrimer crosspeak intensities give information on the location of the dendrimer within the bilayer, the dendrimer-dendrimer cross-peaks by contrast give information on the dynamics and conformation of the dendrimer. In the pure G5 dendrimer sample, the 1H-1H dipolar couplings were motionally averaged to the point of making a 2D 1H-1H RFDR experiment impossible, suggesting that dendrimers are less mobile in a membrane environment than in an aqueous environment. A comparison of the 2D1H-1H MAS NOESY spectrum shows that the intramolecular crosspeaks are more numerous and intense while the diagonal peaks are less intense in a G5 dendrimer sample without lipid when compared to a similar sample with DMPC (see figure 3). This corroborates the RFDR results, suggesting that the internal motion of the dendrimer is restricted when bound to the lipid and/or the dendrimer is more compact when bound to the lipid.
Figure 3.
The 2D 1H-1H MAS NOESY spectrum of 10 mg dendrimer dissolved in 45 µL 10 mM sodium phosphate buffer prepared at a pH of 7.3 (dendrimer in an aqueous environment). The spectrum was obtained in the manner described for the dendrimer-lipid samples but with a mixing time of 100 ms. A comparison of the relative intensities of the diagonal peaks and crosspeaks in this spectrum with the spectra shown in figure 2(A), 2(B), and 2(C) suggests that there are more motions contributing to NOE relaxation when the dendrimer is in aqueous environment than when the dendrimer is in a lipid environment. Note that NOESY crosspeaks are more intense in this spectrum in spite of the shorter mixing time being used (100 ms as opposed to 150 ms).
Dendrimers rigidify the lipid tails, increasing order in the interior of zwitterionic lipid bilayers (these experiments were performed on samples A1–A3)
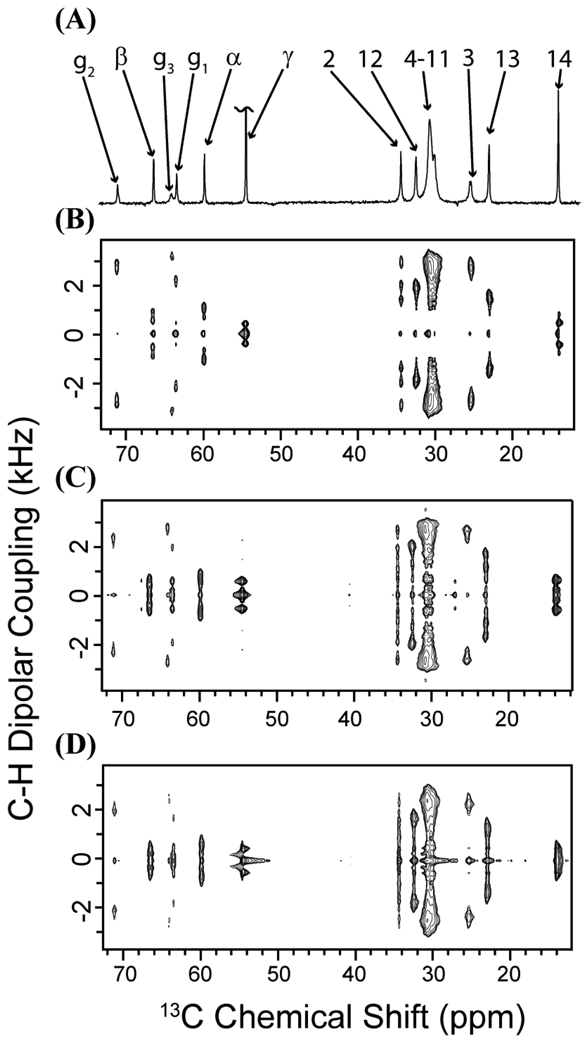
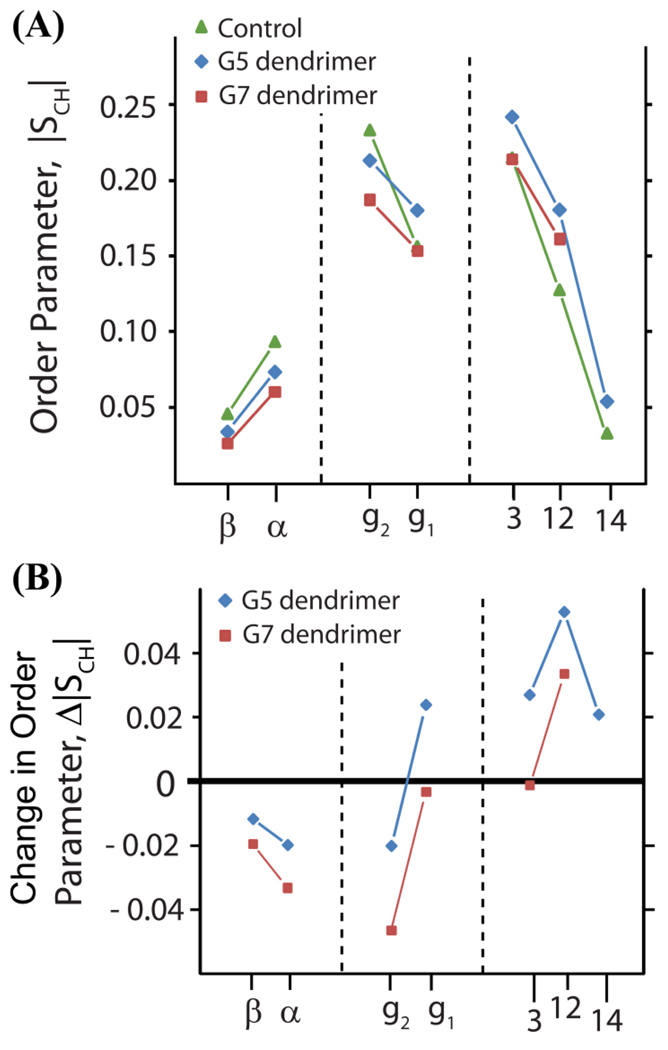
The dynamics of the C–H bonds in DMPC were probed with a 2D MAS technique, R-PDLF, which correlates 13C chemical shifts to their associated 13C-1H dipolar couplings (see figures 4 and 5). Segmental order parameters (S|ch|) were extracted from the motionally averaged dipolar couplings as described in the Materials and Methods section (see figure 6). While the resolution within the central part of the hydrophobic core of the membrane (carbons 4–11) was poor and the corresponding dipolar couplings could not be accurately measured, the splittings at carbons 3, 12 and 14 were well-resolved and therefore unambiguous assignment was possible for these carbons. At all of these sites the S|CH| values were increased when either G7 or G5 dendrimers are added to the DMPC mixture, indicating dendrimer binding decreases the flexibility of the acyl chains of the membrane. Furthermore, the effect was dependent on the size of the dendrimer with the S|CH| values of the G7 dendrimer sample being lower than those of the G5 dendrimer sample. While both the G7 and G5 dendrimer decrease the flexibility, the S|CH| values associated with the G5 dendrimer sample were higher than those of the G7 sample indicating the G5 dendrimer has a greater impact on the dynamics of the interior of the bilayer.
Figure 4.
The R-PDLF spectra if DMPC MLVs containing dendrimers (acquired on samples A1-A3; see methods and materials). The recoupling sequence during the t1 period was used for recoupling the C–H dipolar coupling under MAS.34, 37 The scaling factor of this recoupling sequence is 0.315. (A) A 1D 13C NMR spectrum of pure DMPC lipid bilayers. (B) 2D R-PDLF spectra of pure DMPC bilayers, (C) DMPC bilayers with 0.073 mole % (3 wt. %) G5 dendrimers, and (D) DMPC bilayers with 0.018 mole % (3 wt. %) G7 dendrimers.
Figure 5.
Selected C–H dipolar coupling slices of R-PDLF spectra show that dendrimers rigidify lipid tails but do not significantly change lipid bilayer electrostatics (acquired on samples A1-A3; see methods and materials). (A) A rotor under MAS and the relationship between the rotor-frame and the laboratory-frame. Since the extent to which the transverse magnetization of protons evolve under the recoupled C–H dipolar coupling depends on the angle between the C–H bond vector and the long axis of the rotor (indicated as βR here), a lineshape pattern with two “horns,” or singularities, results in the dipolar coupling dimension. (B) A theoretical C–H dipolar coupling powder pattern produced in the indirect dimension of an R-PDLF spectrum, illustrating how the C–H dipolar coupling is measured. It is the distance between the two “horns” (mathematical singularities) multiplied by 1/0.315.37 Also shown are the dipolar coupling slices for the control sample (in green), the G5 dendrimer associated sample (in blue) and the G7 associated sample (in red) for the (C) α carbon, (D) g2 carbon, (E) g1 carbon, and (F) 12 carbon. (G) The molecular structure of a DMPC molecule with its carbon atoms labeled for reference.
Figure 6.
Order parameters show that dendrimers rigidify lipid tails but do not significantly change lipid bilayer electrostatics (derived from R-PDLF spectra acquired on samples A1-A3; see methods and materials). (A) Order parameters determined from the experimentally measured 1H-13C dipolar couplings. The control, pure lipid sample order parameters are indicated in green, the G5 dendrimer associated order parameters are indicated in blue and the G7 dendrimer associated order parameters are indicated in red. (B) The changes in the order parameters recorded of the dendrimer associated samples relative to the pure lipid control sample.
R-PDLF shows the dipolar couplings associated with α, β, and g2 carbons in the headgroup region of the DMPC molecule increased for both the G7 and G5 dendrimers samples. The dipolar coupling is decreased for the g1 carbon in the G7 dendrimer sample but increased in the G5 sample. The correspondence between the measured dipolar coupling and the dynamics in this region is not as direct as it is for the acyl chain carbons, as the headgroup may tilt in response to ligand binding and alter the axis of motional averaging. The change in dipolar coupling could therefore be either due to a restriction of motions of the lipid tails and a slight increase in headgroup motions relative to the lipid tail for which the g1 carbon acts as a hinge.
14N and 31P NMR show that the surface of the lipid bilayer is relatively unaffected by PAMAM dendrimer
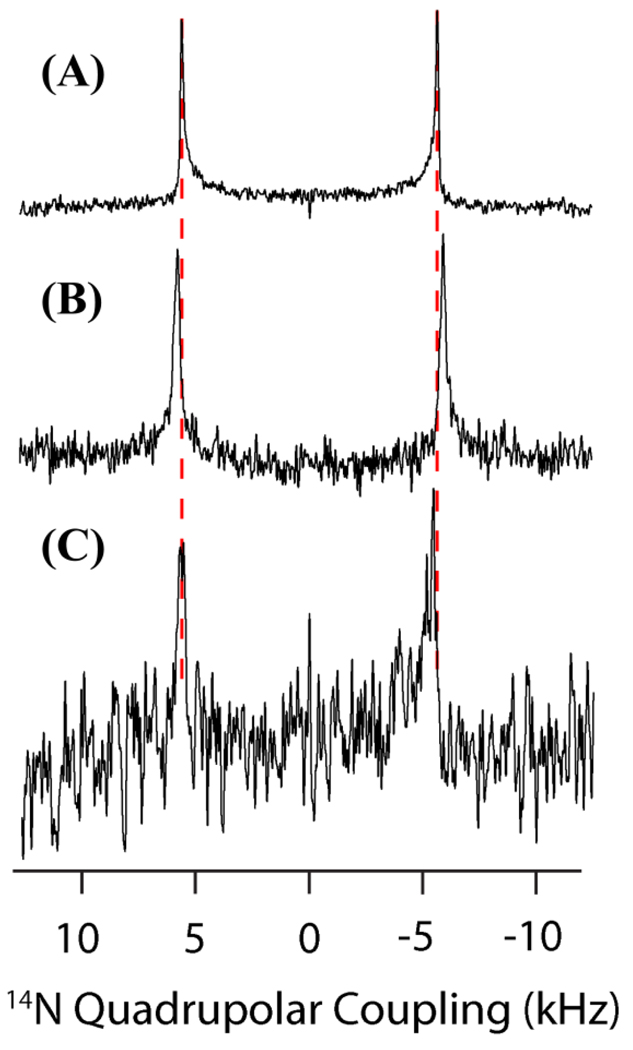
The 14N spectra are nearly unaffected by the presence of either G5 or G7 dendrimers, with a slight increase in the 14N quadrupolar splitting evident in the G5 dendrimer sample and a negligible effect evident in the G7 sample (see figures 7). This is an indication that the electric field in the proximity of the choline group is unaltered by the presence of either dendrimer. While such a finding is not unexpected on purely electrostatic considerations for the positively charged dendrimer, it is also an indication that the tilt of the lipid headgroup relative to the surface of the membrane is not affected strongly by either dendrimer since the electric field is a function of the distance from the membrane surface. This observation argues against a strong interaction of either dendrimer with the phosphate group, as an electrostatic interaction of the dendrimer with the phosphate group would induce a torque on the P−—N+ dipole causing the headgroup to tilt away from the membrane surface relative to the control (“the molecular voltmeter effect”). The R-PDLF results corroborate the results from 14N NMR. The changes in the 13C-1H dipolar couplings of the lipid headgroups correspond to an estimated change in the tilt of the lipid headgroup tilt by ~1.7° for the G5 sample and ~2.9° for the G7 sample (see the methods and materials section for further details). These changes in lipid headgroup conformation do not correspond to a significant change in bilayer electrostatic properties. A significant increase in the bilayer surface charge is expected to change the lipid headgroup tilt by >10°, as observed when mixing cationic didodecyldimethylammonium bromide (DDAB) with DMPC lipid bilayers.39
Figure 7.
14N spectra acquired on samples A1-A3 (see methods and materials). (A) The DMPC 14N NMR spectrum (the quadrupolar splitting, or vQ, is 11.2 kHz) with dashed lines for comparison with, (B) the 14N NMR spectrum of the G5 dendrimer and DMPC mixture (vQ is 11.6 kHz) and, (C) the 14N NMR spectrum of the G7 dendrimer and DMPC mixture (vQ is 11.1 kHz).
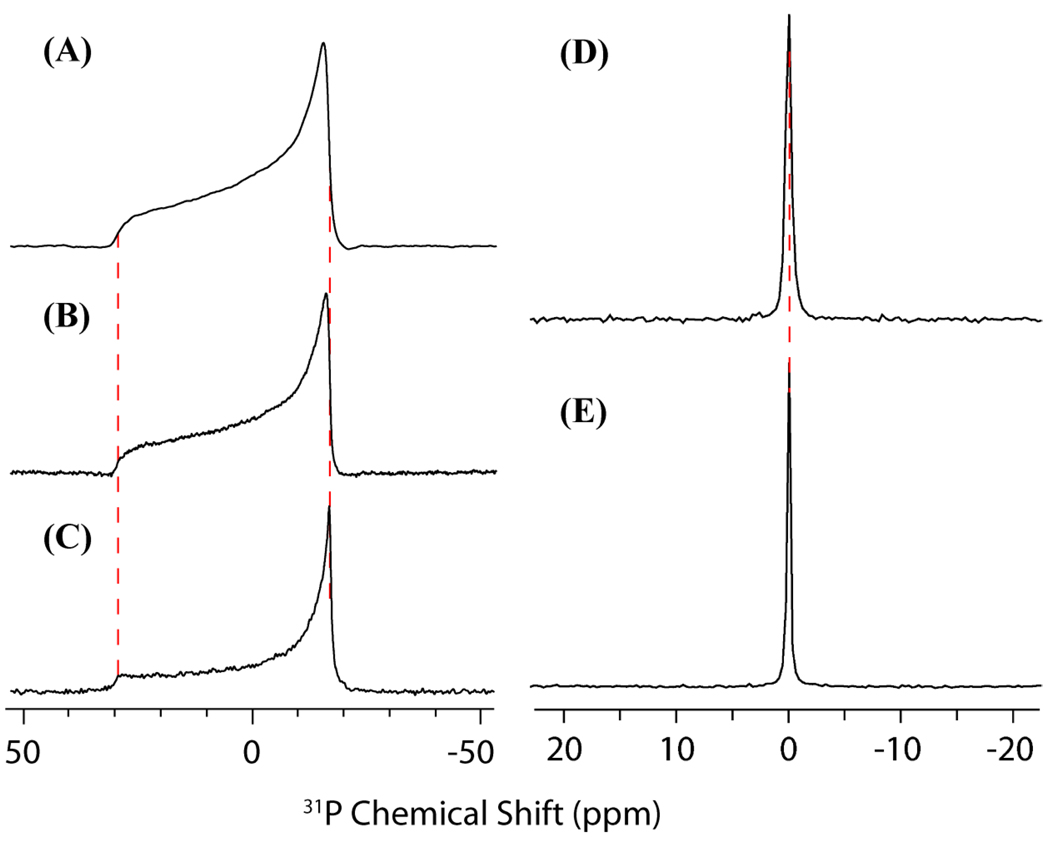
Further confirmation of an absence of strong electrostatic effects of the dendrimer on the phosphate group can be seen in the 31P NMR spectra (see figure 8). Only minimal changes (<0.1 ppm) in the isotropic chemical shift obtained under MAS are apparent for the G5 sample when compared to the pure lipid DMPC sample, indicating G5 dendrimers have minimal influence on the electrostatic environment of the 31P nucleus. The influence of dendrimers on the phosphodiester moiety was studied in further detail through the use of static 31P experiments. Figure 8(A) shows the control DMPC lipid 31P NMR spectrum, which features a CSA powder pattern lineshape typical for unoriented lipid samples. The binding of both the G5 and G7 dendrimers has only a minor impact on the 31P lineshape: G5 dendrimer binding having virtually no effect and only a slight decrease in the CSA span being evident in the G7 sample. The observed CSA is a function of both the 31P CSA tensor and an order parameter reflecting the motional averaging undergone by the phosphodiester moiety in the lipid headgroup. Since the isotropic chemical shift is unaltered by the presence of either dendrimer, it is reasonable to assign changes in the CSA lineshape to either alterations in the dynamics or conformational rearrangements of the phosphate headgroup that modify the motional averaging of the CSA. We can therefore conclude that neither G5 dendrimer nor G7 dendrimer significantly impact the conformation of the lipid headgroup.
Figure 8.
31P NMR spectra acquired on samples of DMPC lipid and deionized water mixtures (A–C) and DMPC lipid and samples B1-B2 (D–E). The samples used in (A–C) were prepared in the same manner as samples B1 and B2, however, deionized water was substituted for 0.1 M phosphate buffer. (A) The 31P NMR spectrum acquired under static conditions of (A) pure DMPC MLVs (CSA span 46.2 ppm) (B) DMPC and G5 dendrimer (CSA span 46.8 ppm) (C) DMPC and G7 dendrimer (CSA span is 47.6 ppm). The 31P NMR spectrum acquired under 10 kHz magic angle spinning (MAS) of (D) a DMPC and G5 PAMAM dendrimer and (E) a DMPC lipid sample. Note that the 31P peak of the phosphate buffer overlaps with the DMPC 31P peak, indicating that detectable no shift in the isotropic 31P NMR frequency occurred due to the addition of dendrimers and that therefore, no change in the surface charge of the bilayer occurred. The samples used in (D) and (E) are hydrated to 50 wt. % by 0.1 M sodium phosphate buffer and the samples used in (A), (B), and (C) are hydrated to 50 wt. % by distilled, deionized water.
DISCUSSION
Several lines of evidence suggest that in zwitterionic lipid bilayers prepared for our samples both G5 and G7 dendrimers are localized deep within the interior of the bilayer and are not merely associated with the surface of the membrane. Note that in both the 1H RFDR and the 1H MAS NOESY spectra of G5 dendrimer–DMPC samples (shown in figure 2) the crosspeaks between the lipid acyl chains and the dendrimer are stronger than the corresponding crosspeaks between the dendrimer and the lipid headgroup. In particular, the crosspeak between the last carbon of the acyl chain of DMPC and “c” carbon of the dendrimer (marked as c/14 in figures 2(C) and 2(F)) is more intense than corresponding crosspeaks between the dendrimer and the atoms in the lipid-headgroups (marked as c/α and c/g1) in both the RFDR and NOESY spectra, indicating a close proximity of the hydrophobic core of the dendrimer with the center of the bilayer. While this result could be explained by differences in the dynamics of the headgroup and tail regions of the lipids if it was only observed in the 1H RFDR or only in the 1H MAS NOESY spectra as the dependence of the cross peak intensity in NEOSY and RFDR experiments on motion are different. Therefore, the similarity of the results with both techniques strongly suggests that G5 dendrimers interact strongly with the acyl chains of the membrane.
Further evidence for localization of G5 and G7 dendrimers inside the hydrophobic core of the lipid bilayer comes from 14N spectroscopy (figure 7), which suggests that neither dendrimer has a significant effect on the electric field surrounding the choline group in the lipid headgroup, since the 14N v Q reported for all the samples studied (a pure DMPC lipid mixture, a lipid and G5 PAMAM dendrimer mixture, and a lipid and G7 PAMAM dendrimer mixture) were similar. Since the 14N nucleus is typically affected by ligand interactions with the phosphate group47–48 this result also suggests neither dendrimer interacts strongly with the phosphate group as well. The absence of a strong electrostatic interaction of the dendrimer with the phosphate group is further corroborated by 31P NMR as little perturbation of either the isotropic chemical shift under MAS (figure 8) or the static line shape can be detected. Since the MLV samples were hydrated for ~ 2 days before starting experimental measurements, equilibrated at 37°C for at least 30 minutes prior to each NMR measurement, and NMR experiments typically lasted for a few hours (31P or 14N NMR) to a day (2D R-PDLF), the dendrimers are not likely to be trapped in a metastable state.
Taken together, these results indicate that both the G5 and G7 dendrimers can occupy a thermodynamically stable position in the interior of zwitterionic lipid bilayer stabilized mainly by hydrophobic interactions. Interactions with the charged headgroups play a less role in membrane binding.
Relevance of our results to the in vivo behavior of dendrimers
It is important to note that the samples in this study were prepared by coincubating the dendrimers and lipid in organic solvent before the formation of the bilayer, rather than adding the dendrimers in aqueous solution after the bilayers have formed. Therefore, our experimental observations do not rule out the possibility of a kinetic barrier to dendrimer’s insertion from water phase to the hydrophobic core of bilayers. Nevertheless, both experimental and computational studies have suggested that while dendrimers may initially bind to the surface of the bilayer they eventually deeply insert into the bilayer at equilibrium. Notably, EPR studies on samples where dendrimers were not coincubated with dendrimers show a restriction of lipid tail motions that is suggestive of insertion of dendrimer particles into zwitterionic vesicle lipid bilayers..27 Successive scans in DSC studies on G3 dendrimers show changes in the gel to liquid crystalline phase transition that was linked to the progressive insertion of the dendrimer into the bilayer.26 Similarly, mesoscopic dynamics simulations of dendrimer and lipid systems argue for the eventual insertion of the dendrimer into the bilayer, showing an interaction of the dendrimer with both leaflets of the bilayer.17,49
Impact of dendrimer insertion on membrane dynamics
Both the G5 and G7 dendrimers decreased the flexibility of the acyl chains of DMPC throughout the length of the acyl chain (fig. 6) in agreement with previous EPR studies.28,50 The insertion of a guest molecule can either create order or disorder in the membrane depending on the depth of insertion and flexibility of the guest molecule. If the guest molecule penetrates only partially into the lipid bilayer, a void space is created beneath the point of insertion. The molecular motions of the acyl chains in this void region are increased because of the loss of the steric interactions with the surrounding phospholipids that suppress the natural rotation about the carbon-carbon bonds that occurs in lipid molecules.52 This effect is largely responsible for the increase in membrane disorder in the acyl chain seen with amphipathic molecules, such as most antimicrobial peptides, that penetrate only to the polar glycerol region of the phospholipids.52–53 It is also responsible for the membrane thinning effect commonly seen with these molecules as the bilayer compensates for the creation of the unfavorable void volume by reducing its thickness.54 On the other hand, the areas of the lipid molecule directly contacting the guest molecule are expected to be more ordered than a pure bilayer sample as the guest molecule generally interferes with the motion of the acyl chains. In our sample, we expect the majority of dendrimers to be fully inserted into the lipid bilayers, so that the rigidifying effect of the dendrimer guest molecule would dominate. Furthermore, it is probable that lipid tails intercalate into the dendrimer molecule, increasing the number of lipid molecules in direct contact with the dendrimer. The effect was dependent on the size of the dendrimer with the S|CH| values of the G5 dendrimer sample consistently higher than those of the G7 dendrimer sample, indicating the G5 dendrimer has a greater impact on the dynamics of the interior of the bilayer, most likely because the congested surface of the G7 dendrimer restricts the intercalation of the acyl chains (De Gennes close packing).55 It should be noted that the local increase in lipid order that occurs in the vicinity of the dendrimer may be compensated for by a global decrease in membrane thickness in the surrounding areas of the bilayer caused by the mismatch between the thickness of the flattened dendrimer and the lipid bilayer, as frequently observed in AFM studies.8
From the headgroup order parameters, we conclude that the orientation of the P−—N+ dipole moves only slightly closer to the bilayer plane, indicating that the surface charge of the lipid bilayer was not significantly affected by the presence of dendrimer, in agreement with the 31P and 14N results. In an atomistic molecular dynamics study of dendrimers, Kelly et al. compared G3 dendrimers terminated with acetamide functional groups (G3-Ac), G3 dendrimers terminated with carboxylate functional groups (G3-COO−), and unfunctionalized G3 dendrimers terminated with amine moieties (G3-NH3 +).9 They found that G3-NH3 + dendrimers were able to penetrate the most deeply into the bilayer and interact with both the glycerol atoms as well as the phosphodiester moiety in the headgroup of the lipid. Since the amine groups of the dendrimer are likely hydrogen bonded to the glycerol oxygen of the phospholipid, we conclude that changes in the order parameters from the lipid glycerol C–H groups are likely due to changes in the hydrogen bonding pattern between lipids, with hydrogen bonds between dendrimer functional groups and lipids partially replacing lipid-lipid intermolecular hydrogen bonds that occur in pure lipid bilayers.
The increase in acyl chain order throughout the length of the acyl chain therefore argues that both the G5 and G7 dendrimers is inserted deeply into the membrane, in agreement with the RFDR and NOESY results, which suggest the end of the acyl chains are proximate to the interior of the dendrimer, and the 31P and 14N NMR spectroscopy results, which show a lack of significant electrostatic interaction between the dendrimer and the lipid bilayer.
Implications for dendrimer induced membrane disruption
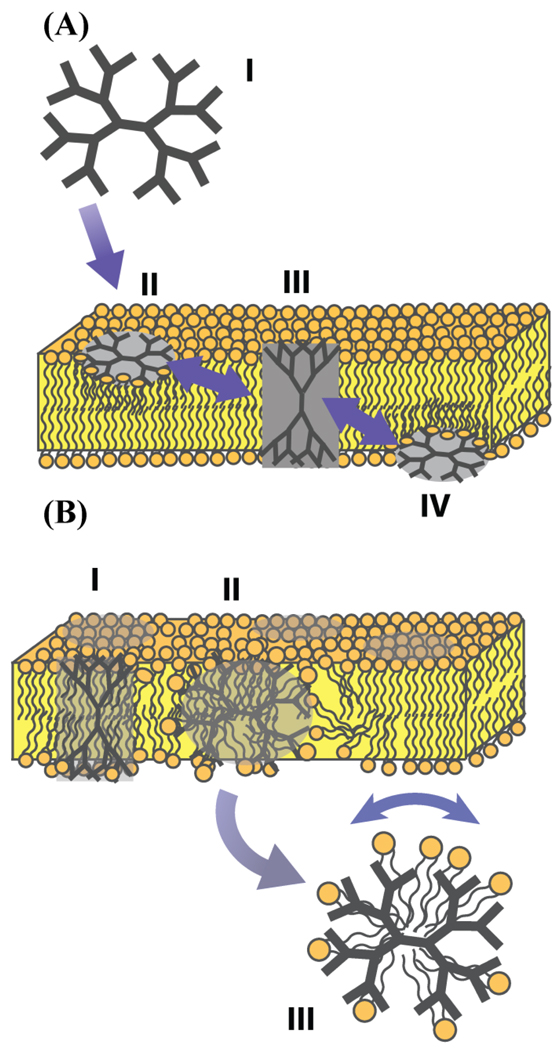
One of the most significant interactions of dendrimers with the cell membrane is the formation of nanoscale holes in the membrane, which is followed by the fragmentation of the membrane at higher concentrations. Several mechanisms are possible whereby nanoparticles induce membrane disruption as shown in figure 9. Three distinct models of membrane disruption have been proposed based by dynamic light scattering, AFM, patch clamping ,and isothermal titration calorimetry (ITC): (1) the abstraction of lipid vesicles enclosing dendrimers from the bilayer (as shown in figure 9a),11,15 (2) the abstraction of micellar lipid and dendrimer structures (as shown in figure 9b),15,56 (3) or a carpet mechanism of membrane disruption, which eventually leads to the abstraction of lipids and the formation of a toroidal pore or wormhole structure (as shown in figure 9c).18,21,23,57–58
Figure 9.
Likely models of PAMAM dendrimer and DMPC lipid interaction. (A) A dendrimer-filled lipid vesicle model of lipid bilayer disruption. The dendrimer binds at the surface of the membrane causing a bending stress that is relieved by the formation of dendrimer filled micelles.11,15 (B) Membrane disruption by the abstraction of micellar lipid and dendrimer structures from the lipid bilayer. This mechanism is similar to Model A except the lipid tails are intercalated into the interior with the headgroups associated with the charged amines of the dendrimer.15,56 (C) A carpet model of dendrimer-filled lipid bilayer disruption.23,58 Surface binding of the dendrimer creates excess curvature in the membrane,18,21 which is relieved by the formation of lipid-lined toroidal pores. After toroidal pores are eventually formed, there may more than one dendrimer inside the pore, although only one dendrimer is depicted here.
The membrane fragmentation products that would be expected to be present according to models 1 and 2 did not occur at the concentrations of dendrimers used at this study, as shown by the absence of an isotropic peak in the 31P spectra of any of the samples (see figure 8). At higher concentrations (3 % molar ratio of dendrimer/lipid or ~90 wt. % dendrimer/lipid), however, 31P NMR spectroscopy and dynamic light scattering membrane do show the fragmentation of the membrane into small vesicle-like structures. In addition, a notable increase order parameters in the lipid tail is observed (see figures 4, 5 and figure 6) in the R-PDLF experiments, An increase in the order of the lipid tail (S|CH|) would seem to argue for the model where dendrimers produce toroidal pore structures in the lipid bilayer, because of the way lipid tails appear to be crowded in the plane parallel to the bilayer normal (see figure 9c). However, the S|CH| expected from wormhole perforations in the lipid bilayer are not necessarily larger or smaller than the S|CH| observed from lipids in an unperturbed lipid bilayer.59–60 In general, the C–H bonds of lipids in a toroidal pore will either be rigidified or made more flexible depending of a variety of factors including lateral lipid diffusion and the structure of the toroidal pore. However, the effects Wi et al. observed usually involved more of a broadening of the 2H lineshape than changes in the 2H order parameters. On the other hand, we observed a significant rigidification of lipid tails in the presence of dendrimers.59 Furthermore, in mesoscopic dynamics studies on PAMAM dendrimer induced pore formation it was found that dendrimer-induced toroidal pores increased lipid tail flexibility and did not rigidify lipid tails as we observed.49 Based on these considerations, membrane disruption by the formation of toroidal pores (model 3) is less likely for purely zwitterionic bilayers than membrane disruption by membrane fragmentation (models 1 and 2).
A putative model of dendrimer-mediated membrane disruption at higher dendrimer concentrations in largely zwitterionic lipids can be made based on our results as well as previous experimental and theoretical experiments (fig. 10). The dendrimer first approaches the membrane, deforming in response to the electric potential of the membrane as shown by Kelly et al.9 The dendrimer then binds the surface of the lipid bilayer and changes its conformation, spreading out into a pancake shape to bind as many lipids as possible.9,61 As it does this it probably expulses water molecules that are bound inside the dendrimer molecule,2 and hydrogen bonds between the water molecules and the dendrimer are replaced with hydrogen bonds between lipids and the dendrimer. Now that the interior of the dendrimer is exposed to the lipid-water interface, it is more likely that the branches of the dendrimer may penetrate through the membrane and make contact with the opposite leaflet of the bilayer, as has been observed in coarse-grained molecular dynamics simulations by Lee et al (Fig 10A).17,49 As more branches of the dendrimer penetrate through the lipid bilayer, the dendrimer will completely insert into the lipid bilayer, weakening lipid-lipid interactions and thus weakening the bilayer structure of the membrane. As more lipid-lipid interactions are replaced by dendrimer-lipid interactions, the bilayer weakens and eventually collapses and dendrimer filled lipid micelles are abstracted. Similar dendrimer filled micelle structures have been observed to form upon the addition of dendrimers to the amphipathic detergent sodium dodecyl sulfate (SDS).56 Note that this model implies that enough dendrimers have to insert into the lipid bilayer to dendrimer-lipid interactions to overpower lipid-lipid interactions. At the lower concentrations of dendrimers we studied, they interact with lipid bilayers according to the membrane insertion mechanism and not the dendrimer-lipid micelle abstraction mechanism. This means that either high concentrations of PAMAM dendrimers or the gradual build-up of dendrimers in the lipid bilayer over time might result in lipid bilayer disruption (Fig. 10B).19
Figure 10.
Plausible models of dendrimer-lipid interaction at low and high concentrations. (A) Model ofdendrimer-lipid interactions at low dendrimer concentrations.. The dendrimer can traeverse the bilayer by first binding to the surface of the outer leaflet, inserting into the membrane making contacts at both leaflets, and finally dissociating from the membrane on the opposite side. (B) At higher dendrimer concentrations the structural integrity of the membrane is weakened and dendrimer-lipid micelles are formed.
Our results were obtained using with DMPC bilayers, which are zwitterionic like the majority of the lipids in the cell membranes. It is possible that the manner in which dendrimers will interact with lipid bilayer will change as the charge of the membrane is varied. In fact, ITC studies have suggested that whereas PAMAM dendrimers’ interactions with zwitterionic lipid bilayers are entropy driven, their interactions with charged lipid bilayers are driven instead by the favorable enthalpic electrostatic contribution to the binding energy.7,25–26 In this case the dendrimer-filled vesicle (fig. 9a) and toroidal pore (fig. 9b) models of membrane disruption become more likely as the association of the dendrimer with the lipid headgroup becomes stronger than with the acyl chains.
In conclusion, we have shown that dendrimers will insert deeply into zwitterionic lipid bilayers in a process apparently dominated by the hydrophobic association of the lipid acyl chain with the interior of the dendrimer. Since the hydrophobicity of the dendrimer interior can be tuned by altering the composition of the building blocks of the dendrimer,55 this finding has practical consequences both for the design of new nanodevices to both carry lipophilic drugs to biomembranes and for avoiding some of the negative aspects of unfunctionalized PAMAM dendrimers interactions with biomembranes.
Supplementary Material
ACKNOWLEDGMENTS
We acknowledge Drs. Lisa Prevette, Shivani Ahuja, Ronald Soong and Ms. Stephanie Le Clair for helpful discussion. This research was supported by funds from NIH (RR023597 and AI 054515 to A.R., and EB005028 to M.B.H.) and NSF (CRIF-MU to the Chemistry Department).
Footnotes
SUPPORTING INFORMATION
1H NMR spectra of dendrimer and lipid samples obtained under MAS conditions.
REFERENCES
- 1.Topp A, Bauer BJ, Klimash JW, Spindler R, Tomalia DA, Amis EJ. Macromolecules. 1999;32:7226–7231. [Google Scholar]
- 2.Lee H, Baker JR, Larson RG. J. Phys. Chem. B. 2006;110:4014–4019. doi: 10.1021/jp056148s. [DOI] [PMC free article] [PubMed] [Google Scholar]
- 3.Wooley KL, Klug CA, Tasaki K, Schaefer J. J. Am. Chem. Soc. 1997;119:53–58. [Google Scholar]
- 4.Jiang Y-H, Emau P, Cairns JS, Flanary L, Morton WR, McCarthy TD, Tsai C-C. AIDS Res. Hum. Retroviruses. 2005;21:207–213. doi: 10.1089/aid.2005.21.207. [DOI] [PubMed] [Google Scholar]
- 5.Bourne N, Stanberry LR, Kern ER, Holan G, Matthews B, Bernstein DI. Antimicrob. Agents Ch. 2000;44:2471–2474. doi: 10.1128/aac.44.9.2471-2474.2000. [DOI] [PMC free article] [PubMed] [Google Scholar]
- 6.Kukowska-Latallo JF, Candido KA, Cao ZY, Nigavekar SS, Majoros IJ, Thomas TP, Balogh LP, Khan MK, Baker JR. Cancer Res. 2005;65:5317–5324. doi: 10.1158/0008-5472.CAN-04-3921. [DOI] [PubMed] [Google Scholar]
- 7.Kelly CV, Liroff MG, Triplett LD, Leroueil PR, Mullen DG, Wallace JM, Meshinchi S, Baker JR, Orr B, Holl MMB. ACS Nano. 2009;3:1886–1896. doi: 10.1021/nn900173e. [DOI] [PMC free article] [PubMed] [Google Scholar]
- 8.Hong SP, Leroueil PR, Janus EK, Peters JL, Kober MM, Islam MT, Orr BG, Baker JR, Holl MMB. Bioconjugate Chem. 2006;17:728–734. doi: 10.1021/bc060077y. [DOI] [PubMed] [Google Scholar]
- 9.Kelly CV, Leroueil PR, Nett EK, Wereszczynski JM, Baker JR, Orr BG, Holl MMB, Andricioaei I. J. Phys. Chem. B. 2008;112:9337–9345. doi: 10.1021/jp801377a. [DOI] [PMC free article] [PubMed] [Google Scholar]
- 10.Pantos A, Tsiourvas D, Nounesis G, Paleos CM. Langmuir. 2005;21:7483–7490. doi: 10.1021/la0510331. [DOI] [PubMed] [Google Scholar]
- 11.Mecke A, Uppuluri S, Sassanella TM, Lee DK, Ramamoorthy A, Baker JR, Orr B, Holl MMB. Chem. Phys. Lipids. 2004;132:3–14. doi: 10.1016/j.chemphyslip.2004.09.001. [DOI] [PubMed] [Google Scholar]
- 12.Tsogas I, Theodossiou T, Sideratou Z, Paleos CM, Collet H, Rossi JC, Romestand B, Cornmeyras A. Biomacromolecules. 2007;8:3263–3270. doi: 10.1021/bm700668w. [DOI] [PubMed] [Google Scholar]
- 13.Quintana A, Raczka E, Piehler L, Lee I, Myc A, Majoros I, Patri A, Thomas T, Mule J, Baker JR. Pharmaceut. Res. 2002;19:1310–1316. doi: 10.1023/a:1020398624602. [DOI] [PubMed] [Google Scholar]
- 14.Hong SP, Bielinska AU, Mecke A, Keszler B, Beals JL, Shi XY, Balogh L, Orr BG, Baker JR, Holl MMB. Bioconjugate Chem. 2004;15:774–782. doi: 10.1021/bc049962b. [DOI] [PubMed] [Google Scholar]
- 15.Mecke A, Majoros IJ, Patri AK, Baker JR, Holl MMB, Orr BG. Langmuir. 2005;21:10348–10354. doi: 10.1021/la050629l. [DOI] [PubMed] [Google Scholar]
- 16.Kelly CV, Leroueil PR, Orr BG, Holl MMB, Andricioaei I. J. Phys. Chem. B. 2008;112:9346–9353. doi: 10.1021/jp8013783. [DOI] [PMC free article] [PubMed] [Google Scholar]
- 17.Lee H, Larson RG. J. Phys. Chem. B. 2008;112:7778–7784. doi: 10.1021/jp802606y. [DOI] [PMC free article] [PubMed] [Google Scholar]
- 18.Lee H, Larson RG. J. Phys. Chem. B. 2008;112:12279–12285. doi: 10.1021/jp805026m. [DOI] [PMC free article] [PubMed] [Google Scholar]
- 19.Chen JM, Hessler JA, Putchakayala K, Panama BK, Khan DP, Hong S, Mullen DG, DiMaggio SC, Som A, Tew GN, Lopatin AN, Baker JR, Holl MMB, Orr BG. J. Phys. Chem. B. 2009;113:11179–11185. doi: 10.1021/jp9033936. [DOI] [PMC free article] [PubMed] [Google Scholar]
- 20.Ginzburg VV, Balijepalli S. Nano Lett. 2007;7:3716–3722. doi: 10.1021/nl072053l. [DOI] [PubMed] [Google Scholar]
- 21.Zhang Z-Y, Smith BD. Bioconjugate Chem. 2000;11:805–814. doi: 10.1021/bc000018z. [DOI] [PubMed] [Google Scholar]
- 22.Betley TA, Holl MMB, Orr BG, Swanson DR, Tomalia DA, Baker JR. Langmuir. 2001;17:2768–2773. [Google Scholar]
- 23.Leroueil PR, Hong S, Mecke A, Baker JR, Orr BG, Banaszak Holl MM. Acc. Chem. Res. 2007;40:335–342. doi: 10.1021/ar600012y. [DOI] [PMC free article] [PubMed] [Google Scholar]
- 24.Braun CS, Vetro JA, Tomalia DA, Koe GS, Koe JG, Middaugh CR. J. Pharm. Sci. 2005;94:423–436. doi: 10.1002/jps.20251. [DOI] [PubMed] [Google Scholar]
- 25.Gardikis K, Hatziantoniou S, Viras K, Wagner M, Demetzos C. Int. J. Pharm. 2006;318:118–123. doi: 10.1016/j.ijpharm.2006.03.023. [DOI] [PubMed] [Google Scholar]
- 26.Klajnert B, Epand RM. Int. J. Pharm. 2005;305:154–166. doi: 10.1016/j.ijpharm.2005.08.015. [DOI] [PubMed] [Google Scholar]
- 27.Ottaviani MF, Daddi R, Brustolon M, Turro NJ, Tomalia DA. Langmuir. 1999;15:1973–1980. [Google Scholar]
- 28.Ottaviani MF, Matteini P, Brustolon M, Turro NJ, Jockusch S, Tomalia DA. J. Phys. Chem. B. 1998;102:6029–6039. [Google Scholar]
- 29.Hallock KJ, Lee D-K, Ramamoorthy A. Biophys. J. 2003;84:3052–3060. doi: 10.1016/S0006-3495(03)70031-9. [DOI] [PMC free article] [PubMed] [Google Scholar]
- 30.Ludtke SJ, He K, Heller WT, Harroun TA, Yang L, Huang HW. Biochemistry. 1996;35:13723–13728. doi: 10.1021/bi9620621. [DOI] [PubMed] [Google Scholar]
- 31.Smith PES, Brender JR, Ramamoorthy A. J. Am. Chem. Soc. 2009;131:4470–4478. doi: 10.1021/ja809002a. [DOI] [PMC free article] [PubMed] [Google Scholar]
- 32.Nanga RPR, Brender JR, Vivekanandan S, Popovych N, Ramamoorthy A. J. Am. Chem. Soc. 2009;131:17972–17979. doi: 10.1021/ja908170s. [DOI] [PMC free article] [PubMed] [Google Scholar]
- 33.Majoros IJ, Keszler B, Woehler S, Bull T, Baker JR. Macromolecules. 2003;36:5526–5529. [Google Scholar]
- 34.Zhao X, Edén M, Levitt MH. Chem. Phys. Lett. 2001;342:353–361. [Google Scholar]
- 35.Nakai T, Terao T. Magn. Reson. Chem. 1992;30:42–44. [Google Scholar]
- 36.Morris GA, Freeman R. J. Am. Chem. Soc. 1979;101:760–762. [Google Scholar]
- 37.Dvinskikh SV, Zimmermann H, Maliniak A, Sandström D. J. Magn. Reson. 2004;168:194–201. doi: 10.1016/j.jmr.2004.03.001. [DOI] [PubMed] [Google Scholar]
- 38.Dvinskikh SV, Castro V, Sandström D. Phys. Chem. Chem. Phys. 2005;7:607–613. doi: 10.1039/b418131j. [DOI] [PubMed] [Google Scholar]
- 39.Macdonald PM, Leisen J, Marassi FM. Biochemistry. 1991;30:3558–3566. doi: 10.1021/bi00228a029. [DOI] [PubMed] [Google Scholar]
- 40.Ulrich AS, Watts A. Biophys. J. 1994;66:1441–1449. doi: 10.1016/S0006-3495(94)80934-8. [DOI] [PMC free article] [PubMed] [Google Scholar]
- 41.Bechinger B, Seelig J. Chem. Phys. Lipids. 1991;58:1–5. doi: 10.1016/0009-3084(91)90105-k. [DOI] [PubMed] [Google Scholar]
- 42.Yamamoto K, Soong R, Ramamoorthy A. Langmuir. 2009;25:7010–7018. doi: 10.1021/la900200s. [DOI] [PMC free article] [PubMed] [Google Scholar]
- 43.Cakara D, Kleimann J, Borkovec M. Macromolecules. 2003;36:4201–4207. [Google Scholar]
- 44.Aucoin D, Camenares D, Zhao X, Jung J, Sato T, Smith SO. J. Magn. Reson. 2009;197:77–86. doi: 10.1016/j.jmr.2008.12.009. [DOI] [PMC free article] [PubMed] [Google Scholar]
- 45.Huster D, Arnold K, Gawrisch K. J. Phys. Chem. B. 1998;103:243–251. [Google Scholar]
- 46.Yau W-M, Gawrisch K. J. Am. Chem. Soc. 2000;122:3971–3972. [Google Scholar]
- 47.Rothgeb TM, Oldfield E. J. Biol. Chem. 1981;256:6004–6009. [PubMed] [Google Scholar]
- 48.Santos JS, Lee D-K, Ramamoorthy A. Magn. Reson. Chem. 2004;42:105–114. doi: 10.1002/mrc.1327. [DOI] [PubMed] [Google Scholar]
- 49.Lee H, Larson RG. J. Phys. Chem. B. 2006;110:18204–18211. doi: 10.1021/jp0630830. [DOI] [PubMed] [Google Scholar]
- 50.Ottaviani MF, Favuzza P, Sacchi B, Turro NJ, Jockusch S, Tomalia DA. Langmuir. 2002;18:2347–2357. [Google Scholar]
- 51.Barry J, Fritz M, Brender JR, Smith PES, Lee DK, Ramamoorthy A. J. Am. Chem. Soc. 2009;131:4490–4498. doi: 10.1021/ja809217u. [DOI] [PMC free article] [PubMed] [Google Scholar]
- 52.Henzler-Wildman KA, Martinez GV, Brown MF, Ramamoorthy A. Biochemistry. 2004;43:8459–8469. doi: 10.1021/bi036284s. [DOI] [PubMed] [Google Scholar]
- 53.Thennarasu S, Lee DK, Poon A, Kawulka KE, Vederas JC, Ramamoorthy A. Chem. Phys. Lipids. 2005;137:38–51. doi: 10.1016/j.chemphyslip.2005.06.003. [DOI] [PubMed] [Google Scholar]
- 54.Mecke A, Lee DK, Ramamoorthy A, Orr BG, Holl MMB. Biophys. J. 2005;89:4043–4050. doi: 10.1529/biophysj.105.062596. [DOI] [PMC free article] [PubMed] [Google Scholar]
- 55.Tomalia DA. Prog. Polym. Sci. 2005;30:294–324. [Google Scholar]
- 56.Cheng YY, Wu QL, Li YW, Hu JJ, Xu TW. J. Phys. Chem. B. 2009;113:8339–8346. doi: 10.1021/jp9021618. [DOI] [PubMed] [Google Scholar]
- 57.Oren Z, Shai Y. Biopolymers. 1998;47:451–463. doi: 10.1002/(SICI)1097-0282(1998)47:6<451::AID-BIP4>3.0.CO;2-F. [DOI] [PubMed] [Google Scholar]
- 58.Bechinger B, Lohner K. Biochim. Biophys. Acta. 2006;1758:1529–1539. doi: 10.1016/j.bbamem.2006.07.001. [DOI] [PubMed] [Google Scholar]
- 59.Wi S, Kim C. J. Phys. Chem. B. 2008;112:11402–11414. doi: 10.1021/jp801825k. [DOI] [PubMed] [Google Scholar]
- 60.Sengupta D, Leontiadou H, Mark AE, Marrink S-J. Biochim. Biophys. Acta. 2008;1778:2308–2317. doi: 10.1016/j.bbamem.2008.06.007. [DOI] [PubMed] [Google Scholar]
- 61.Mecke A, Lee I, Baker JR, Holl MMB, Orr BG. Eur. Phys. J. E. 2004;14:7–16. doi: 10.1140/epje/i2003-10087-5. [DOI] [PubMed] [Google Scholar]
- 62.Yang WY, Li Y, Cheng Y, Wu Q, Wen L, Xu T. J. Pharm. Sci. 2009;98:1075–1085. doi: 10.1002/jps.21519. [DOI] [PubMed] [Google Scholar]
Associated Data
This section collects any data citations, data availability statements, or supplementary materials included in this article.


