Abstract
Background and Aims
Research on manganese (Mn) toxicity and tolerance indicates that Mn toxicity develops apoplastically through increased peroxidase activities mediated by phenolics and Mn, and Mn tolerance could be conferred by sequestration of Mn in inert cell compartments. This comparative study focuses on Mn-sensitive barley (Hordeum vulgare) and Mn-tolerant rice (Oryza sativa) as model organisms to unravel the mechanisms of Mn toxicity and/or tolerance in monocots.
Methods
Bulk leaf Mn concentrations as well as peroxidase activities and protein concentrations were analysed in apoplastic washing fluid (AWF) in both species. In rice, Mn distribution between leaf compartments and the leaf proteome using 2D isoelectic focusing IEF/SDS–PAGE and 2D Blue native BN/SDS–PAGE was studied.
Key Results
The Mn sensitivity of barley was confirmed since the formation of brown spots on older leaves was induced by low bulk leaf and AWF Mn concentrations and exhibited strongly enhanced H2O2-producing and consuming peroxidase activities. In contrast, by a factor of 50, higher Mn concentrations did not produce Mn toxicity symptoms on older leaves in rice. Peroxidase activities, lower by a factor of about 100 in the rice leaf AWF compared with barley, support the view of a central role for these peroxidases in the apoplastic expression of Mn toxicity. The high Mn tolerance of old rice leaves could be related to a high Mn binding capacity of the cell walls. Proteomic studies suggest that the lower Mn tolerance of young rice leaves could be related to Mn excess-induced displacement of Mg and Fe from essential metabolic functions.
Conclusions
The results provide evidence that Mn toxicity in barley involves apoplastic lesions mediated by peroxidases. The high Mn tolerance of old leaves of rice involves a high Mn binding capacity of the cell walls, whereas Mn toxicity in less Mn-tolerant young leaves is related to Mn-induced Mg and Fe deficiencies.
Keywords: Apoplast, compartmentation, Hordeum vulgare ‘Baroness’, Mn sensitivity, Mn tolerance, Oryza sativa var. japonica ‘Guara’, proteome, photosynthesis
INTRODUCTION
Manganese (Mn) excess represents an important factor limiting growth and crop yields particularly on acid and insufficiently drained soils with low redox potential (Foy, 1984; Schlichting and Sparrow, 1988). Soil amelioration such as liming and soil drainage is often not economic and only partly successful. Therefore, crop genotypes with high Mn resistance have to be developed. Large differences in Mn tolerance exist between plant species and cultivars within species (Heenan and Carter, 1976; Foy et al., 1978; Horst, 1980). Barley is among the most Mn-sensitive crop species (Vlamis and Williams, 1962; Vlamis and Williams 1964), whereas rice is one of the most Mn-tolerant crops (Nelson, 1983; Lidon, 2001).
Presently, there are two major lines of evidence that provide insight into the basis of Mn toxicity and Mn tolerance in plant species other than rice. Based on the assumption that cytosolic Mn2+ activity has to be kept low to avoid Mn2+ interfering with essential metabolic functions, pumping of Mn2+ from the cytosol into other cell compartments has been postulated to confer Mn tolerance (Wang and Evangelou, 1995; Pittman, 2005). It has been reported that in Mn-hyperaccumulators Mn tolerance is mainly due to the sequestration of Mn in the vacuoles (Fernando et al., 2006; Dou et al., 2008). There is convincing evidence from molecular studies on cation/Mn2+ transporters that this mechanism is important for Mn tolerance in yeast and a number of plant species (Hirschi et al., 2000; Schaaf et al., 2002; Wu et al, 2002; Delhaize et al., 2003, 2007; Peiter et al., 2007; Li et al., 2008). In conclusion, these studies strongly suggest that compartmentation of Mn in cellular compartments particularly in vacuoles and the endoplasmic reticulum (ER)/Golgi is an important feature of Mn plant tissue tolerance in some plant species. This suggests that Mn toxicity is due to accumulation of Mn in Mn-sensitive cell compartments (cytosol and/or chloroplasts and mitochondria).
The second line of evidence for the mechanism of Mn toxicity and tolerance in plants is based mainly on work with cowpea (Vigna unguiculata). Typical Mn stress-induced toxicity symptoms develop primarily on older leaves as distinct brown spots located in the leaf apoplast of the epidermis (Horst, 1982). The brown spots consist of oxidized Mn and oxidized phenolic compounds (Wissemeier and Horst, 1992). This, and greatly enhanced activities of H2O2-producing and H2O2-consuming peroxidases (PODs) particularly in the apoplastic washing fluid (AWF), suggests that the leaf apoplast is the decisive compartment for the development or avoidance of Mn toxicity in cowpea (Fecht-Christoffers et al., 2006, 2007). Proteome analysis of the AWF confirmed an enhanced release of PODs into the leaf apoplast, but in addition revealed the release of several other apoplastic stress response proteins in response to advanced Mn stress (Fecht-Christoffers, 2003b). In subsequent studies we provided evidence suggesting that apoplastic H2O2-producing POD-enhancing and inhibiting phenols in addition to Mn play a major role in modulating genotypic and silicon (Si)-enhanced differences in Mn tolerance (Fecht-Christoffers et al., 2006; Führs et al., 2009). Results from combined proteomic/transcriptomic/physiological approaches clearly indicate that toxic Mn supply affects symplastic functions particularly related to photosynthesis (Führs et al., 2008). Consistent with a decrease in the electron transfer rates (ETRs), a state I to state II transition of photosynthesis was observed in Mn-stressed cowpea leaves after 72 h of elevated Mn supply. Also, chloroplastic proteins important for CO2 fixation and photosynthesis were of lower abundance upon Mn stress. The relationships between these early Mn toxicity-induced leasons in the chloroplast and the above-described apoplastic reactions leading to the typical Mn toxicity symptoms remain to be elucidated.
Paddy rice is cultivated in soils with a highly reduced state and thus very high Mn availability. Since oxidation of Mn2+ requires a higher redox potential than Fe2+ (Mansfeldt, 2004), the maintenance of an oxidized zone at the root surface successfully oxidizing Fe2+ (Zhang et al., 1998; Kirk, 2003) does not immobilize Mn2+ sufficiently. Thus rice accumulates and tolerates high concentrations of Mn in the plant tissue, particularly leaves. Whereas Mn concentrations of >150 µg g−1 d. wt lead to Mn toxicity symptoms in barley (Vlamis and Williams, 1964; Demirevska-Kepova, 2004), rice can tolerate up to 5000 µg g−1 d. wt without showing any toxicity symptoms (Vlamis and Williams, 1964). Lidon and co-workers (Lidon and Teixeira, 2000; Lidon, 2001; Lidon et al., 2004) concluded that the high leaf Mn tolerance of rice is not due to Mn accumulation and inactivation in vacuoles but to the enhanced binding of Mn in a chloroplast-localized protein which showed superoxide dismutase (SOD) activity. Nevertheless, the general scarcity of physiological and, particularly, molecular information on Mn tolerance in rice makes additional work necessary to elucidate the high Mn tolerance of this plant species.
The present study investigates Mn toxicity and Mn tolerance mechanisms comparing the most Mn-sensitive amd Mn-tolerant plant species barley and rice, respectively, as model organisms. The comparison of the two species sets the baseline of our ongoing approaches to identify Mn tolerance genes in rice which could be expressed in barley as a proof of function. This approach has previously been convincingly applied to demonstrate the decisive role of the TALMT1 gene in Al resistance (Delhaize et al., 2004). Proteomic and physiological approaches previously applied to unravel Mn toxicity and tolerance in legumes were used in order to verify whether the same mechanisms also act in cereals.
MATERIALS AND METHODS
Plant cultivation
Rice (Oryza sativa ‘Guara’) and barley (Hordeum vulgare ‘Baroness’) were grown hydroponically in a growth chamber under controlled environmental conditions at 25/20 °C day/night temperatures, 75 ± 5 % relative humidity and a photon flux density of 150 µmol m−1 s−1 photosynthetic active radiation (PAR) at mid-plant height during a 16 h photoperiod. After germination in 1 mm CaSO4 for 10–12 d, seedlings were transferred to nutrient solution with 20 or 30 plants of barley and rice in 5 L pots, respectively. The nutrient solution was constantly aerated only for barley. The composition of the nutrient solution was (μm): Ca(NO3)2 1000 for barley or 500 Ca(NO3)2 and 500 NH4NO3 for rice, KH2PO4 100, K2SO4 375, MgSO4 325, FeEDDHA 20, NaCl 10, H3BO3 8, CuSO4 0·2, ZnSO4 0·2, Na2MoO4 0·05. Barley plants additionally received 0·2 µm and rice plants 1 µm MnSO4 according to their Mn requirements for optimum growth (preliminary experiments). Half of the plants received additional Mn (50 µm, this Mn supply has proved to be most appropriate for the study of Mn toxicity in previous and preliminary studies) for up to 4 d when the fifth leaf was fully developed (approx. 34–38 d after transfer to nutrient solution), whereas the other plants received 0·2/1 µm continously. During pre-culture the nutrient solution was changed every 2–3 d in order to prevent nutrient deficiencies. During the Mn treatment the nutrient solution was changed twice a day to maintain a constant Mn supply.
Harvesting of plant material
Leaf material for physiological and proteomic analyses was harvested from the older (second, fourth) and younger (fourth, sixth) leaves and immeditately frozen in liquid nitrogen. Until further analysis the material was stored at –80 °C. For mineral analysis leaf material was dried at 65 °C.
Apoplastic washing fluid
Apoplastic washing fluid was extracted from leaves using a vaccum infiltration/centrifugation technique. Leaf blades were excised from the plants and cut in the middle. Leaf halves were washed in chilled double-demineralized water (ddH2O) in order to reduce cytosolic contamination. Leaf halves from 20 leaves were combined and infiltrated with chilled ddH2O by reducing the pressure four times for 2·5 min followed by a slow relaxation. The AWF was recovered by centrifugation of the blotted cuttings at 4000 g and 4 °C for 5 min in 500 mL centrifugal devices (Nalgene, Nalge Nunc). The AWF was immediately frozen in liquid nitrogen and, until further analysis, stored at −80 °C. In order to estimate the apoplastic volume leaves were weighed before and after infiltration.
Mineral analysis
For Mn determination the dried and milled plant material was dry-ashed overnight at 480 °C. Samples were prepared and measured as descibed by Führs et al. (2009).
Total Si was determined following the protocol described by Iwasaki et al. (2002a, b) using 10 mg of dried plant material.
For determination of Mn concentrations in the AWF, 50 µL samples were filtered through centrifugal filter devices (0·2 µm, GHP Nanosep Mt centrifugal device, PAL Lifesciences, Ann Arbor, MI, USA) for 10 min at 4000 g. Filtrates were diluted 1 : 50 with ddH2O and measured using inductively coupled plasma-optical emission spectroscopy (ICP-OES; Spektro Analytical Instruments GmbH, Kleve, Germany).
Isolated chloroplasts were dry-ashed overnight at 480 °C. The ash was dissolved in 300 µL of 6 m HCl supplemented with 1·5 % (w/v) hydroxylammonium chloride. Samples were diluted 1 : 10 with ddH2O before analysis using ICP-OES. For the analysis of Mn in the individual chloroplast isolation fractions, 300 µL sub-samples were filtered through centrifugal filter units (see above) and centrifuged for 10 min at 4000 g. Filtrates were diluted 1 : 10 with ddH2O and measured using an ICP-MS (7500CX, Agilent, Böblingen, Germany). Results were expressed as a percentage of the total Mn concentration in the leaf fresh matter.
Chlorophyll fluorescence
Chlorophyll fluorescence of the older leaves was determined using a Mini-PAM fluorometer (Waltz, Germany). Measurements were made on dark-adapted plants using the light induction curve program: 1 min after a first saturation pulse actinic light was turned on and from then every 30 s a new saturation pulse was applied over a period of 6·5 min. The yield, ETR, nP, nQ and NPQ values were calculated using the included software. All measurements were repeated four times and submitted to statistical analysis.
Determination of the chlorophyll content
Prior to harvest of the leaves their chlorophyll contents were determined according to Schulte auf'm Erley et al. (2007) using a portable chlorophyll meter (SPAD). The means of five measurements over the whole leaf blade of the fourth and sixth leaf are shown.
Determination of protein contents
About 100 mg of frozen leaf fresh matter was homogenized in 1 mL of chilled ddH2O in a swinging mill (MM200, Retsch, Germany) with a frequency of 30 s−1 for 2 min. The homogenate was centrifuged at 5000 g for 1 min at 4 °C, and the supernatant was used for protein quantification using the 2D Quant Kit (GE Healthcare, Piscataway, NJ, USA) according to the manufacturer's instructions.
Protein in the AWF was quantified according to the method described by Bradford (1976).
For 2D isoelectric focusing IEF/SDS–PAGE protein was quantified after resolubilization of precipitated proteins using the 2D Quant Kit (GE Healthcare, USA) according to the manufacturer's instructions.
Determination of the phenol concentration in the AWF
The phenol concentration in the AWF was measured according to the method described by Fecht-Christoffers et al. (2006).
Determination of H2O2-consuming guaiacol-POD and H2O2-producing NADH-POD activity in the AWF
Both H2O2-consuming guaiacol-POD and H2O2-producing NADH-POD activities were determined as described by Führs et al. (2009).
Determination of the cytosolic contamination of the AWF using malate dehydrogenase (MDH) as marker enzyme
The MDH activity was determined according to the method described by Bergmeyer and Bernt (1974) including the preceding generation of oxalacetate from aspartate and α-ketoglutarate using glutamic-oxalacetic-transaminase (GOT). The decrease in absorption due to NADH oxidation was determined spectrophotometrically at λ = 340 nm (Uvikon 943 Double Beam, UV/ VIS Spectrophotometer, Kontron Instruments) for 1·2 min. Results were expressed as a percentage of the activity obtained from freshly prepared leaf homogenates.
Isolation of chloroplasts
Chloroplasts were isolated according to Tanaka et al. (2004) with minor modifications. Leaf material was homogenized in 100 mL of ‘homogenization buffer’ per 10 g of fresh matter [350 mm sorbitol, 2 mm EDTA (pH 8·0), 25 mm HEPES-NaOH, pH 7·0] using a blender for 4 × 3 s. The homogenate was filtered through four layers of gaze (50 µm mesh size) and centrifuged at 1200 g for 5 min at 4 °C. The resulting pellet was resuspended in 12–15 mL of ‘homogenization buffer’ containing 0·35 m sorbitol, 2 mm EDTA and 25 mm HEPES (pH 7·0), and loaded onto a discontinuous gradient formed by 10, 30 and 80 % Percoll. The gradient formation and separation of chloroplasts was done by centrifugation at 2600 g for 40 min at 4 °C. Intact chloroplasts were removed from the 30 %/80 % Percoll boundary layer and subsequently centrifuged at 1800 g for 5 min at 4 °C. The resulting pellet contained the ‘residue Mn’ fraction. The supernatant was removed and the resulting pellet was resuspended and centrifuged at 1800 g for 5 min at 4 °C. After weighing the pellet containing the ‘chloroplastic Mn’, it was resuspended in homogenization buffer with a final concentration of 100 mg mL−1. Sub-samples were taken from each washing step in order to determine the labile bound Mn fraction during the chloroplast isolation procedure (‘soluble Mn’). Isolated chloroplasts and sub-samples were immediately frozen in liquid nitrogen and stored at −80 °C until further analyses.
2D IEF/SDS–PAGE of soluble leaf homogenate and soluble chloroplastic proteins
Proteins from the leaf homogenates were extracted according to Hurkman and Tanaka (1986) with three biological replicates for both Mn-control and Mn-treated plants. Each replicate comprised a pool of 11 individual plants.
For investigation of the water-soluble chloroplastic proteome, isolated chloroplasts were frozen in liquid nitrogen. After thawing and centrifugation, the supernatant, containing the soluble chloroplastic proteins, was precipitated and used for IEF/SDS–PAGE as described by Führs et al. (2008). The recovered protein had to be combined into one sample due to the low chloroplast yields of the isolation procedure in rice.
2D Blue native BN/SDS–PAGE of photosynthetic protein complexes from thylakoid membranes
Proteins from thylakoid membranes of 10 mg of isolated chloroplasts were prepared and photosynthetic protein complexes were separated by 2D BN/SDS–PAGE as described by Heinemeyer et al. (2004).
Staining of 2D gels
Gels of 2D IEF/SDS–PAGE and 2D BN/SDS–PAGE were stained with colloidal Coomassie blue (Neuhoff et al., 1985, 1990).
2D IEF/SDS–polyacrylamide gels made from water-soluble chloroplastic proteins were stained with silver nitrate using an adapted method described by Heukeshoven and Dernick (1988).
Visualization of gels of 2D IEF/SDS–PAGE and 2D BN/SDS–PAGE
Coomassie colloidal-stained gels were scanned with 300 dpi (Epson Expression 1600 Scanner) and stored as .tiff files. For analysis of 2D IEF/SDS–polyacrylamide gels the files were transformed into .mel files. Subsequently the spots were detected, quantified and the three biological replications statistically analysed using Imagemaster™ 2D PLATINUM Software 6·0 (GE Healthcare, USA). The quantification parameter was the relative spot volume (%Vol, spot volume of one spot in relation to the sum of all detected spots on the gel) in order to eliminate protein loading differences. Only protein spots with a minimum spot volume of 0·01 % were included. Spots of significantly changed volumes (at least P < 0·05 and a spot ratio between the treatments of at least <0·5 or >2·0) were sequenced.
Mass spectrometric protein analysis and data interpretation
Mass spectrometric protein analysis and data interpretation were performed as described by Führs et al. (2008, 2009).
Statistical analysis
Statistical analysis, if not mentioned otherwise, was carried out using SAS Release v8·0 (SAS Institute, Cary, NC, USA) or the Multi Experiment Viewer MeV 4·1 (Saeed et al., 2003). Results from analysis of variance and correlation analysis are given according to their level of significance as ***, ** and * for P < 0·001, 0·01 and 0·05, respectively. Results of the mean comparisons are given at P < 0·05 (Tukey).
RESULTS
Comparative response of barley and rice to elevated Mn supply
Mn uptake and expression of toxicity symptoms
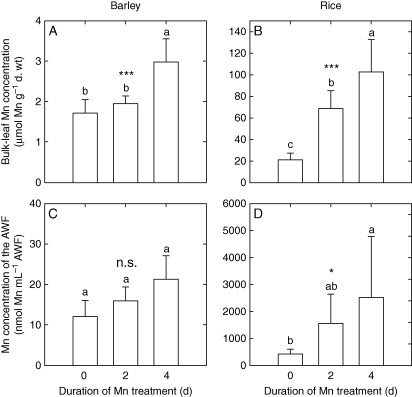
Elevated Mn supply for 2–4 d led to an increased Mn uptake in both barley and rice as represented by higher Mn concentrations in the leaf dry matter (Fig. 1A, B). Also apoplastic Mn concentrations increased at least in tendency in both plant species (Fig. 1C, D). In contrast to barley, rice had 30-fold higher Mn concentrations in both the bulk leaf and the AWF at the end of the Mn treatment without showing any symptoms, emphasizing the high Mn tolerance of rice.
Fig. 1.
Bulk leaf Mn concentrations and Mn concentrations of the AWF of the second oldest leaves of barley and rice. After pre-culture at 0·2 µm Mn, the Mn supply was increased to 50 µm for 0, 2 and 4 d, or plants received 0·2 µm Mn continuously. Results of one-factorial ANOVA are given as ***, * and n.s. for P < 0·001, 0·05, and not significant, respectively. Means with different letters indicate significant differences at P < 0·05 (Tukey test).
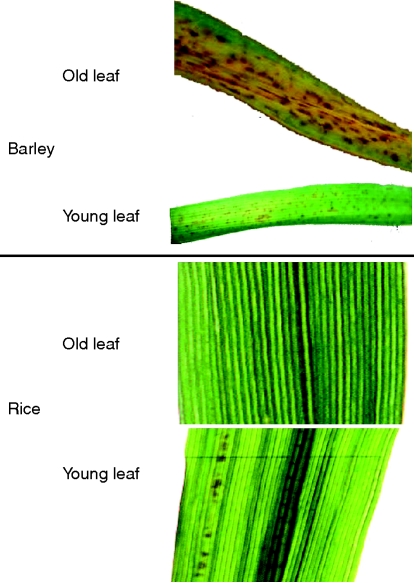
Toxicity symptoms in the form of typical brown spots appeared in barley on older leaves, particularly at the leaf tip. Typical symptoms are shown in Fig. 2 (top). Surprisingly, in contrast to observations made by Wang et al. (2002), brown spots in rice developed only on younger leaves (Fig. 2). Whether the brown spots are similar in nature to those in cowpea and barley on old leaves (accumulations of MnO2 and oxidized phenols) is not yet known.
Fig. 2.
Close-up views of leaf blades of old and young leaves of barley (top) and rice (bottom) after 4 d of elevated Mn supply. In barley, symptoms in the form of brown spots appear on leaves of both ages, whereas only in some replicates of rice did brown spots appear on younger leaves. In barley, old leaves additionally showed chlorosis, suggesting enhanced leaf senescenece.
The role of the apoplast
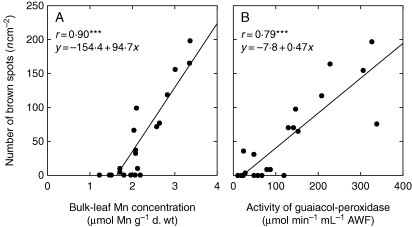
Previous studies on Mn toxicity focusing on legumes revealed a strong relationship between the occurrence of typical toxicity symptoms in the form of brown spots and an increase in apoplastic POD activities (Fecht-Christoffers et al., 2006, 2007; Führs et al., 2009). Only in barley was a strong relationship between the appearance of brown spots and the Mn tissue content and the guaiacol-POD activity found (Fig. 3A, B), emphasizing the key role of apoplastic PODs in Mn toxicity development in barley.
Fig. 3.
The number of brown spots on the second oldest leaves of barley in relation to the bulk leaf Mn concentration (A) and the activity of the guaiacol-POD in the AWF (B). After pre-culture at 0·2 µm Mn, the Mn supply was increased to 50 µm for 0, 2 and 4 d, or plants received 0·2 µm Mn continuously. Results of the regression analysis are given as *** for P < 0·001.
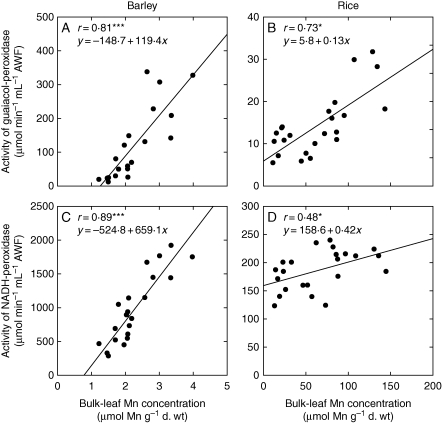
Both H2O2-consuming guaiacol-POD and H2O2-producing NADH-POD activities were an order of magnitude higher in the AWF of barley than in rice (Fig. 4). Whereas the former increased with increasing Mn concentrations in the leaves in both species (Fig. 4A, B), the NADH-POD activity was strongly enhanced by Mn in barley but remained at a low level in rice (Fig. 4C, D).
Fig. 4.
Activities of guaiacol-POD (A, B) and NADH-POD (C, D) in the second oldest leaves of barley (A, C) and rice (B, D) related to the Mn bulk leaf tissue concentration. After pre-culture at 0·2/1·0 µm Mn, the Mn supply was increased to 50 µm for 0, 2 and 4 d, or plants received 0·2/1·0 µm Mn continuously. Results of the regression analysis are given as ***, * for P < 0·001 and 0·05, respectively.
Understanding Mn tolerance of rice
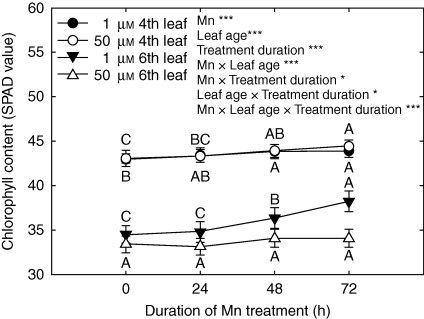
The results of the comparison of barley and rice are consistent with the assumption derived from studies of cowpea (see Introduction); the expression of Mn toxicity as revealed by the formation of brown spots on older leaves is related to the activities of apoplastic PODs. Since the activities of PODs are low in rice, Mn can accumulate in leaves to high concentrations without the appearance of symptoms of Mn toxicity. However, this requires other Mn tolerance mechanisms particularly in the leaf symplast. In this respect the appearance of Mn toxicity symptoms in rice in young but not in old leaves (see Fig. 2) seems particularly intriguing. Thus, old and young leaves were systematically compared in the following studies. The appearance of Mn toxicity symptoms on young leaves cannot be explained by higher Mn concentrations, which were significantly lower than in old leaves (Supplementary Data Fig. S1, available online). Also, both guaiacol-POD and NADH-POD activities were lower and not affected by Mn supply in the young, Mn-sensitive leaf (Supplementary Data Fig. S2), casting doubt on whether the mechanism of Mn toxicity operating in old leaves of barley is the same as that in young leaves of rice. Mn toxicity in young leaves is also characterized by a contrasting response with respect to chlorophyll content (measured as SPAD) of young vs. old leaves (Fig. 5, highly significant Mn × leaf age × treatment duration interaction). The increase in SPAD values with age in young leaves did not occur at elevated Mn supply, suggesting Mn excess-induced leaf chlorosis. However, photosynthesis as characterized by gas exchange and leaf chlorophyll fluorescence was not affected by Mn, either in young or in old leaves (not shown).
Fig. 5.
Effect of leaf age and Mn treatment duration on the development of chlorophyll contents (SPAD values) of rice leaf blades. Results of the three-factorial ANOVA are given as *** and * for P < 0·001 and 0·05, respectively. Different letters indicate significant differences (P < 0·05) between treatment durations for each Mn treatment (1·0 or 50 µm) for the fourth and the sixth leaves, respectively.
Compartmentation of Mn in rice leaf blades
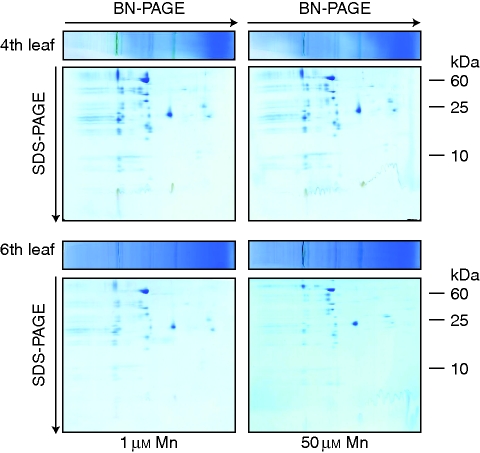
Studies by Lidon and co-workers (see Introduction) suggested that the binding of Mn to a chloroplast-localized protein is involved in the high Mn tolerance of rice leaves. Also previous work in cowpea indicated that the chloroplast was a primary target of Mn at toxic Mn supply (Führs et al., 2008). Therefore, in a first approach, we characterized the proteome of chloroplasts. A chloroplast isolation method (Tanaka et al., 2004) was adapted for proteomic characterization of thylakoid membrane protein complexes and water-soluble proteins of rice leaf chloroplasts. A 2D BN/SDS–PAGE separation of thylakoid membrane protein complexes as described by Heinemeyer et al. (2004) and Führs et al. (2008) did not reveal differences between Mn treatments and leaf ages. Therefore, an Mn-enhanced state 1 [photosystem II (PSII)] to state 2 (PS I) transition of light harvesting complex II, as has been observed in cowpea (Führs et al., 2008), could not be detected either in old or in young leaves (Fig. 6).
Fig. 6.
Resolution of the chloroplast protein complexes by 2D BN/SDS–PAGE. Chloroplasts were isolated using an adapted method described originally by Tanaka et al. (2004) from rice leaf blades of the fourth leaf (top) and the sixth leaf (bottom) treated with 50 µm Mn for 3 d (right) or with 1 µm Mn continuously (left), and thylakoid membrane-localized photosynthetic protein complexes were solubilized using digitonin and submitted to BN-PAGE as described by Heinemeyer et al. (2004) and Führs et al. (2008). Afterwards, gel slices were cut and placed horizontally on a second SDS-containing gel dimension in order to separate the protein complexes into their subunits.
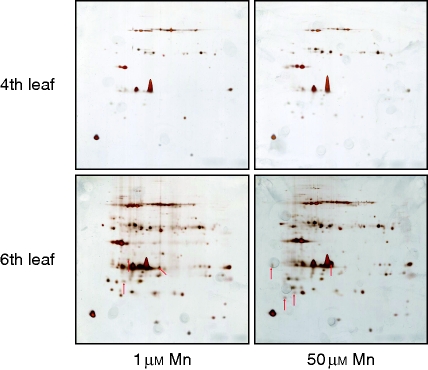
However, the postulated Mn-binding protein could also be present in the water-soluble, hence not membrane-bound protein fraction of the chloroplast. Therefore, in an additional experimental approach we submitted water-soluble proteins, which remained in the supernatant during the chloroplast–protein complex isolation, to a 2D IEF/SDS–PAGE (Fig. 7). After separation, the gels were stained with silver nitrate to visualize as many proteins as possible. Comparative visual inspection of the 2D resolutions led to the identification of at least seven proteins (arrows) which were changed in abundance due to elevated Mn supply for 72 h. However, the protein quantities were too small to identify the proteins by nano liquid chromatography–tandem mass spectrometry (LC-MS/MS), and thus their quantitative significance in Mn binding/detoxification is questionable.
Fig. 7.
IEF/SDS–PAGE resolution of water-soluble chloroplastic proteins of the fourth (top) and sixth (bottom) rice leaf without (left) and with (right) 50 µm Mn supply for 3 d. Chloroplasts were isolated using an adapted method described originally by Tanaka et al. (2004). After purification, chloroplasts were frozen in liquid nitrogen. After subsequent thawing of the chloroplasts, thylakoids were centrifuged. The supernatant was precipitated and finally used for electrophoresis. After separation, gels were stained with silver nitrate. Comparative visual inspection of the resolutions led to the identification of at least seven differentially affected proteins in the younger leaf (marked with red arrows).
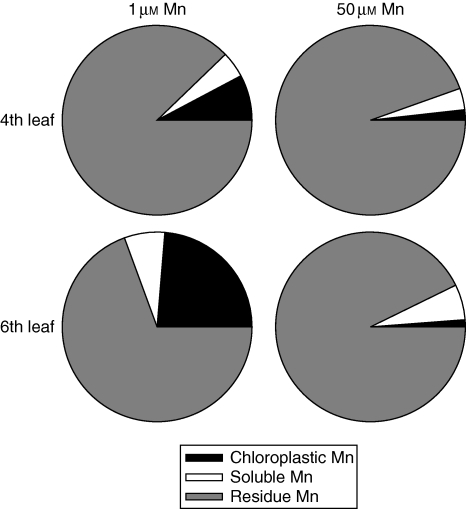
By determining the Mn contents in the different fractions during the chloroplast isolation procedure, we were able to calculate roughly the distribution of the bulk leaf Mn between the ‘chloroplastic’, the ‘soluble’ and the ‘residue’ Mn (Fig. 8). The results clearly show that with increasing bulk leaf Mn content, in Mn-treated plants in old as well as in young leaves, the contribution of chloroplastic Mn to the total bulk leaf Mn decreases. This does not support the view that sequestration of Mn in the chloroplast contributes to Mn tolerance. It rather appears that the sequestration of Mn in the leaf residue (mainly cell walls) is more important.
Fig. 8.
Relative contribution of chloroplastic, soluble and non-soluble residue Mn to the bulk leaf Mn content of rice leaf blades differing in leaf age and Mn treatment. Different Mn fractions were measured and calculated as described in the Materials and Methods section. Plants received either 50 µm Mn for 3 d or 1 µm Mn continuously.
Changes in the total water-soluble leaf proteome
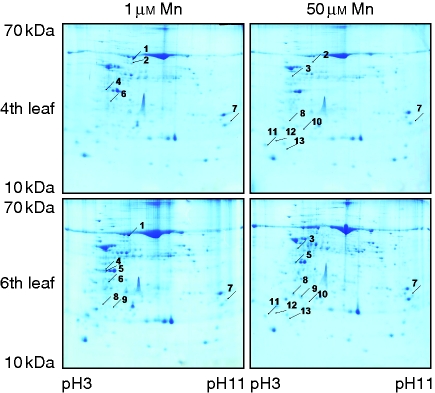
In an attempt to identify leaf proteins which are involved in the response of leaves to high Mn supply, we submitted old and young leaves to a systematic proteomic analysis. The total soluble protein concentration was, at least in tendency, decreased by Mn treatment more in the young than in the old leaves (Supplemenatry Data Fig. S3, available online). A thourough evaluation of gels after 2D IEF/SDS–PAGE separation of the bulk leaf extracts using Image Master™ 2D PLATINUM Software 6·0 (GE Healthcare, USA) allowed us to identify a range of proteins affected in abundance in response to Mn treatment and leaf age (Fig. 9). Close-ups of gel regions containing proteins differing in abundance and alignments of peptide sequences are given in Supplemenatry Data Figs S4–S7 and Tables S1–S4, respectively.
Fig. 9.
Representative Coomassie-stained 2D IEF/SDS–PAGE resolution of the proteome of the older fourth (top) and the younger sixth (bottom) rice leaf blades after elevated Mn supply (50 µm) for 3 d (right) or continuous 1 µm Mn supply (left). Three biological replications of each treatment were analysed using the Imagemaster™ 2D PLATINUM Software 6·0. Significantly regulated (P < 0·05) protein spots (marked by arrows) were cut out and identified by nano LC-MS/MS.
Subsequent peptide sequencing of the identified proteins and BLAST search at the NCBI homepage identified the proteins listed in Table 1. All BLAST hits could be linked to the genus Oryza. In the Mn-treated older leaf, three proteins were significantly >2-fold more highly abundant compared with control plants: a putative inorganic pyrophosphatase, a probenazole-inducible protein (PBZ1) and a protein belonging to a universal stress protein (Usp) family. Younger leaves responded to elevated Mn supply with decreased abundance of a chloroplast translational elongation factor (Tu). The 50S ribosomal protein L11 completely disappeared at elevated Mn supply, indicating a change in protein synthesis. A comparison of older and younger leaves at optimum Mn supply revealed lower abundance of an enolase involved in cytosol-localized glycolysis. Two other proteins were >2-fold increased in abundance: an oxygen-evolving enhancer protein 1 (chloroplast precursor) and a ribonuclease T2 family protein.
Table 1.
Identity of selected proteins extracted from rice leaves, which differ significantly in abundance between different leaf ages and Mn treatments
| Protein no.* | Fold induction/reduction† | Coverage (%)‡ | Accession no.§ | Identity¶ |
|---|---|---|---|---|
| Fold induction/reduction in the comaprison of optimum and excess Mn- (50 µm) treated old (fourth) leaves | ||||
| 2 | 0·44 | 28·40 | BAD16832 | Chloroplast translational elongation factor Tu |
| 7 | Only present at 1 µm Mn | 29·90 | NP_001048798 | 50S ribosomal protein L11 |
| Fold induction/reduction in the comaprison of optimum and excess Mn (50 µm) treated young (sixth) leaves | ||||
| 5 | 2·25 | 34·40 | BAD16934 | Putative inorganic pyrophosphatase |
| 8 | 2·16 | 67·70 | NP_001066998 | Probenazole-inducible protein PBZ1 |
| 9 | 3·40 | 18·00 | NP_001054704 | Universal stress protein (Usp) family protein |
| Fold induction/reduction in the comparison of old leaves (fourth) and young (sixth) leaves of plants treated with optimum Mn supply continiously | ||||
| 1 | 0·49 | 48·40 | Q42971 | Enolase (2-phosphoglycerate dehydratase) |
| 4 | 2·21 | 33·90 | NP_001043134 | Oxygen-evolving enhancer protein 1, chloroplast precursor |
| 6 | 2·07 | 40·10 | NP_001063793 | Ribonuclease T2 family protein |
| Fold induction/reduction in the comparison of old leaves (fourth) and young (sixth) leaves of plants treated with excess Mn supply for 4 d | ||||
| 3 | 0·47 | 43·70 | NP_001047479 | Adenosine 5′- phosphotransferase 2 |
| 7 | Only present in sixth leaf | 36·20 | NP_001048798 | 50S ribosomal protein L11 |
| 8 | 2·64 | 66·50 | NP_001066998 | Probenazole-inducible protein PBZ1 |
| 10 | 2·51 | 14·20 | NP_001058899 | 40S ribosomal protein S12 |
| 11 | 0·47 | 33·10 | A2YQD9 | Ferredoxin-1, chloroplast precursor (Ferredoxin I) (anti-disease protein 1) |
| 12 | 2·31 | 19·30 | P56724 | 60S acidic ribosomal protein P3 (P1/P2-like) |
| 13 | 3·06 | 14·80 | NP_001043653 | Ribosomal protein L31 family protein |
* Numbers of spots corresponding to Fig. 9.
† Regulation of spots between compared populations of gels based on mean relative spot volume.
‡ Sequence coverage of the identified proteins with the corresponding NCBI database hit.
§ Accession number of the identified protein in the NCBI database.
¶ Identity of the protein.
Independently of the occurrence of toxicity symptoms, the greatest number of Mn treatment-affected proteins (seven) have been identified when young and old leaves of Mn-treated plants were compared. An adenosine 5′-phosphotransferase 2 and a ferredoxin-1 (chloroplast precursor) were of significantly decreased abundance in younger leaves, whereas four ribosomal proteins [50S ribosomal protein L11, 40S ribosomal protein S12, 60S acidic ribosomal protein P3 (P1/P2-like) and ribosomal protein L31 family protein] and again the probenazole-inducible protein PBZ1 were of higher abundance in the younger leaves or even only appeared in these leaves.
DISCUSSION
Expression of Mn toxicity in leaves of barley compared with rice
Fecht-Christoffers et al. (2006, 2007) and Führs et al. (2009) described a possible interplay in the leaf apoplast of (a) class III PODs producing and consuming H2O2; (b) increased Mn concentrations; and (c) specific phenols finally leading to the typical toxicity symptoms, namely brown spots. The density of these brown spots was indicative of the severity of Mn toxicity (Horst, 1980; Fecht-Christoffers et al., 2003a, b). The results presented here suggest that in barley, Mn toxicity is expressed in a similar way. The high Mn sensitivity of barley (Vlamis and Williams, 1962) is confirmed, since bulk leaf Mn concentrations (Fig. 1A) as low as 2 µmol g−1 d. wt and Mn concentrations in the AWF (Fig. 1C) of 20 nmol mL−1 AWF led to typical Mn toxicity symptoms and enhanced POD activities (Figs 3 and 4A, C). In contrast, Mn concentrations in the bulk leaf (Fig. 1B) and the AWF (Fig. 1D) of rice as high as 100 µmol g−1 d. wt and 300 nmol mL−1 AWF, respectively, did not produce any Mn toxicity symptoms on older leaves. The POD activities (Fig. 4B, D), which are lower by a factor of about 100 in the rice leaf AWF compared with barley, support the view of a central role for these peroxidases in the apoplastic expression of Mn toxicity (Horst et al., 1999; Führs et al., 2009).
From the data presented it cannot be excluded that at higher Mn leaf tissue concentrations than achieved here after 4 d of elevated Mn supply, Mn toxicity symptoms in the form of brown spots can also be induced in old rice leaves. This is suggested by a report of Wang et al. (2002) who used such symptoms for phenotyping of rice recombinant inbred lines (RILs) for Mn sensitivity. To our surprise, we only observed Mn toxicity symptoms in rice also in the form of brown spots on younger leaves (Fig. 2). The difference between our observations and those of Wang et al. could be due to the fact that we studied a particularly Mn-tolerant rice cultivar, whereas the appearance of brown spots on older leaves in the study of Wang et al. was characteristic of Mn-sensitive rice genotypes. The nature of the brown spots appearing on younger leaves of Mn-treated rice plants has not been clarified yet. The Mn-induced inhibition of chlorophyll synthesis in the young leaves (Fig. 5) may suggest that Mn-induced deficiencies of other (micro)-nutrients (Fe, Zn, Mg) may play a role (Foy et al., 1978; Marschner, 1995). Surprisingly, the suppressed chlorophyll production did not affect photosynthesis as characterized by gas exchange and leaf chlorophyll fluorescence either in old or in young leaves (not shown), indicating an intact photosynthetic apparatus. This was additionally confirmed by 2D BN/SDS–PAGE results of photosynthetic protein complexes (Fig. 6) which were, in contrast to results published for cowpea (Führs et al., 2008), not affected by elevated Mn supply.
Localization and binding of Mn in relation to Mn tolerance of rice leaves
Obviously, barley and rice differ in Mn uptake and response to high Mn supply (Figs 1–4). After confirming the decisive contribution of the apoplast and apoplastic PODs to the Mn sensitivity of barley (Fig. 3) consistent with results published for cowpea (see Introduction), we focused on rice in order to unravel Mn tolerance mechanisms.
It is generally accepted that high cytosolic Mn concentrations are toxic to plants (Wu et al., 2008). Hence, the particularly high Mn tolerance of rice leaf tissue requires the compartmentation of Mn in cellular compartments which are less sensitive to elevated Mn concentrations and/or sequestration and detoxification of Mn by ligands. To our knowledge, there is no information available in rice on the role of cation transporters/transport facilitors in relation to cellular Mn homeostasis/Mn tolerance such as for a range of other plant species (see Introduction). Studies on rice suggest that the chloroplasts could serve as Mn storage compartments contributing to its outstanding high Mn tolerance (Lidon et al., 2000; Lidon, 2001). Lidon and Teixeira (2000) reported a novel Mn protein induced by excess Mn in rice which is located in the thylakoids. This thylakoid membrane-associated protein showed an Mn : protein ratio of 1, had SOD activity and was, therefore, supposed to be involved in reducing oxidative damage caused by excess Mn directly or by reducing the negative impact on photosynthesis indirectly. Since the Mn-binding protein detected by the Lidon group was barely water soluble and supposed to be membrane intrinsic, we might not have detected it using the applied extraction techniques. Nevertheless, our proteomic studies of the water-soluble chloroplastic proteome revealed Mn-induced visual changes of at least seven proteins (Fig. 7). However, these changes were only detected in the younger leaves with lower Mn contents than older leaves (data not shown). Therefore, the proteomic changes in the younger leaves may reflect the observed decrease in chlorophyll content (Fig. 5) and thus represent a response to nutrient deficiency rather than Mn toxicity.
The bulk leaf Mn content was fractionated into a chloroplastic, water-soluble and residue fraction (Fig. 8). Since a hydrophilic chloroplast isolation procedure was applied, it cannot be excluded that part of the water-soluble Mn in the chloroplast was lost to the soluble fraction during the isolation, leading to an underestimation of the chloroplast fraction. At optimum Mn supply the chloroplastic fraction represented an important part of the total Mn content, especially in the young leaves (Fig. 8). With increasing Mn content of the leaf tissue at excess Mn supply, the contribution of the chloroplast Mn to the total leaf Mn content became negligible. Therefore, a role for the chloroplast as an Mn storage compartment contributing to Mn tolerance as proposed by Lidon (2000) appears unlikely.
The dominating role of the residue fraction particularly at elevated Mn supply rather suggests that the cell wall as a major component of this fraction might play a decisive role in the detoxification of Mn. In this respect it is reasonable to assume that Si may play a major role in detoxification of Mn in the cell walls for two reasons. (1) Rice is an Si accumulator plant species (Ma and Yamaji, 2006; Ma et al., 2006) and Si in the leaves is deposited in the cell walls (Ma and Yamaji, 2008). (2) It has been shown in cucumber (Rogalla and Römheld, 2002) and cowpea (Iwasaki et al, 2002a, b) that Si increases the Mn binding capacity of cell walls, thus enhancing Mn tolerance. However, under the present experimental conditions, Si (apart from unavoidable contaminations) was not supplied to the nutrient solution, leading to rather low Si concentrations in the rice leaves (<0·2 % dry matter concentration; data not shown). Nevertheless, the Mn tolerance of these rice plants was very high, suggesting that not Si but rather other cell wall characteristics were (additionally) decisive for the observed high Mn tolerance.
Mn-induced changes in the total water-soluble leaf proteome of rice
Among the changes in the water-extractable chloroplastic proteome the total water-soluble proteome was also investigated not only between Mn treatments but also between leaf ages (Fig. 9, Table 1). In particular, primary metabolism was affected by elevated Mn supply. Significant effects on the abundance of proteins associated with translational processes were observed. While the expression of a chloroplast translational elongation factor Tu was decreased and 50S ribosomal protein L11 was not detectable in the fourth leaf treated with 50 µm Mn, the expression of ribosomal proteins (cytoplasmic and plastidal) was increased in the young leaf compared with the old leaf. It is known that Mn is able to displace magnesium (Mg) in some functions such as acting as a cofactor for enzymes in the tricarboxylic acid (TCA) cycle (Burnell, 1988) and for correct assembly of ribosomes (Cammarano et al., 1972). A substitution of Mg by Mn could, therefore, explain the changes in ribosomal subunit abundance. Since the younger leaf could be regarded as the more Mn-sensitive leaf, the observed changes in the protein biosynthesis system may be regarded more as a sensitivity- rather than a tolerance-conferring mechanism.
In the young leaf not only an increased abundance of a putative inorganic pyrophosphatase at high Mn compared with control plants, but also a higher abundance of an adenosine-detoxifying adenosine 5′-phosphotransferase 2 compared with the old leaf at high Mn was observed. Both enzymes require Mg as a cofactor (Anderson, 1977). Mg could be substituted by Mn at the expense of activity (Miller et al., 1979).
Increased Mn supply increased the abundance of general stress response proteins in the younger, more Mn-sensitive leaf. For instance, the expression of PBZ1 protein was doubled compared with the low Mn control, but was also up to 2·6 times higher than in the old leaf treated with 50 µm Mn (Table 1). This more general response was also described for other heavy metals (for further information, see Hajduch et al., 2001) and further supports the sensitivity of the young leaf.
The decreased expression of chloroplastic ferredoxin-1 precursor in the Mn-treated young leaf compared with the old leaf was probably caused by Mn-induced Fe defiency. Indeed, Bovy et al. (1993) observed a decrease of ferredoxin transcript abundance due to Fe deficiency in cyanobacteria, and Tognetti et al. (2007) showed that Fe deficiency-mediated reduction of ferredoxin can be partially substituted by flavodoxin overexpression. It is currently unclear whether all other described responses particularly in the younger leaf at elevated Mn supply also reflect Mn-induced Fe deficiency.
In conclusion, overall the results support the view that apoplastic PODs are involved in the expression of Mn toxicity as brown spots on old leaves. They also provide circumstantial evidence that high Mn tolerance, particularly of old rice leaves, involves a high Mn binding capacity of the cell walls. The physiological and proteomic studies suggest that Mn toxicity in less Mn-tolerant young leaves is related to displacement and thus impairment of the function of Mg and Fe. Future work aiming at elucidating the outstanding Mn leaf tolerance of rice requires a better understanding of the compartmentation of Mn at the cellular level and of the binding stage. The identification of a highly Mn-sensitive genotype appears to be a prerequisite for unravelling the molecular basis of Mn tolerance in rice.
SUPPLEMENTARY DATA
Supplementary Material
LITERATURE CITED
- Anderson JD. Adenylate metabolism of embryonic axes from deteriorated soybean seeds. Plant Physiology. 1977;59:610–614. doi: 10.1104/pp.59.4.610. [DOI] [PMC free article] [PubMed] [Google Scholar]
- Bergmeyer HU, Bernt E. Malate dehydrogenase. In: Bergmeyer HU, editor. Methoden der enzymatischen Analyse. Band I. Weinheim: Verlag Chemie; 1974. pp. 649–653. [Google Scholar]
- Bovy A, De Vrieze G, Lugones L, et al. Iron-dependent stability of the ferredoxin I transcripts from the cyanobacterial strains Synechococcus species PCC 7942 and Anabaena species PCC 7937. Molecular Microbiology. 1993;7:429–439. doi: 10.1111/j.1365-2958.1993.tb01134.x. [DOI] [PubMed] [Google Scholar]
- Bradford MM. A rapid and sensitive method for quantitation of microgram quantities of protein utilizing the principle of protein–dye binding. Analytical Biochemistry. 1976;72:248–254. doi: 10.1016/0003-2697(76)90527-3. [DOI] [PubMed] [Google Scholar]
- Burnell JN. The biochemistry of manganese in plants. In: Webb MJ, Nable RO, Graham RD, Hannam RJ, editors. Manganese in soil and plants. Dodrecht: Kluwer Academic Publishers; 1988. pp. 125–137. [Google Scholar]
- Cammarano P, Felsani A, Gentile M, Gualerzi C, Romeo C, Wolf G. Formation of active hybrid 80-S particles from subunits of pea seedlings and mammalian liver ribosomes. Biochimica et Biophysica Acta. 1972;281:625–642. doi: 10.1016/0005-2787(72)90160-8. [DOI] [PubMed] [Google Scholar]
- Delhaize E, Kataoka T, Hebb DM, White RG, Ryan PR. Genes encoding proteins of the cation diffusion facilitator family that confer manganese tolerance. The Plant Cell. 2003;15:1131–1142. doi: 10.1105/tpc.009134. [DOI] [PMC free article] [PubMed] [Google Scholar]
- Delhaize E, Ryan PR, Hebb DM, Yamamoto Y, Sasaki T, Matsumoto H. Engineering high-level aluminum tolerance in barley with the ALMT1 gene. Proceedings of the National Academy of Sciences, USA. 2004;101:15249–15254. doi: 10.1073/pnas.0406258101. [DOI] [PMC free article] [PubMed] [Google Scholar]
- Delhaize E, Gruber BD, Pittman JK, et al. A role for the AtMTP11 gene of Arabidospsis in manganese transport and tolerance. The Plant Journal. 2007;51:198–210. doi: 10.1111/j.1365-313X.2007.03138.x. [DOI] [PubMed] [Google Scholar]
- Demirevska-Kepova K, Simova-Stoilova L, Stoyanova Z, Hölzer R, Feller U. Biochemical changes in barley plants after excessive supply of copper and manganese. Environmental and Experimental Botany. 2004;52:253–266. [Google Scholar]
- Dou C-M, Fu X-P, Chen X-C, Shi J-Y, Chen Y-X. Accumulation and detoxification of manganese in hyperaccumulator Phytolacca americana. Plant Biology. 2009;11:664–670. doi: 10.1111/j.1438-8677.2008.00163.x. [DOI] [PubMed] [Google Scholar]
- Fecht-Christoffers MM, Maier P, Horst WJ. Apoplastic peroxidases and ascorbate are involved in manganese toxicity and tolerance of Vigna unguiculata. Physiologia Plantarum. 2003a;117:237–244. [Google Scholar]
- Fecht-Christoffers MM, Braun H-P, Lemaitre-Guillier C, VanDorsselaer A, Horst WJ. Effect of manganese toxicity on the proteome of the leaf apoplast in cowpea. Plant Physiology. 2003b;133:1935–1946. doi: 10.1104/pp.103.029215. [DOI] [PMC free article] [PubMed] [Google Scholar]
- Fecht-Christoffers MM, Führs H, Braun H-P, Horst WJ. The role of hydrogen peroxide-producing and hydrogen peroxide-consuming peroxidases in the leaf apoplast of cowpea in manganese tolerance. Plant Physiology. 2006;140:1451–1463. doi: 10.1104/pp.105.070474. [DOI] [PMC free article] [PubMed] [Google Scholar]
- Fecht-Christoffers MM, Maier P, Iwasaki K, Braun H-P, Horst WJ. The role of the leaf apoplast in manganese toxicity and tolerance in cowpea (Vigna unguiculata L., Walp) In: Sattelmacher B, Horst WJ, editors. The apoplast of higher plants: compartment of storage, transport, and reactions. Dordrecht, The Netherlands: Springer; 2007. pp. 307–322. [Google Scholar]
- Fernando DR, Batianoff GN, Baker AJ, Woodrow IE. In vivo localization of manganese in the hyperaccumulator Gossia bidwillii (Benth.) N. Snow & Guymer (Myrtaceae) by cryo-SEM/EDAX. Plant, Cell and Environment. 2006;29:1012–1020. doi: 10.1111/j.1365-3040.2006.01498.x. [DOI] [PubMed] [Google Scholar]
- Foy CD. Physiological effects of hydrogen, aluminium, and manganese toxicities in acid soils. In: Adams F, editor. Soil acidity and liming. Madison, WI: ASA-CSSSA; 1984. pp. 57–97. Agron Monograph 12. [Google Scholar]
- Foy CD, Chaney RL, White MC. The physiology of metal toxicity in plants. Annual Review of Plant Physiology. 1978;29:511–567. [Google Scholar]
- Führs H, Hartwig M, Molina LEB, et al. Early manganese-toxicity response in Vigna unguiculata L. – a proteomic and transcriptomic study. Proteomics. 2008;8:149–159. doi: 10.1002/pmic.200700478. [DOI] [PubMed] [Google Scholar]
- Führs H, Götze S, Specht A, et al. Characterization of leaf apoplastic peroxidases and metabolites in Vigna unguiculata in response to toxic manganese supply and silicon. Journal of Experimental Botany. 2009;60:1663–1678. doi: 10.1093/jxb/erp034. [DOI] [PMC free article] [PubMed] [Google Scholar]
- Hajduch M, Randeep R, Ganesh KA, Masami Y, Pretova A. High-resolution two-dimensional electrophoresis separation of proteins from metal-stressed rice (Oryza sativa L.) leaves: drastic reductions/fragmentation of ribulose-1,5-bisphosphate carboxylase/oxygenase and induction of stress related proteins. Electrophoresis. 2001;22:2824–2831. doi: 10.1002/1522-2683(200108)22:13<2824::AID-ELPS2824>3.0.CO;2-C. [DOI] [PubMed] [Google Scholar]
- Heenan DP, Carter OG. Tolerance of soybean cultivars to manganese toxicity. Agronomy Journal. 1976;16:389–391. [Google Scholar]
- Heinemeyer J, Eubel H, Wehmhöner D, Jänsch L, Braun HP. Proteomic approach to characterize the supramolecular organization of photosystems in higher plants. Phytochemistry. 2004;65:1683–1692. doi: 10.1016/j.phytochem.2004.04.022. [DOI] [PubMed] [Google Scholar]
- Heukeshoven J, Dernick R. Improved silver staining procedure for fast staining in PhastSystem Development Unit. I. Staining of sodium dodecyl sulfate gels. Electrophoresis. 1988;9:28–32. doi: 10.1002/elps.1150090106. [DOI] [PubMed] [Google Scholar]
- Hirschi KD, Korenkov VD, Wilganowski NL, Wagner GJ. Expression of Arabidopsis CAX2 in tobacco. Altered metal accumulation and increased manganese tolerance. Plant Physiology. 2000;124:125–133. doi: 10.1104/pp.124.1.125. [DOI] [PMC free article] [PubMed] [Google Scholar]
- Horst WJ. Genotypische Unterschiede in der Mangan-Toleranz von Cowpea (Vigna unguiculata) Angewandte Botanik. 1980;54:377–392. [Google Scholar]
- Horst WJ. Quick screening of cowpeas genotypes for manganese tolerance during vegetative and reproductive growth. Zeitschrift für Pflanzenernährung und Bodenkunde. 1982;145:423–435. [Google Scholar]
- Horst WJ, Fecht M, Naumann A, Wissemeier AH, Maier P. Physiology of manganese toxicity and tolerance in Vigna unguiculata (L.) Walp. Journal of Plant Nutrition and Soil Science. 1999;162:263–274. [Google Scholar]
- Hurkman WJ, Tanaka CK. Solubilization of plant membrane proteins for analysis by two-dimensional gel electrophoresis. Plant Physiology. 1986;81:802–806. doi: 10.1104/pp.81.3.802. [DOI] [PMC free article] [PubMed] [Google Scholar]
- Iwasaki K, Maier P, Fecht M, Horst WJ. Effects of silicon supply on apoplastic manganese concentrations in leaves and their relation to manganese tolerance in cowpea (Vigna unguiculata (L.) Walp.) Plant and Soil. 2002a;238:281–288. [Google Scholar]
- Iwasaki K, Maier P, Fecht M, Horst WJ. Leaf apoplastic silicon enhances manganese tolerance of cowpea (Vigna unguiculata) Journal of Plant Physiology. 2002b;159:167–173. [Google Scholar]
- Kirk GJD. Rice root properties for internal aeration and efficient nutrient acquisition in submerged soil. New Phytologist. 2003;159:185–194. doi: 10.1046/j.1469-8137.2003.00793.x. [DOI] [PubMed] [Google Scholar]
- Li X, Chanroj S, Wu Z, Romanowsky SM, Harper JF, Sze H. A distinct endosomal Ca2+/Mn2+ pump affects root growth through the secretory process. Plant Physiology. 2008;147:1675–1689. doi: 10.1104/pp.108.119909. [DOI] [PMC free article] [PubMed] [Google Scholar]
- Lidon FC. Tolerance of rice to excess manganese in the early stages of vegetative growth. Characterization of manganese accumulation. Journal of Plant Physiology. 2001;158:1341–1348. [Google Scholar]
- Lidon FC, Teixeira MG. Rice tolerance to excess Mn: implications in the chloroplast lamellae and synthesis of a novel Mn protein. Plant Physiology and Biochemistry. 2000;38:969–978. [Google Scholar]
- Lidon FC, Barreiro MG, Ramalho JC. Manganese accumulation in rice: implications for photosynthetic functioning. Journal of Plant Physiology. 2004;161:1235–1244. doi: 10.1016/j.jplph.2004.02.003. [DOI] [PubMed] [Google Scholar]
- Ma JF, Yamaji N. Silicon uptake and accumulation in higher plants. Trends in Plant Science. 2006;11:392–397. doi: 10.1016/j.tplants.2006.06.007. [DOI] [PubMed] [Google Scholar]
- Ma JF, Yamaji N. Functions and transport of silicon in plants. Cellular and Molecular Life Sciences. 2008;65:3049–3057. doi: 10.1007/s00018-008-7580-x. [DOI] [PMC free article] [PubMed] [Google Scholar]
- Ma JF, Tamai K, Yamaji N, et al. A silicon transporter in rice. Nature. 2006;440:688–691. doi: 10.1038/nature04590. [DOI] [PubMed] [Google Scholar]
- Mansfeldt T. Redox potential of bulk soil and soil solution concentration of nitrate, manganese, iron, and sulfate in two Gleysols. Journal of Plant Nutrition and Soil Science. 2004;167:7–16. [Google Scholar]
- Marschner H. Mineral nutrition in higher plants. 2nd edn. London: Academic Press; 1995. [Google Scholar]
- Miller RL, Adamczyk DL, Miller WH. Adenosine kinase from rabbit liver I. Purification by affinity chromatography and properties. Journal of Biological Chemistry. 1979;254:2339–2345. [PubMed] [Google Scholar]
- Nelson LE. Tolerances of 20 rice cultivars to excess Al and Mn. Agronomy Journal. 1983;75:134–138. [Google Scholar]
- Neuhoff V, Stamm R, Eibl H. Clear background and highly sensitive protein staining with Coomassie Blue dyes in polyacrylamide gels: a systematic analysis. Electrophoresis. 1985;6:427–448. [Google Scholar]
- Neuhoff V, Stamm R, Pardowitz I, Arold N, Ehrhardt W, Taube D. Essential problems in quantification of proteins following colloidal staining with Coomassie Brilliant Blue dyes in polyacrylamide gels, and their solution. Electrophoresis. 1990;11:101–117. doi: 10.1002/elps.1150110202. [DOI] [PubMed] [Google Scholar]
- Peiter E, Montanini B, Gobert A, et al. A secretory pathway-localized cation diffusion facilitator confers plant manganese tolerance. Proceedings of the National Academy of Sciences, USA. 2007;104:8532–8537. doi: 10.1073/pnas.0609507104. [DOI] [PMC free article] [PubMed] [Google Scholar]
- Pittman JK. Managing the manganese: molecular mechanisms of manganese transport and homeostasis. New Phytologist. 2005;167:733–742. doi: 10.1111/j.1469-8137.2005.01453.x. [DOI] [PubMed] [Google Scholar]
- Rogalla H, Römheld V. Role of leaf apoplast in silicon-mediated manganese tolerance of Cucumis sativus L. Plant, Cell and Environment. 2002;25:549–555. [Google Scholar]
- Saeed AI, Sharov V, White J, et al. TM4: a free, open-source system for microarray data management and analysis. Biotechniques. 2003;34:374–378. doi: 10.2144/03342mt01. [DOI] [PubMed] [Google Scholar]
- Schaaf G, Catoni E, Fitz M, et al. A putative role for vacuolar calcium/manganese proton antiporter AtCAX2 in heavy metal detoxification. Plant Biology. 2002;2:612–618. [Google Scholar]
- Schlichting E, Sparrow LA. Distribution and amelioration of manganese toxic soils. In: Graham RD, Hannam RJ, Uren NC, editors. Manganese in soils and plants. Dordrecht: Kluwer Academic Publishers; 1988. pp. 277–292. [Google Scholar]
- Schulte auf'm Erley G, Wijaya KA, Ulas A, Becker F, Wiesler F, Horst WJ. Leaf senescence and N uptake parameters as selection traits for nitrogen efficiency of oilseed rape cultivars. Physiologia Plantarum. 2007;130:519–531. [Google Scholar]
- Tanaka N, Fujita M, Handa H, et al. Proteomics of the rice cell: systematic identification of the protein populations in subcellular compartments. Molecular Genetics and Genomics. 2004;271:566–576. doi: 10.1007/s00438-004-1002-z. [DOI] [PubMed] [Google Scholar]
- Tognetti VB, Zurbriggen MD, Morandi EN, et al. Enhanced plant tolerance to iron starvation by functional substitution of chloroplast ferredoxin with a bacterial flavodoxin. Proceedings of the National Academy of Sciences, USA. 2007;104:11495–11500. doi: 10.1073/pnas.0704553104. [DOI] [PMC free article] [PubMed] [Google Scholar]
- Vlamis J, Williams DE. Ion competition in manganese uptake by barley plants. Plant Physiology. 1962;37:650–655. doi: 10.1104/pp.37.5.650. [DOI] [PMC free article] [PubMed] [Google Scholar]
- Vlamis J, Williams DE. Iron and manganese relations in rice and barley. Plant and Soil. 1964;20:221–231. [Google Scholar]
- Wang J, Evangelou VP. Metal tolerance aspects of plant cell wall and vacuoles. In: Pessarakli M, editor. Handbook of plant and crop physiology. New York: Marcel Dekker; 1995. pp. 695–717. [Google Scholar]
- Wang YX, Wu P, Wu YR, Yan XL. Molecular marker analysis of manganese toxicity tolerance in rice under greenhouse conditions. Plant and Soil. 2002;238:227–233. [Google Scholar]
- Wissemeier AH, Horst WJ. Effect of light intensity on manganese toxicity symptoms and callose formation in cowpea (Vigna unguiculata (L.) Walp.) Plant and Soil. 1992;143:299–309. [Google Scholar]
- Wu Z, Liang F, Hong B, et al. An endoplasmatic reticulum-bound Ca2+/Mn2+ pump, ECA1, supports plant growth and confers tolerance to Mn2+ stress. Plant Physiology. 2002;130:128–137. doi: 10.1104/pp.004440. [DOI] [PMC free article] [PubMed] [Google Scholar]
- Zhang X, Zhang F, Mao D. Effect of iron plaque outside roots on nutrient uptake by rice (Oryza sativa L.). Zinc uptake by Fe-deficient rice. Plant and Soil. 1998;202:33–39. [Google Scholar]
Associated Data
This section collects any data citations, data availability statements, or supplementary materials included in this article.


