

Abstract
Methicillin resistant Staphylococcus aureus (MRSA) is a major health problem that has created a pressing need for new antibiotics. Compounds that inhibit the S. aureus SrtA sortase may function as potent anti-infective agents as this enzyme attaches virulence factors to the cell wall. Using high-throughput screening, we have identified several compounds that inhibit the enzymatic activity of the SrtA. A structure– activity relationship (SAR) analysis led to the identification of several pyridazinone and pyrazolethione analogs that inhibit SrtA with IC50 values in the sub-micromolar range. Many of these molecules also inhibit the sortase enzyme from Bacillus anthracis suggesting that they may be generalized sortase inhibitors.
Keywords: Antibiotic, Staphylococcus aureus, Sortase, SrtA, Inhibitor
1. Introduction
The rise of community- and hospital-acquired methicillin resistant Staphylococcus aureus (MRSA) is a major health problem that has created a pressing need for new antibiotics.1 More than 90,000 Americans acquire potentially deadly MRSA infections each year, which annually are estimated to kill more people than AIDS in the United States.2 Proteins displayed on the surface of S. aureus play key roles in the infection process as they promote bacterial adhesion to host cells and tissue, acquire essential nutrients, and circumvent the immune response.3 Most surface proteins in S. aureus are attached to the cell wall by the sortase A (SrtA) enzyme.4–8 SrtA is located on the extracellular surface and catalyzes a transpeptidation reaction that joins an LPXTG sorting signal within the surface protein precursor to the cell wall precursor molecule lipid-II [undecaprenyl-pyrophosphate-MurNAc(-l-Ala-d-iGln-l-Lys (NH2–Gly5)-d-Ala-d-Ala)-β1–4-GlcNAc)].7–10 The lipid-II linked protein product is then incorporated into the cell wall by the trans-glycosylation and transpeptidation reactions of cell wall synthesis.11–13 Small molecules that inhibit the SrtA transpeptidation reaction may be powerful anti-infective agents as srtA− strains of S. aureus fail to display many virulence factors and exhibit reduced virulence.14–24 SrtA inhibitors may also be useful in treating infections caused by other Gram-positive pathogens, since many also use related enzymes to attach virulence factors to the cell wall and to assemble pili that promote bacterial adhesion.25,26 Sortases can be classified into five distinct families based on their primary sequence.27 Enzymes most closely related to the S. aureus SrtA protein appear to be the best candidates for inhibitor development as their elimination in other bacterial pathogens attenuates virulence (e.g., Listeria monocytogenes, Streptococcus pyogenes, and Streptococcus pneumoniae (reviewed in Refs. 28,29)). Finally, SrtA is not required for the growth of S. aureus in cell cultures. Therefore, anti-infective agents that work by inhibiting SrtA could have a distinct advantage over conventional antibiotics as they may be less likely to induce selective pressure that leads to drug resistance.7,30
A number of different strategies have been employed to search for sortase inhibitors (reviewed in Refs. 28,29,31). These include screening natural products32–38 and small compound libraries,39 as well as synthesizing rationally designed peptidomimetics and small molecules.40–44 Recently, mechanism-based aryl (β-amino)ethyl ketone (AAEK) inhibitors have been reported.39 AAEK molecules are specifically activated by sortase via a β-elimination reaction that generates an olefin intermediate that covalently modifies the active site cysteine thiol group.39 However, these compounds only inhibit SrtA with an IC50 of ~5–50 µM.39 Other reported compounds also need to be optimized further to be therapeutically useful as they either have limited potency, undesirable physicochemical features (e.g., high molecular weights) or inactivate the enzyme slowly.28,29,39
To identify potent inhibitors of SrtA we performed high-throughput screening (HTS) of a ~30,000 compound library, which led to the identification of three promising small molecule inhibitors that can potentially be developed into anti-infective agents. A structure–activity relationship (SAR) analysis revealed several pyridazinone and pyrazolethione analogs that inhibit SrtA with IC50 values in the sub-micromolar. These compounds are more potent than any previously described natural or synthetic inhibitor, and thus are excellent molecules for further development.
2. Results
2.1. High-throughput screening identifies several SrtA inhibitors
In order to screen for small molecule inhibitors of SrtA we modified a fluorescence resonance energy transfer (FRET) assay that monitors the SrtA-catalyzed hydrolysis of an internally quenched fluorescent substrate analog (o-aminobenzoyl (Abz)-LPETG-diaminopropionic acid-dinitrophenyl-NH2 (Dap(Dnp)). The assay was miniaturized to enable its use in high-throughput screening (HTS). A typical progress curve is shown in Figure 1A. The calculated Z′ score (a statistical measure of the assay’s robustness) is 0.75, which indicates that the assay can be effectively used for screening.45 The DiverSet library (ChemBridge Corp.) was screened for inhibitors of SrtA (see Section 4). Two criteria were used to calculate the inhibition percentage (% inhibition) of each compound in the library: (1) the initial velocity (νi) of product formation calculated from reaction progress curves, and (2) an end-point determination of product formation obtained by measuring the total product fluorescence five hours after initiating the reaction. Compounds in the library were first ranked by their end-point readings. This revealed a Gaussian distribution (Fig. 1B), such that molecules that exhibit >55% enzyme inhibition can be considered as hits with a 99.7% confidence limit (their % inhibition value is at least three standard deviation units above the mean).46 A total of 288 compounds met this criterion. The number of potential inhibitors was then further reduced by selecting only those molecules for which >80% inhibition was observed in the end-point analysis, as well as statistically significant inhibition when their νi values were considered (the νi value was less than or equal to 0 based on a 10 min progress curve). This reduced the total number of compounds to 44 (Fig. 1C). Their inhibitory activity was then confirmed by manually repeating the FRET assay and they were ranked based on their % inhibition as determined by the end-point analysis. From this set, 10 compounds were selected for further study because they had the highest inhibitory activity and because they had physicochemical properties similar to known drugs.47–52 For these inhibitors, the concentration that is required to reduce the activity of SrtA by 50% (IC50) was determined using well established methods.34,46,53 The most potent SrtA inhibitors from this group are shown in Figure 2 (compounds 1–3) and were chosen for further study.
Figure 1.

(A) FRET assay for measuring SrtA enzymatic activity. Three progress curves are overlaid and correspond to inhibitors with different potencies. (B) Histogram showing the distribution of 30,000 compounds in the ChemBridge library as a function of% inhibition of SrtA determined by an end-point analysis during the high-throughput screening campaign. (C) Venn diagram showing how the initial velocity (νi) and end-point analyses were used to identify 44 inhibitors of S. aureus SrtA. Lead compounds 1–3 were selected from these inhibitors and have the best physicochemical and inhibitory properties. The number of compounds in each population is shown in parentheses.
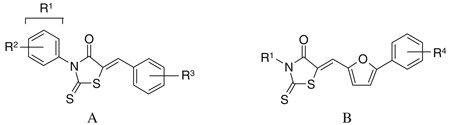
Figure 2.

Structures of the SrtA inhibitors identified by high-throughput screening. The IC50 value against S. aureus SrtA of each compound is indicated.
2.2. Analysis of the reversibility of inhibition of SrtA
For the three lead molecules, the reversibility of enzyme inhibition was determined by measuring the enzymatic activity of each enzyme–inhibitor complex immediately after it was rapidly diluted.46 In this study SrtA was first incubated with saturating concentrations of each compound (inhibitor concentrations 10-fold higher than the IC50 value). The SrtA–inhibitor complexes were then rapidly diluted and the enzyme activity immediately measured (data not shown). Inhibition by compound 1 is rapidly reversible as 84% of the enzyme activity is recovered after dilution. Compounds 2 and 3 also reversibly inhibit the enzyme, but more slowly; 50% and 58% activity is regained immediately after dilution, respectively. Mass spectrometry was also employed to confirm that the molecules form a reversible complex with the enzyme (described in Section 4). In this study, the mass spectrum of each saturated SrtA–inhibitor complex was recorded 1, 48, or 96 h after forming the complex. Mass spectra of these enzyme–inhibitor complexes showed no difference from the negative control (SrtA alone), suggesting that the inhibitors do not stably modify the enzyme (data not shown). Detailed studies on inhibitory reversibility of the lead compounds and their derivatives are also being conducted in our laboratory and will be reported elsewhere.
2.3. Structure–activity relationship (SAR) analysis
An SAR analysis of the three lead compounds was performed to identify related molecules with increased potency. Initially, we purchased closely related analogs of the lead compounds from the ChemBridge Corp. and determined their IC50 values against S. aureus SrtA. The analogs were identified through search of the company’s database and share 75–95% similarity (based on the chemical functionality and scaffolding as determined by the company’s similarity search engine) with one of the three lead compounds. A total of 7, 9, and 21 analogs of lead compounds 1, 2, and 3 were purchased and tested, respectively. This work enabled regions of the chemical scaffold required for inhibition to be coarsely defined. Analogs of the rhodanine 1 and pyridazinone 2 were then synthesized to make more subtle changes to discover molecules with even higher potency or better physicochemical properties. Eight analogs of 1 (compounds 1–8 to 1–13) and a total of 41 analogs of 2 were produced and tested (compounds 2–10 to 2–50). Tables 1–3 show the structures of all of the compounds that were tested and their IC50 numbers. To gain insights into their selectivity, for several of the compounds we also measured their IC50 values against the Bacillus anthracis sortase enzyme (BaSrtA). A discussion of this data is presented below.
Table 1.
SrtA inhibition of the rhodanine lead compound (series 1) and its derivatives from ChemBridge (scaffold A) as well as synthesized derivatives (scaffold B)
 | |||||||
|---|---|---|---|---|---|---|---|
| Compound | Scaffold | R1 | R2 | R3 | R4 | IC50 (µM) |
|
| SA SrtA | BA SrtA | ||||||
| 1 (lead) | A | −Ph | 2,4-Me2 | 3-Br, 2-OH, 5-NO2 | 3.7 ± 0.1 | ||
| 1–1 | A | −Ph | 3-Cl | 3-Br, 2-OH, 5-NO2 | 17 ± 6 | ||
| 1–2 | A | −Ph | 3-Me | 3-Br, 2-OH, 5-NO2 | 15 ± 4 | ||
| 1–3 | A | −Ph | 4-NO2 | 3-Br, 2-OH, 5-NO2 | 12 ± 3 | 20 ± 1.6 | |
| 1–4 | A | −Ph | 2,4-Me2 | 3-Br, 4-OH, 5-NO2 | 35 ± 11 | ||
| 1–5 | A | −Ph | 3-Cl | 4-Me, 3-NO2 | >1000 | ||
| 1–6 | A | −Ph | 2,4-Me2 | 3-NO2 | 119 ± 30 | ||
| 1–7 | A | −Me | 3-Br, 2-OH, 5-NO2 | 14 ± 4 | 13 ± 1.8 | ||
| 1–8 | B | −Me | −H | 405 ± 69 | |||
| 1–9 | B | −Pr | −H | 186 ± 22 | 53 ± 34 | ||
| 1–10 | B | −CH2Ph | −H | 492 ± 129 | |||
| 1–11 | B | −Et | 3-Cl | 109 ± 10 | |||
| 1–12 | B | −Et | 2-NO2 | 104 ± 10 | 74 ± 58 | ||
| 1–13 | B | −Allyl | −H | 199 ± 23 | 27 ± 9 | ||
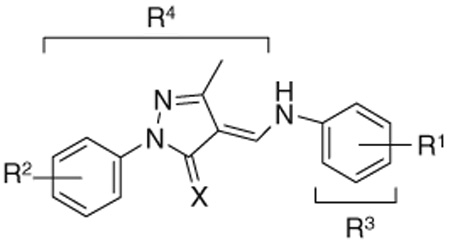
Table 3.
SrtA inhibition of the pyrazolethione lead compound (series 3) and its derivatives from ChemBridge
 | |||||
|---|---|---|---|---|---|
| Compound | X | R1 | R2 | IC50 (µM)a |
|
| SA SrtA | BA SrtA | ||||
| 3 (lead) | S | 4-NO2 | H | 5.2 ± 0.1 | |
| 3-1 | S | 4-Br | H | 39 ± 3.8 | |
| 3-2 | S | 2,4-(NO2)2 | H | 6.8 ± 0.3 | |
| 3–3 | S | 2-Br,4-NO2 | H | 8.9 ± 0.3 | |
| 3–4 | S | 2-OH,4-NO2 | H | 9.6 ± 1.3 | |
| 3–5 | S | 2-OH,5-NO2 | H | 14 ± 1.1 | |
| 3–6 | S | 2,4-Me2 | H | 68 ± 12 | |
| 3–7 | S | 3,4-Me2 | H | 52 ± 9.6 | |
| 3–8 | S | 4-1 | H | 42 ± 8.4 | |
| 3–9 | S | 4-N=N–Ph | H | 9 ± 2 | 1.4 ± 0.2 |
| 3–10 | S | 2-C1 | H | 54 ± 16 | |
| 3–11 | S | 2-OH | H | 22 ± 6 | |
| 3–12 | S | 2,4,6-Br3 | H | 0.30 ± 0.04 | 1.7 ± 0.2 |
| 3–13 | O | 4-NO2 | H | 56 ± 0.2 | |
| 3–14 | O | 4-NO2 | 4-Me | 62 ± 9 | |
| 3–15 | O | 4-NO2 | 4-C1 | 48 ± 29 | |
| 3–16 | O | 2-Me,4-NO2 | 4-C1 | 45 ± 10 | |
| X | R3 | ||||
| 3–17 | S |  |
0.76 ± 0.03 | 1.4 ± 0.3 | |
| 3–18 | S | –Cyclohexyl | 115 ± 16 | ||
| R1 | R4 | ||||
| 3–19 | 4-NO2 |  |
17 ± 2 | ||
| 3–20 | 4-COMe |  |
26 ± 4 | ||
| 3–21 | 4-NO2 | 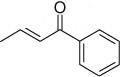 |
51 ± 6 | ||
or for values that are lower than 7.5 µM as determined by the Morrison’s equation.
2.3.1. Synthesis and SAR of the rhodanine compounds (series 1)
Two scaffolds of the rhodanine compounds were examined by SAR (Table 1). Compounds with scaffold A were purchased from ChemBridge Corp. (1 to 1–8), while compounds with scaffold B were synthesized in our laboratory (1–8 to 1–13). The synthesis of these compounds followed literature precedence, namely reaction of the N-alkyl isothiocyanate with methyl thioglycolate gave the 3-alkyl-4-oxothiazolidine-2-thiones. Condensation of these with the 5-arylfurfuraldehydes gave the compounds 1–8 to 1–13 in good yields.54,55 In scaffold A, replacing the 2,4-dimethyl groups on the R2 position reduces the potency three–fivefold (compound 1 vs 1–1, 1–2, 1–3, 1–7). On the other hand, relocating the 2-OH group on the 3 position reduces the potency by 10-fold (compound 1 vs 1–4). These data suggest that these functional groups play a critical role in enzyme binding, presumably through hydrophobic interaction via the 2,4-dimethyl groups on the R2 position, and hydrogen bonding via the 2-OH group at the R3 position. The SAR results for compounds with scaffold B are in general agreement with this interpretation. Although these molecules retain the central rhodanine nucleus, they differ in the R1 group and replace the R3 group with a much larger 5-phenyl furan moiety. Similar to the results obtained for the scaffold A molecules, these variations result in molecules with significantly elevated IC50 values. The most dramatic difference can be seen by comparing compounds 1 and 1–10. Even though they are closely related on one side of the rhodanine ring (Ph vs CH2Ph on the R1 position), the other side is substantially different as compound 1–10 does not have the aforementioned 2-OH group. Taken together, none of the analogs of compound 1 showed improved activity against SrtA and were not pursued further.
2.3.2. Synthesis and SAR of the pyridazinone compounds (series 2)
Initial SAR studies of lead compound 2 made use of derivatives purchased from ChemBridge (compounds 2-1 to 2–9) (Table 2). This work revealed one of the most potent inhibitors of SrtA, compound 2-1 = 0.20 µM, where is the apparent dissociation constant for the enzyme–inhibitor complex, as determined by the Morrison’s equation)46 and its close analog 2–9 ( = 1.4 µM). This discovery led us to investigate variants of these compounds by synthesizing several analogs (2–10 to 2–50). These compounds were prepared by an adaptation of the literature route,56 namely heating a mixture of an arylhydrazine, mucochloric acid, and dilute HC1 afforded the 2-aryl-4,5-dichloropyridazin-3-ones 2–42 to 2–48 in good yields (85–95%). The less reactive 4-nitrophenyl-hydrazine required more forcing conditions, namely a toluene solution of the initial formed hydrazone cyclization toluene was heated at reflux for 10 h using a Dean–Stark to afford the analog 2–43 in 76% yield for the two steps. The regioselectivity of the addition of oxygen nucleophiles to 2–42 to 2–48 was dependent on the conditions: use of 1,4-dioxane as the solvent, with sodium ethoxide or methoxide, afforded cleanly the 4-alkoxy products 2–22 to 2–34 (83–95% yield) while the use of sodium hydroxide in ethanol afforded cleanly the 5-ethoxy analogs 2–35 to 2–41 (75–94% yield). The assignment of the regiochemistry of the products was based on the observation of a strong NOE enhancement of the methylene of the ethyl signal in the 5-ethoxy compounds with the C5 vinyl hydrogen, an NOE which was absent from the 4-alkoxy compounds. The displacement of the remaining chloride atom in either the 4- or 5-alkoxy compounds was uneventful although we found that the reaction worked best in DMF as solvent. In this way the analogs 2–10 to 2–16 and 2–18 to 2–21 were formed. The symmetrical disulfide dimer, 2–17, could be formed by direct air oxidation of the thiol 2–10. The other disulfides were prepared by the reaction of the thiol 2–10 with methyl methanethiosulfonate (MMTS) or Aldrichthiol (2-pyridyldisulfide) to give 2–49 and 2–50 in yields of 88% and 65%, respectively. Finally the symmetrical disulfide 2–17 could also be prepared in 85% yield by reaction of the thiol 2–10 with the pyridyl disulfide 2–50.
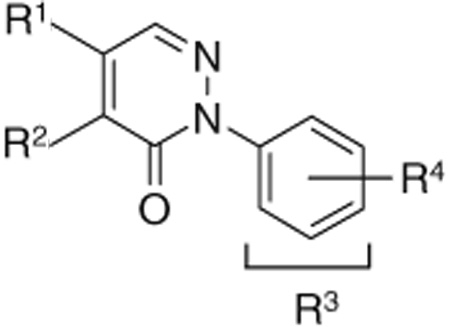
Table 2.
SrtA inhibition of the pyridazinone lead compound (series 2) and its derivatives from ChemBridge (compounds 2-1 to 2–9) as well as additionally synthesized derivatives (compounds 2–10 to 2–48)
 | ||||||
|---|---|---|---|---|---|---|
| Compound | R1 | R2 | R3 | R4 | IC50 (µM)a |
|
| SA SrtA | BA SrtA | |||||
| 2 (lead) | −SH | −OMe | −Ph | 3-C1 | 4.5 ± 0.3 | |
| ChemBridge | ||||||
| 2-1 | −SH | −OEt | −Ph | −H | 0.20 ± 0.06 | 1.4 ± 0.5 |
| 2–2 | −SMe | −OH | −Ph | −H | >50b | |
| 2–3 | −SMe | −OH | −Et | – | >50 | |
| 2–4 | −SMe | −Cl | −Ph | −H | >50 | |
| 2–5 | −OMe | −SH | −Ph | −H | 9.3 ± 0.6 | 1.8 ± 0.4 |
| 2–6 | −OH | −OCH2Ph | −Ph | −H | >50 | >50 |
| 2–7 | −OH | −OMe | −Ph | −H | >50 | >50 |
| 2–8 | −OH | −SEt | −Ph | −H | >50 | >50 |
| 2–9 | −SH | −SEt | −Ph | −H | 1.4 ± 0.7 | 0.3 ± 0.1 |
| Ethoxy-thiol | ||||||
| 2–10 | −SH | −OEt | −Ph | −H | 13 ± 1 | 3.2 ± 1.7 |
| 2–11 | −SH | −OEt | −Ph | 4-NO2 | 30 ± 3 | 6.7 ± 0.6 |
| 2–12 | −SH | −OEt | −Ph | 3-Br | >50 | |
| 2–13 | −SH | −OEt | −Ph | 3-F | 5.5 ± 1.3 | 1.8 ± 0.3 |
| 2–14 | −SH | −OEt | −Ph | 3-Me | 3.3 ± 0.7 | 1.7 ± 0.4 |
| 2–15 | −SH | −OEt | −Ph | 3,5-Cl2 | 301 ± 72 | 14 ± 4 |
| 2–16 | −SH | −OEt | −Cyclohexyl | 17.9 ± 1.6 | 1.4 ± 0.3 | |
| 2–17c | −SH | −OEt | −Ph | −H | 1.5 ± 0.4 | 1.2 ± 0.4 |
| 2–18 | −OEt | −SH | −Ph | −H | 4.4 ± 1.8 | 1.2 ± 0.5 |
| 2–19 | −OEt | −SH | −Ph | 3-F | 5.7 ± 1.0 | 0.9 ± 0.2 |
| 2–20 | −OEt | −SH | −Ph | 3-Me | 3.1 ± 0.7 | 0.4 ± 0.1 |
| 2–21 | −OEt | −SH | −Ph | 3,5-Cl2 | 166 ± 32 | 5.2 ± 0.9 |
| Methoxy-chloro | ||||||
| 2–22 | −Cl | −OMe | −Ph | −H | >50 | |
| 2–23 | −Cl | −OMe | −Ph | 3-Br | >50 | |
| 2–24 | −Cl | −OMe | −Ph | 3-F | >50 | |
| 2–25 | −Cl | −OMe | −Ph | 3-Me | >50 | |
| 2–26 | −Cl | −OMe | −Ph | 3,5-Cl2 | >50 | |
| 2–27 | −Cl | −OMe | −Cyclohexyl | >50 | ||
| Ethoxy-chloro | ||||||
| 2–28 | −Cl | −OEt | −Ph | −H | >50 | |
| 2–29 | −Cl | −OEt | −Ph | 4-NO2 | >50 | |
| 2–30 | −Cl | −OEt | −Ph | 3-Br | >50 | |
| 2–31 | −Cl | −OEt | −Ph | 3-F | >50 | |
| 2–32 | −Cl | −OEt | −Ph | 3-Me | >50 | |
| 2–33 | −Cl | −OEt | −Ph | 3,5-Cl2 | >50 | |
| 2–34 | −Cl | −OEt | −Cyclohexyl | >50 | ||
| 2–35 | −OEt | −Cl | −Ph | −H | 1.0 ± 0.3 | 0.3 ± 0.2 |
| 2–36 | −OEt | −Cl | −Ph | 4-NO2 | 219 ± 74 | 247 ± 45 |
| 2–37 | −OEt | −Cl | −Ph | 3-Br | >50 | |
| 2–38 | −OEt | −Cl | −Ph | 3-F | >50 | |
| 2–39 | −OEt | −Cl | −Ph | 3-Me | >50 | |
| 2–40 | −OEt | −Cl | −Ph | 3,5-Cl2 | >50 | |
| 2–41 | −OEt | −Cl | −Cyclohexyl | >50 | ||
| Dichloro | ||||||
| 2–42 | −Cl | −Cl | −Ph | −H | >50 | |
| 2–43 | −Cl | −Cl | −Ph | 4-NO2 | >50 | |
| 2–44 | −Cl | −Cl | −Ph | 3-Br | >50 | |
| 2–45 | −Cl | −Cl | −Ph | 3-F | >50 | |
| 2–46 | −Cl | −Cl | −Ph | 3-Me | >50 | |
| 2–47 | −Cl | −Cl | −Ph | 3,5-Cl2 | 61 ± 5 | 14 ± 4 |
| 2–48 | −Cl | −Cl | −Cyclohexyl | >50 | ||
The compounds have been segregated into four subclasses.
Or for values that are lower than 7.5 µM as determined by the Morrison’s equation.
Inhibitory effect less than 50% at 100 µM of inhibitor concentration.
Compound 2–17 is a disulfide dimer of 2–10.
Substituents on the pyridazinone ring (R1 and R2) were suspected to contribute greatly to the inhibitory activity, as replacing the –SH with –OH at the R1 position dramatically reduces potency (2 vs 2–7). Minor alteration of R2 (from –OMe to –OEt) and removal of 3-C1 on the phenyl ring (R4) also increase the potency more than 20-fold (compare 2 with 2-1). These observations suggest that the functional groups located on the pyridazinone ring may be as critical as those located on the phenyl ring. Therefore, we synthesized analogs with different substituents on the pyridazinone ring to optimize their potency further. Based on the substituent, these compounds are segregated into 4 subclasses: ethoxy-thiol (2–10 to 2–21); methoxy-chloro (2–22 to 2–27); ethoxy-chloro (2–28 to 2–41); and dichloro (2–42 to 2–48) pyridazinone compounds. Additionally, we also varied the R3 and R4 positions of each subclass in order to probe the importance of the phenyl ring. With the exception of compound 2–35, members of the ethoxy-thiol subclass are the most potent molecules. Within this series, switching the relative positioning of the R1 and R2 groups does not dramatically affect activity (compare 2–10 with 2–18, or 2–13 with 2–19, or 2–14 with 2–20). In contrast, varying the phenyl ring causes substantial changes in potency, with the lowest IC50 obtained when all substituents are eliminated or when only small substituents are present. Interestingly, replacing entire phenyl ring with a cyclohexyl group did not profoundly alter activity (2–10 vs 2–16). This suggests that this portion of the ethoxy-thiol molecules may form non-specific hydrophobic interactions with the enzyme, which can be disrupted with groups larger than a phenyl or cyclohexyl ring are present.
Because the ethoxy-thiol compounds all contain a thiol group that could potentially interact with the active site cysteine thiol of SrtA (residue Cys l84) we created a series of molecules that are disulfide variants (compounds 2–17 in Table 2, and 2–49, 2–50 in Fig. 3). Compound 2–17 is the symmetrical disulfide dimer of 2–10 and exhibits an approximately twofold increase in its potency. Interestingly, asymmetrical disulfide derivatives of 2–10 that contain methyl (2–49) or pyridyl (2–50) groups are even more potent and exhibit values of ~0.4 and 0.03 µM, respectively. In this series the pyridyl thiol is the best potential leaving group as it can be transformed into a stabilized pyridine-2-thione. As this derivative is the most potent inhibitor, this data suggest that these molecules may inhibit the enzyme through a thiol–disulfide exchange reaction involving Cysl84. However, the mechanism of inhibition by these molecules remains unclear as compound 2 reversibly inhibits SrtA and does not modify the enzyme based on mass spectrometry data (described above). Although the ethoxy-thiol subclass contains several potent SrtA inhibitors, 2–35 within the ethoxy-chloro subclass is nearly as potent with an IC50 value of ~1 µM. This molecule possesses a unique combination of substituents on the pyridazinone ring as it has –OEt and –Cl groups on the R1 and R2 position, respectively. Interestingly, the SAR inhibitory trend observed in the ethoxy-chloro and ethoxy-thiol subclasses differ markedly as variations at the R1 and R2 sites in the ethoxy-chloro subclass result in large reductions in potency that are not observed when similar modifications are made in the ethoxy-thiol subclass. This suggests that compound 2–35 may have a different inhibitory mechanism from the ethoxy-thiol subclass. The binding mode of each molecule was explored further using docking calculations and is discussed later in the text.
Figure 3.

Additional asymmetric disulfide derivatives synthesized for the pyridazinone series containing thiomethyl (2–49) or 2-thiopyridyl (2–50) groups. IC50 values against S. aureus SrtA are indicated.
2.3.3. SAR of the pyrazolethione compounds (series 3)
A series of pyrazolethione analogs of the lead compound 3 were obtained from ChemBridge through a similarity search. Inhibitory activities against SrtA were evaluated and are shown in Table 3. Initially, substituents on the R1 ring were varied while we kept the thione group on the pyrazole nucleus constant (compounds 3 to 3–12). This led to the discovery of the most potent compound in the 3-series, 3–12 ( = 0.3 µM). This molecule contains a bulky and lipophilic tribromophenyl substituent. Replacing the thione group with a ketone is detrimental (compare 3 with 3–13), while changing substituents on the R2 phenyl ring does not significantly restore potency (3–13 vs 3–14, 3–15, 3–16). We also examined the effect of varying the phenyl ring attached via the amide (R3 and R4). These results are obvious; replacement of the phenyl group (R3) with a more electron-withdrawing pyridyl group enhances the potency (compare 3 with 3–17), while a normal cyclohexyl group dramatically reduces the potency (3–18). Variation of the R4 group moderately influences inhibitory activity (3–19 to 3–21) with the reduction in potency by a factor of 3–10 compared to the lead, suggesting inhibition may prefer the pyrazolethione nucleus and the phenyl ring on the nitrogen.
2.4. The pyrazolethione and pyridazinone compounds also inhibit BaSrtA and minimally affect S. aureus growth
In cell culture, srtA− strains of S. aureus show no defects in their growth. This suggests that highly selective SrtA inhibitors will function as anti-infective agents that only prevent the bacterium from thriving within the human host, but otherwise do not impair growth outside of the host. SrtA inhibitors may therefore have advantages over conventional antibiotics that generate selective pressures that lead to their obsolescence. Using a microtiter broth dilution method57 for lead compounds 1–3, we determined the minimal inhibitory concentration (MIC) of each molecule that prevented S. aureus growth. This work revealed that lead compounds 2 and 3 only minimally impair bacterial growth as they have MIC values >1 mM. In contrast, the rhodanine lead compound 1 has an MIC value of ~10 µM, suggesting that it inactivates other reactions essential for bacterial viability. This finding is compatible with recent studies that have shown that rhodanine compounds inhibit class C β-lactamases in Gram-negative bacteria.58 Several arylalkylidene rhodanines have also been reported that have high bactericidal activity against non-resistant S. aureus and MRSA strains. These compounds exhibit MIC values lower than ampicillin and cefotaxime and it has been proposed that they non-competitively inhibit penicillin-binding proteins.59
The finding that compounds 2 and 3 do not affect bacterial growth is fortuitous, as nearly all of the potent SrtA inhibitors we identified in the SAR analysis are analogs of these molecules. In order to more rapidly ascertain SrtA inhibitory effects on microbial growth, we grew S. aureus cultures in the presence of 500 µM of each inhibitor and compared the rate of growth with control cultures grown in 2.5% DMSO (the solvent used to solubilize the inhibitors). This method enables an estimate of MIC to be obtained as molecules that do not affect bacterial growth can be assumed to have MIC values >1 mM. Consistent with the MIC data, compound 1 is toxic, while compounds 2 and 3 only modestly perturb growth (Fig. 4). An analysis of the growth data suggests that series 3 molecules are very promising anti-infective agents as four of its molecules inhibit SrtA with an IC50 or <5 µM, but otherwise do not substantially affect bacterial growth (compounds 3-1, 3–9, 3–12, and 3–17). Interestingly, the most potent SrtA inhibitor (compound 3–12) shows no detrimental effect to bacterial viability, highlighting its potential for further development as an anti-infective agent. Compounds in the 2-series show a variation of effects on S. aureus growth. The most promising candidates for further development are 2–9 and 2–20 as they inhibit SrtA with low micromolar IC50 values and do not significantly inhibit S. aureus growth in cell culture.
Figure 4.

Inhibition of S. aureus cell growth by the lead compounds and several potent inhibitor compounds identified in the SAR studies. Growth inhibition was measured using the microtiter broth dilution method. In this procedure 180 µL of the cell culture was plated into a 96-well plate and 20 µL of inhibitor solution was added to a final concentration of 500 µM. Growth was then monitored overnight at 37 °C using a temperature-controlled plate reader. The% growth inhibition is relative to cultures grown in the absence of inhibitor. Error bars are the standard deviation from three measurements.
The ability of several of the compounds to inhibit the sortase A protein from B. anthracis (BaSrtA) was tested to gain insights in their selectivity. This enzyme shares 27% amino acid sequence identity with S. aureus SrtA and also attaches proteins to the cell wall that contain an LPXTG sorting signal.60 In addition, BasrtA-knockout strains show defects in their ability to escape macrophages, suggesting that BaSrtA may be useful in treating anthrax.14 IC50 measurements against BaSrtA were made for the most potent S. aureus SrtA inhibitors. For the series 2 molecules, the S. aureus SrtA and BaSrtA enzymes show similar trends in their susceptibility. For example, molecules that poorly inhibit S. aureus SrtA also are ineffective against BaSrtA (compounds 2–6 to 2–8), while potent S. aureus SrtA inhibitors also effectively inhibit BaSrtA. Interestingly, compounds 2–9 and 2–20, which significantly impair S. aureus SrtA activity and are not bactericidal (Fig. 4), are even more potent BaSrtA inhibitors with values of ~0.3 and 0.4 µM, respectively. The most potent non-bacteriocidal 3-series compounds, 3–9 and 3–12, are also promising, as they inhibit BaSrtA with values of 1.4 and 1.7 µM, respectively. Combined these data suggest that the mechanism of enzyme inhibition by compounds 2–9, 2–20, 3–9, and 3–12 is conserved across species, and that they are unlikely to significantly alter microbial processes other than surface protein display.
2.5. Biostructural analysis
To gain insight into the mode of binding of the SrtA inhibitors, we modeled how they interacted with the S. aureus SrtA enzyme using an Induced-Fit Docking (IFD) protocol (Schrödinger Inc.).61–63 Compounds were docked into the recently determined solution structure of SrtA bound to a LPAT peptide.64 After removal of the peptide coordinates the remaining protein structure was prepared for docking using the Protein Preparation Wizard, and LigPrep was used to prepare the ligand compounds.63 The inhibitors were then docked into the SrtA receptor using a standard IFD workflow. Models of the SrtA–inhibitor complexes with the lowest negative IFD value were chosen to represent the final docking solution. When docked into the active site of SrtA, compound 1 inserts its hydrophobic moiety into the lipophilic pocket generated by the side chains of Ile199 in strand β8 and residues Val166 to Val168 in the adjacent β6/β7 loop (Fig. 5A). This may explain why altering the 2,4-Me2 groups at the R2 position reduces potency three–fivefold. On the rhodanine nucleus, the carbonyl oxygen is positioned toward the highly conserved side chain of Arg197, and its sulfide group is positioned toward His120. On the benzylidene ring, its 2-OH group is in close proximity to Trp194 and Tyr187 side chains, and its 5-NO2 group is oriented toward His120, suggesting a potential hydrogen bonding network. This could explain the observed dramatic reductions in inhibitory activity when functional groups on the benzylidene ring are relocated (Table 1, alterations to R3).
Figure 5.

Image showing the SrtA–inhibitor complexes generated by Induced-Fit Docking. Dock poses with the highest rank (lowest IFD score value) are shown. Compounds 1 (A), 2 (B), 2-1 (C), 2–35 (D), 3 (E), and 3–12 (F) were docked into the structure of S. aureus SrtA derived from the solution structure of the covalent complex between SrtA and the LPAT sorting signal analog.64 Ligand structures are shown in a ‘ball and stick’ format. The solvent accessible surface of SrtA is shown and colored to indicate the electrostatic properties from acidic (red) to basic (blue). The secondary structure of the protein is shown behind the surface and the important neighboring amino acids are labeled. The figures were created using the program pymol68
For pyridazinone compounds (series 2), most of them bind to the active site in a similar orientation such that the phenyl ring is buried in the aforementioned lipophilic pocket. This is evident by comparing the docking solutions of compounds 2 (Fig. 5B), 2-1 (Fig. 5C) and 2–35 (Fig. 5D). These models provide a plausible explanation for why compound 2-1 has a value ~40-fold lower than compound 2, since the chloro group on the ring of compound 2 would seem to create a steric hindrance within this lipophilic pocket. Analogous to the docking solution observed for compound 1 (Fig. 5A), the carbonyl oxygen atom on the pyridazinone ring in the docked complexes of 2, 2-1 and 2–35 are all positioned towards the conserved Arg197 side chain. In addition, the thiol group on both compounds 2 and 2-1 points towards His120, which may explain the significant reduction in activity when this group is replaced with a chloro group (compare ethoxy-thiol with ethoxy-chloro subclasses in Table 2). Interestingly, the docking solution of compound 2–35 suggests that it positions its ethoxy moiety toward another lipophilic region created by the side chains of Pro94 and Ala92 located in helix H1. This structural difference may explain the distinct SAR profiles observed within the ethoxy-chloro and ethoxy-thiol subclasses. The ethoxy-thiol subclass is more tolerant to alteration at this site, compatible with the docked solution that projects this group towards an open groove on the protein surface. In contrast, in the ethoxy-chloro series its juxtaposition against the helix H1 may make it less tolerant to alteration, which is compatible with our finding that only compound 2–35 within the ethoxy-chloro series has a low IC50 value (vide supra).
The docking calculations suggest that the elongated structure of the series 3 compounds may be advantageous as it may enable contacts to two hydrophobic pockets on the enzyme. One phenyl ring (R2) is in contact with the β6/β7 loop Val166-Val168 residues, while the other (R3) is closer to Trp194 and Pro94 side chains (Fig. 5E). Changing substituents on this R3 position from 4-NO2 to 2,4,6-Br3 (compound 3–12) improved the potency ~15-fold, indicating a preference for a more lipophilic moiety at this position. However, replacing the substituent with 2,4-Me2 or 3,4-Me2 reduced potency, suggesting shape complementarity may be critical for binding. The docking solutions also suggest why the pyrazole nucleus may be specific to the sortase active site as its methyl and thione groups contact two highly conserved residues, Ala92 and Arg197, respectively (Fig. 5F). This feature, along with their hydrophobic network, may be the reason why most of the compounds within this series exhibit high potency against SrtA enzymes, but little or no bactericidal activity.
3. Discussion
In this study we have identified several promising small molecules that reversibly inhibit the S. aureus SrtA sortase with values in the high nanomolar range, rhodanine, pyrazolethione, and pyridazinone compounds. SAR analysis has led to some of the most promising anti-infective agents thus far reported as compounds 2–9 and 3–12 inhibit the enzyme with values of 1.4 and 0.3 µM, respectively. Importantly, both of these molecules do not impair microbial growth in cell culture, suggesting that they selectively inhibit sortase. Molecules based on the pyridazinone framework are quite promising, and can reach values of ~0.20 µM, but in some cases were bactericidal. Intriguingly, the most potent inhibitors for S. aureus SrtA also inhibit BaSrtA, suggesting further that they are specific sortase inhibitors. Additional studies with more distantly related enzymes will be needed to define the degree of specificity.
The library screening also revealed several rhodanine related compounds that are potent SrtA inhibitors. However, analogs of the lead molecule did not show improved potency. The lead rhodanine compound was also shown to be bactericidal, suggesting it has polytrophic effects. This is consistent with recent studies showing rhodanine compounds inhibit class C β-lactamases in Gram-negative bacteria58 and penicillin-binding proteins in non-resistant S. aureus and MRSA strains.59
Overall, the biostructural analysis of the inhibitors is in reasonable agreement with the SAR results, and provides insights into the mode of action of each inhibitor from the docking poses. This agreement may in part be due to the use of the recently reported NMR structure of SrtA bound to a (2R,3S) 3-amino-4-mercapto-2-butanol analog of the sorting signal.64 The structure of the active site in this protein differs markedly from previously reported structures of the apo-form of the enzyme (PDB:1t2p)65 and may be more biological relevant. This assertion is substantiated by trial docking experiments using the apo-form of the enzyme that failed to yield results consistent with the SAR data. The structure of the enzyme in its substrate bound form may therefore be useful for virtual screening experiments. In summary, we have discovered potent S. aureus and B. anthracis SrtA sortase inhibitors that could be useful anti-infective agents. Future studies will define their inhibitory mechanism in detail and use structure-based approaches to discover compounds with even greater potency.
4. Experimental
4.1. Chemistry
Materials were obtained from commercial suppliers and were used without purification. All the moisture sensitive reactions were conducted under argon atmosphere using oven-dried glassware and standard syringe/septa techniques. Most of reactions were monitored with a silica gel TLC plate under UV light followed by visualization with a p-anisaldehyde or ninhydrin staining solution. Some reactions were monitored by a crude 1H NMR spectrum. 1H NMR spectra were measured at 400 MHz in CDCl3 unless stated otherwise and data were reported as follows in ppm (δ) from the internal standard (TMS, 0.0 ppm): chemical shift (multiplicity, integration, coupling constant in Hz). 2D–NMR experiments (NOESY, COSY, and TOCSY) at 500 MHz were performed to confirm the regioselectivity of the substitution reactions. Melting Points of solid compounds were observed on a Thomas Hoover capillary melting point apparatus. Infrared (IR) spectra were recorded on a Nicolet AVATAR 370 spectrometer using liquid films (neat) on NaCl plates. The purity of the new compounds was assessed by several methods: high-field proton and carbon NMR (lack of significant impurities), Rf values on TLC (lack of obvious impurities), melting point, and mass spectrometry.

4.1.1. General procedure for the synthesis of 2-substituted-4,5-dichloropyridazin-3-ones, for example, 2-phenyl-4,5-dichloro-pyridazin-3-one (2–42)
To a solution of phenyl-hydrazine (2.9 mL, 30 mmol) in diluted HCl (4 M, 60 mL) was added mucochloric acid (5 g, 30 mmol) at 25 °C The solution was refluxed for 3 h. The suspension was filtered and washed with water. The solids were dried under high vacuum to give 7 g of the yellowish white solid, 2–42, 94%. Mp 158 °C. 1H NMR 7.91 (1H, s), 7.57 (2H, m), 7.48 (2H, m), 7.42 (1H, m); 13C NMR 156.15, 140.86, 136.39, 136.14, 135.33, 128.95, 128.89, 125.17.
4.1.1.1. 2-(4-Nitrophenyl)-4,5-dichloropyridazin-3-one, 2–43
To a solution of 4-nitrophenyl-hydrazine (4.6 mL, 30 mmol) in diluted HCl (4 M, 60 mL) was added mucochloric acid (5 g, 30 mmol) at 25 °C. The solution was refluxed for 3 h. The suspension was filtered and washed with water to give the crude 2–43P. The yellow solids were subjected to the following cyclization reaction without further purification. The suspension of the crude 2–43P and p-toluenesulfonic acid (500 mg) in 200 mL of toluene was refluxed for 10 h. The solution was concentrated and the solids were washed with water to give 6.5 g of a yellowish solid, 2–43, 76% (two steps). Mp 221 °C. 1H NMR 8.35 (2H, d J = 9.2 Hz), 7.98 (1H, s), 7.90 (2H, d, J = 9.2 Hz); 13C NMR 155.77, 146.99, 145.37, 136.99, 136.72, 135.65, 125.64, 124.16.
4.1.2. General procedure for the synthesis of 2-substituted 4-alkoxy-5-chloropyridazin-3-ones, for example, 5-chloro-4-ethoxy-2-phenylpyridazin-3-one (2–28)
To a solution of 2–42 (200 mg, 0.809 mmol) in 6 mL of 1,4-diox-ane was added 1 mL of freshly generated NaOEt (0.8 M) in EtOH (for methoxy substitution, NaOMe solution in MeOH was used) at 0 °C. The suspension was stirred for 2 h as the solution was slowly warmed to 25 °C. The suspension was concentrated and the mixture was subjected to flash column chromatography on silica gel to give 189 mg of 2–28, 92%. Mp 78 °C. 1H NMR 7.84 (1H, s), 7.54 (2H, m), 7.48 (2H, m), 7.41 (1H, m); 13C NMR 163.88, 156.01, 140.09, 140.96, 138.17, 128.89, 128.56, 125.46, 123.62, 69.34, 15.94. For the other analogs, the yields varied from 70% to 96%.


4.1.3. General procedure for the synthesis of 2-substituted 5-alkoxy-4-chloropyridazin-3-ones, for example, 4-chloro-5-ethoxy-2-phenylpyridazin-3-one (2–35)
To a solution of 2–42 (200 mg, 0.809 mmol) in 6 mL of EtOH was added 0.8 mL of NaOH (1 M) at 0 °C. The suspension was stirred for 2 h as it was allowed to warm to 25 °C. The suspension was concentrated and the mixture was subjected to flash column chromatography on silica gel to give 195 mg of 2–35, 95%. Mp 110 °C 1H NMR 7.91 (1H, s), 7.57 (2H, m), 7.47 (2H, m), 7.40 (1H, m), 4.38 (2H, q, J = 7.2 Hz), 1.54 (3H, t, J = 7.2 Hz); 13C NMR 154.13, 141.22, 132.68, 128.66, 128.32, 127.74, 125.24, 117.34, 66.64, 14.81. For the other analogs, the yields varied from 75% to 95%.

4.1.4. General procedure for the synthesis of 2-substituted 4-alk-oxy-5-mercapto-pyridazin-3-ones, e.g., 4-ethoxy-5-mercapto-2-phenylpyridazin-3-one (2–10)
To a solution of 2–28 (63 mg, 0.25 mmol) in 2 mL of DMF was added 70 mg of NaSH at 25 °C. After TLC showed complete consumption of starting material, the solution was concentrated under high vacuum and diluted with 10 mL of water. The aqueous layer was washed with ethyl acetate and then pH of the aqueous layer was adjusted to 5–6 by addition of 1 M HCl (aq). Ethyl acetate (20 mL, two 10 mL portions) was added to the aqueous layer to extract the desired compounds. The organic layers were combined and dried over magnesium sulfate and concentrated to give 45 mg of 2–10 as a white solid, 73%. Mp 101 °C. 1H NMR 7.72 (1H, s), 7.54 (2H, m), 7.46 (2H, m), 7.38 (1H, m), 4.63 (2H, q, J = 7.2 Hz), 4.04 (1H, s), 1.42 (3H, t, J = 7.2 Hz); 13C NMR 155.76, 148.54, 141.16, 137.02, 128.80, 128.30, 125.51, 125.47, 68.73, 16.12. For the other analogs, the yields varied from 40% to 91%.

4.1.5. General procedure for the synthesis of 2-substituted 5-alkoxy-4-mercapto-pyridazin-3-ones
The procedures for 2–18 to 2–21 are same as that of 2–10 with the corresponding starting materials. Yields: 45–85%.

4.1.6. 4-Ethoxy-5-(methyldithio)-2-phenylpyridazin-3-one (2–49)
To a solution of 2–10 (6 mg, 0.024 mmol) in 2 mL of MeOH was added methyl methanethiosulfonate (MMTS, 4.5 mg, 0.036 mmol) at 25 °C. The solution was stirred for 30 min and concentrated. The residual mixture was subjected to flash column chromatography on silica gel to give 6.1 mg of 2–49, 88%. 1H NMR 8.26 (1H, s), 7.57 (2H, m), 7.48 (2H, m), 7.40 (1H, m), 4.63 (2H, q, J =7.0 Hz), 2.52 (3H, s), 1.40 (3H, t, J = 7.0 Hz); 13C NMR 155.42, 150.01, 141.15, 134.82, 128.69, 128.21, 127.79, 125.36, 68.78, 23.42, 15.85.

4.1.7. 4-Ethoxy-5-(2-pyridyldithio)-2-phenylpyridazin-3-one (2–50)
To a solution of 2–10 (6 mg, 0.024 mmol) in 2 mL of MeOH was added aldrithiol (7.9 mg, 0.036 mmol) at 25 °C The solution was stirred for 2 h and concentrated. The residual mixture was subjected to flash column chromatography on silica gel to give 5.6 mg of 2–50, 65%. 1H NMR 8.51 (1H, d, J = 4.0 Hz), 8.08 (1H, s), 7.68 (1H, ddd, J = 8.0, 8.0, 1.5 Hz), 7.61 (1H, d, J = 8.0 Hz), 7.54 (2H, m), 7.47 (2H, m), 7.38 (1H, m), 7.16 (1H, ddd, J = 7.0, 5.0, 1.0 Hz), 4.70 (2H, q, J = 7.0 Hz), 1.45 (3H, t, J =7.0 Hz); 13C NMR 157.60, 155.42, 150.51, 149.97, 141.06, 137.36, 135.34, 128.65, 128.22, 126.80, 125.29, 121.55, 120.30, 69.04, 15.91.

4.1.8. Bis(4-ethoxy-2-phenyl-5-pyridazyl)disulfide (2–17)
To a solution of 2–50 (10 mg, 0.028 mmol) in 2 mL of MeOH was added 15 mg of 2–10 at 25 °C. The solution was stirred for 3 h then concentrated and subjected to flash column chromatography on silica gel to give 11.9 mg of 2–17, 85%. 1H NMR 8.13 (1H, s), 7.55 (2H, m), 7.48 (2H, m), 7.39 (1H, m), 4.73 (2H, q, J = 7.2 Hz), 1.43 (3H, t, J = 7.2 Hz); 13C NMR (DMSO) 155.36, 150.61, 141.44, 136.57, 128.97, 128.57, 126.09, 121.58, 68.81, 16.03.
For additional information and the spectral data on specific compounds, please see the Supplementary data.
4.2. High-throughput screening
A total of 30,000 chemical compounds (DiverSet Chemically Diverse Library and Combichem Library, ChemBridge Corp.) were screened for S. aureus SrtAΔN59 (residues 60–206) inhibition using an automated robotic system at the UCLA Molecular Screening Shared Resource facility. A fluorescence resonance energy transfer (FRET) assay was used in high-throughput screening in multi-well plates (384 wells per plate).64 The assay monitors the SrtAΔN59-catalyzed hydrolysis of an internally quenched fluorescent substrate analog (o-aminobenzoyl (Abz)-LPETG-diaminopropionic acid-dinitrophenyl-NH2 (Dap(Dnp)), SynPep Corp. Dublin, CA).53 Briefly, 20 µL of purified SrtA (>95% homogeneity and proper folding was confirmed by 1D 1H NMR, final assay concentration of 0.4 µM in FRET buffer: 20 mM HEPES, 5 mM CaCl2, 0.05% v/v Tween-20, pH 7.5)was incubated with 0.5 µL of test compound solution (dissolved in Me2SO, final assay concentration of 10 µM) for 1 h at 25 °C. Thirty-two wells of each plate were dedicated to positive and negative controls (1 µL of Me2SO or 2 mM p-hydroxymercuribenzoic acid was added alternatively to the test compound solution). Subsequently, 30 µL of fluorescent substrate solution (15 µM final assay concentration in FRET buffer) was added to the mixture to initiate the catalysis. Final Me2SO concentrations were less than 2% in all assay mixtures. The FRET assays were monitored by a Flex Station II plate reader (Molecular Devices) with an excitation and emission wavelengths of 335 and 420 nm, respectively. The assay mixture was measured again after 5 h for end-point reading.
4.3. Secondary assays
For the top ten lead compounds, the concentration that is required for a 50% reduction in enzymatic activity (IC50) was determined using well established methods.34,46,53 Briefly, 20 µL of purified SrtA (final assay concentration of 1.5–15 µM in FRET buffer: 20 mM HEPES, 5 mM CaCl2, pH 7.5) was incubated with 1 µL of test compound solution (dissolved in Me2SO, final assay concentration of 0.08–400 µM) for 1 h at 25 °C. Subsequently, 30 µL of substrate solution in FRET buffer (37.5 µM final assay concentration for SaSrtA, and 100 µM for BaSrtA) was added to the mixture and the fluorescence was then monitored as described above. IC50 values were calculated by fitting three independent sets of data to Eq. 1:
| (1) |
where νi and ν0 are initial velocity of the reaction in the presence and absence of inhibitor at concentration [I], respectively. The term h is Hill coefficient.46
Some of the inhibitors tightly bind to the enzyme such that their IC50 values are lower than the enzyme concentration used in the assay (1.5–15 µM). To accurately define their potency the IC50 values of these compounds were measured at different enzyme concentrations.46 If a linear relationship between total enzyme concentration [E]T and IC50 values was observed, the apparent dissociation constant for the enzyme–inhibitor () was calculated by fitting the data to Morrison’s quadratic equation (Eq. 2).66,67
| (2) |
4.4. Inhibitory binding reversibility study
The reversibility of inhibition was determined by measuring the recovery of enzymatic activity after a sudden large dilution of the enzyme–inhibitor complex.46 11.25 µL of purified SrtA at a concentration of 150 µM was mixed with 1.25 µL of each inhibitor such that the final inhibitor concentration was 10-fold greater than its IC50. After incubation at 25 °C for 1 h, 737.5 µL of FRET buffer was added. Thirty microliters of the diluted enzyme–inhibitor mixture were then plated and 20 µL of the fluorescent substrate (37.5 µM stock concentration) was added to initiate the cleavage reaction. The reaction progress curve was monitored as described above. Recovery of enzymatic activity after rapid dilution (100-fold) was calculated by comparing these progress curves with measurements of the reaction performed in the absence of inhibitor.
4.5. Mass spectrometry
Thirty microliters of purified SrtA (1.5 µM final assay concentration, dissolved in 5 mM CaCl2, 20 mM HEPES, pH 7.5 buffer) were incubated with 1 µL of inhibitor such that the final inhibitor concentration was 1- and 10-fold higher than its IC50 value. After incubating for 1, 48, or 96 h at 25 °C, the enzyme–inhibitor mixture was mixed with an equal amount of α-cyano-4-hydroxycin-namic acid, and analyzed by MALDI-TOF using a Voyager-DE STR Biospectrometry Workstation (Applied Biosystems). An equal amount (1 µL) of DMSO was used instead of the inhibitor solution as a negative control. Cbz-LPAT* (where Cbz is a carbobenzyloxy protecting group and T* is a threonine derivative that replaces the carbonyl group with –CH2–SH) was used as a positive control, as it readily forms a disulfide bridge with the Cys184 thiol group of the enzyme.41,42
4.6. Determination of S. aureus MIC
The minimal inhibitory concentration (MIC) was determined using the microtiter broth dilution method.57 An overnight saturated culture of S. aureus strain Newman (provided by Dr. Lloyd Miller, Division of Dermatology, David Geffen School of Medicine, UCLA) was diluted to an OD600 of 0.01. After additional incubation at 37 °C and dilution to an OD600 of 0.005, 180 µL of the culture was plated into a 96-well plate. Twenty microliters of inhibitor solution at varied concentrations (final concentrations of 0.1–100 µM) were then added to the culture. Cell growth was monitored by measuring the OD600 during an overnight growth at 37 °C using a temperature-controlled plate reader. The cell growth percentage was calculated relative to cultures gown in the absence of inhibitor as well as in the presence of 10 µg/mL erythromycin. MIC measurements were performed in triplicate.
4.7. Molecular docking
Molecular docking of each inhibitor was performed using Schrödinger Suite 200863 with an Induced-Fit Docking (IFD) workflow.61,62 Calculations were run on a PC equipped with 3.8 GHz Intel Hyperthreading CPU, 2.0 GB SDRAM memory, and a LINUX operating system. The IFD protocol can be summarized as follows. First, the Glide docking module scales the van der Waals radii for both ligand and receptor binding site atoms by 50%. Second, the Prime module restores, predicts, and energy minimizes 20 structures of the given ligand–receptor complex generated by the first step. Finally, the ligand conformations are redocked into the induced-fit receptor structures generated by the second step. Complex structures possessing energies that are within 30 kcal/mol were then ranked and the IFD scores determined. The poses presented in the paper are those conformations with the best score. The receptor protein structure was prepared by the Protein Preparation Wizard in Maestro user interface (Schrödinger, LLC).63 The bond orders were assigned, and the charges and hydrogen bonds were optimized by using the default protocol. All inhibitor ligands were prepared by the LigPrep63 module in a comparable manner.
Supplementary Material
Acknowledgments
We thank Dr. Joseph A. Loo for assistance with the mass spectrometry experiments, and technical support for the molecular docking studies from Schrödinger, LLC. This work was supported by NIH Grant AI52217 to R.T.C. and M.E. J. N.S. acknowledges support from DPST and JSTP scholarships from the Royal Thai Government. N.S. was also supported by a UCLA Dissertation Year Fellowship.
Footnotes
Supplementary data
Supplementary data associated with this article can be found, in the online version, at doi:10.1016/j.bmc.2009.08.067.
References and notes
- 1.Talbot GH, Bradley J, Edwards JE, Jr, Gilbert D, Scheld M, Bartlett JG. Clin. Infect. Dis. 2006;42:657. doi: 10.1086/499819. [DOI] [PubMed] [Google Scholar]
- 2.Klevens RM, Morrison MA, Nadle J, Petit S, Gershman K, Ray S, Harrison LH, Lynfield R, Dumyati G, Townes JM, Craig AS, Zell ER, Fosheim GE, McDougal LK, Carey RB, Fridkin SK. Jama. 2007;298:1763. doi: 10.1001/jama.298.15.1763. [DOI] [PubMed] [Google Scholar]
- 3.Navarre WW, Schneewind O. Micro. biol. Mol. Biol. Rev. 1999;63:174. doi: 10.1128/mmbr.63.1.174-229.1999. [DOI] [PMC free article] [PubMed] [Google Scholar]
- 4.Marraffini LA, Dedent AC, Schneewind O. Micro. biol. Mol. Biol. Rev. 2006;70:192. doi: 10.1128/MMBR.70.1.192-221.2006. [DOI] [PMC free article] [PubMed] [Google Scholar]
- 5.Paterson GK, Mitchell TJ. Trends Microbiol. 2004;12:89. doi: 10.1016/j.tim.2003.12.007. [DOI] [PubMed] [Google Scholar]
- 6.Ton-That H, Marraffini LA, Schneewind O. Biochim. Biophys. Acta. 2004;1694:269. doi: 10.1016/j.bbamcr.2004.04.014. [DOI] [PubMed] [Google Scholar]
- 7.Mazmanian SK, Liu G, Hung TT, Schneewind O. Science. 1999;285:760. doi: 10.1126/science.285.5428.760. [DOI] [PubMed] [Google Scholar]
- 8.Ton-That H, Liu G, Mazmanian SK, Faull KF, Schneewind O. Proc. Natl. Acad. Sci. U.S.A. 1999;96:12424. doi: 10.1073/pnas.96.22.12424. [DOI] [PMC free article] [PubMed] [Google Scholar]
- 9.Schneewind O, Model P, Fischetti VA. Cell. 1992;70:267. doi: 10.1016/0092-8674(92)90101-h. [DOI] [PubMed] [Google Scholar]
- 10.Schneewind O, Mihaylovapetkov D, Model PEMBO. J. 1993;12:4803. [Google Scholar]
- 11.Perry AM, Ton-That H, Mazmanian SK, Schneewind O. J. Biol. Chem. 2002;277:16241. doi: 10.1074/jbc.M109194200. [DOI] [PubMed] [Google Scholar]
- 12.Ruzin A, Severin A, Ritacco F, Tabei K, Singh G, Bradford PA, Siegel MM, Projan SJ, Shlaes DM. J. Bacterial. 2002;184:2141. doi: 10.1128/JB.184.8.2141-2147.2002. [DOI] [PMC free article] [PubMed] [Google Scholar]
- 13.Schneewind O, Fowler A, Faull KF. Science. 1995;268:103. doi: 10.1126/science.7701329. [DOI] [PubMed] [Google Scholar]
- 14.Zink SD, Burns DL. Infect. Immun. 2005;73:5222. doi: 10.1128/IAI.73.8.5222-5228.2005. [DOI] [PMC free article] [PubMed] [Google Scholar]
- 15.Weiss WJ, Lenoy E, Murphy T, Tardio L, Burgio P, Projan SJ, Schneewind O, Alksne LJ. Antimicrob. Chemother. 2004;53:480. doi: 10.1093/jac/dkh078. [DOI] [PubMed] [Google Scholar]
- 16.Jonsson IM, Mazmanian SK, Schneewind O, Verdrengh M, Bremell T, Tarkowski A. J. Infect. Dis. 2002;185:1417. doi: 10.1086/340503. [DOI] [PubMed] [Google Scholar]
- 17.Mazmanian SK, Liu G, Jensen ER, Lenoy E, Schneewind O. Proc. Natl. Acad. Sci. U.S.A. 2000;97:5510. doi: 10.1073/pnas.080520697. [DOI] [PMC free article] [PubMed] [Google Scholar]
- 18.Mazmanian SK, Ton-That H, Su K, Schneewind O. Proc. Natl. Acad. Sci. U.S.A. 2002;99:2293. doi: 10.1073/pnas.032523999. [DOI] [PMC free article] [PubMed] [Google Scholar]
- 19.Bierne H, Mazmanian SK, Trost M, Pucciarelli MG, Liu G, Dehoux P, Jansch L, Garcia-del Portillo F, Schneewind O, Cossart P. Mol. Microbiol. 2002;43:869. doi: 10.1046/j.1365-2958.2002.02798.x. [DOI] [PubMed] [Google Scholar]
- 20.Garandeau C, Reglier-Poupet H, Dubail L, Beretti JL, Berche P, Charbit A. Infect. Immun. 2002;70:1382. doi: 10.1128/IAI.70.3.1382-1390.2002. [DOI] [PMC free article] [PubMed] [Google Scholar]
- 21.Kharat AS, Tomasz A. Infect. Immun. 2003;71:2758. doi: 10.1128/IAI.71.5.2758-2765.2003. [DOI] [PMC free article] [PubMed] [Google Scholar]
- 22.Chen S, Paterson GK, Tong HH, Mitchell TJ, Demaria TF. FEMS Microbiol. Lett. 2005;253:151. doi: 10.1016/j.femsle.2005.09.052. [DOI] [PubMed] [Google Scholar]
- 23.Paterson GK, Mitchell TJ. Microbes Infect. 2005;12:89. doi: 10.1016/j.micinf.2005.06.009. [DOI] [PubMed] [Google Scholar]
- 24.Bolken TC, Franke CA, Jones KF, Zeller GO, Jones CH, Dutton EK, Hruby DE. Infect. Immun. 2001;69:75. doi: 10.1128/IAI.69.1.75-80.2001. [DOI] [PMC free article] [PubMed] [Google Scholar]
- 25.Scott JR, Zahner D. Mol. Microbiol. 2006;62:320. doi: 10.1111/j.1365-2958.2006.05279.x. [DOI] [PubMed] [Google Scholar]
- 26.Mandlik A, Swierczynski A, Das A, Ton-That H. Trends Microbiol. 2008;16:33. doi: 10.1016/j.tim.2007.10.010. [DOI] [PMC free article] [PubMed] [Google Scholar]
- 27.Comfort D, Clubb RT. Infect. Immunol. 2004;72:2710. doi: 10.1128/IAI.72.5.2710-2722.2004. [DOI] [PMC free article] [PubMed] [Google Scholar]
- 28.Maresso AW, Schneewind O. Pharmacol. Rev. 2008;60:128. doi: 10.1124/pr.107.07110. [DOI] [PubMed] [Google Scholar]
- 29.Suree N, Jung ME, Clubb RT. Mini-Rev. Med. Chem. 2007;7:991. doi: 10.2174/138955707782110097. [DOI] [PubMed] [Google Scholar]
- 30.Cossart P, Jonquieres R. Proc. Natl. Acad. Sci. U.S.A. 2000;97:5013. doi: 10.1073/pnas.97.10.5013. [DOI] [PMC free article] [PubMed] [Google Scholar]
- 31.Kudryavtsev KV, Bentley ML, McCafferty DG. Bioorg. Med. Chem. 2009;17:2886. doi: 10.1016/j.bmc.2009.02.008. [DOI] [PMC free article] [PubMed] [Google Scholar]
- 32.Kim SH, Shin DS, Oh MN, Chung SC, Lee JS, Chang IM, Oh KB. Biosci. Biotechnol. Biochem. 2003;67:2477. doi: 10.1271/bbb.67.2477. [DOI] [PubMed] [Google Scholar]
- 33.Kim SH, Shin DS, Oh MN, Chung SC, Lee JS, Oh KB. Biosci. Biotechnol. Biochem. 2004;68:421. doi: 10.1271/bbb.68.421. [DOI] [PubMed] [Google Scholar]
- 34.Kim SW, Chang IM, Oh KB. Biosci. Biotechnol. Biochem. 2002;66:2751. doi: 10.1271/bbb.66.2751. [DOI] [PubMed] [Google Scholar]
- 35.Oh KB, Mar W, Kim S, Kim JY, Oh MN, Kim JG, Shin D, Sim CJ, Shin J. Bioorg. Med. Chem. Lett. 2005;15:4927. doi: 10.1016/j.bmcl.2005.08.021. [DOI] [PubMed] [Google Scholar]
- 36.Jang KH, Chung SC, Shin J, Lee SH, Kim TI, Lee HS, Oh KB. Bioorg. Med. Chem. Lett. 2007;17:5366. doi: 10.1016/j.bmcl.2007.08.007. [DOI] [PubMed] [Google Scholar]
- 37.Kang SS, Kim JG, Lee TH, Oh KB. Biol. Pharm. Bull. 2006;29:1751. doi: 10.1248/bpb.29.1751. [DOI] [PubMed] [Google Scholar]
- 38.Park BS, Kim JG, Kim MR, Lee SE, Takeoka GR, Oh KB, Kim JHJ. Agric. Food Chem. 2005;53:9005. doi: 10.1021/jf051765z. [DOI] [PubMed] [Google Scholar]
- 39.Maresso AW, Wu R, Kern JW, Zhang R, Janik D, Missiakas DM, Duban ME, Joachimiak A, Schneewind O. J. Biol. Chem. 2007;282:23129. doi: 10.1074/jbc.M701857200. [DOI] [PMC free article] [PubMed] [Google Scholar]
- 40.Kruger RG, Barkallah S, Frankel BA, McCafferty DG. Bioorg. Med. Chem. 2004;12:3723. doi: 10.1016/j.bmc.2004.03.066. [DOI] [PubMed] [Google Scholar]
- 41.Jung ME, Clemens JJ, Suree N, Liew CK, Pilpa R, Campbell DO, Clubb RT. Bioorg. Med. Chem. Lett. 2005;15:5076. doi: 10.1016/j.bmcl.2005.07.073. [DOI] [PubMed] [Google Scholar]
- 42.Liew CK, Smith BT, Pilpa R, Suree N, Ilangovan U, Connolly KM, Jung ME, Clubb RT. FEBS Lett. 2004;571:221. doi: 10.1016/j.febslet.2004.06.070. [DOI] [PubMed] [Google Scholar]
- 43.Connolly KM, Smith BT, Pilpa R, Ilangovan U, Jung ME, Clubb RT. J. Biol. Chem. 2003;278:34061. doi: 10.1074/jbc.M305245200. [DOI] [PubMed] [Google Scholar]
- 44.Scott CJ, McDowell A, Martin SL, Lynas JF, Vandenbroeck K, Walker B. Biochem. J. 2002;366:953. doi: 10.1042/BJ20020602. [DOI] [PMC free article] [PubMed] [Google Scholar]
- 45.Zhang JH, Chung TD, Oldenburg KR. J. Biomol. Screen. 1999;4:67. doi: 10.1177/108705719900400206. [DOI] [PubMed] [Google Scholar]
- 46.Copeland AR. New Jersey: Evaluation of Enzyme Inhibitors in Drug Discoveries. John Wiley & Sons; 2005. [Google Scholar]
- 47.Lajiness MS, Vieth M, Erickson J. Curr. Opin. Drug Discov. Devel. 2004;7:470. [PubMed] [Google Scholar]
- 48.Viswanadhan VN, Balan C, Hulme C, Cheetham JC, Sun Y. Curr. Opin. Drug Discov. Devel. 2002;5:400. [PubMed] [Google Scholar]
- 49.Darvas F, Keseru G, Papp A, Dorman G, Urge L, Krajcsi P. Curr. Top. Med. Chem. 2002;2:1287. doi: 10.2174/1568026023392841. [DOI] [PubMed] [Google Scholar]
- 50.Lipinski CA, Lombardo F, Dominy BW, Feeney PJ. Adv. Drug Deliv. Rev. 2001;46:3. doi: 10.1016/s0169-409x(00)00129-0. [DOI] [PubMed] [Google Scholar]
- 51.Lipinski CA, Hoffer E. Practice of Medicinal Chemistry. 2nd ed. 2003. Compound Properties and Drug Quality; p. 341. [Google Scholar]
- 52.Lipinski CA. Drug Discov. Today: Technol. 2004;1:337. doi: 10.1016/j.ddtec.2004.11.007. [DOI] [PubMed] [Google Scholar]
- 53.Huang X, Aulabaugh A, Ding W, Kapoor B, Alksne L, Tabei K, Ellestad G. Biochemistry. 2003;42:11307. doi: 10.1021/bi034391g. [DOI] [PubMed] [Google Scholar]
- 54.Condon FE, Shapiro D, Sulewski P, Vasi I, Waldman R. Org. Prep. Proc. Int. 1974;6:37. [Google Scholar]
- 55.Drobnica L, Knoppova V, Komanova E. Chem. Zvesti. 1972;26:538. [Google Scholar]
- 56.Liga JWJ. Heterocycl. Chem. 1988;25:1757. [Google Scholar]
- 57.Frankel BA, Bentley M, Kruger RG, McCafferty DG. J. Am. Chem. Soc. 2004;126:3404. doi: 10.1021/ja0390294. [DOI] [PubMed] [Google Scholar]
- 58.Grant EB, Guiadeen D, Baum EZ, Foleno BD, Jin H, Montenegro DA, Nelson EA, Bush K, Hlasta DJ. Bioorg. Med. Chem. Lett. 2000;10:2179. doi: 10.1016/s0960-894x(00)00444-3. [DOI] [PubMed] [Google Scholar]
- 59.Zervosen A, Lu WP, Chen Z, White RE, Demuth TP, Jr, Frere JM. Antimicrob. Agents Chemother. 2004;48:961. doi: 10.1128/AAC.48.3.961-969.2004. [DOI] [PMC free article] [PubMed] [Google Scholar]
- 60.Gaspar AH, Marraffini LA, Glass EM, Debord KL, Ton-That H, Schneewind O. J. Bacteriol. 2005;187:4646. doi: 10.1128/JB.187.13.4646-4655.2005. [DOI] [PMC free article] [PubMed] [Google Scholar]
- 61.Sherman W, Day T, Jacobson MP, Friesner RA, Farid R. J. Med. Chem. 2006;49:534. doi: 10.1021/jm050540c. [DOI] [PubMed] [Google Scholar]
- 62.Sherman W, Beard HS, Farid R. Chem. Biol. Drug Des. 2006;67:83. doi: 10.1111/j.1747-0285.2005.00327.x. [DOI] [PubMed] [Google Scholar]
- 63.Schrödinger Suite. New York, NY, USA: Schrödinger, LLC; 2008. [Google Scholar]
- 64.Suree N, Liew CK, Villareal VA, Thieu W, Fadeev EA, Clemens JJ, Jung ME, Clubb RT. J. Biol. Chem. 2009;284:24465. doi: 10.1074/jbc.M109.022624. [DOI] [PMC free article] [PubMed] [Google Scholar]
- 65.Zong Y, Bice TW, Ton-That H, Schneewind O, Narayana SV. J. Biol. Chem. 2004;279:31383. doi: 10.1074/jbc.M401374200. [DOI] [PubMed] [Google Scholar]
- 66.Williams JW, Morrison JF. Methods Enzymol. 1979;63:437. doi: 10.1016/0076-6879(79)63019-7. [DOI] [PubMed] [Google Scholar]
- 67.Morrison JF. Biochim. Biophys. Acta. 1969;185:269. doi: 10.1016/0005-2744(69)90420-3. [DOI] [PubMed] [Google Scholar]
- 68.DeLano WL. The PyMOL Molecular Graphics System. South San Francisco: DeLano Scientific; 0.99 ed. [Google Scholar]
Associated Data
This section collects any data citations, data availability statements, or supplementary materials included in this article.