

Summary
Activation of ErbB receptors by epidermal growth factor (EGF) or heregulin (HRG) determines distinct cell fate decisions, although signals propagate through shared pathways. Using modeling and experiments, we unravel how EGF and HRG generate distinct, all-or-none responses of the phosphorylated transcription factor c-Fos. In the cytosol, EGF induces transient and HRG induces sustained ERK activation. In the nucleus, however, ERK activity and c-fos mRNA expression are transient for both ligands. Knockdown of dual-specificity phosphatases extends HRG-stimulated nuclear ERK activation, but not c-fos mRNA expression, implying the existence of a HRG-induced repressor of c-fos transcription. Further experiments confirmed that this repressor is mainly induced by HRG, but not EGF, and requires new protein synthesis. We show how a spatially distributed, signaling-transcription cascade robustly discriminates between transient and sustained ERK activities at the c-Fos system level. The proposed control mechanisms are general and operate in different cell types, stimulated by various ligands.
Introduction
The ErbB receptors initiate a multilayered signal transduction network that converts external cues into specific gene expression responses in different cells and tissues. Its deregulation drives the development and progression of several types of cancer (Citri and Yarden, 2006). Ligand binding causes the homo- and hetero-dimerization of ErbB receptors, followed by allosteric activation of their intrinsic tyrosine kinases (Zhang et al., 2006). This induces a complex cascade of phosphorylation and activation events that convey signals to the nucleus. The subsequent changes in gene expression eventually lead to pivotal cell-fate decisions, such as proliferation or differentiation.
A major challenge for cell signaling studies is to understand how different cues and receptors give rise to unique gene expression responses despite the promiscuous activation of shared pathways, such as extracellular regulated kinase 1/2 (ERK) cascade. Initial insight into this specificity dilemma came from observations that PC-12 cells proliferated after a transient ERK activation by epidermal growth factor (EGF), but differentiated after a sustained ERK activation by nerve growth factor (NGF), showing that the duration of ERK signaling is critical for cell fate decisions (Marshall, 1995). Subsequent theoretical and experimental work revealed that different ERK activation dynamics can arise from differential feedback wiring of the cytosolic ERK cascade (Kholodenko, 2007; Santos et al., 2007). In the nucleus, the duration of ERK activation is sensed by a network of immediate early genes, including the transcription factor c-Fos (Murphy et al., 2004; Murphy et al., 2002). MCF-7 cells show similar signaling input-output relationships: sustained ERK activity induces cellular differentiation and a significant c-Fos response, while transient ERK activity induces proliferation and a negligible c-Fos response (Nagashima et al., 2007). These examples suggest that differential ERK activation kinetics can be converted into all-or-none responses at the transcription factor level. This conversion could explain how common core pathways can program distinct cell-fate decisions.
The sustained induction of c-Fos depends on activation of ERK and its downstream target, p90 ribosomal S6 kinase 2 (RSK), which stimulate c-fos transcription and co-operate to stabilize the c-Fos protein product through multiple phosphorylations (Chen et al., 1993; Chen et al., 1992; Murphy et al., 2002). Phosphorylation also enhances c-Fos transcriptional activity (Pellegrino and Stork, 2006); therefore, phosphorylated c-Fos (pc-Fos) may be viewed as the functional output of this system. A network structure, in which an initial input signal (active ERK) induces an intermediate signal (c-fos mRNA), and both the initial and intermediate signals are needed to generate the final output (pc-Fos protein), is termed a coherent feedforward loop (CFL) (Mangan et al., 2003). This CFL creates a “sign-sensitive delay” that senses the duration of ERK activation: a drop in the initial input (- sign) results in immediate loss of output, whereas an increase (+ sign) leads to a delayed increase in output. Additionally, negative feedback regulation arises from ERK-induced expression of the dual specificity phosphatases (collectively known as DUSPs or MAPK phosphatases (MKPs)), which deactivate ERK (Brondello et al., 1997; Brondello et al., 1995; Sun et al., 1993). DUSP protein expression develops on the same time scale as c-Fos expression and is also controlled by ERK activity (Brondello et al., 1999). Thus, although the ERK to pc-Fos CFL provides a core sensing mechanism for transient versus sustained ERK activity (Murphy et al., 2002), the resulting emergent properties of this network, which includes negative transcriptional regulation are not understood.
Here, we demonstrate how the spatio-temporal coordination of combined signaling and transcriptional responses allows cells to convert analog ERK signaling into robust, digital pc-Fos responses. Although EGF and HRG induce transient versus sustained cytoplasmic ERK activities, downstream c-fos mRNA expression is transient for both ligands. Modeling suggests that this identical c-fos expression duration is explained by a larger dusp mRNA expression response and resulting transient nuclear ERK activity for HRG. RNAi-mediated dusp knockdown sustains HRG-induced nuclear ERK activity, but has little effect on HRG-activated c-fos mRNA expression, implying the existence of an additional negative regulator of c-fos transcription. Double-pulse experiments with different ligands demonstrate that this repressor is induced by HRG, but not by EGF. HRG stimulation in the presence of cycloheximide sustains c-fos mRNA expression, showing that activation of the repressor requires de novo protein synthesis. For HRG, sustained cytoplasmic ppERK and, to a lesser extent, the transient nuclear ppERK stabilize the c-Fos protein and drive the high pc-Fos response, whereas for EGF, transient cytoplasmic ERK activity causes a negligible pc-Fos response. Systems-level model analysis reveals how the spatially distributed regulation cascades make the all-or-none pc-Fos responses robust to noise in ERK activity and to system perturbations. Predictions based on our model built for MCF-7 cells can qualitatively explain the measured EGF- and NGF-induced pc-Fos responses in the classic PC-12 cell system. Thus, the proposed control mechanisms of discrimination between transient and sustained cytoplasmic ERK activities hold true for different types of cells and ligands. Overall, our experimental and computational results demonstrate that a CFL signaling cascade interlinked with transcriptional negative feedback loops is the principal c-Fos regulation module wherein differential, spatially distributed ERK dynamics contribute to binary cell fate decisions.
Results
Transient and Sustained Cytosolic ERK Activation Signals are Converted into Similar c-fos Response Durations in the Nucleus
Previous studies showed that activated ERK controls c-fos mRNA expression (Buchwalter et al., 2004; Chai and Tarnawski, 2002). Since EGF and HRG induced transient and sustained ERK activation, respectively (Fig 1A), we expected c-fos mRNA expression to be transient for EGF and sustained for HRG. Surprisingly, c-fos mRNA expression profiles were transient for both ligands, although the magnitude of c-fos mRNA response was larger for HRG than for EGF (Fig. 1B). This difference in the mRNA response was amplified at the level of c-Fos expression (Fig. 1C) and converted into an all (HRG) or none (EGF) pc-Fos response (Fig. 1D). Since ppERK is required for c-Fos stabilization, the observed all-or-none pc-Fos responses can be attributed to the continued ppERK presence following HRG stimulation, and absence of ppERK after 30 minutes EGF stimulation (Murphy et al., 2002). Yet, this interpretation cannot account for the transient time course of c-fos mRNA. It is also inconsistent with our observations that HRG-induced c-fos mRNA expression begins to decline after 30 minutes, while ppERK is sustained up to 60 minutes. These results suggest that the c-Fos expression dynamics cannot be explained solely by the ERK activation profiles, and more complex mechanisms must be invoked.
Figure 1. The c-Fos expression network: responses to EGF and HRG and model’s schematic.
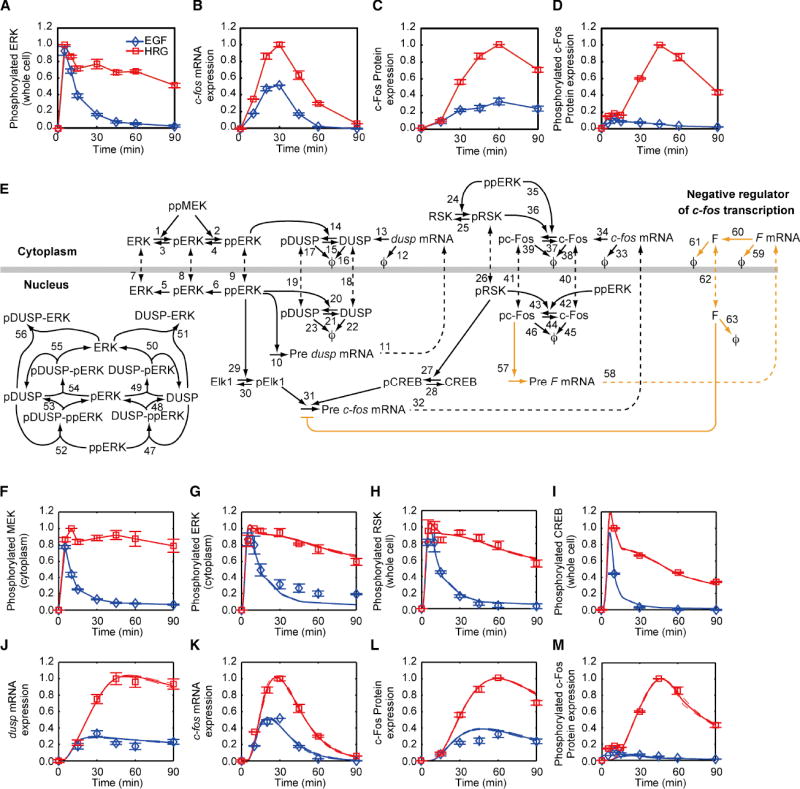
MCF-7 cells were stimulated with 10 nM EGF or HRG for indicated periods of time (min), and the responses were measured with western blotting (proteins) or qRT-PCR (mRNA). Data were normalized by dividing them by the maximum value of the HRG-induced responses. Error bars denote standard error for at least three independent experiments; representative blot images can be found in the Fig. S1. (A) ppERK. (B) c-fos mRNA. (C) Total c-Fos. (D) T325 phosphorylated c-Fos. E. Model’s schematic. The nuclear membrane is shown by thick grey line, chemical transformations are depicted by solid lines, and nucleocytoplasmic transport is denoted by dashed lines. Rate laws and parameters for the individually numbered chemical reactions are given in Supp. Methods. Degraded protein and mRNA are represented by ϕ. Black lines correspond to mechanisms in the initial model, whereas orange lines denote model refinement that is based on additional experimental data (see Fig. 3). F-M. Points (blue diamonds - EGF and red squares - HRG) denote experimental data, solid lines denote simulations done with the initial model, and dashed lines represent these simulations ± standard deviation. F. Cytoplasmic MEK activation. G. Cytoplasmic ERK activation. H. Whole cell RSK phosphorylation. I. Whole cell CREB phosphorylation. J.dusp1 mRNA expression. K. c-fos mRNA expression. L. Whole cell c-Fos expression. M. Whole cell c-Fos phosphorylation. See also Fig. S1 and Tables S1-S4.
Building an Initial Computational Model of the c-Fos Expression Network Dynamics
Although some aspects of c-Fos regulation are understood, the data shown in Fig. 1 raise several questions. Why are the c-fos mRNA expression profiles transient for both EGF and HRG? What mechanisms are responsible for the all-or-none pc-Fos responses? Is the discrimination mechanism robust to noise and perturbations? To answer such questions we have developed a mechanistic, computational model that describes the dynamic control of c-Fos expression and phosphorylation (shown schematically in Fig. 1E). The model allows us to deeply explore the emergent properties of the signaling network that governs these transitions to make predictions that are used as testable hypotheses in our experiments. When the predictions agree with the data, this substantiates key regulatory mechanisms. On the other hand, points of model-experiment mismatch call for new hypotheses, as indeed happened in this study. Fig. 1E shows our initial model (black lines), which is based on pre-existing knowledge. This initial model was used until new experimental data revealed its limitations. The further model refinement (orange lines) incorporates new hypotheses that improve the agreement between the model and experimental data. Here, we briefly describe the initial model; a complete derivation is presented in Supplemental Experimental Procedures.
Input Signaling and ERK Dynamics
Understanding the complexity of signaling can be facilitated using a modular approach to modeling (Kholodenko et al., 2002). This approach allows us to focus only on the ERK-induced c-Fos dynamics, considering signaling between ErbB receptors and ERK as a separate module (Birtwistle et al., 2007). As the model input, we take cytoplasmic dually phosphorylated MEK (ppMEK), which activates ERK, and this input is estimated directly from data (Fig. 1F). Active ERK is dephosphorylated by constitutive (such as PP2A and PTP-SL) and induced (DUSP) phosphatases in the cytoplasm and nucleus.
c-fos Transcription and Protein Stabilization
Active ERK phosphorylates and activates RSK (Chen et al., 1992), and active ERK and RSK cooperate to stimulate c-fos transcription (Fig. 1E). Upon nuclear translocation, active ERK phosphorylates and activates the transcription factor Elk1 (Gille et al., 1995), which binds to the serum response factor and subsequently to the c-fos promoter (Buchwalter et al., 2004). RSK phosphorylates and activates CREB (Xing et al., 1996), which also binds to the c-fos promoter (Wang and Prywes, 2000). When phospho-Elk1 and phospho-CREB are both bound to the c-fos promoter, transcription occurs (Bruning et al., 2000; De Cesare et al., 1998). The phosphorylation and stabilization of nascent c-Fos proteins depends on active ERK and RSK, and on an ERK docking site on c-Fos (Murphy et al., 2002).
dusp Transcription and Protein Stabilization
The nuclear inducible dusps are immediate early genes that are upregulated within ~15-30 minutes of stimulation with EGF in a variety of cell lines (Charles et al., 1992; Keyse and Emslie, 1992). ERK activation leads to upregulation of dusp mRNA levels (Brondello et al., 1997), and similar to c-Fos, active ERK phosphorylates and stabilizes the dusp protein product (Brondello et al., 1999). DUSP translocates to the nucleus and dephosphorylates nuclear ppERK (Brondello et al., 1995).
Training the Model with Experimental Data
Before a model can be used to generate hypotheses, it must be “trained” with experimental data. This process is called parameter estimation (see details in the Methods and Supp. Methods). To train the model, we used data on multiple nodes of the c-Fos expression network (Fig. 1F-M). The solid lines in Fig. 1F-M denote simulations done with the initial model that match closely with the data (shown as points). Although the model can reproduce the data in Fig. 1, goodness-of-fit to a training set alone is insufficient for validating the model. It is necessary to test the model predictions against independent experimental data, as is described below.
Sensitivity Analysis Suggests Critical Control Mechanisms of c-Fos Induction
The model permitted us to analyze on a systems level how transient (EGF) and sustained (HRG) ERK signals are robustly discriminated into all-or-none pc-Fos responses, despite the same duration of c-fos mRNA responses. To generate testable hypotheses, we employed sensitivity analysis, which examines how perturbations to the processes in the model affect the c-fos mRNA expression duration and cumulative (time-integrated) pc-Fos protein response. We quantified the duration as the time it takes for c-fos mRNA to decline below 10% of its maximum, and the cumulative response as the integral of the pc-Fos concentration over the observation time of 90 min. The sensitivities, or control coefficients, were approximated as the percent change in the quantity of interest caused by a 1% change in a reaction rate (Kholodenko et al., 1997a). Negative control coefficients indicate that the quantity will decrease with a reaction rate increase, while positive coefficients indicate that the quantity will increase. Large coefficients, whether positive or negative, indicate potentially significant control mechanisms.
The control coefficients for c-fos mRNA duration and integrated pc-Fos response are presented in Figs. 2A and 2B. For both EGF and HRG, the dynamic expression of c-fos mRNA is strongly controlled by c-fos transcriptional processes (including mRNA transport and degradation). EGF and HRG differ in dusp mRNA production/degradation, ERK (de)activation and transport, and the RSK-CREB pathway contributions. The control distribution over the cumulative pc-Fos response (Fig. 2B) also shows that dusp expression contributes to the ligand-specific regulation of pc-Fos. While sensitivity analysis suggests an appreciable regulatory role of dusp, this analysis considers only small perturbations, and the predictions may not hold for large perturbations. Therefore, we evaluated how large decreases in dusp mRNA levels would affect c-fos responses. The results support the conclusions of the sensitivity analysis. Simulated dusp downregulation increased the amplitude and duration of c-fos mRNA responses for HRG, but only the amplitude for EGF (Figs. 2C and 2D).
Figure 2. Sensitivities of c-fos mRNA duration and integrated pc-Fos responses to perturbations.
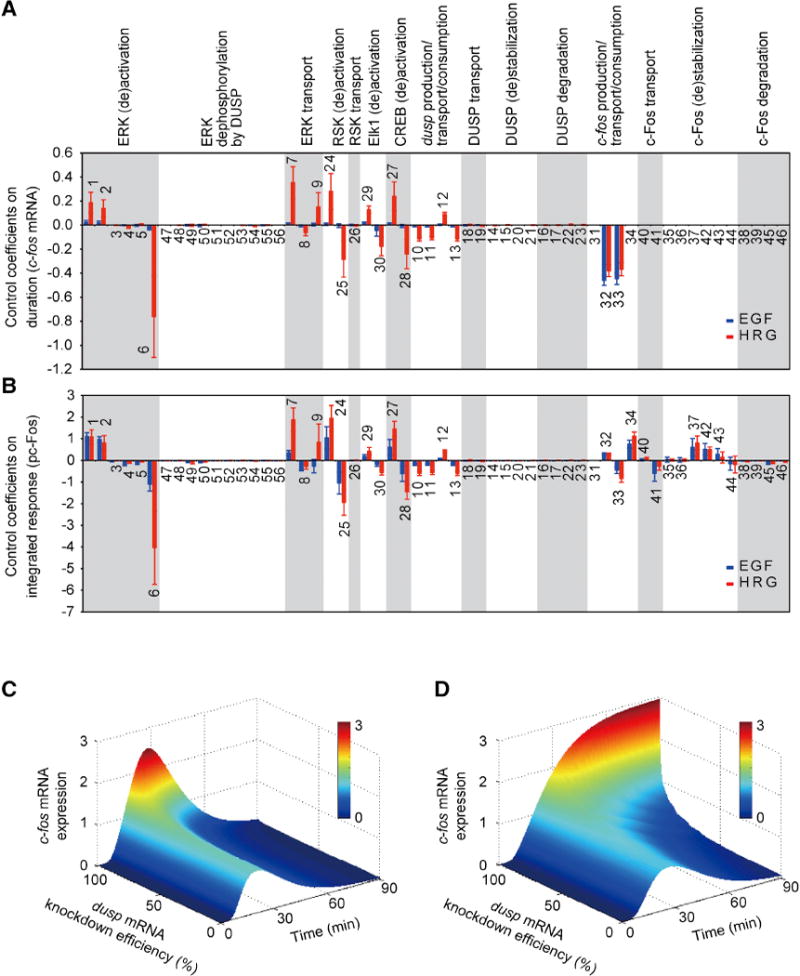
Simulations are done with the initial model; ligand concentrations are 10 nM. A and B - Control coefficients for c-fos mRNA duration (A) and integrated pc-Fos (B) are shown by bars (blue, EGF and red, HRG). Numbers above bars indicate the reaction indices as shown in Fig. 1E, and error bars correspond to simulation standard deviation. Reactions are grouped according to biological processes (indicated above each plot) and not in the order of their numerical index. C and D - Simulated effects of various degrees of dusp knockdown on EGF- induced (C) and HRG-induced (D) c-fos mRNA expression. Downregulation of dusp is simulated by increasing the dusp mRNA degradation rate constant. See also Fig. S2.
Pivotal Role of Negative Feedback Regulations in Ligand-Dependent c-Fos Responses and Construction of a Refined Model
Nuclear ERK signaling is transient for both HRG and EGF
Our model predicts that although HRG induces sustained cytoplasmic ERK activity (Fig. 1G), HRG-induced dusp expression results in transient nuclear ERK activation, which persists slightly longer for HRG than for EGF (Fig. 3A). To test this prediction, we quantified the spatially-resolved dynamics of ppERK by immunofluorescence staining (Fig. 3B-D; Table S5A). The data confirmed that both the HRG and EGF-induced nuclear ppERK profiles are transient. During the time interval between 15 min (after both ligands activate similar peak responses) and 60 min (when responses return to basal levels), the time-averaged nuclear ppERK concentration is about 1.5-fold larger for HRG than for EGF (represented by the shaded areas in Figs. 3B and 3C). The difference between the EGF and HRG responses during this time window is highly significant (a 1-tailed, 2-sample t-test gives p=0.0084). Notably, this difference is similar to the difference between the peak magnitudes of the downstream HRG- and EGF-induced c-fos and dusp mRNA expressions (Fig. 1J-K). Thus, the time-averaged nuclear ppERK activity is a biochemical indicator of downstream immediate early mRNA responses.
Figure 3. Nuclear ERK activation dynamics and the effect of dusp downregulation on c-fos mRNA duration.

A. Model predictions for nuclear ppERK time courses. Ligand concentrations are 10 nM (EGF, blue and HRG, red). B and C. Quantified nuclear ppERK dynamics based on cell images obtained from Duolink technology (EGF, blue and HRG, red; representative image is shown in Table S5A). Each data point is the average response based on ~180 individual cells in three independent experiments, and error bars correspond to standard error based on the three replicates. Solid lines denote in silico simulations, and dashed lines denote simulation standard deviation. For normalization, raw quantified data are divided by the 5 min. time point of each respective ligand dose. Shading corresponds to the nuclear ppERK profile between 15 and 60 min. D. Spatially-resolved ERK activation dynamics observed by immunofluorescence. Total ERK (green) is shown on the right and ppERK (red) is shown on the left. E,F,K,L. Measured vs. predicted effects of dusp downregulation on c-fos mRNA expression induced by 10 nM EGF (E and K) or HRG (F and L). Solid and dashed lines correspond to model simulations and their standard deviation, respectively. The dusp downregulation was modeled as an increase in the dusp mRNA degradation rate. Simulations in Panels E and F correspond to the initial model (Fig. 1E, black lines only) and simulations in Panels K and L correspond to the refined model (Fig. 1E, black and orange lines). G and H. c-fos mRNA expression in response to two 1 nM pulses of (G) EGF or (H) HRG. Arrows denote the second stimulation time. I and J. Effects of cycloheximide on c-fos mRNA expression induced by 10 nM EGF (I) or 10 nM HRG (J). For Panels E-L, error bars denote the standard error from three independent experiments. Note that Panels I and J have different y-axis scales. In Panels E, F, and I-L, data values are relative to their respective 30 min. HRG control point. Solid and dashed lines correspond to model simulations and their standard deviation, respectively. Simulations done with the refined model are indicated. See also Table S5.
Effects of dusp knockdown on the c-fos mRNA, nuclear ppERK, and pc-Fos protein responses
The model predicts that dusp downregulation increases both the duration and magnitude of c-fos mRNA expression for HRG, while increasing only the response magnitude for EGF (Figs. 2C and 2D). To test this experimentally we downregulated the major nuclear inducible dusps by siRNA. In MCF-7 cells, dusps 1, 2, 4, 5, 8, and 10 are induced, but expression levels of dusp 8 and 10 for HRG are relatively small compared to those of dusps 1, 2, 4, and 5 (Table S5B). Moreover, recent studies indicated that only the joint inhibition of dusps 1, 2, 4, and 5 markedly influenced nuclear ERK2 activation (Armstrong et al., 2009; Caunt et al., 2008). Therefore, we measured EGF and HRG-evoked c-fos mRNA responses following the simultaneous knockdown of dusps 1, 2, 4, and 5. For EGF, the data agree with the model prediction (Fig. 3E). However for HRG, dusp knockdown only slightly increased the magnitude of the c-fos mRNA response. In contrast to our model predictions, there was little effect on the response duration (Fig. 3F), despite the fact that nuclear ppERK was enhanced, as expected (Table S5E-F). Nevertheless, dusp knockdown slightly increased HRG-induced c-Fos and pc-Fos levels (Table S5E-F), reflecting the increased nuclear ppERK level, which caused increased phosphorylation and faster stabilization of c-Fos.
Novel, ligand-dependent negative feedback regulation of c-fos expression
The dusp knockdown experiments showed that for HRG the c-fos mRNA responses remained transient, while nuclear ppERK became sustained, suggesting that HRG, but not EGF, induces a repressor of c-fos transcription. If this repressor is transcriptionally activated, it would likely persist beyond 90 minutes after stimulation, when c-fos mRNA decreases to basal level. Then, a second pulse of HRG added 90 minutes after the initial HRG stimulation would be unable to induce significant c-fos mRNA expression, whereas a second EGF pulse would still evoke a large c-fos mRNA response after initial EGF stimulation. Figs. 3G and 3H (diamonds for EGF, squares for HRG) demonstrate that a second HRG-pulse indeed caused a negligible c-fos mRNA response, whereas a second EGF-pulse stimulated a significant response (whilst ERK is activated in either case, see Table S5G). This negative feedback regulator hypothesis is further supported by additional double-pulse experiments where various ligands are added in different orders. A pulse of HRG added 90 minutes after EGF induced a significant c-fos mRNA response, whereas a pulse of EGF added 90 minutes after HRG did not (Table S5G). We also replaced HRG with PMA, a phorbol ester that induces sustained ERK activation similarly to HRG (as shown later in Fig. 6D). An EGF pulse after PMA stimulation generated a negligible c-fos mRNA response. On the other hand, a PMA pulse given after EGF induced a strong c-fos mRNA response (Table S5G).
Figure 6. ERK activation is an ubiquitous master regulator of the integrated pc-Fos responses.

(A-C) PC-12 cells were stimulated with 10 nM EGF or 10 nM NGF for indicated periods of time and responses were measured with western blotting (proteins) or qRT-PCR (mRNA). Data were normalized by dividing them by the maximum value of the HRG-induced responses. (D-E) MCF-7 cells were stimulated with 10 nM EGF + 100 nM PMA. F. The ppERK input is characterized by three parameters: the peak amplitude Ap, the peak time Tp and the decay time τ. G. Quantitative relationship between the integrated pc-Fos output and the ppERK decay time τ. Data points correspond to experimental data for various ligand doses in MCF-7 and PC-12 cells, which are indicated by text boxes. The ppERK decay time τ was calculated from experimental data (see Supp. Methods, Core Model Description, ). For simulations, the values for Ap and Tp were fixed at 1 and 10 min., respectively, as is commonly observed for ppERK responses. Calculation of the integrated pc-Fos responses from experimental data is described in Supp. Methods. For all relevant panels, error bars denote standard error for at least three independent experiments, representative blot images can be found in Fig. S4, and solid lines denote simulations. For all panels, simulations were done using the core model. See also Fig. S4.
Since the timing of this HRG-induced feedback suggests that it may require de novo protein synthesis, we measured the HRG and EGF-induced c-fos mRNA responses in the presence of the protein synthesis inhibitor cycloheximide (CHX). CHX markedly increased the HRG-induced c-fos mRNA, but had a smaller effect on the EGF-induced response (Figs. 3I and 3J). The change from the transient HRG-induced c-fos mRNA response to the sustained response in the presence of CHX can partly be explained by CHX-induced increases in the c-fos mRNA half-life (Sariban et al., 1988). Yet, this extension of half-life alone cannot account for the CHX effect; a simple mathematical model demonstrates that a concomitant change that sustains the c-fos transcription rate is needed (Supplementary Experimental Procedures and Table S5H). Analysis of a previously published gene chip data set identified 40 transcriptional regulators that are upregulated upon HRG stimulation, and are thus candidates for this negative regulatory factor (Table S6; {Nagashima, 2007 #7}).
A refined model of c-fos regulation
The data obtained from dusp knockdown, double-pulse and CHX experiments cannot be explained by our initial model of c-fos regulation (black lines in Fig. 1E). Therefore, we refined this model to include an additional layer of negative transcriptional control. A scenario consistent with this negative regulator hypothesis is that pc-Fos induces its own transcriptional repressor, as shown schematically by the orange lines in Fig. 1E. Upon training our refined model to the data, we found that it not only reproduced the original training data set, but also reproduced the nuclear ppERK dynamics better than the initial model (Fig. S1B). The simulations capture that the HRG-induced nuclear ppERK profile is higher than EGF-induced profile during the 15 – 60 minute time frame, in line with the experimental findings (see the shaded areas in Figs. 3B and 3C). Using the refined model, we computed the effects of dusp downregulation on the EGF- and HRG-induced c-fos mRNA kinetics (Figs. 3K and 3L) and found a reasonable agreement between the data and simulations. Importantly, this refined model predicts the results of double-pulse experiments (Figs. 3G and 3H and Table S5G) and accounts for the CHX experiments (Figs. 3I and 3J), which the initial model fails to predict.
We conclude that transcriptional negative feedback, which includes dusps and a yet unknown c-fos repressor(s), plays a larger role in regulating the duration of HRG-induced, than EGF-induced c-fos mRNA expression. Although the refined mechanistic model can describe the system dynamics, the identity of the negative regulator is as yet unknown. When mechanistic details become available, our model will be further improved to incorporate a complete description of processes that activate this repressor.
General Operating Principles and Ubiquitous Control Mechanisms of c-Fos Expression
A core model description of the emergent properties of the c-Fos system
Motivated by the quest to understand the key regulatory principles of the c-Fos expression system we developed a “core” model, which compared to the mechanistic model is deliberately simplified to capture the essential system characteristics. Our core model takes cytoplasmic ppERK as input, involves only five intermediates and has pc-Fos as the output (Fig. 4A, for details see Supp. Methods). In the core model, nuclear pRSK and ppERK together stimulate transcription of c-fos, and cytoplasmic ppERK phosphorylates the c-Fos protein. We represent the overall transcriptional negative feedback as dependent on the cumulative (i.e., integrated over time) nuclear ppERK activity, assuming that the current levels of these negative regulators reflect the recent history of the nuclear ppERK profile. This single negative feedback implicitly accounts for both DUSPs and the unknown transcriptional repressor, since the cumulative nuclear ppERK activity is representative of growth factor-induced transcriptional responses. In fact, nearly perfect adaptation of c-fos mRNA responses in which the response returns to the basal level supports this assumption. In engineering terms, this feedback is called “integral feedback”, which endows most control systems with perfect adaptation capabilities (Mettetal et al., 2008; Ogunnaike and Ray, 1994).
Figure 4. Core c-Fos expression model.
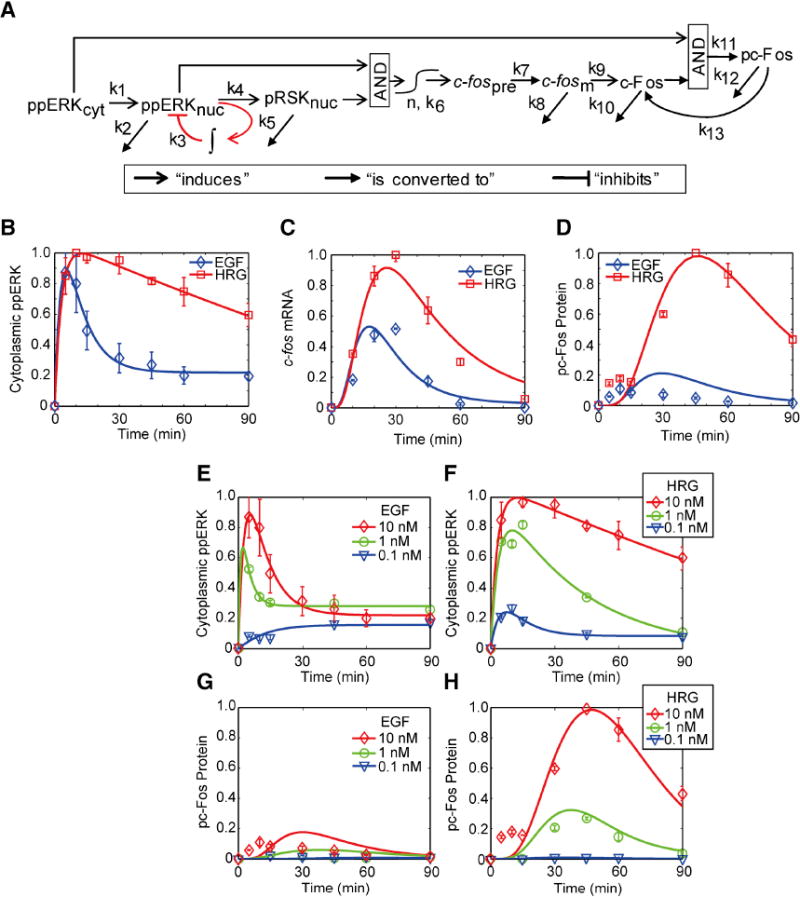
A. Model schematic. B-D The core model parameters were trained by the responses of ppERK, c-fos mRNA, and pc-Fos to 10 nM EGF or 10 nM HRG in MCF-7 cells. E-H. To validate the model, we compared model predictions to the observed pc-Fos responses for different EGF and HRG doses (1 nM and 0.1 nM) in MCF-7 cells. Experimental data were obtained with western blotting (proteins) or qRT-PCR (mRNA). Error bars denote standard error for at least three independent experiments, and representative western blot images can be found in Fig. S3. For all time course plots, solid lines denote simulations. See also Fig. S3.
The core model was trained using only a single ligand dose (10 nM EGF and 10 nM HRG) to describe the measured c-fos mRNA and pc-Fos protein responses in MCF-7 cells (Figs. 4B-D). To test this model, we compared its predictions to measured pc-Fos responses for different EGF and HRG doses (Figs. 4E-H). The agreement between model predictions and the experimental data substantiates our core model.
Robustness of the c-Fos expression system
The core model encapsulates the key features of the c-Fos system (Fig. 4A): (i) an outer CFL (cytoplasmic ppERK and c-Fos generate pc-Fos), (ii) an inner CFL (nuclear ppERK and pRSK activate c-fos transcription), and (iii) an integral transcriptional negative feedback. The importance of the outer CFL for converting transient versus sustained ppERK signals into all-or-none c-Fos responses was previously shown (Murphy et al., 2002). However, the systems-level roles of the inner RSK-mediated CFL and the transcriptional negative feedback remain unclear.
This structure of the c-Fos system, where an inner CFL is embedded into an outer CFL, resembles a cascade organization of feedback controllers in engineering control systems that provide robustness of the output to disturbances in the input (Ogunnaike and Ray, 1994). Therefore, we simulated how disturbances to the ppERK input signal, in the form of a sine-wave, affect the integrated pc-Fos response in the presence or absence of the inner CFL. In response to the same level of ppERK disturbance, the system with the inner CFL produced a much lower cumulative pc-Fos output than the system without the inner CFL (Figs. 5A and 5B). Only disturbances that persist as long as HRG-induced ppERK activation cause appreciable pc-Fos output. These results suggest that the inner CFL makes the integrated pc-Fos output robust to noisy ppERK signals.
Figure 5. Robustness of the c-Fos expression network.
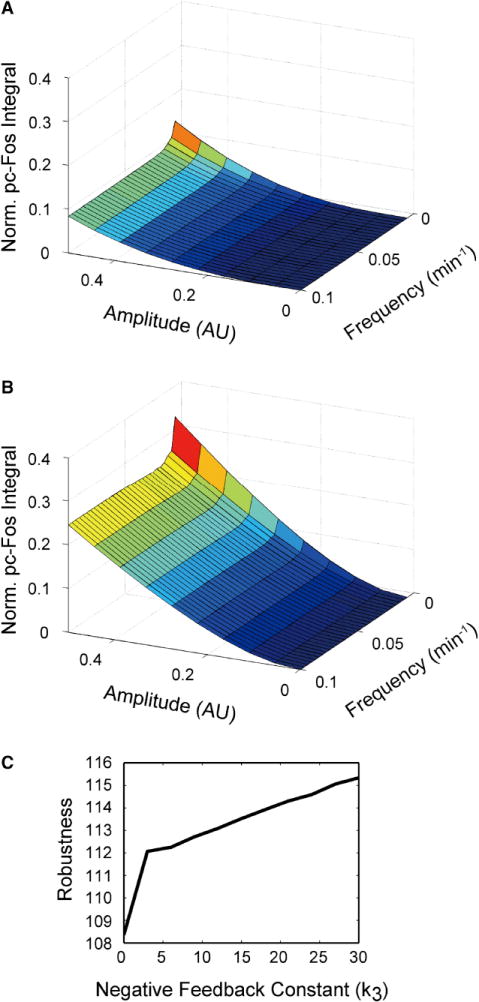
A and B. Robustness to disturbances in ppERK increases when the inner CFL is present (A) and decreases when this CFL is absent (B). Disturbances are simulated as |A sin(ωt)|, where A is the amplitude, ω is the frequency and t is time. AU stands for Arbitrary Units. These arbitrary units correspond to the same arbitrary units characterizing cytoplasmic ppERK measurements in Figs. 1G, 4B, and 4E. The inner CFL is “absent” when the dependence of c-fos transcription on pRSK is disregarded in the model. The integrated pc-Fos response is expressed in the units relative to the 10 nM HRG response. C. Robustness of the c-Fos expression system increases with increasing the integral negative feedback strength (k3). Robustness is quantified as the sum over all inverse, absolute control coefficients of system parameters (the greater this sum is the smaller the changes that occur when parameters are perturbed, see Methods).
The transcriptional negative feedback loops not only make the c-Fos response transient, but can also endow the system with robustness (Sauro and Kholodenko, 2004). We therefore investigated how sensitive the integrated pc-Fos output was to perturbations in the system parameters at different negative feedback strengths (see Methods). Indeed, as the negative feedback strength is increased, the cumulative pc-Fos response becomes more robust (Fig. 5C). Thus, the transcriptional negative feedback, in addition to shaping the dynamics of the pc-Fos response, provides robustness to system parameter perturbations.
EGF- vs NGF-induced pc-Fos Responses in PC-12 Cells
Are key control features of the c-Fos expression system specific to MCF-7 cells or applicable to other cells? To answer this question, we revisited the classic PC-12 cell system wherein transient or sustained ppERK signals lead to distinct cell fate decisions (Marshall, 1995). We measured the dynamics of ppERK, c-fos mRNA, and pc-Fos in PC-12 cells stimulated with 10 nM EGF or 10 nM NGF, and compared these data to the predictions of our core model that was trained by data from MCF-7 cells (Fig. 6). In our simulations, only the ppERK input profile was allowed to vary with respect to MCF-7 cells; all other parameter values remained fixed. When the input for our MCF-7 cell model corresponded to PC12 cell ERK signaling, the calculated c-Fos dynamics qualitatively agreed with the measured c-Fos expression and activation responses in PC-12 cells (Figs. 6B and 6C). The major difference was that the predicted c-fos mRNA expression dynamics were slower than observed, perhaps because MCF-7 and PC-12 cells originated from different human and rat cells, respectively, which may have different c-fos mRNA half-lives. Comparison of Fig. 6A to Fig. 1A shows that EGF induces a slightly more sustained ppERK signal in PC-12 cells than in MCF-7 cells. Yet despite this longer ppERK signal duration, the pc-Fos response remains small for EGF (Fig. 6C), demonstrating the robustness of the system to discriminate transient versus sustained ppERK signals. Overall, these results suggest that the control mechanisms of c-Fos expression responses built in our model are general, rather than limited to MCF-7 cells.
PMA-enhanced, EGF-induced ERK activation amplifies the c-Fos expression response
Are the ERK activation kinetics a master regulator of the ligand-dependent, all-or-none pc-Fos response? To address this question, we co-stimulated MCF-7 cells with EGF and PMA, a potent activator of PKC which extends EGF induced ppERK dynamics to profile similar to the HRG (Fig. 6D). Thus, if the pc-Fos response solely depended on the ERK activation kinetics, rather than the nature of the ligand or upstream receptor, we would expect that EGF and PMA co-stimulation results in a large pc-Fos response, similar to the HRG-induced response. This is exactly what the core model predicts, and what was observed experimentally (Fig. 6E). These results support the emerging paradigm that ligand specificity is related to the different spatio-temporal dynamics of shared, core signaling outputs, which consequently induce differential gene expression responses. Both our core and refined mechanistic models substantiate this paradigm by clear-cut computational findings.
Precise relation between the ppERK kinetics and pc-Fos response
Having shown that differential ERK activation dynamics can qualitatively determine the c-Fos response, we asked which exact quantitative features of the dynamic profiles of cytoplasmic ppERK are responsible for this decision? To this end we first approximated the ppERK dynamics with three quantitative parameters, the peak amplitude, Ap, the time to peak, Tp, and the decay time, τ (Fig. 6F). We then created a family of different ppERK inputs by combinatorially varying these parameters, and finally, calculated the cumulative pc-Fos output for each of these different inputs (see Fig. S4 for the full results). Experimentally we complemented the simulations by measuring ppERK induced by various concentrations of EGF and HRG in MCF-7 cells and EGF and NGF in PC-12 cells, respectively. Given typical Ap and Tp values for ERK activation dynamics, the mathematical model suggests a simple result, which is supported by the experimental data: the cumulative pc-Fos response is determined by the decay time of ppERK in both cell lines (Fig. 6G). Importantly, this relationship serves to convert the previous, qualitative ERK signaling paradigm into a precise, quantitative understanding of how the ppERK dynamics control the all-or-none pc-Fos responses.
Discussion
Cell signaling research is challenged with the question of how ligand specificity can emerge when different pathways share the same core components (Kholodenko, 2006). In the current study, we combined computational modeling and experiments to provide insight into this question. The models bring together extensive previous experimental data with our own new data to unveil that ligand-specific pc-Fos responses are brought about by a precise, spatially-distributed control system that involves a cascade of CFLs interlinked with transcriptional negative feedback loops. Owing to the time lag between transcription initiation and translation, this cytoplasmic-signal-to-protein-expression CFL structure acts as an “AND-gate” to convert the sustained vs. transient cytoplasmic ppERK temporal profiles into the all-or-none pc-Fos responses. Negative transcriptional feedback not only causes the similar c-fos expression durations for EGF and HRG, but also endows the pc-Fos response with robustness to parameter perturbations. The “inner” CFL involving RSK makes pc-Fos robust to noise in the ppERK input.
In this work we developed a mechanistic model and a core model, which have complementary properties. The mechanistic model allows us to ascribe observed behavior to precise biochemical mechanisms, aiming to create an in silico replica of cellular networks. Mechanistic biochemical models are directly tested against experiments, but these models must be refined continuously to keep pace with the constantly increasing detailed knowledge of molecular mechanisms. The current study, in which we refined our initial model following the results of siRNA, double-ligand pulse and CHX experiments, exemplifies this continuous refinement. Nevertheless, mechanistic models have large potential to facilitate understanding complex signaling networks. However, when the detailed mechanistic knowledge is lacking, it is desirable to employ simple, core models. Core models do not have excessive numbers of species and parameters, but capture and explain the key features that control the system behavior. Our core model serves just this purpose; when our data showed the limitations of the current knowledge, the core model helped us comprehend the emergent properties of the c-Fos expression network.
The biological significance of the CFL-regulated pc-Fos response is that a robust switch-like activation of transcription factors will lead to drastically different subsequent waves of gene expression, and consequently different phenotypes. The CFL structure also allows the cell to turn off gene expression rapidly as soon as the input signal is lost, while buffering the cell against unwarranted gene expression in response to spurious inputs or noise (Fig. 7A). In addition to these cytoplasmic-signal-to-protein-expression CFLs, active nuclear ERK, RSK and c-fos mRNA generate the nuclear-signal-to-mRNA CFL that operates on a shorter time scale (Fig. 7B). These fast and slow CFLs are organized in a “cascade” structure, where the faster, “inner” loop (ppERK-pRSK-c-fos mRNA) operates within the context of the slower, “outer” loop (ppERK-c-fos mRNA-pc-Fos protein). Because it takes time to propagate the disturbances in cytoplasmic ppERK through the inner loop before they reach c-fos mRNA, the inner loop filters fast ppERK input noise. When this cascade CFL structure is combined with the transcriptional negative feedback loops, which make the system robust to parameter perturbation, the overall network acquires even greater noise reduction capabilities (Fig. 7C).
Figure 7. Regulatory motifs in the c-Fos expression network and emerging differential, long-term transcription factor expression.
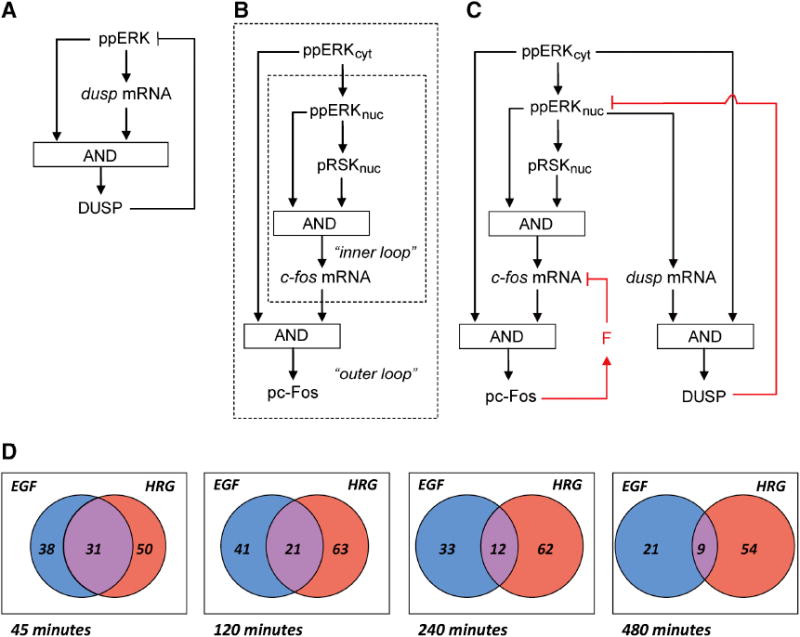
A. DUSP negative feedback superimposed onto the CFL. B. The CFL cascade structure of c-Fos regulation wherein the fast, nuclear inner CFL is contained within the slow, cytoplasmic outer CFL. C. The overall network structure which includes the cascade CFL embedded into the transcriptional negative feedback loops. D. Venn diagrams showing the number of common differentially expressed TFs between the EGF and HRG responses. The EGF (left - blue) and HRG (right - red) sets correspond to the number of differentially expressed gene probes that were identified as transcription factors by query to the gene ontology database. See also Fig. S5.
Why does the cell employ dusp and additional c-fos repressor(s) to downregulate the c-fos mRNA response when in principle the dusp response alone should be adequate for this task? One reason is that functional redundancy leads to robustness against system failures resulting from breakdown of any single component. This is a universally desirable feature that conceivably may have been selected for during evolution. Another, less obvious reason arises from the double-ligand pulse experiments, which show that an unidentified fos repressor makes MCF-7 cells refractory to further ligand stimulation in terms of c-fos expression. Thus, expression of this additional repressor converts cells into a different state, in which they no longer respond to ligands. Since HRG stimulation causes MCF-7 cell differentiation, the c-fos repressor may play a key role in ensuring that the cells follow the differentiation pathway despite the potential presence of other signals.
The opposing cell-fate decisions caused by EGF and HRG (proliferation versus differentiation) should be underlined by distinct gene expression patterns. We suggest that the quantitative differences in c-fos mRNA expression at the immediate early gene level are translated into robust qualitative differences for later waves of gene expression changes. Differences in expression of immediate early transcription factors such as c-fos would have a large impact on successive gene expression waves, if these factors are hubs in the regulatory network. As network hubs have many interaction partners and the DEF domain is critical for the all-or-none pc-Fos response (Murphy et al., 2002), we looked at the number of interaction partners for transcription factors with and without DEF domains. We indeed found that transcription factors with a DEF domain had a larger mean number of interaction partners (23.1) than non-DEF domain containing factors (15). For DEF domain containing transcription factors known to be HRG-induced immediate early responders in MCF-7 cells, the mean number of interaction partners (44) was even larger (Fig. S5 and Nagashima et al., 2007). Our hypothesis is further supported by previously published gene expression responses to HRG and EGF over longer time periods (Fig. 7D; Nagashima et al., 2007). At early times (45 minutes) nearly all the transcription factors that are differentially expressed in response to EGF and HRG are shared. However, as time progresses the overlap between these two sets decreases dramatically. We hypothesize that in large part this is due to HRG-induced, pc-Fos protein controlled gene expression. We propose that this quantitative-to-qualitative gene expression control principle may be general to mammalian signal transduction systems that induce distinct cell fates. Thus, we suggest that the integral negative feedback-embedded, cascade CFL structure that controls the initial, robust switch-like pc-Fos response is critical for control of cell fate decision processes.
Materials and Methods
Cell Culture and Treatment
MCF-7 cells were maintained and stimulated as previously described (Birtwistle et al., 2007). PC12 cells were purchased from RIKEN Bioresource Center (Tsukuba, Japan) and maintained in DMEM medium supplemented with 10 % horse serum and 10 % FBS. NGF was purchased from R&D Systems, Inc., (Minneapolis, MN). Where indicated, serum starved cells were pre-treated with cycloheximide (CHX) (Nacalai Tesque, Japan), or simultaneously treated with the PKC activator, Phorbol 12-Myristate 13-Acetate (PMA) (Nacalai Tesque). For double pulse experiments, cells were treated with 1 nM EGF or HRG and incubated for 90 min, washed three times with serum-free medium over 10 min., and then treated again with the same concentration of each growth factor. For different ligand combinations, 30 nM was used for EGF and HRG to induce full receptor activation, such that ErbB receptor cross-talk should not interfere with the results. For the PMA double pulse experiment, 100 nM PMA and 1 nM EGF were used. After incubation with the growth factors for the indicated time-period, cells were washed three times with phosphate buffered saline (PBS).
Immunoblotting
Cell lysates were prepared and analyzed as described previously (Birtwistle et al., 2007). For western blot analysis, anti-ERK (p44/42 MAP kinase), anti-phospho-ERK (Thr202/Tyr204), anti-CREB, anti-phospho-CREB (Ser133), anti-MEK1/2, anti-phospho-MEK1/2 (Ser217/221), anti-p90RSK, anti-phospho-p90RSK (Ser380), and anti-α-tubulin antibodies were purchased from Cell Signaling Technology, Inc. Anti-Fos antibody was purchased from Santa Cruz Biotechnology, Inc. (Santa Cruz, CA). Anti-GAPDH and anti-phospho-Fos (Thr325) antibody were purchased from Abcam (Cambridge, UK). The protein band intensities were quantified using a densitometer (Fuji Film Corp., Japan).
For measuring ppERK in different cellular compartments, cells were washed twice with ice-cold PBS containing 0.4 mM Na3VO4, scraped into hypotonic lysis buffer (10 mM Tris, pH 7.4, 10 mM NaCl, 3 mM MgCl3, 1 mM EGTA, 1 mM Na3VO4, 10 mM NaF, aprotinin, leupeptin, and PMSF), and incubated on ice for 10 min. The lysate was homogenized using a Dounce homogenizer (40 strokes), then centrifuged at 8000 g for 5 min. The pellet (nuclear fraction) was washed five times with hypotonic lysis buffer containing 0.1 % NP-40 and resuspended in lysis buffer containing 0.5 % sodium deoxycholate, 0.1 % SDS and 0.2 % NP-40. The soluble fraction was centrifuged at top speed for 5 min. and supernatant was considered the cytosolic fraction.
Immunofluorescence
Standard immunofluorescence (Fig. 3) was performed as described in Supp. Methods. The in situ Proximity Ligation Assay (PLA) with the Duolink kit (OLINK bioscience, Sweden) was used to quantify nuclear ppERK according to the manufacturer’s instructions. The Duolink assay has been shown to be much more quantitative and reproducible than standard immunostaining (Fredriksson, 2002; Soderberg, 2006). These experiments were performed in triplicate, and standard error was calculated based on this sample size of three. The stained cells were analyzed using a TCS-SPE microscope (LAS AF software ver 1.8.2, Leica, Germany). ppERK was detected and quantified using BlobFinder software (OLINK bioscience). DAPI staining was used to identify cell nuclei. Approximately 60 individual cell images were quantified for each time point, and all cells with a whole nucleus within a field of view were quantified. Representative PLA images are given in Table S5A.
siRNA Transfection
Transfection was performed using the HiperFect Transfection Reagent (QIAGEN) and CombiMAG magnetofection kit (Chemicell GmbH, Germany) according to the manufacturer’s instructions. The dusp 1, 2, 4 and 5 siRNA sequences can be found in Supp. Methods. For combination knockdown experiments, 10 nM of each siRNA were transfected, and the results were compared to data from control cells which were transfected with identical concentrations of non-targeting siRNA mixture (40 nM - Control AllStars 1, QIAGEN). We also used a completely independent set of dusp siRNAs from Dharmacon for verification of the results (Table S5D; sequences in Supp. Methods). Forty-eight hrs post-transfection, cells were starved for 16 hrs in serum free DMEM and then stimulated with 10 nM growth hormone for indicated time periods.
Quantitative RT-PCR
RNA was reverse transcribed into cDNA using the PrimeScript RT reagent Kit (TaKaRa, Japan – primer sequences in Supp. Methods). All the PCR reactions were done using either SYBR Premix Ex Taq (TaKaRa) or KAPA SYBR Fast kit (KAPA Biosystems, South Africa) in a Thermal Cycler Dice Real Time System TP800 (TaKaRa). qRT-PCR was performed in triplicate for each sample according to the manufacturer’s instructions. The standard curve method was used to determine relative quantity of mRNA. All qRT-PCR data were normalized to GAPDH expression.
Model Simulation
We describe the biochemical reactions and connectivity of signaling molecules using ordinary differential equations (ODEs) known as chemical kinetic equations. The ODE models were developed and simulated with MATLAB (The Mathworks, Inc.) and are in the Biomodels database (www.ebi.ac.uk/biomodels). Detailed descriptions are in Supp. Methods.
Model Parameter Estimation
To estimate the unknown model parameters, the sum of squared differences between the experimental data shown in Fig. 1 and the simulated values was minimized using the genetic algorithm GLSDC (Kimura and Konagaya, 2003) implemented on 160 CPUs in parallel (for details see Supp. Methods). For the initial model, we obtained 50 good fitting parameter sets, and simulation curves represent the mean of 50 independent simulations using these 50 sets (Table S4). Simulation standard deviations were similarly computed. For the refined model, we obtained 10 good-fitting parameter sets (Table S4).
Sensitivity and Robustness Analysis
The sensitivity coefficients are defined by
where M is the signaling metric (time-integrated response or duration—defined in main text) and vi is the i-th reaction rate. Control coefficients were calculated using finite difference approximations with 0.01% changes in the reaction rates. Calculation validity was tested by verifying that summation laws are obeyed (Kholodenko et al., 1997b), which required use of the MEK empirical model for a non-time dependent model input (see Supp. Methods and Fig. S2). Robustness is defined as the sum over all inverse, absolute parameter sensitivity coefficients,
where pi is a model parameter.
Supplementary Material
Acknowledgments
We thank Rony Seger and Walter Kolch for helpful discussions. Parameter estimation was performed using the RIKEN Super Combined Cluster system. This work was supported in part by Science Foundation Ireland under Grant No. 06/CE/B1129, NIH grant GM059570, and a Marie Curie International Incoming Fellowship (for MRB).
Footnotes
Publisher's Disclaimer: This is a PDF file of an unedited manuscript that has been accepted for publication. As a service to our customers we are providing this early version of the manuscript. The manuscript will undergo copyediting, typesetting, and review of the resulting proof before it is published in its final citable form. Please note that during the production process errors may be discovered which could affect the content, and all legal disclaimers that apply to the journal pertain.
References
- Armstrong SP, Caunt CJ, McArdle CA. Gonadotropin-Releasing Hormone and Protein Kinase C Signaling to ERK: Spatiotemporal Regulation of ERK by Docking Domains and Dual-Specificity Phosphatases. Mol Endocrinol. 2009;23:510–519. doi: 10.1210/me.2008-0333. [DOI] [PMC free article] [PubMed] [Google Scholar]
- Birtwistle MR, Hatakeyama M, Yumoto N, Ogunnaike BA, Hoek JB, Kholodenko BN. Ligand-dependent responses of the ErbB signaling network: experimental and modeling analyses. Mol Syst Biol. 2007;3:144. doi: 10.1038/msb4100188. [DOI] [PMC free article] [PubMed] [Google Scholar]
- Brondello JM, Brunet A, Pouyssegur J, McKenzie FR. The dual specificity mitogen-activated protein kinase phosphatase-1 and -2 are induced by the p42/p44MAPK cascade. J Biol Chem. 1997;272:1368–1376. doi: 10.1074/jbc.272.2.1368. [DOI] [PubMed] [Google Scholar]
- Brondello JM, McKenzie FR, Sun H, Tonks NK, Pouyssegur J. Constitutive MAP kinase phosphatase (MKP-1) expression blocks G1 specific gene transcription and S-phase entry in fibroblasts. Oncogene. 1995;10:1895–1904. [PubMed] [Google Scholar]
- Brondello JM, Pouyssegur J, McKenzie FR. Reduced MAP kinase phosphatase-1 degradation after p42/p44MAPK-dependent phosphorylation. Science. 1999;286:2514–2517. doi: 10.1126/science.286.5449.2514. [DOI] [PubMed] [Google Scholar]
- Bruning JC, Gillette JA, Zhao Y, Bjorbaeck C, Kotzka J, Knebel B, Avci H, Hanstein B, Lingohr P, Moller DE et al. Ribosomal subunit kinase-2 is required for growth factor-stimulated transcription of the c-Fos gene. Proc Natl Acad Sci U S A. 2000;97:2462–2467. doi: 10.1073/pnas.97.6.2462. [DOI] [PMC free article] [PubMed] [Google Scholar]
- Buchwalter G, Gross C, Wasylyk B. Ets ternary complex transcription factors. Gene. 2004;324:1–14. doi: 10.1016/j.gene.2003.09.028. [DOI] [PubMed] [Google Scholar]
- Caunt CJ, Armstrong SP, Rivers CA, Norman MR, McArdle CA. Spatiotemporal Regulation of ERK2 by Dual Specificity Phosphatases. J Biol Chem. 2008;283:26612–26623. doi: 10.1074/jbc.M801500200. [DOI] [PMC free article] [PubMed] [Google Scholar]
- Chai J, Tarnawski AS. Serum response factor: discovery, biochemistry, biological roles and implications for tissue injury healing. J Physiol Pharmacol. 2002;53:147–157. [PubMed] [Google Scholar]
- Charles CH, Abler AS, Lau LF. cDNA sequence of a growth factor-inducible immediate early gene and characterization of its encoded protein. Oncogene. 1992;7:187–190. [PubMed] [Google Scholar]
- Chen RH, Abate C, Blenis J. Phosphorylation of the c-Fos transrepression domain by mitogen-activated protein kinase and 90-kDa ribosomal S6 kinase. Proc Natl Acad Sci U S A. 1993;90:10952–10956. doi: 10.1073/pnas.90.23.10952. [DOI] [PMC free article] [PubMed] [Google Scholar]
- Chen RH, Sarnecki C, Blenis J. Nuclear localization and regulation of erk- and rsk-encoded protein kinases. Mol Cell Biol. 1992;12:915–927. doi: 10.1128/mcb.12.3.915. [DOI] [PMC free article] [PubMed] [Google Scholar]
- Citri A, Yarden Y. EGF-ERBB signalling: towards the systems level. Nat Rev Mol Cell Biol. 2006;7:505–516. doi: 10.1038/nrm1962. [DOI] [PubMed] [Google Scholar]
- De Cesare D, Jacquot S, Hanauer A, Sassone-Corsi P. Rsk-2 activity is necessary for epidermal growth factor-induced phosphorylation of CREB protein and transcription of c-fos gene. Proc Natl Acad Sci U S A. 1998;95:12202–12207. doi: 10.1073/pnas.95.21.12202. [DOI] [PMC free article] [PubMed] [Google Scholar]
- Fredriksson S, Gullberg M, Jarvius J, Olsson C, Pietras K, Gustafsdottir SM, Ostman A, Landegren U. Protein detection using proximity-dependent DNA ligation assays. Nat Biotechnol. 2002;20:473–477. doi: 10.1038/nbt0502-473. [DOI] [PubMed] [Google Scholar]
- Gille H, Kortenjann M, Thomae O, Moomaw C, Slaughter C, Cobb MH, Shaw PE. ERK phosphorylation potentiates Elk-1-mediated ternary complex formation and transactivation. Embo J. 1995;14:951–962. doi: 10.1002/j.1460-2075.1995.tb07076.x. [DOI] [PMC free article] [PubMed] [Google Scholar]
- Hornberg JJ, Bruggeman FJ, Binder B, Geest CR, de Vaate AJ, Lankelma J, Heinrich R, Westerhoff HV. Principles behind the multifarious control of signal transduction. ERK phosphorylation and kinase/phosphatase control. Febs J. 2005;272:244–258. doi: 10.1111/j.1432-1033.2004.04404.x. [DOI] [PubMed] [Google Scholar]
- Keyse SM, Emslie EA. Oxidative stress and heat shock induce a human gene encoding a protein-tyrosine phosphatase. Nature. 1992;359:644–647. doi: 10.1038/359644a0. [DOI] [PubMed] [Google Scholar]
- Kholodenko BN. Cell-signalling dynamics in time and space. Nat Rev Mol Cell Biol. 2006;7:165–176. doi: 10.1038/nrm1838. [DOI] [PMC free article] [PubMed] [Google Scholar]
- Kholodenko BN. Untangling the signalling wires. Nat Cell Biol. 2007;9:247–249. doi: 10.1038/ncb0307-247. [DOI] [PMC free article] [PubMed] [Google Scholar]
- Kholodenko BN, Demin OV, Westerhoff HV. Control analysis of periodic phenomena in biological systems. J Phys Chem. 1997;101:2070–2081. [Google Scholar]
- Kholodenko BN, Hoek JB, Westerhoff HV, Brown GC. Quantification of information transfer via cellular signal transduction pathways. FEBS Lett. 1997;414:430–434. doi: 10.1016/s0014-5793(97)01018-1. [DOI] [PubMed] [Google Scholar]
- Kholodenko BN, Kiyatkin A, Bruggeman FJ, Sontag E, Westerhoff HV, Hoek JB. Untangling the wires: a strategy to trace functional interactions in signaling and gene networks. Proc Natl Acad Sci U S A. 2002;99:12841–12846. doi: 10.1073/pnas.192442699. [DOI] [PMC free article] [PubMed] [Google Scholar]
- Kimura S, Konagaya A. High Dimensional Function Optimization using a new Genetic Local Search suitable for Parallel Computers. Paper presented at: Int Conf on Systems, Man, and Cybernetics.2003. [Google Scholar]
- Mandl M, Slack DN, Keyse SM. Specific inactivation and nuclear anchoring of extracellular signal-regulated kinase 2 by the inducible dual-specificity protein phosphatase DUSP5. Mol Cell Biol. 2005;25:1830–1845. doi: 10.1128/MCB.25.5.1830-1845.2005. [DOI] [PMC free article] [PubMed] [Google Scholar]
- Mangan S, Zaslaver A, Alon U. The coherent feedforward loop serves as a sign-sensitive delay element in transcription networks. J Mol Biol. 2003;334:197–204. doi: 10.1016/j.jmb.2003.09.049. [DOI] [PubMed] [Google Scholar]
- Marshall CJ. Specificity of receptor tyrosine kinase signaling: transient versus sustained extracellular signal-regulated kinase activation. Cell. 1995;80:179–185. doi: 10.1016/0092-8674(95)90401-8. [DOI] [PubMed] [Google Scholar]
- Mettetal JT, Muzzey D, Gomez-Uribe C, van Oudenaarden A. The frequency dependence of osmo-adaptation in Saccharomyces cerevisiae. Science. 2008;319:482–484. doi: 10.1126/science.1151582. [DOI] [PMC free article] [PubMed] [Google Scholar]
- Murphy LO, MacKeigan JP, Blenis J. A network of immediate early gene products propagates subtle differences in mitogen-activated protein kinase signal amplitude and duration. Mol Cell Biol. 2004;24:144–153. doi: 10.1128/MCB.24.1.144-153.2004. [DOI] [PMC free article] [PubMed] [Google Scholar]
- Murphy LO, Smith S, Chen RH, Fingar DC, Blenis J. Molecular interpretation of ERK signal duration by immediate early gene products. Nat Cell Biol. 2002;4:556–564. doi: 10.1038/ncb822. [DOI] [PubMed] [Google Scholar]
- Nagashima T, Shimodaira H, Ide K, Nakakuki T, Tani Y, Takahashi K, Yumoto N, Hatakeyama M. Quantitative transcriptional control of ErbB receptor signaling undergoes graded to biphasic response for cell differentiation. J Biol Chem. 2007;282:4045–4056. doi: 10.1074/jbc.M608653200. [DOI] [PubMed] [Google Scholar]
- Ogunnaike BA, Ray WH. Process Dynamics, Modeling and Control. New York: Oxford University Press; 1994. [Google Scholar]
- Pellegrino MJ, Stork PJ. Sustained activation of extracellular signal-regulated kinase by nerve growth factor regulates c-fos protein stabilization and transactivation in PC12 cells. J Neurochem. 2006;99:1480–1493. doi: 10.1111/j.1471-4159.2006.04250.x. [DOI] [PubMed] [Google Scholar]
- Pouyssegur J, Lenormand P. Fidelity and spatio-temporal control in MAP kinase (ERKs) signalling. Eur J Biochem. 2003;270:3291–3299. doi: 10.1046/j.1432-1033.2003.03707.x. [DOI] [PubMed] [Google Scholar]
- Rivera VM, Miranti CK, Misra RP, Ginty DD, Chen RH, Blenis J, Greenberg ME. A growth factor-induced kinase phosphorylates the serum response factor at a site that regulates its DNA-binding activity. Mol Cell Biol. 1993;13:6260–6273. doi: 10.1128/mcb.13.10.6260. [DOI] [PMC free article] [PubMed] [Google Scholar]
- Santos SD, Verveer PJ, Bastiaens PI. Growth factor-induced MAPK network topology shapes Erk response determining PC-12 cell fate. Nat Cell Biol. 2007;9:324–330. doi: 10.1038/ncb1543. [DOI] [PubMed] [Google Scholar]
- Sariban E, Luebbers R, Kufe D. Transcriptional and posttranscriptional control of c-fos gene expression in human monocytes. Mol Cell Biol. 1988;8:340–346. doi: 10.1128/mcb.8.1.340. [DOI] [PMC free article] [PubMed] [Google Scholar]
- Sauro HM, Kholodenko BN. Quantitative analysis of signaling networks. Prog Biophys Mol Biol. 2004;86:5–43. doi: 10.1016/j.pbiomolbio.2004.03.002. [DOI] [PubMed] [Google Scholar]
- Soderberg O, Gullberg M, Jarvius M, Ridderstrale K, Leuchowius KJ, Jarvius J, Wester K, Hydbring P, Bahram F, Larsson LG, et al. Direct observation of individual endogenous protein complexes in situ by proximity ligation. Nat Methods. 2006;3:995–1000. doi: 10.1038/nmeth947. [DOI] [PubMed] [Google Scholar]
- Sun H, Charles CH, Lau LF, Tonks NK. MKP-1 (3CH134), an immediate early gene product, is a dual specificity phosphatase that dephosphorylates MAP kinase in vivo. Cell. 1993;75:487–493. doi: 10.1016/0092-8674(93)90383-2. [DOI] [PubMed] [Google Scholar]
- Wang Y, Prywes R. Activation of the c-fos enhancer by the erk MAP kinase pathway through two sequence elements: the c-fos AP-1 and p62TCF sites. Oncogene. 2000;19:1379–1385. doi: 10.1038/sj.onc.1203443. [DOI] [PubMed] [Google Scholar]
- Xing J, Ginty DD, Greenberg ME. Coupling of the RAS-MAPK pathway to gene activation by RSK2, a growth factor-regulated CREB kinase. Science. 1996;273:959–963. doi: 10.1126/science.273.5277.959. [DOI] [PubMed] [Google Scholar]
- Zhang X, Gureasko J, Shen K, Cole PA, Kuriyan J. An allosteric mechanism for activation of the kinase domain of epidermal growth factor receptor. Cell. 2006;125:1137–1149. doi: 10.1016/j.cell.2006.05.013. [DOI] [PubMed] [Google Scholar]
Associated Data
This section collects any data citations, data availability statements, or supplementary materials included in this article.