

Abstract
Bacteria and chronic inflammation are present in squamous cell carcinoma of the head and neck (HNSCC), but their roles in the pathogenesis of HNSCC are unclear. Our studies described here revealed that human monocytes co-cultured short term with HNSCC cells were more likely to express CD16, and CD16+ small mononuclear cells were common in HNSCC specimens. In addition, we identified monocytes as the primary source of LPS-induced IL-6 and TNF-alpha in the monocyte-HNSCC co-cultures. Remarkably, relative to LPS-stimulated monocytes cultured alone, HNSCC cells profoundly suppressed LPS-induced TNF-alpha in monocytes, without compromising IL-6 production. High levels of cytoprotective factors like IL-6 and low levels of TNF-alpha are important for the tumor microenvironment that enables tumor cell survival, affects monocyte differentiation and may contribute to tumor colonization by bacteria. This study provides novel observations that HNSCC cells affect monocyte phenotype and function, which are relevant to the regulation of the HNSCC microenvironment.
Keywords: carcinoma, inflammation, lipopolysaccharide, tumor microenvironment, monocytes, TNF-alpha
Introduction
The mechanisms of HNSCC progression are poorly understood. A prominent component of the HNSCC microenvironment is inflammation, and there is mounting evidence to support a contributory role for inflammation in HNSCC progression. For example, serum levels of IL-6, a cytokine produced during inflammation, were shown to be consistently increased in patients with HNSCC and are associated with cancer progression [1–4]. IL-6 induces activation of signal transducer and activator of transcription-3 (STAT3), a transcription factor important in carcinogenesis and cancer progression, including HNSCC [5–11]. Importantly, there is significant heterogeneity among HNSCC cell lines in the ability to produce IL-6 (among other factors) [12, 13], suggesting that other cells in the HNSCC microenvironment are likely involved in cytokine production. We showed previously that despite HNSCC cell heterogeneity, LPS-stimulated monocyte-HNSCC co-cultures consistently provided soluble factors that induce the activation of STAT3, including IL-6 [13].
The inflammatory infiltrate in HNSCC routinely includes innate immune system monocytes, dendritic cells (DC) and macrophages [13–16], cells that are also normally present in a variety of reactive inflammatory lesions. High numbers of CD68+ monocyte-lineage cells infiltrating HNSCC were shown to directly correlate with lymph node metastasis, extracapsular spread and advanced stage of disease [17]. The mechanisms underlying this association between monocyte-lineage cells and HNSCC progression are not known.
Another component of the HNSCC microenvironment had been overlooked until recently. The mucosal surfaces of HNSCC are colonized by bacteria [18] and more importantly, live Gram-positive (ex. Staph. aureus, Strep. salivarius, etc.) and Gram-negative bacteria (ex. Prevotella sp., Fusobacterium naviforme, etc.) have been found within the superficial and deep aspects of oral SCC [19, 20]. Similarly, numerous live aerobic and anaerobic bacteria were cultured from the vast majority of lymph nodes containing oral SCC metastases, including Gram-positive Strep. salivarius, other Strep. and Staph. spp., Gram-negative Prevotella melaninogenica, Fusobacterium nucleatum, and even enteric species, with the frequency of individual species varying between 3 and 50% [21]. Besides the established role of certain bacteria in carcinogenesis (for example, the Gram-negative H. pylori and gastric carcinoma), there is increasing evidence that supports a contributory role for bacteria and inflammation in carcinogenesis and cancer progression in other gastrointestinal, ovarian and prostate carcinomas [22–26].
The combination of bacterial contamination with monocyte-lineage cells in the HNSCC microenvironment is likely relevant to the pathogenesis of this cancer, because in response to bacterial products, such as LPS, monocytes produce high levels of cytokines, including IL-6 and TNF-alpha [10, 27]. While IL-6 exerts cytoprotective effects on many host cells, including SCC, through STAT3 activation and induction of antiapoptotic molecules [7, 10], TNF-alpha is important for host defense against bacteria. However, high concentrations of TNF-alpha can destroy host cells and tissues [28–31], and even cause death at high systemic doses [32]. Finally, long-standing chronic inflammatory conditions and cancers are associated with an expansion of peripheral blood monocytes, particularly a CD16+ subset [33–38], which is highly phagocytic and can produce high levels of TNF-alpha in response to LPS [36]. The phenotype and function of monocytes associated with long-standing chronic inflammation in the HNSCC microenvironment have not been delineated.
In an effort to begin the dissection of the potential cancer-promoting interactions between HNSCC cells and monocyte-lineage cells in the context of tumor colonization by bacteria, we characterized in vitro the effects of HNSCC cells on the phenotype and function of monocytes from two normal donors. Throughout HNSCC specimens, we found numerous CD16+ small mononuclear cells. In vitro, in the presence of HNSCC cell lines, monocytes had a tendency to gain the expression of Fc receptors CD16 and CD32, shifting the phenotype towards one reminiscent of the CD16+ peripheral blood monocytes mentioned previously (33–38). As anticipated, monocytes were the primary source of IL-6 and TNF-alpha in the LPS-stimulated monocyte-HNSCC co-cultures. Most significantly, we found that HNSCC cells profoundly altered monocyte function by strongly suppressing LPS-induced production of TNF-alpha, but not of IL-6. These observations are novel and reveal that carcinoma cells, through direct effects on monocyte phenotype and function are likely to impact upon the quality of inflammation in the tumor microenvironment and upon the pathogenesis of HNSCC.
Materials and Methods
The study protocol involving human subjects (normal donors of blood) was approved by the University of Iowa Institutional Review Board and by the NYU University Committee on Activities Involving Human Subjects (UCAIHS).
Immunohistochemistry (IHC)
Archival specimens of oral SCC and of non-specific chronic mucositis were retrieved from the Oral and Maxillofacial Pathology Laboratory at the University of Iowa, College of Dentistry. Sections of paraffin embedded tissue were mounted on aminosilane-coated slides (Newcomer Supply, Middleton, WI) and stained using standard IHC by employing the Ultra Vision horseradish peroxidase-diaminobenzidine (HRP-DAB) Detection System (Lab Vision Corp., Fremont, CA). Briefly, after antigen retrieval (if indicated for the specific primary antibody) and blocking endogenous peroxidase, sections were incubated with primary antibodies: anti-CD16 (2H7, mouse IgG2a, BioGenex, San Ramon, CA), anti-CD1a clone O10 (Immunotech, Marseille, France) or negative control mouse IgG (Lab Vision Corp.). This was followed by incubations with goat-anti-mouse biotinylated antibodies, then with avidin-peroxidase, and finally with DAB substrate, all separated by multiple washes with PBS. Sections were counterstained with Mayer's hematoxilin (Fisher Scientific, Waltham, MA). The sections were cover-slipped with Permount (Fisher Scientific).
Cells
HNSCC Cells and Keratinocytes
We selected three established human HNSCC cell lines Cal27 (tongue; American Type Culture Collection, ATCC, Rockville, MD), FaDu (pharynx; ATCC), and 1483 (oral cavity; gift from Dr. P. Sacks, NYU, NYC); primary tonsillar keratinocytes HTE1163 passages four to seven, and human telomerase-immortalized tonsillar keratinocytes TertAd7 (gifts from Dr. A. Klingelhutz and Dr. J. Lee, U. of Iowa, Iowa City). The HNSCC cell lines were selected for this study because of the low intrinsic IL-6 production [13]. HNSCC cell lines were grown in DMEM/F12 (Invitrogen-GIBCO, Grand Island, NY) with 10% heat-inactivated fetal bovine serum (FBS) (Hyclone, Logan, UT). Keratinocytes HTE1163 and TertAd7 were grown in Keratinocyte Serum-Free Medium (KSFM) with 0.2 ng/ml epidermal growth factor and 30 μg/ml bovine pituitary extract (Invitrogen-GIBCO). Cell lines repeatedly tested negative for mycoplasma (ATCC). All cell culture plastic ware and culture reagents were certified endotoxin low or free.
Monocytes
Monocytes were purified from peripheral blood mononuclear cells from two normal donors. First, monocytes were enriched with RosetteSep™ Monocyte Enrichment Cocktail and centrifugation through Ficoll-Paque Plus (StemCell Technologies, Vancouver, BC), to approximately 80% purity. For further enrichment, monocytes were plated at 2×10⁵ cells/ml in twelve- or six-well plates, allowed to adhere to plastic for 35–40 min at 37°C, and remaining unwanted nucleated cells and platelets were washed out. Purified monocytes were 95–99% CD14+ and 99% CD11c+.
Experimental Conditions
After monocyte purification, 2×10⁵ keratinocytes or HNSCC cells were added to 2×10⁵ monocytes and also plated without monocytes in their respective culture media with 10% FBS. Monocytes were also plated without keratinocytes or HNSCC cells, but otherwise received the same media changes as the co-cultures. Each experimental culture was set-up in duplicate. After 5 h, when the keratinocytes and HNSCC cells attached, the media were replaced with serum-free X-vivo15 containing gentamycin (Cambrex Bio Science Inc., Walkersville, MD), and half the wells received 200 ng/ml E. coli LPS (026:B6, 5.67 EU/ng, prepared by TCA precipitation and gel filtration, γ-irradiated, protein- and nucleic acid-free; Sigma Aldrich, St Louis, MO). After a three-day culture, the cells and culture supernatants were collected. The cells were stained and analyzed for surface phenotype, and the supernatants were centrifuged, transferred to new vials and stored at −80°C for 2–4 weeks prior to analysis by ELISA and by bioassays.
In experiments to assess intracellular cytokine expression, monocyte-HNSCC (or keratinocyte) co-cultures were incubated for one, two or three days, as indicated, then stimulated for six hours with 200 ng/ml LPS in the presence of Brefeldin A (4 ug/ml; Sigma Aldrich) to inhibit secretion. The cells were then stained for surface phenotype and for intracellular cytokines IL-6 and TNF-alpha to be analyzed by flow cytometry.
ELISA
ELISA for IL-6 (Pierce Endogen, Rockford, IL and Duoset, R&D Systems, Minneapolis, MN) and for TNF-alpha (Duoset, R&D Systems) were performed according to manufacturer instructions. Briefly, Nunc MaxiSorp™ 96-well plates were coated with cytokine-specific antibodies, blocked, and incubated sequentially with standards or sample supernatants (in triplicate), followed by biotinylated cytokine-specific antibodies, avidin-conjugated HRP and tetramethyl benzidine (TMB) substrate (BioFX Laboratories, Inc., Owings Mills, MD). Optical density at 450–650 nm or 450–540 nm, as recommended by the manufacturers (Powerwave X, Bio-Tek Instruments, Inc., Winooski, VT) was converted into concentration using corresponding standard curves.
Flow Cytometry
Antibodies
All primary antibodies were fluorochrome-labeled murine IgG1, IgG2a or IgG2b, as follows: anti-CD11c-PE clone BU15 (mIgG1); anti-CD14-Cy5-PE clone RMO52 (mIgG2a), anti-CD16-PE clone 3G8 (mIgG1) (Immunotech, Marseille, France), anti-CD11c-Cy5-PE clone B-ly6 (mIgG1), anti-CD16-Cy5-PE clone 3G8 (mIgG1), anti-HLA-DR-FITC clone Tu39 (mIgG2a) (BD Pharmingen, San Jose, CA), anti-CD32-biotin clone 7.3 (mIgG1), anti-CD64-biotin clone 10.1 (mIgG1) (Ancell Cooperation, Bayport, MN), anti-TNF-alpha-PE clone MAb11 (mIgG1), anti-IL-6-PE clone 1936 (mIgG2b) (R&D Systems). Control antibodies were isotype and fluorochrome-matched mIgGs (Southern Biotech Associates, Inc., Birmingham, AL; BD Pharmingen).
Flow Cytometry
Flow cytometry was performed as described previously [39]. Briefly, cells were washed with cold FACS buffer. Fc receptors were blocked by incubating cells with normal mouse serum (Caltag, Invitrogen, Carlsbad, CA) for 10 min., and either fluorochrome-labeled, biotinylated or unlabeled primary antibodies were added for 20 min. on ice. Secondary fluorochrome-labeled antibodies or streptavidin-fluorochrome conjugates were used when necessary. The cells were fixed with 2% paraformaldehyde in PBS, pH 7.4. For intracellular staining, after fixation, cells were washed with permeabilization buffer (1% saponin in FACS buffer) and stained with PE-labeled anti IL-6 or anti-TNF-alpha antibodies suspended in permeabilization buffer. Data were collected on FACScan flow cytometer using CellQuest software and analyzed using FlowJo software (TreeStar, Ashland, OR). Routinely, 20,000–40,000 events were collected per sample.
Statistical Analysis
For each experiment, the levels of monocyte CD16, CD32 and CD14 expression were determined as ratios of the CD16, CD32 and CD14 mean fluorescence intensities (MFI) to the corresponding negative control antibody MFI on monocytes, in each of the respective cultures. Donor 1 and Donor 2 results, respectively, were analyzed statistically by comparing the levels of each receptor expression on monocytes co-cultured with keratinocytes or HNSCC cells to those on monocytes cultured alone (control). In addition, the levels of each receptor on monocytes co-cultured with HNSCC cells were compared to those on monocytes co-cultured with keratinocytes.
Similarly, ELISA data from multiple experiments for each donor were combined. The LPS-induced secretion of IL-6 and TNF-alpha in the presence of keratinocytes or HNSCC cells was compared to LPS-induced cytokine secretion by monocytes cultured alone (control). In addition, LPS-induced cytokine secretion in the presence of HNSCC cells was compared to that in the presence of each of the keratinocyte lines.
One-way analysis of variance using SAS 9.1 GLM procedure that accounts for unbalanced data was performed for group comparisons of receptor expression levels and group comparisons of the ELISA data for IL-6 and TNF-alpha. To adjust for multiple comparisons, the two-sided p-value = 0.01 was used to determine statistical significance. Because sample sizes were modest, the overall tests for group differences were confirmed using the nonparametric Kruskal-Wallis test.
Results
HNSCC Cells Affect the Phenotype of Normal Monocytes
Although it is clear that the HNSCC microenvironment is typically associated with ongoing chronic inflammation, which consistently includes numerous monocyte-lineage cells [14–17], the effects of HNSCC cells on normal monocyte phenotype have not been defined. To address this question, we performed in vitro studies using monocytes from normal donors and established HNSCC cell lines. Three-day co-cultures were selected for most experiments, because in general, cytokine cocktails and other soluble factors exert their effects on monocyte differentiation in two to four days, and the cells remain healthy and functional without necessitating the replacement of media. Monocytes from two normal donors co-cultured with HNSCC cells Cal27, 1483 or FaDu maintained expression of CD14 and HLA-DR (Fig. 1), and remained CD11c-positive (Fig. 6) and DC-SIGN-negative (data not shown), consistent with the monocyte phenotype. In addition, these monocytes tended to gain expression of FcγRIII (CD16) and FcγRII (CD32), and had essentially no FcγRI (CD64) (Fig. 1). The phenotype of monocytes co-cultured with immortalized keratinocytes TertAd7 (Fig. 1) was very similar to that of monocytes co-cultured with primary keratinocytes HTE1163 (not shown). In distinction from monocyte-HNSCC co-cultures, monocytes in the monocyte-keratinocyte co-cultures expressed some CD64. While monocytes from the two donors differed in the levels of individual surface markers, the patterns of receptor expression were essentially the same.
Fig. 1.
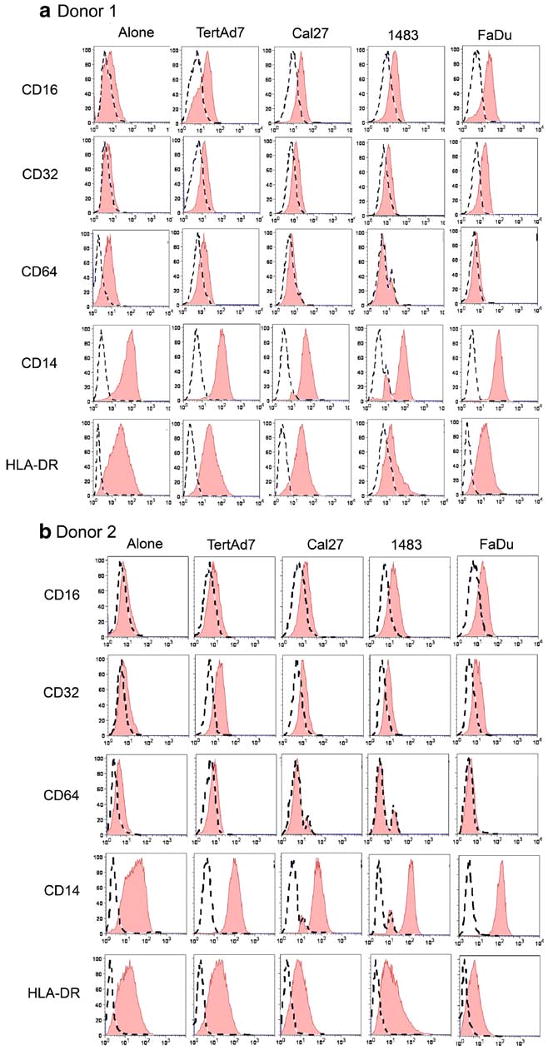
HNSCC cells and keratinocytes affect monocyte phenotype in vitro. Monocytes from Donor 1 (a) and Donor 2 (b) were cultured alone or co-cultured with keratinocytes or HNSCC cells for up to 3 days and evaluated by flow cytometry for cell-surface phenotype, as described in the “Materials and Methods”. The results are representative of at least three independent experiments for each donor.
Fig. 6.
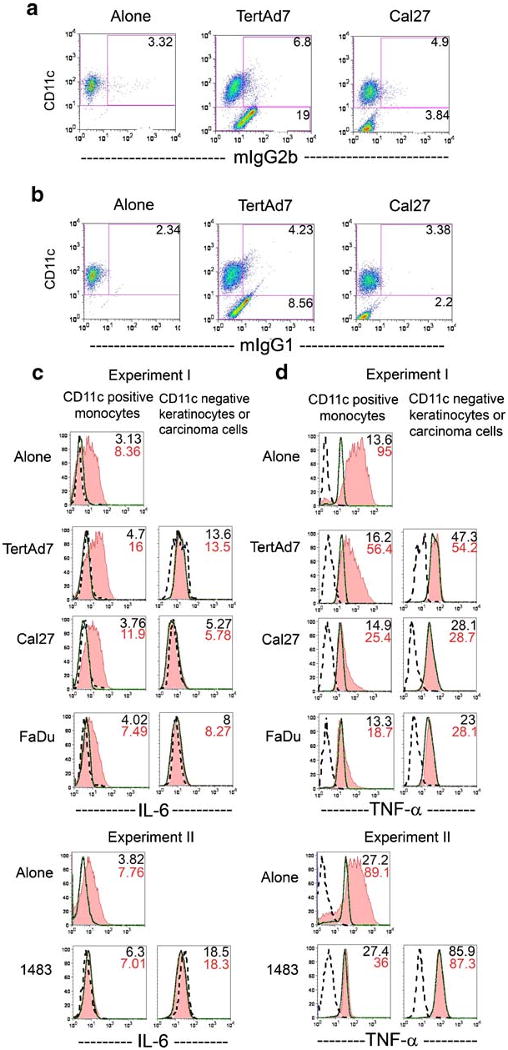
Intracellular IL-6 and TNF-alpha in Donor 1 monocytes, in keratinocytes and in HNSCC cells. Panels a and b are examples of controls and flow cytometry dot plots. The cells were cultured for 3 days alone or in co-cultures, stimulated with LPS for 6 h in the presence of Brefeldin A, labeled with anti-CD11c-Cy-5-PE antibodies, briefly fixed, permeabilized and stained intracellularly with anti-IL-6-PE (c) or its respective negative control mIgG2b-PE (a and c). Alternatively, intracellular staining was performed with anti-TNF-alpha-PE antibodies (d) or the respective negative control mIgG1-PE (b and d). Panels c and d show overlay histograms for CD11c+ cells (monocytes, left column of histograms) and CD11cneg cells (keratinocytes or HNSCC cells, right column). Dotted line = negative control; solid thick line = cytokine signal without LPS stimulation; shaded histogram = cytokine signal with LPS stimulation. Mean fluorescence intensities (MFI) of the IL-6 and TNF-alpha signals are shown in the upper right corner of each plot, in the absence of LPS (top number) and in the presence of LPS (bottom number). Results are representative of at least 3 independent experiments.
Because the expression of CD16 on monocytes is associated with a functionally distinct subset, we performed statistical analysis of the levels of monocyte CD16 expression in the presence of keratinocytes or HNSCC cells relative to CD16 expression on monocytes cultured alone (Table 1). While CD16 expression on monocytes co-cultured with keratinocytes (immortalized or primary) was not statistically different from that on monocytes cultured alone for either donor, Donor 1 monocytes had statistically significantly higher CD16 levels after exposure to any of the three HNSCC lines. For Donor 2, monocyte CD16 expression after co-culture with Cal27 or 1483 increased, but did not reach statistical significance. FaDu did induce statistically significant upregulation of CD16 on Donor 2 monocytes.
Table 1.
Comparison of CD16 and CD32 Expression Levels (Mean Fluorescence Intensity, MFI) on Monocytes From Donor 1 (A) and Donor 2 (B) After 3-day Cultures Alone (“None”) or Co-cultures with Keratinocytes (“TertAd7”, “HTE1163”) or HNSCC Cells (“Cal27”, “1483”, “FaDu”)
| Co-culture with keratinocytes or HNSCC cells | Monocyte relative CD16 | P value of multiple comparisons | Monocyte relative CD32 | P value of multiple comparisons | |||
|---|---|---|---|---|---|---|---|
| MFI ± SD | “None” vs. all other | “TertAd7” vs. HNSCC | “HTE1163” vs. HNSCC | MFI ± SD | “None” vs. all other | “TertAd7” vs. HNSCC | |
| A. Donor 1 | |||||||
| None | 1.63±0.29 | – | – | – | 1.28±0.15 | – | – |
| TertAd7 | 1.93±0.69 | 0.4904 | – | – | 2.21±0.16 | 0.0089a | – |
| HTE1163 | 1.64±0.56 | 0.9954 | – | – | nd | nd | nd |
| Cal27 | 2.96±0.5 | 0.0054a | 0.0309 | 0.0125 | 1.88±0.24 | 0.0735 | 0.304 |
| 1483 | 3.28±0.81 | 0.0021a | 0.0112 | 0.0049a | 1.76±0.32 | 0.1433 | 0.1697 |
| FaDu | 3.93±0.84 | <.0001a | 0.0003a | 0.0002a | 2.72±0.89 | 0.0003a | 0.1158 |
| B. Donor 2 | |||||||
| None | 1.42±0.06 | – | – | nd | 1.35±0.28 | – | – |
| TertAd7 | 2.12±0.73 | 0.2644 | – | nd | 3.05±0.61 | 0.0171 | – |
| Cal27 | 2.68±0.78 | 0.0598 | 0.3693 | nd | 2.58±1.05 | 0.0661 | 0.4467 |
| 1483 | 2.47±0.77 | 0.1085 | 0.5748 | nd | 1.81±0.17 | 0.4569 | 0.064 |
| FaDu | 3.6±0.94 | 0.0043a | 0.0318 | nd | 2.61±1.06 | 0.0606 | 0.4757 |
The data are a composite of 3–5 independent experiments per cell line. nd not done
statistically significant at p=0.01
Similar statistical analysis of CD32 expression revealed that the increase in CD32 expression relative to control monocytes cultured alone was statistically significant only for Donor 1 in the presence of only two cell lines—keratinocytes and HNSCC FaDu. The changes in CD14 were not statistically significant (Fig. 1 and data not shown), consistent with the preservation of monocyte phenotype. Together, these results indicate that HNSCC cells can affect the monocyte phenotype, and the extent of this effect varies between individuals, while the patterns are similar.
These in vitro data appear to be supported by our observations in specimens of oral SCC, where we found numerous CD16+ cells throughout the lesions (Fig. 2a). Many CD16+ mononuclear cells in the epithelial areas had dendritic morphology, matching the characteristics and distribution of CD1a+ DC. The latter observation is of interest, because in vitro, CD16+ monocytes were shown to preferentially differentiate into CD16+ DC [40], and monocytes were also identified in the murine system as the precursors of mucosal DC [41]. Similarly, CD16+ mononuclear cells, including cells with dendritic morphology, were found in oral mucosal specimens without premalignant or malignant epithelial change, consistent with our observations on monocytes co-cultured with keratinocytes in vitro (Fig. 2b). The morphology of the CD16+ round mononuclear cells with little cytoplasm is suggestive of either monocytes or NK cells. However, cell-surface CD56 expression in oral mucosal specimens was exceedingly rare (data not shown), supporting the interpretation that the round mononuclear CD16+ cells are more likely to be monocytes.
Fig. 2.
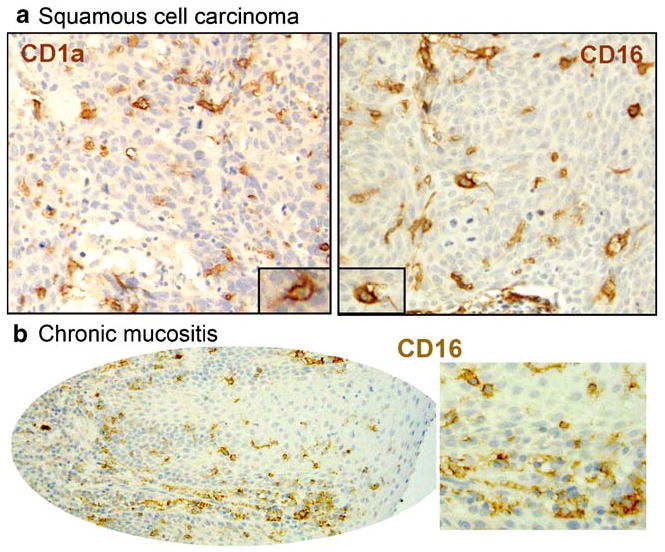
Morphology and distribution of CD16+ cells in oral mucosal samples. Sections of archival specimens were stained by immunohistochemistry for CD1a or for CD16. CD1a+ cells (left) and CD16+ cells (right) have brown cell-surface labeling, and the nuclei are counterstained blue. a Oral squamous cell carcinoma (OSCC) samples contain CD16+ cells with dendritic morphology that are similar in morphology and distribution to CD1a+ DC. b Similar to SCC, CD16+ round cells and cells with dendritic morphology are present in inflamed mucosa in the absence of pre-malignant/malignant epithelial change.
Secretion of TNF-alpha, but not of IL-6, is Compromised in LPS-stimulated Monocyte-HNSCC Co-cultures
As HNSCC cells themselves are heterogeneous in the ability to produce soluble factors, such as IL-6 [12, 13], while monocytes produce large amounts of IL-6 and TNF-alpha in response to microbial products [10, 27], we examined IL-6 and TNF-alpha production in the monocyte-HNSCC and in monocyte-keratinocyte co-cultures in response to stimulation with bacterial products. The three selected HNSCC lines were similar to keratinocytes in one aspect important for this study, as they produced little IL-6 spontaneously, though Cal27 cells increased IL-6 production when stimulated with LPS [13]. To model an association with Gram-negative bacteria, we used highly pure E-coli LPS.
Representative ELISA results are shown in Fig. 3. As anticipated, monocytes cultured alone (labeled “none” in the figure) produced high levels of IL-6 in response to LPS, but not in the absence of LPS. Similarly, keratinocytes and HNSCC cell lines were unproductive when cultured in media only. Some increases in IL-6 production were detected in LPS-stimulated Cal27 cultures and in LPS-free monocyte-keratinocyte TertAd7 co-cultures, consistent with all our previous studies (13 and data not shown). Most importantly, in all monocyte-keratinocyte and monocyte-HNSCC co-cultures, LPS induced high IL-6 levels that were comparable to, or higher than, LPS-induced IL-6 levels when monocytes were cultured alone. Similar to observations with CD16 expression, the general patterns in IL-6 production for the two donors were similar, although Donor 1 monocytes typically produced more IL-6 in response to LPS, than did Donor 2 monocytes.
Fig. 3.
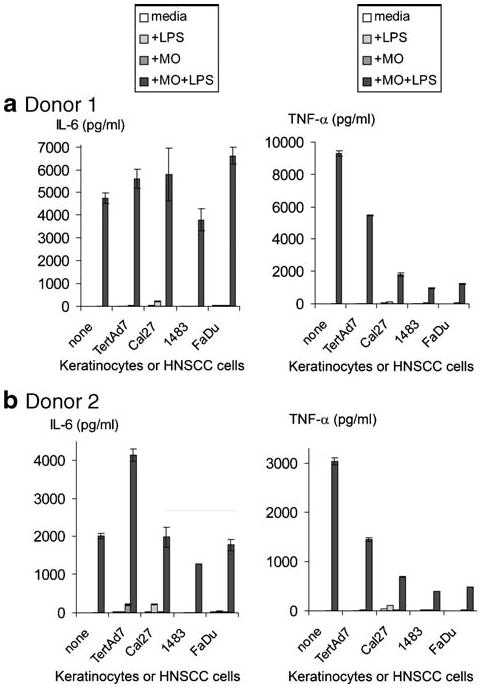
IL-6 and TNF-alpha production by monocytes, keratinocytes and HNSCC cells in the conditions indicated. Monocytes from Donor 1 (a) and Donor 2 (b), keratinocytes and HNSCC cells were cultured alone or in co-cultures, as indicated, with or without 200 ng/ml LPS for 3 days. Supernatants were stored frozen at −80°C followed by ELISA. “None”—no keratinocytes or HNSCC cells (just monocytes +/− LPS).
For statistical analysis, we compared ELISA data from all experiments for each donor, respectively. The levels of IL-6 induced by LPS in monocyte-keratinocyte and monocyte-HNSCC co-cultures were compared to IL-6 induced by LPS in monocytes cultured alone, i.e. control (Fig. 4a). The general patterns of responses were similar between donors, although some individual differences were apparent. For Donor 1, there were no statistically significant differences in LPS-induced IL-6 levels in the monocyte co-cultures with keratinocytes or HNSCC cells relative to control. For Donor 2, IL-6 levels in LPS-treated monocyte-keratinocyte TertAd7 co-cultures were significantly higher than in control monocyte-LPS cultures (mean 175% of control, p< 0.001), while monocyte-FaDu-LPS co-cultures were less productive than control (mean 63% of control, p=0.0275). Yet, as seen with Donor 1 monocytes, LPS-stimulated Donor 2 monocyte co-cultures with Cal27 or 1483 cells produced IL-6 levels not significantly different from the control (p=0.99 and p=0.099, respectively). Therefore, the optimal conditions for inducing high levels of IL-6 required at least monocytes and LPS. Moreover, keratinocytes and HNSCC cells did not suppress IL-6 output, and sometimes even enhanced it.
Fig. 4.
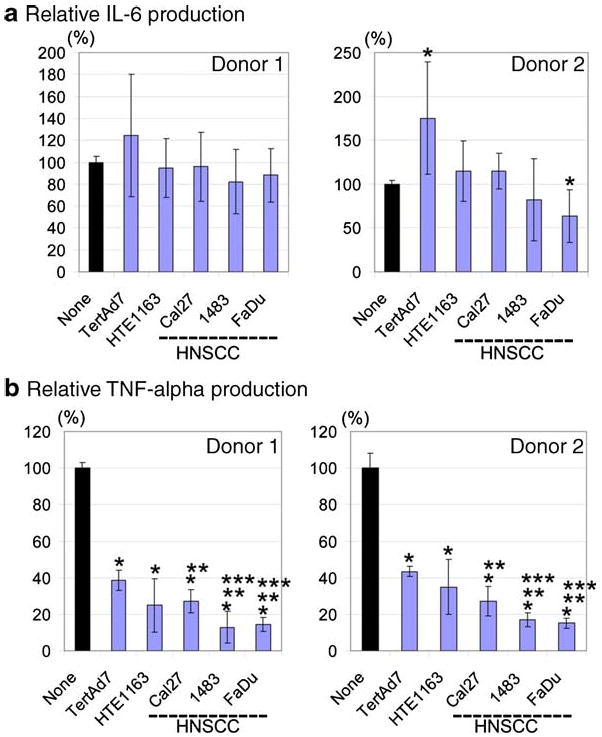
Relative levels of IL-6 (a) and TNF-alpha (b) in the supernatants of LPS-stimulated monocyte co-cultures with keratinocytes or HNSCC cells as a percent of control LPS-stimulated monocytes cultured alone. For each donor, combined IL-6 ELISA data and TNF-alpha ELISA data, respectively, from 3 to 5 independent experiments were analyzed statistically to determine the levels of cytokine production in LPS-stimulated monocyte co-cultures with keratinocytes or HNSCC cells, relative to control LPS-stimulated monocytes cultured alone (100%). In addition, cytokine levels induced by LPS in the presence of HNSCC cells (Cal27, 1483, FaDu) were evaluated relative to those produced in the presence of keratinocytes (TertAd7 and HTE1163). Statistical analysis was performed using SAS 9.1 GLM procedure for one-way analysis of variance. For multiple comparisons, the two-sided p-value = 0.01 was used. * - Statistically significant difference from the control LPS-stimulated monocytes cultured alone. ** - Statistically significant difference from LPS-monocyte-TertAd7 co-cultures. *** - Statistically significant difference from LPS-monocyte-HTE1163 co-cultures.
Similar to the IL-6 data, secreted TNF-alpha levels in all LPS-free cultures were very low or undetectable (Fig. 3). As predicted, LPS induced high levels of soluble TNF-alpha when monocytes from either donor were cultured alone (control). However, in striking contrast to IL-6, TNF-alpha production in response to LPS in all monocyte-HNSCC co-cultures was 73–87% lower than in the control LPS-stimulated monocytes cultured alone (p<0.0001 in all cases), which was a four to eight-fold reduction for Donor 1 and five to ten-fold reduction for Donor 2 (Fig. 4b). Although absolute TNF-alpha levels were consistently higher overall for Donor 1 than for Donor 2, the patterns and percent suppression were remarkably similar between donors. Keratinocytes caused somewhat less, yet significant suppression (61–75% reduction for Donor 1 and 57–65% reduction for Donor 2, both p<0.0001). All three HNSCC lines induced significantly more suppression than did immortalized keratinocytes TertAd7 (p<0.001 in all cases). However, relative to primary keratinocytes HTE1163, only 1483 and FaDu were significantly more suppressive (p<0.007, for each cell line for Donor 1 and p<0.0001 for each cell line for Donor 2; Fig. 4b). Together, these data indicate that without microbial products, such as LPS, monocyte-keratinocyte and monocyte-HNSCC interactions do not consistently yield significant levels of cytokines. Moreover, both HNSCC cells and keratinocytes selectively interfere with LPS-induced production of TNF-alpha, but not of IL-6.
Notably, the same pattern was apparent throughout the culture period, i.e. one, two and three days after stimulation with LPS (Fig. 5a). In addition, the pattern of high IL-6 vs. low TNF-alpha production was evident irrespective of the variation in LPS doses ranging from 2 to 2,000 ng/ml (Fig. 5b).
Fig. 5.
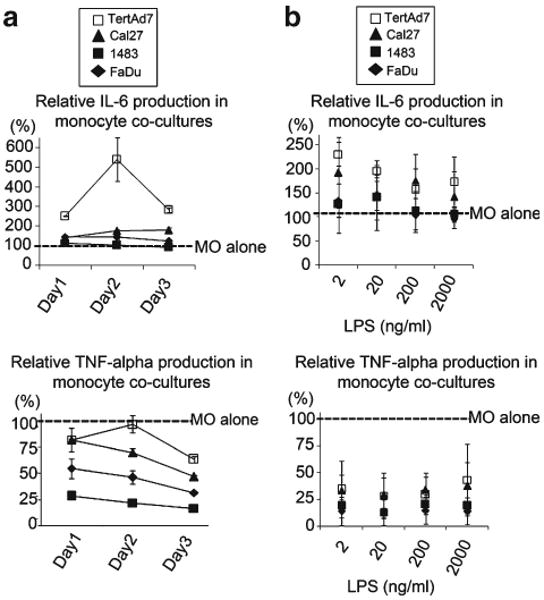
Relative IL-6 and TNF-alpha production with respect to time course (a) and LPS dose titration (b). a Donor 1 monocytes were cultured alone or co-cultured with keratinocytes (TertAd7) or HNSCC cells, and 200 ng/ml LPS was added on day 0. Culture supernatants were collected and analyzed 1, 2 and 3 days after LPS stimulation. LPS-induced IL-6 and TNF-alpha production, respectively, on each day of monocyte co-cultures is shown as percent of that produced in LPS-stimulated monocytes cultured alone. The results are representative of two independent experiments. b Donor 1 monocytes were cultured alone or co-cultured with keratinocytes (TertAd7) or HNSCC cells and stimulated on day 0 with 2, 20, 200 and 2,000 ng/ml LPS. Culture supernatants were collected 3 days after LPS stimulation. LPS-induced IL-6 and TNF-alpha production in monocyte co-cultures is shown relative to corresponding LPS-stimulated monocytes cultured alone. Results shown are from 3 independent experiments.
Monocytes Are the Primary Source of IL-6 and TNF-alpha in LPS-stimulated Monocyte-HNSCC and Monocyte-Keratinocyte Co-cultures, and the Monocyte Intracellular Cytokine Levels Consistently Correlate with Secreted Levels
The sources of soluble factors, such as IL-6 and TNF-alpha, in HNSCC lesions have not been investigated previously. As the background IL-6 levels in keratinocyte and HNSCC cultures were low, monocytes were likely the main source of IL-6 in the co-cultures. Indeed, intracellular staining for IL-6 revealed that CD11c-negative cells, i.e. keratinocytes and HNSCC cells, had little if any baseline intracellular IL-6 signal. Even though LPS can induce some IL-6 secretion in some HNSCC (Cal27), the change in Cal27 intracellular signal was very small (Figs. 6c and 7a, right histograms). The CD11c+ cells, i.e. monocytes, expressed low levels of intracellular IL-6 after three days in culture, both in the presence and absence of keratinocytes or HNSCC cells. However, intracellular IL-6 signal in monocytes increased markedly in the presence of LPS (Figs. 6c and 7a, left histograms). The MFI of monocyte intracellular IL-6 strongly correlated with secreted IL-6 (compare with Fig. 3). We therefore concluded that monocytes were responsible for most of the IL-6 secreted, and LPS, but not HNSCC cells, was the major inducer of IL-6.
Fig. 7.
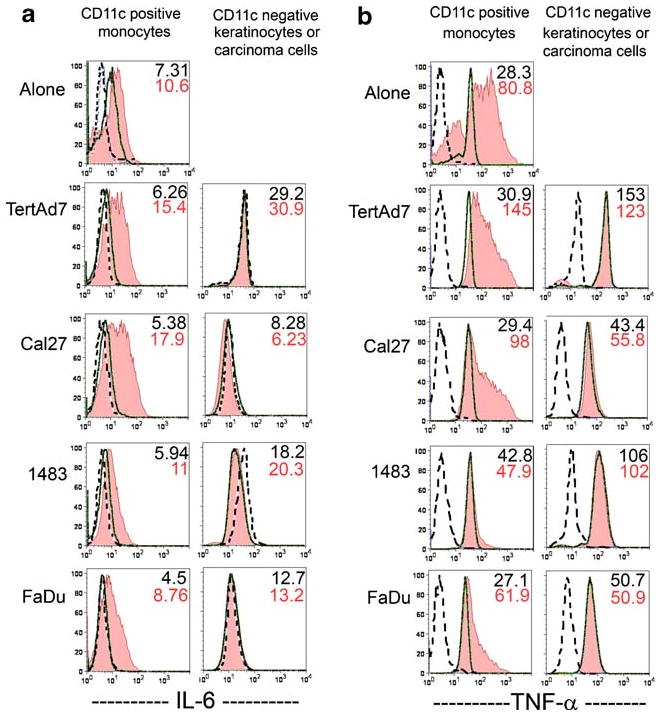
Intracellular IL-6 and TNF-alpha in Donor 2 monocytes, in keratinocytes and in HNSCC cells. The experiments were conducted as described in legend to Fig. 6 and flow cytometry analysis was the same as described in Fig. 6. a Intracellular IL-6 in CD11c+ cells (monocytes, left column of histograms) and CD11cneg cells (keratinocytes or HNSCC cells, right column). b Intracellular TNF-alpha in CD11c+ cells (left column) and in keratinocytes or HNSCC cells (right column). Cytokine signal MFI is shown in the upper right corner of each plot: without LPS (top number) and with LPS (bottom number). Results are representative of three independent experiments.
While the background of cell staining with anti-TNF-alpha antibody in all unstimulated cells was uniformly higher than the negative control antibody background, it did not reflect the levels of soluble TNF-alpha, which were not detectable, as we showed earlier. Importantly, anti-TNF-alpha antibody binding in the CD11c− HNSCC cells and keratinocytes remained unchanged in all the conditions tested. In contrast, as in the case of IL-6, the patterns of LPS-stimulated monocyte intracellular TNF-alpha paralleled those of secreted TNF-alpha. Depending upon the donor, LPS-stimulated monocytes cultured alone (control) had three-to-seven times higher intracellular TNF-alpha signal over the unstimulated background (Figs. 6d and 7b), when all CD11c+ cells were analyzed, including the small TNF-alpha-negative subset. However, LPS induced less than two-fold increase in intracellular TNF-alpha MFI over the unstimulated background when monocytes were co-cultured with HNSCC cells. Again, keratinocytes had a less profound negative effect on monocyte TNF-alpha production than did HNSCC cells (3.5–4.5-fold increase above background). Moreover, the degree of both intracellular and secreted TNF-alpha suppression in monocytes co-cultured with HNSCC Cal27 progressively increased the longer these cells were together before stimulation with LPS (Fig. 8). These results indicate that the primary responsibility for the production of TNF-alpha in the LPS-stimulated co-cultures rested with the monocytes. However, keratinocytes and especially HNSCC cells selectively suppressed TNF-alpha production most likely at the onset of LPS stimulation, and at all times throughout the culture. The suppression was particularly profound if carcinoma cells were first associated with monocytes in the absence of endotoxin.
Fig. 8.
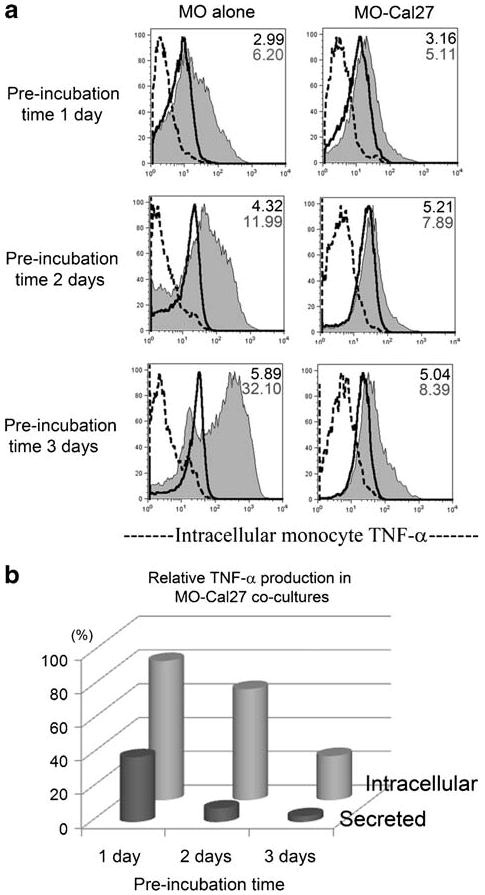
Prolonged LPS-free pre-incubation of monocytes with HNSCC Cal27 cells enhanced the suppression of LPS-induced TNF-alpha production. Donor 1 monocytes were cultured alone or co-cultured with Cal27 for 1, 2 or 3 days before stimulating with 200 ng/ml LPS for 6 h in the presence of Brefeldin A, labeled with anti-CD11c-Cy-5-PE antibodies, briefly fixed, permeabilized and stained with anti-TNF-alpha-PE antibodies or negative control. In parallel wells, each LPS stimulation continued for 24 h and supernatants were evaluated for secreted TNF-alpha by ELISA. a Histograms of intracellular TNF-alpha in monocytes: dotted line = negative control; solid thick line = TNF signal without LPS; shaded histogram = TNF signal with LPS stimulation. MFI of the TNF signals are shown in the upper right corner of each plot, in the absence of LPS (top number) and in the presence of LPS (bottom number). b Relative values of intracellular and secreted TNF-alpha in LPS-stimulated MO-Cal27 co-cultures as percent of control LPS-stimulated monocytes cultured alone. The results are representative of three independent experiments.
Discussion and Conclusions
In this study, we focused on the aspect of inflammation in HNSCC that had received little attention to date, i.e. does association with HNSCC cells alter the ability of monocytes to respond to microbial stimulation and does this association impact upon the monocyte phenotype? To eliminate extraneous factors, we employed an in vitro system that included established HNSCC cell lines free of bacterial product contamination, monocytes from two healthy donors (not preconditioned by cancer in vivo), and highly pure E. coli LPS, which is representative of LPS of most Gram-negative bacteria in exerting its well-known effects on monocytes through toll-like receptor (TLR)4. Observations we believe to be of particular interest in this study are 1) the effects of HNSCC cells on monocyte surface phenotype; 2) evidence that monocytes, rather than HNSCC cells, are a major source of IL-6 when bacterial product LPS is present; 3) HNSCC cell-mediated alteration of monocyte responses to TLR4-specific microbial product, i.e. selective suppression of TNF-alpha; 4) the pattern similarities between the effects of HNSCC cells and of keratinocytes on monocytes.
The phenotypic changes in monocytes exposed for a short period of time to HNSCC cells showed a consistent and interesting trend, particularly significant for Donor 1 and reminiscent of the subset of peripheral blood monocytes that express CD11c, CD14, HLA-DR, CD16, CD32, but not CD64 or DC-SIGN [33–36, 38, 42, 43]. The levels of CD16 expression on the monocytes in our three-day co-cultures were lower than those described on the CD16+ subset of peripheral blood monocytes seen in inflammatory conditions, so it is possible that multiple factors regulate monocyte CD16 expression. Most importantly, the phenotype of monocytes after cultures with HNSCC cells was consistent with the phenotype of cells observed in specimens. In addition, we also find marked upregulation of CD16 on monocyte-derived dendritic cells co-cultured with keratinocytes and HNSCC cells (manuscript in preparation). However, studies of fresh samples are needed to clearly identify all the CD16+ mononuclear cell populations in HNSCC.
We attempted to determine how HNSCC cells regulate CD16 expression on monocytes. Transwell and supernatant transfer experiments revealed that soluble factors produced by carcinoma cells were sufficient to promote CD16 expression (data not shown). We evaluated the role of TGF-beta 1, because it was previously shown to induce CD16 expression on monocytes in vitro [40], and TGF-beta 1 was detected by others in a subset of HNSCC samples [44]. We found little support for any significant role of TGF-beta 1 in the CD16+ monocyte phenotype in our system, as co-cultures with only one HNSCC cell line, Cal27, contained some TGF-beta 1 (both inactive and active forms). In addition, blocking TGF-beta 1 with neutralizing antibodies only minimally reduced CD16 expression on monocytes, irrespective of TGF-beta 1 production or activity levels (data not shown).
CD16 is a low-affinity FcγRIII, a receptor important for the recognition of immune complexes. The significance of Fcγ receptor expression on HNSCC-associated monocytes and DC is unknown. Considering that the HNSCC microenvironment is typically inflamed and contaminated by microbial products, it is likely that immune complexes are present in the tumor microenvironment and may cross-link CD16. The cross-linking of CD16 was shown to protect human monocytes from apoptosis and to strongly induce CCL2 production [45, 46], both of which could contribute to a monocyte-rich microenvironment. A concurrent engagement of FcγRI, II or III with TLR in murine macrophages was shown to interfere with TLR-induced IL-12 production, but enhanced IL-10 production [47], thus skewing the immune response towards a Th2-type. Th2-type response is known to prevail in patients with HNSCC and other cancers [48]. Therefore, it will be important to identify the effects of CD16 crosslinking on monocytes in the context of HNSCC.
A recent study in the mouse showed that the CCR2high Gr1high subset of blood monocytes (which are believed to correspond to the CCR2highCD16− human monocytes) were identified as the precursors of gut and lung mucosal DC [41]. These monocytes also showed plasticity and reverted to Gr1low phenotype (thought to be similar to the CD16+ human monocytes) [41]. Our studies involved human total blood monocytes, 80–90% of which are CCR2highCD16− [41], all of which appeared to up-regulate CD16 expression in the 3-day co-cultures. It is tempting to speculate that our results may reflect a similar phenotypic plasticity in the human monocyte system as a consequence of exposure to epithelial cells, especially noticeable with malignant epithelial cells. The impact of epithelial cells on monocyte differentiation remains to be determined.
As mentioned earlier, IL-6 levels are known to consistently increase in patients with advancing stages of HNSCC [2–4], but the underlying mechanisms are poorly understood. Although some HNSCC cells can constitutively produce significant amounts of IL-6 [13], only three out of nine (i.e. ∼30%) established HNSCC cell lines we tested in vitro were high producers [reference 13 and data not shown]. In our previous study we showed that the poor IL-6 producers responded to IL-6 by activating STAT3, and that supernatants from LPS-monocyte-HNSCC co-cultures strongly induced STAT3 activation, in part due to IL-6 [13]. The lack of HNSCC cell interference with LPS-induced monocyte IL-6 production identified in this study fits well with the pro-survival effect of STAT3 activation in HNSCC cells [9, 10, 13, 48], and with the immunosuppressive effect of STAT3 activation in immune cells that leads to a Th2-type response [49–54]. As increasing numbers of monocyte-lineage cells in HNSCC directly correlate with a more advanced stage [17], and the primary lesions as well as lymph node metastases of HNSCC contain bacteria [18, 19, 21], our data suggest a plausible explanation for the high IL-6 levels in patients with advancing HNSCC.
It is interesting that the overall patterns of monocyte phenotype and functions from the two donors were quite similar, even though the absolute levels of CD16 expression and cytokine production differed. Donor 1 cells were not only more strongly influenced to express CD16, but also consistently, in every experiment, secreted higher levels of cytokines than Donor 2 monocytes (Fig. 3). Although speculative, one potential contributing factor may be that Donor 1 is of considerably more advanced age, when chronic inflammatory conditions associated with increased CD16+ monocyte populations are relatively common. In this regard, epidemiologic studies of age-related changes in monocyte phenotypes and functions would be of significant interest. Whether such quantitative differences would affect the course of pathologic conditions associated with chronic inflammation, including cancer is not known.
A particularly remarkable and novel observation is that, HNSCC cells and to a lesser extent, keratinocytes selectively suppressed LPS-induced monocyte production of TNF-alpha, which became more pronounced throughout the three-day course. A global interference of HNSCC or keratinocytes with monocyte survival and/or ability to function are highly unlikely, because we saw no increase in cell death in any of the co-cultures either microscopically or by flow cytometry, and because the production of IL-6 remained consistently high.
The mechanism of TNF-alpha suppression by HNSCC cells is of great interest. Activated STAT3 was reported to inhibit LPS-induced TNF-alpha production [53–55], and we found at least two STAT3-activating factors in the LPS-stimulated co-cultures: IL-6 (Fig. 3) and IL-10 (data not shown). However, LPS strongly induced production of IL-6 and IL-10 irrespective of HNSCC cell presence, eliminating activated STAT3 as a likely candidate. Recently, hyaluronan, a high-molecular weight glycosaminoglycan produced by HNSCC and many other tumor cells, was shown to deactivate monocyte responses to LPS [56–58], but in contrast to our observations, it similarly affects both TNF-alpha and IL-6 production [56, 57, 59]. In addition, keratinocytes also selectively suppressed TNF-alpha, but not IL-6 production.
Consistent with our findings are recently reported observations that peripheral blood mononuclear cells from patients with HNSCC produced less TNF-alpha in response to phytohemagglutinin than those of healthy individuals [60]. In addition, patients with lung adenocarcinoma had decreased numbers of peripheral blood TNF-alpha-producing monocytes upon LPS stimulation [61]. The mechanisms of TNF-alpha suppression in the circumstances mentioned are not known, but these observations are not surprising, as TNF-alpha toxicity necessitates its tight control during immune responses to microbial insults. Recent studies in mice showed that in the absence of T cells unchecked systemic LPS-induced innate immune system cell release of TNF-alpha was lethal, and that contact with T cells could negatively regulate TNF production in peripheral blood monocytes via an unknown mechanism [32]. Ongoing studies in our laboratory are focused on identifying the molecule(s) responsible for TNF-alpha suppression in our system.
Although the role of TNF-alpha in HNSCC pathogenesis is unclear, its effects may be dose-dependent. HNSCC cells are sensitive to TNF-alpha-induced cell death [31, 62, 63], but low doses of TNF-alpha can also act as an endogenous tumor promoter in some cancers [64]. Low doses of TNF-alpha induced proliferation of ovarian cancer cells and promoted angiogenesis [63]. On the other hand, locoregional administration of high doses of TNF-alpha induced hemorrhagic necrosis, anti-tumor immune responses and inhibited angiogenesis [28, 65–67]. TNF-alpha may drive monocytes to differentiate into CD70+ dendritic cells that are known to persistently induce Th1 responses [68], which would be detrimental to the tumor. In addition, TNF-alpha induces an antimicrobial peptide human beta-defensin (HBD)2 in keratinocytes and in oral SCC cells [69, 70]. Many Gram-positive and Gram-negative bacteria, fungi and viruses are sensitive to HBD2 [69, 70], so the pronounced suppression of TNF-alpha may be a contributing factor to the survival of bacteria in the HNSCC environment.
As a final point of discussion, we were interested in the qualitative similarities between the effects of HNSCC cells and keratinocytes on monocytes. Primary keratinocytes and telomerase-immortalized keratinocytes showed similar outcomes, and the small differences between the two were possibly related to differences in the level of differentiation. While keratinocyte and HNSCC cell numbers at the end of 3-day cultures may well have been different, this alone does not explain the more profound effects of HNSCC cells, as a group, relative to keratinocytes. For example, the HNSCC 1483 cells grow much slower than Cal27 or FaDu cells, yet had perhaps the most striking effects on the monocytes. In this regard, the similarity between benign and malignant epithelial cells suggests that malignant cells tend to preserve, and even enhance, certain functions of their normal counterparts that affect their relationship with the local microenvironment.
The lack of an obvious qualitative contrast between keratinocytes and HNSCC cells in their effects on normal monocytes raises the issue of a potential parallel between wound healing and carcinoma microenvironment. For example, monocytes are necessary for normal wound healing [71, 72], and are also important contributors to the SCC microenvironment [17, 73]. In both instances, there is direct contact between the monocytes and epithelial cells, and STAT3 activation is critical for both wound healing and carcinogen-induced skin cancer development [74]. In addition, although focused on epithelial genes, studies of skin keratinocytes revealed similar genetic regulation in hyperproliferative epithelium of healing wounds and in skin carcinoma, but distinct from normal, undisturbed keratinocytes of intact skin [73]. Finally, the similarities in pathogenesis of wounds and squamous carcinoma are likely enhanced by the presence of microbial products that via TLR regulate the function of many cell types present in the mucosa.
In summary, our data provide a novel insight into the effects of HNSCC cells and oral keratinocytes on monocyte phenotype and functions relevant to HNSCC microenvironment and pathogenesis.
Acknowledgments
We thank the Department of Pathology, UI College of Medicine, and especially Teresa Duling, for access to flow cytometry. We thank Dr. Al Klingelhutz (University of Iowa) and Dr. David Levy (NYU) for the review and critique of the manuscript.
Supported by NIH2RO1DE11139-05A2 (ZBK), American Cancer Society Grant #IN-122V administered by The University of Iowa Holden Comprehensive Cancer Center (ZBK), Anandamahidol Foundation (AL), the University of Iowa Dental Student Research Assistantship program (DH), the Department of Oral Pathology, Radiology and Medicine, College of Dentistry, University of Iowa, and New York University College of Dentistry.
Abbreviations
- CCR
CC chemokine receptor
- DC
Dendritic cell(s)
- DC-SIGN
DC-specific intercellular adhesion molecule 3-grabbing non-integrin
- DMEM
Dulbecco's Modified Eagle's Medium
- ELISA
Enzyme-linked immunosorbent assay
- FACS
Fluorescence-activated cell sorting
- FBS
Fetal bovine serum
- GLM
Generalized linear model
- HBD
Human beta-defensin
- HLA-DR
Human leukocyte antigen-DR (class II)
- HNSCC
Head and neck squamous cell carcinoma
- HRP-DAB
Horseradish peroxidase-diaminobenzidine
- IHC
Immunohistochemistry
- IL
Interleukin
- KSFM
Keratinocyte Serum-Free Medium
- LPS
Lipopolysaccharide
- MFI
Mean fluorescence intensity
- PBS
Phosphate-buffered saline
- SAS
Statistical analysis software
- STAT
Signal transducer and activator of transcription
- TCA
Trichloroacetic acid
- TGF
Transforming growth factor
- TLR
Toll-like receptor
- TMB
Tetramethylbenzidine
- TNF
Tumor necrosis factor
References
- 1.Gallo O, Gori AM, Attanasio M, Martini F, Giusti B, Brunelli T, et al. Interleukin-6 and acute-phase proteins in head and neck cancer. European Archives of Oto-Rhino-Laryngology. 1995;252:159–162. doi: 10.1007/BF00178104. [DOI] [PubMed] [Google Scholar]
- 2.Druzgal CH, Chen Z, Yeh NT, Thomas GR, Ondrey FG, Duffey DC, et al. A pilot study of longitudinal serum cytokine and angiogenesis factor levels as markers of therapeutic response and survival in patients with head and neck squamous cell carcinoma. Head and Neck. 2005;27:771–784. doi: 10.1002/hed.20246. [DOI] [PubMed] [Google Scholar]
- 3.Chen Z, Malhotra PS, Thomas GR, Ondrey FG, Duffey DC, Smith CW, et al. Expression of proinflammatory and proangiogenic cytokines in patients with head and neck cancer. Clinical Cancer Research. 1999;5:1369–1379. [PubMed] [Google Scholar]
- 4.Sparano A, Lathers DM, Achille N, Petruzzelli GJ, Young MR. Modulation of Th1 and Th2 cytokine profiles and their association with advanced head and neck squamous cell carcinoma. Otolaryngology - Head and Neck Surgery. 2004;131:573–576. doi: 10.1016/j.otohns.2004.03.016. [DOI] [PubMed] [Google Scholar]
- 5.Yin W, Cheepala S, Roberts JN, Syson-Chan K, DiGiovanni J, Clifford JL. Active Stat3 is required for survival of human squamous cell carcinoma cells in serum-free conditions. Molecular Cancer. 2006;5:15. doi: 10.1186/1476-4598-5-15. [DOI] [PMC free article] [PubMed] [Google Scholar]
- 6.Buettner R, Mora LB, Jove R. Activated STAT signaling in human tumors provides novel molecular targets for therapeutic intervention. Clinical Cancer Research. 2002;8:945–954. [PubMed] [Google Scholar]
- 7.Hirano T, Ishihara K, Hibi M. Roles of STAT3 in mediating the cell growth, differentiation and survival signals relayed through the IL-6 family of cytokine receptors. Oncogene. 2000;19:2548–2556. doi: 10.1038/sj.onc.1203551. [DOI] [PubMed] [Google Scholar]
- 8.Squarize CH, Castilho RM, Sriuranpong V, Pinto DS, Jr, Gutkind JS. Molecular cross-talk between the NFkappaB and STAT3 signaling pathways in head and neck squamous cell carcinoma. Neoplasia. 2006;8:733–746. doi: 10.1593/neo.06274. [DOI] [PMC free article] [PubMed] [Google Scholar]
- 9.Sriuranpong V, Park JI, Amornphimoltham P, Patel V, Nelkin BD, Gutkind JS. Epidermal growth factor receptor-independent constitutive activation of STAT3 in head and neck squamous cell carcinoma is mediated by the autocrine/paracrine stimulation of the interleukin 6/gp130 cytokine system. Cancer Research. 2003;63:2948–2956. [PubMed] [Google Scholar]
- 10.Hodge DR, Hurt EM, Farrar WL. The role of IL-6 and STAT3 in inflammation and cancer. European Journal of Cancer. 2005;41:2502–2512. doi: 10.1016/j.ejca.2005.08.016. [DOI] [PubMed] [Google Scholar]
- 11.Grandis JR, Drenning SD, Zeng Q, Watkins SC, Melhem MF, Endo S, et al. Constitutive activation of Stat3 signaling abrogates apoptosis in squamous cell carcinogenesis in vivo. Proceedings of the National Academy of Sciences of the United States of America. 2000;97:4227–4232. doi: 10.1073/pnas.97.8.4227. [DOI] [PMC free article] [PubMed] [Google Scholar]
- 12.Woods KV, El-Naggar A, Clayman GL, Grimm EA. Variable expression of cytokines in human head and neck squamous cell carcinoma cell lines and consistent expression in surgical specimens. Cancer Research. 1998;58:3132–3141. [PubMed] [Google Scholar]
- 13.Kurago ZB, Lamubol A, Stetsenko A, De La Mater C, Chen Y, Dawson DV. Lipopolysaccharide-squamous cell carcinoma-monocyte interactions induce cancer-supporting factors leading to rapid STAT3 activation. Head and Neck Pathology. 2008;2:1–12. doi: 10.1007/s12105-007-0038-x. [DOI] [PMC free article] [PubMed] [Google Scholar]
- 14.Ohta M, Kitadai Y, Tanaka S, Yoshihara M, Yasui W, Mukaida N, et al. Monocyte chemoattractant protein-1 expression correlates with macrophage infiltration and tumor vascularity in human esophageal squamous cell carcinomas. International Journal of Cancer. 2002;102:220–224. doi: 10.1002/ijc.10705. [DOI] [PubMed] [Google Scholar]
- 15.Koide N, Nishio A, Sato T, Sugiyama A, Miyagawa S. Significance of macrophage chemoattractant protein-1 expression and macrophage infiltration in squamous cell carcinoma of the esophagus. American Journal of Gastroenterology. 2004;99:1667–1674. doi: 10.1111/j.1572-0241.2004.30733.x. [DOI] [PubMed] [Google Scholar]
- 16.Li C, Shintani S, Terakado N, Nakashiro K, Hamakawa H. Infiltration of tumor-associated macrophages in human oral squamous cell carcinoma. Oncology Reports. 2002;9:1219–1223. [PubMed] [Google Scholar]
- 17.Marcus B, Arenberg D, Lee J, Kleer C, Chepeha DB, Schmalbach CE, et al. Prognostic factors in oral cavity and oropharyngeal squamous cell carcinoma. Cancer. 2004;101:2779–2787. doi: 10.1002/cncr.20701. [DOI] [PubMed] [Google Scholar]
- 18.Sakamoto H, Sasaki J, Nord CE. Association between bacterial colonization on the tumor, bacterial translocation to the cervical lymph nodes and subsequent postoperative infection in patients with oral cancer. Clinical Microbiology & Infection. 1999;5:612–616. doi: 10.1111/j.1469-0691.1999.tb00417.x. [DOI] [PubMed] [Google Scholar]
- 19.Hooper SJ, Crean SJ, Lewis MA, Spratt DA, Wade WG, Wilson MJ. Viable bacteria present within oral squamous cell carcinoma tissue. Journal of Clinical Microbiology. 2006;44:1719–1725. doi: 10.1128/JCM.44.5.1719-1725.2006. [DOI] [PMC free article] [PubMed] [Google Scholar]
- 20.Hooper SJ, Crean SJ, Fardy MJ, Lewis MA, Spratt DA, Wade WG, et al. A molecular analysis of the bacteria present within oral squamous cell carcinoma. Journal of Medical Microbiology. 2007;56:1651–1659. doi: 10.1099/jmm.0.46918-0. [DOI] [PubMed] [Google Scholar]
- 21.Sakamoto H, Naito H, Ohta Y, Tanakna R, Maeda N, Sasaki J, et al. Isolation of bacteria from cervical lymph nodes in patients with oral cancer. Archives of Oral Biology. 1999;44:789–793. doi: 10.1016/s0003-9969(99)00079-5. [DOI] [PubMed] [Google Scholar]
- 22.Kelly MG, Alvero AB, Chen R, Silasi DA, Abrahams VM, Chan S, et al. TLR-4 signaling promotes tumor growth and paclitaxel chemoresistance in ovarian cancer. Cancer Research. 2006;66:3859–3868. doi: 10.1158/0008-5472.CAN-05-3948. [DOI] [PubMed] [Google Scholar]
- 23.Fukata M, Abreu MT. Role of Toll-like receptors in gastrointestinal malignancies. Oncogene. 2008;27:234–243. doi: 10.1038/sj.onc.1210908. [DOI] [PMC free article] [PubMed] [Google Scholar]
- 24.Kundu SD, Lee C, Billips BK, Habermacher GM, Zhang Q, Liu V, et al. The toll-like receptor pathway: A novel mechanism of infection-induced carcinogenesis of prostate epithelial cells. The Prostate. 2008;68:223–229. doi: 10.1002/pros.20710. [DOI] [PubMed] [Google Scholar]
- 25.Santiago C, Pagan B, Isidro AA, Appleyard CB. Prolonged chronic inflammation progresses to dysplasia in a novel rat model of colitis-associated colon cancer. Cancer Research. 2007;67:10766–10773. doi: 10.1158/0008-5472.CAN-07-1418. [DOI] [PubMed] [Google Scholar]
- 26.Huang B, Zhao J, Shen S, Li H, He KL, Shen GX, et al. Listeria monocytogenes promotes tumor growth via tumor cell toll-like receptor 2 signaling. Cancer Research. 2007;67:4346–4352. doi: 10.1158/0008-5472.CAN-06-4067. [DOI] [PubMed] [Google Scholar]
- 27.van der Bruggen T, Nijenhuis S, van Raaij E, Verhoef J, van Asbeck BS. Lipopolysaccharide-induced tumor necrosis factor alpha production by human monocytes involves the raf-1/MEK1-MEK2/ERK1-ERK2 pathway. Infection and Immunity. 1999;67:3824–3829. doi: 10.1128/iai.67.8.3824-3829.1999. [DOI] [PMC free article] [PubMed] [Google Scholar]
- 28.Balkwill FR, Lee A, Aldam G, Moodie E, Thomas JA, Tavernier J, et al. Human tumor xenografts treated with recombinant human tumor necrosis factor alone or in combination with interferons. Cancer Research. 1986;46:3990–3993. [PubMed] [Google Scholar]
- 29.Strangfeld A, Listing J. Infection and musculoskeletal conditions: Bacterial and opportunistic infections during anti-TNF therapy. Best Practice & Research Clinical Rheumatology. 2006;20:1181–1195. doi: 10.1016/j.berh.2006.08.010. [DOI] [PubMed] [Google Scholar]
- 30.Larrick JW, Wright SC. Cytotoxic mechanism of tumor necrosis factor-alpha. Faseb Journal. 1990;4:3215–3223. doi: 10.1096/fasebj.4.14.2172061. [DOI] [PubMed] [Google Scholar]
- 31.Sacchi M, Klapan I, Johnson JT, Whiteside TL. Antiproliferative effects of cytokines on squamous cell carcinoma. Archives of Otolaryngology - Head and Neck Surgery. 1991;117:321–326. doi: 10.1001/archotol.1991.01870150089012. [DOI] [PubMed] [Google Scholar]
- 32.Kim KD, Zhao J, Auh S, Yang X, Du P, Tang H, et al. Adaptive immune cells temper initial innate responses. Nature Medicine. 2007;13:1248–1252. doi: 10.1038/nm1633. [DOI] [PMC free article] [PubMed] [Google Scholar]
- 33.Okamoto H, Mizuno K, Horio T. Circulating CD14+ CD16+ monocytes are expanded in sarcoidosis patients. Journal of Dermatology. 2003;30:503–509. doi: 10.1111/j.1346-8138.2003.tb00424.x. [DOI] [PubMed] [Google Scholar]
- 34.Kawanaka N, Yamamura M, Aita T, Morita Y, Okamoto A, Kawashima M, et al. CD14+, CD16+ blood monocytes and joint inflammation in rheumatoid arthritis. Arthritis and Rheumatism. 2002;46:2578–2586. doi: 10.1002/art.10545. [DOI] [PubMed] [Google Scholar]
- 35.Soares G, Barral A, Costa JM, Barral-Netto M, Van Weyenbergh J. CD16+ monocytes in human cutaneous leishmaniasis: increased ex vivo levels and correlation with clinical data. Journal of Leukocyte Biology. 2006;79:36–39. doi: 10.1189/jlb.0105040. [DOI] [PubMed] [Google Scholar]
- 36.Ziegler-Heitbrock L. The CD14+ CD16+ blood monocytes: Their role in infection and inflammation. Journal of Leukocyte Biology. 2007;81:584–592. doi: 10.1189/jlb.0806510. [DOI] [PubMed] [Google Scholar]
- 37.Grip O, Bredberg A, Lindgren S, Henriksson G. Increased subpopulations of CD16(+) and CD56(+) blood monocytes in patients with active Crohn's disease. Inflammatory Bowel Diseases. 2007;13:566–572. doi: 10.1002/ibd.20025. [DOI] [PubMed] [Google Scholar]
- 38.Saleh MN, Goldman SJ, LoBuglio AF, Beall AC, Sabio H, McCord MC, et al. CD16+ monocytes in patients with cancer: spontaneous elevation and pharmacologic induction by recombinant human macrophage colony-stimulating factor. Blood. 1995;85:2910–2917. [PubMed] [Google Scholar]
- 39.Randolph GJ, Sanchez-Schmitz G, Liebman RM, Schakel K. The CD16(+) (FcgammaRIII(+)) subset of human monocytes preferentially becomes migratory dendritic cells in a model tissue setting. Journal of Experimental Medicine. 2002;196:517–527. doi: 10.1084/jem.20011608. [DOI] [PMC free article] [PubMed] [Google Scholar]
- 40.Varol C, Landsman L, Fogg DK, Greenshtein L, Gildor B, Margalit R, et al. Monocytes give rise to mucosal, but not splenic, conventional dendritic cells. Journal of Experimental Medicine. 2007;204:171–180. doi: 10.1084/jem.20061011. [DOI] [PMC free article] [PubMed] [Google Scholar]
- 41.Tanaka M, Honda J, Imamura Y, Shiraishi K, Tanaka K, Oizumi K. Surface phenotype analysis of CD16+ monocytes from leukapheresis collections for peripheral blood progenitors. Clinical and Experimental Immunology. 1999;116:57–61. doi: 10.1046/j.1365-2249.1999.00869.x. [DOI] [PMC free article] [PubMed] [Google Scholar]
- 42.Ancuta P, Weiss L, Haeffner-Cavaillon N. CD14 +CD16++ cells derived in vitro from peripheral blood monocytes exhibit phenotypic and functional dendritic cell-like characteristics. European Journal of Immunology. 2000;30:1872–1883. doi: 10.1002/1521-4141(200007)30:7<1872::AID-IMMU1872>3.0.CO;2-2. [DOI] [PubMed] [Google Scholar]
- 43.Logullo AF, Nonogaki S, Miguel RE, Kowalski LP, Nishimoto IN, Pasini FS, et al. Transforming growth factor beta1 (TGFbeta1) expression in head and neck squamous cell carcinoma patients as related to prognosis. Journal of Oral Pathology & Medicine. 2003;32:139–145. doi: 10.1034/j.1600-0714.2003.00012.x. [DOI] [PubMed] [Google Scholar]
- 44.Marsh CB, Wewers MD, Tan LC, Rovin BH. Fc (gamma) receptor cross-linking induces peripheral blood mononuclear cell monocyte chemoattractant protein-1 expression: role of lymphocyte Fc(gamma)RIII. Journal of Immunology. 1997;158:1078–1084. [PubMed] [Google Scholar]
- 45.Wang ZQ, Bapat AS, Rayanade RJ, Dagtas AS, Hoffmann MK. Interleukin-10 induces macrophage apoptosis and expression of CD16 (FcgammaRIII) whose engagement blocks the cell death programme and facilitates differentiation. Immunology. 2001;102:331–337. doi: 10.1046/j.1365-2567.2001.01171.x. [DOI] [PMC free article] [PubMed] [Google Scholar]
- 46.Polumuri SK, Toshchakov VY, Vogel SN. Role of phosphatidylinositol-3 kinase in transcriptional regulation of TLR-induced IL-12 and IL-10 by Fc gamma receptor ligation in murine macrophages. Journal of Immunology. 2007;179:236–246. doi: 10.4049/jimmunol.179.1.236. [DOI] [PubMed] [Google Scholar]
- 47.Song JI, Grandis JR. STAT signaling in head and neck cancer. Oncogene. 2000;19:2489–2495. doi: 10.1038/sj.onc.1203483. [DOI] [PubMed] [Google Scholar]
- 48.Lucey DR, Clerici M, Shearer GM. Type 1 and type 2 cytokine dysregulation in human infectious, neoplastic, and inflammatory diseases. Clinical Microbiology Reviews. 1996;9:532–562. doi: 10.1128/cmr.9.4.532. [DOI] [PMC free article] [PubMed] [Google Scholar]
- 49.Diehl S, Rincon M. The two faces of IL-6 on Th1/Th2 differentiation. Molecular Immunology. 2002;39:531–536. doi: 10.1016/s0161-5890(02)00210-9. [DOI] [PubMed] [Google Scholar]
- 50.O'Farrell AM, Liu Y, Moore KW, Mui AL. IL-10 inhibits macrophage activation and proliferation by distinct signaling mechanisms: evidence for Stat3-dependent and -independent pathways. Embo Journal. 1998;17:1006–1018. doi: 10.1093/emboj/17.4.1006. [DOI] [PMC free article] [PubMed] [Google Scholar]
- 51.Cheng F, Wang HW, Cuenca A, Huang M, Ghansah T, Brayer J, et al. A critical role for Stat3 signaling in immune tolerance. Immunity. 2003;19:425–436. doi: 10.1016/s1074-7613(03)00232-2. [DOI] [PubMed] [Google Scholar]
- 52.Williams L, Bradley L, Smith A, Foxwell B. Signal transducer and activator of transcription 3 is the dominant mediator of the anti-inflammatory effects of IL-10 in human macrophages. Journal of Immunology. 2004;172:567–576. doi: 10.4049/jimmunol.172.1.567. [DOI] [PubMed] [Google Scholar]
- 53.Murray PJ. Understanding and exploiting the endogenous interleukin-10/STAT3-mediated anti-inflammatory response. Current Opinion in Pharmacology. 2006;6:379–386. doi: 10.1016/j.coph.2006.01.010. [DOI] [PubMed] [Google Scholar]
- 54.Nishiki S, Hato F, Kamata N, Sakamoto E, Hasegawa T, Kimura-Eto A, et al. Selective activation of STAT3 in human monocytes stimulated by G-CSF: implication in inhibition of LPS-induced TNF-alpha production. American Journal of Physiology Cell Physiology. 2004;286:C1302–C1311. doi: 10.1152/ajpcell.00387.2003. [DOI] [PubMed] [Google Scholar]
- 55.del Fresno C, Otero K, Gomez-Garcia L, Gonzalez-Leon MC, Soler-Ranger L, Fuentes-Prior P, et al. Tumor cells deactivate human monocytes by up-regulating IL-1 receptor associated kinase-M expression via CD44 and TLR4. Journal of Immunology. 2005;174:3032–3040. doi: 10.4049/jimmunol.174.5.3032. [DOI] [PubMed] [Google Scholar]
- 56.Mytar B, Woloszyn M, Szatanek R, Baj-Krzyworzeka M, Siedlar M, Ruggiero I, et al. Tumor cell-induced deactivation of human monocytes. Journal of Leukocyte Biology. 2003;74:1094–1101. doi: 10.1189/jlb.0403140. [DOI] [PubMed] [Google Scholar]
- 57.Franzmann EJ, Schroeder GL, Goodwin WJ, Weed DT, Fisher P, Lokeshwar VB. Expression of tumor markers hyaluronic acid and hyaluronidase (HYAL1) in head and neck tumors. International Journal of Cancer. 2003;106:438–445. doi: 10.1002/ijc.11252. [DOI] [PubMed] [Google Scholar]
- 58.Yasuda T. Hyaluronan inhibits cytokine production by lipopolysaccharide-stimulated U937 macrophages through down-regulation of NF-kappaB via ICAM-1. Inflammation Research. 2007;56:246–253. doi: 10.1007/s00011-007-6168-5. [DOI] [PubMed] [Google Scholar]
- 59.Bose A, Chakraborty T, Chakraborty K, Pal S, Baral R. Dysregulation in immune functions is reflected in tumor cell cytotoxicity by peripheral blood mononuclear cells from head and neck squamous cell carcinoma patients. Cancer Immunity. 2008;8:10. [PMC free article] [PubMed] [Google Scholar]
- 60.Lopez-Gonzalez JS, Avila-Moreno F, Prado-Garcia H, Aguilar-Cazares D, Mandoki JJ, Meneses-Flores M. Lung carcinomas decrease the number of monocytes/macrophages (CD14+ cells) that produce TNF-alpha. Clinical Immunology. 2007;122:323–329. doi: 10.1016/j.clim.2006.11.003. [DOI] [PubMed] [Google Scholar]
- 61.Briskin KB, Fady C, Wang M, Lichtenstein A. Apoptotic inhibition of head and neck squamous cell carcinoma cells by tumor necrosis factor alpha. Archives of Otolaryngology - Head and Neck Surgery. 1996;122:559–563. doi: 10.1001/archotol.1996.01890170091016. [DOI] [PubMed] [Google Scholar]
- 62.Mochimatsu I, Tsukuda M, Furukawa S, Watanabe S, Kubota A, Yanoma S. The sensitivity of head and neck squamous cell carcinomas to tumor necrosis factor-alpha. Biotherapy. 1993;6:239–244. doi: 10.1007/BF01878352. [DOI] [PubMed] [Google Scholar]
- 63.Balkwill F. Tumor necrosis factor or tumor promoting factor? Cytokine and Growth Factor Reviews. 2002;13:135–141. doi: 10.1016/s1359-6101(01)00020-x. [DOI] [PubMed] [Google Scholar]
- 64.Fajardo LF, Kwan HH, Kowalski J, Prionas SD, Allison AC. Dual role of tumor necrosis factor-alpha in angiogenesis. American Journal of Pathology. 1992;140:539–544. [PMC free article] [PubMed] [Google Scholar]
- 65.Wu S, Boyer CM, Whitaker RS, Berchuck A, Wiener JR, Weinberg JB, et al. Tumor necrosis factor alpha as an autocrine and paracrine growth factor for ovarian cancer: Monokine induction of tumor cell proliferation and tumor necrosis factor alpha expression. Cancer Research. 1993;53:1939–1944. [PubMed] [Google Scholar]
- 66.Lejeune FJ. Clinical use of TNF revisited: Improving penetration of anti-cancer agents by increasing vascular permeability. Journal of Clinical Investigation. 2002;110:433–435. doi: 10.1172/JCI16493. [DOI] [PMC free article] [PubMed] [Google Scholar]
- 67.Iwamoto S, Iwai S, Tsujiyama K, Kurahashi C, Takeshita K, Naoe M, et al. TNF-alpha drives human CD14+ monocytes to differentiate into CD70+ dendritic cells evoking Th1 and Th17 responses. Journal of Immunology. 2007;179:1449–1457. doi: 10.4049/jimmunol.179.3.1449. [DOI] [PubMed] [Google Scholar]
- 68.Ganz T. Defensins: Antimicrobial peptides of innate immunity. Nature Reviews Immunology. 2003;3:710–720. doi: 10.1038/nri1180. [DOI] [PubMed] [Google Scholar]
- 69.Joly S, Maze C, McCray PB, Jr, Guthmiller JM. Human beta-defensins 2 and 3 demonstrate strain-selective activity against oral microorganisms. Journal of Clinical Microbiology. 2004;42:1024–1029. doi: 10.1128/JCM.42.3.1024-1029.2004. [DOI] [PMC free article] [PubMed] [Google Scholar]
- 70.Singer AJ, Clark RA. Cutaneous wound healing. New England Journal of Medicine. 1999;341:738–746. doi: 10.1056/NEJM199909023411006. [DOI] [PubMed] [Google Scholar]
- 71.Leibovich SJ, Ross R. role of the macrophage in wound repair. A study with hydrocortisone and antimacrophage serum. American Journal of Pathology. 1975;78:71–100. [PMC free article] [PubMed] [Google Scholar]
- 72.Pedersen TX, Leethanakul C, Patel V, Mitola D, Lund LR, Dano K, et al. Laser capture microdissection-based in vivo genomic profiling of wound keratinocytes identifies similarities and differences to squamous cell carcinoma. Oncogene. 2003;22:3964–3976. doi: 10.1038/sj.onc.1206614. [DOI] [PubMed] [Google Scholar]
- 73.Sano S, Chan KS, DiGiovanni J. Impact of Stat3 activation upon skin biology: A dichotomy of its role between homeostasis and diseases. Journal of Dermatological Science. 2008;50:1–14. doi: 10.1016/j.jdermsci.2007.05.016. [DOI] [PubMed] [Google Scholar]
- 74.Moore MB, Kurago ZB, Fullenkamp CA, Lutz CT. Squamous cell carcinoma cells differentially stimulate NK cell effector functions: The role of IL-18. Cancer Immunology, Immunotherapy. 2003;52:107–115. doi: 10.1007/s00262-002-0361-8. [DOI] [PMC free article] [PubMed] [Google Scholar]