

Abstract
The energetics, stoichiometry, and structure of poly(amidoamine) (PAMAM) dendrimer-phospholipid interactions were measured with isothermal titration calorimetry (ITC), transmission electron microscopy (TEM), atomic force microscopy (AFM), dynamic light scattering (DLS), and molecular dynamics (MD) simulations. Dendrimers of sixth-generation and smaller interacted with the lipids at an average stoichiometry and enthalpy proportional to the number of primary amines per dendrimers (4.5 ± 0.1 lipids/primary amine and 6.3 ± 0.3 kJ/mol of primary amines, respectively). Larger dendrimers, however, demonstrated a decreased number of bound lipids and heat release per primary amine, presumably due to the steric restriction of dendrimer deformation on the lipid bilayer. For example, eighth-generation PAMAM dendrimers bound to 44% fewer lipids per primary amine and released 63% less heat per primary amine as compared to the smaller dendrimers. These differences in binding stoichiometry support generation-dependent models for dendrimer-lipid complexation, which are consistent with previously observed generation-dependent differences in dendrimer-induced membrane disruption. Dendrimers of seventh-generation and larger bound to lipids with an average stoichiometry consistent with each dendrimer having been wrapped by a bilayer of lipids, where as smaller dendrimers did not.
Keywords: poly(amidoamine) dendrimer, phospholipid bilayer, membrane disruption, nanotoxicity, membrane permeability
Understanding the interaction of nanoparticles with the plasma membrane of living cells is of fundamental importance for designing medical therapeutics, as well as for predicting effects from environmental exposure. Poly(amidoamine) (PAMAM) dendrimers are advantageous in applications and as a test system due to their uniformity, aqueous solubility, easily modified surface chemistry, and controlled size.1 For targeted therapeutics, a minimal dendrimer-membrane interaction is preferred to avoid interfering with the targeting moieties.2–6 Systemic therapeutics, such as transfection vectors, require a strong dendrimer-membrane interaction for enhanced delivery of the dendrimer’s cargo through the plasma membrane and cytoplasmic barriers.7–9 Additionally, the increasing commercial use of nanoparticles motivates an awareness of nanoparticle properties that are likely to yield adverse effects from environmental and human exposure.10–13 Therefore, appropriate control of the nanoparticle-membrane interaction is an essential component of nanoparticle based devices.
Previous research has identified the nanoparticle properties that are predictive of membrane disruption.12–14 Specifically, nanoparticle net charge and surface area are the primary predictors of membrane disruption, more so than nanoparticle shape, flexibility, or chemical composition.12, 13 Membrane binding, pore formation, and leakage induced by cationic nanoparticles was demonstrated in vivo, in vitro, and on phospholipid model membranes.8, 14–21 However, previous experiments were unable to resolve the molecular-scale details of the nanoparticle-membrane interaction.
Isothermal titration calorimetry (ITC) has been performed previously with PAMAM dendrimers and assorted surfactants, demonstrating strong dependence on dendrimer charge.22, 23 Ionic bonding of anionic surfactants to the protonated amines was suggested as the primary mechanism of interaction and saturation was observed at charge neutrality. ITC has also been used for examination of the effects of nanoparticles on the stabilization and phase of phospholipid vesicles.24, 25 To elucidate the details of dendrimer-lipid interactions, atomistic molecular dynamics,26, 27 coarse-grained dynamics,28–31 and mesoscale thermodynamic models32, 33 have been used. All of these models demonstrate a strong dendrimer-lipid interaction. The atomistic models indicated the particular atomic moieties dominating the interaction, the thermodynamic models provided plausible continuum configurations, and the coarse-grained models provided the longest duration dynamics. However, no theoretical technique has yet been able to reproduce the generation dependence on membrane disruption observed experimentally while providing consistency of the limited deformability of the molecules. Interactions between the hydrophobic dendrimer moieties and the hydrophobic lipid tails have been identified in all models as important influences on the interaction of dendrimers with fluid phase bilayers.
The molecular mechanisms of nanoparticle-induced membrane disruption have been speculated to be (I) lipid vesicle enclosing the dendrimer(s),33, 34 (II) lipid micelle enclosing the dendrimer(s),34 (III) a “carpeting” of the membrane by dendrimers,35 or (IV) a barrel-stave mechanism of dendrimer supported membrane pores.28, 30, 35 The latter two models were developed to explain membrane disruption induced by helical, amphiphilic peptides; however, these models have been adapted for deformable synthetic polymers.30, 36 These models for the mechanisms of membrane degradation vary significantly in the number of lipids per dendrimer, the necessity of dendrimer cooperativity, and the predicted size of the resulting complex, as described in detail below (Figs. 2 and 5).
In this manuscript, we examine dendrimer-lipid interactions through measuring enthalpy with ITC and the sizes of the resulting dendrimer-lipid complexes with AFM, TEM, MD, and DLS. These results are analyzed in terms of the stoichiometry and structure for the resulting dendrimer-lipid complex. Variations in dendrimer generation (G), dendrimer termination, and phospholipid head group were explored to describe dendrimer-dependent differences in binding to lipids. Within ITC, key dendrimer/lipid ratios of binding are identified by changes in the magnitude of the heat released. Upon mixing dendrimers and lipids, a change in enthalpy was only observed when both the dendrimers and the lipids had a net charge. For these interactions, both the stoichiometry and detailed energetics of the interaction were determined. The ratio of anionic phospholipids per dendrimer suggests that both dendrimer flattening and membrane curvature are induced to facilitate dendrimer-lipid contact. Analysis of calorimetry and microscopy data suggests that large dendrimers (> G6) form dendrimer-encased vesicle complexes either as a key component of larger dendrimer-lipid aggregates or as isolated complexes in solution (Model I, Fig. 2C and 5B). Whereas small- and medium-sized dendrimers (≤G6) interact with stoichiometries and structure consistent with a flattened-dendrimer model (Model III, Figs. 5A and 6).
Results and Discussion
The ΔH of cationic dendrimer-anionic lipid interactions was primarily negative, indicating a net exothermic interaction, while cationic dendrimer-cationic lipid interactions were endothermic and zwitterionic lipids gave no heat release (Fig. 1). The overall curve shape of ΔH vs. n for cationic dendrimers and anionic lipids was likely the result of both an aggregation and supramolecular complex formation (Fig. 2). Three molar ratios are identified within each titration, nA, nL and nD (with units of dendrimers/lipid), that provide insight into the dendrimer-lipid interaction. The molar ratio nA represents the ratio at which the heat released per dendrimer reached the maximum. From the first injection of dendrimers into the solution of vesicles until a molar ratio of nA, ΔH decreased as each added dendrimer released more heat than the previous. The molar ratio nL represents the point ΔH began to increase and we hypothesize the system transitioned from a regime of abundant lipids to a regime of scarce lipids, as each injected dendrimer released less heat than the previous. The molar ratio nD represents the smallest molar ratio at which ΔH was zero. We hypothesize the system transitioned from a regime of scarce dendrimers to abundant dendrimers at the molar ratio nD. Following these hypotheses, at molar ratios less than nL, there were few free dendrimers in solution since there were ample lipids to interact with all dendrimers in solution. At molar ratios greater than nL, injected dendrimers were not able to release as much heat as those previously injected, hence the decreasing magnitude of ΔH. At molar ratios greater than nD, the free lipids were consumed by the dendrimers and there was no heat release due to dendrimer-lipid interactions upon further addition of dendrimers.
Figure 1.
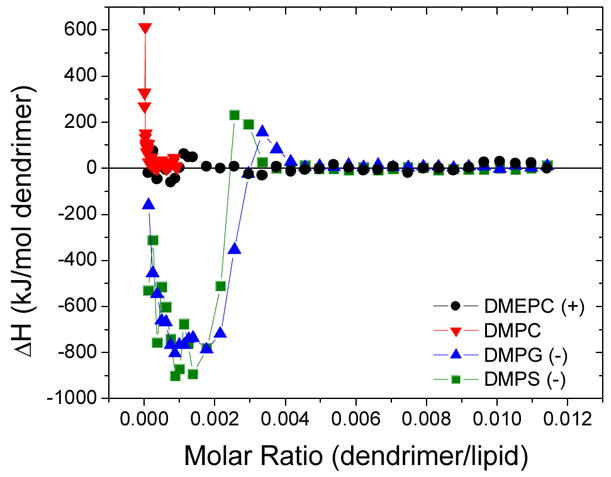
Change in enthalpy vs. molar ratio upon titration of G5 into various phospholipid SUVs at 50°C in PBS. The interaction of G5 and anionic lipids demonstrated significant heat release (ΔH < 0) and a specific saturating stoichiometry after which no dendrimer-lipid interaction was observed. ΔH0 = 0 ± 10 kJ/mol for the polycationic dendrimers and zwitterionic lipids. The polycationic polymer-cationic lipid interaction had only an initial endothermic interaction.
Figure 2.

Analysis of ITC measured enthalpy vs. molar ratio. (A) As dendrimers were injected into the lipids, initially there were abundant lipids. The heat release per dendrimer increased as the lipid vesicles aggregated until the stoichiometric ratio of nA. The heat release was equal to ΔH0 between nA and nL. At the molar ratio nL, the lipids became scarce and each injected dendrimer released less heat. At the molar ratio nD, all the lipids were consumed and no further dendrimer-lipid interaction was observed. (B, C) The mixture of dendrimers with lipids vesicles resulted in aggregation as the dendrimers bind to the membranes. Further addition of dendrimers resulted in the formation of dendrimer-lipid complexes of well defined stoichiometry and continued flocculation and/or aggregation.
Repetitions of these experiments with varying initial concentrations revealed interesting trends. For a particular dendrimer generation, termination, and lipid type, the molar ratios at which ΔH went to zero (from nL to nD, Fig. 2A) was independent of the initial concentrations of dendrimers or lipids. In contrast, the molar ratios for which the initial decrease in ΔH occurred (0 to nA, Fig. 2A) depended on the initial concentrations of dendrimers and lipids. We hypothesize the initial interaction of dendrimers and phospholipid vesicles was a flocculation, as previously reported,8,37 and supported by DLS data (Fig. S3).
ΔH0 of the dendrimer-lipid interaction is defined to be the maximum heat release measured throughout the titration. At the molar ratios for which ΔH0 was measured (between nA and nL), there were lipid vesicles in solution available for interaction with each dendrimer. Titrations of polycationic G5 into anionic phospholipids, DMPS and DMPG, demonstrated a similar exothermic interaction (ΔH0 = −800 ± 100 kJ/mol of G5, respectively) and complexation stoichiometries (Fig. 1). The heat absorbed upon interaction of G5 with DMPC, a zwitterionic lipid, is ΔH0 = 0 ± 10 kJ/mol (Fig. 1). Titrations of polycationic G5 and cationic DMEPC resulted in an initially endothermic interaction at low dendrimer/lipid ratios. Multiple initial injections with constant ΔH could not be observed even when increasing the relative lipid concentration up to 105 DMEPC/G5. A further discussion of the differences between types of phospholipids is given below.
Interactions between DMPG and various PAMAM dendrimers were examined to determine the effects of polymer size and surface chemistry (Fig. 3). G3, G5, G5-Ac(40%), G5-Ac(100%), G6, G7, G8, and G9 were separately titrated into DMPG SUVs at 50°C. A greater number of primary amines per dendrimer yielded greater heat releaseand a greater number of lipids bound per dendrimer regardless of dendrimer generation or termination (Figs. 3 and 4).
Figure 3.

ΔH vs. molar ratio upon titration of assorted PAMAM dendrimers into DMPG SUVs at 50°C in PBS. Increasing the number of primary amines per dendrimer resulted in more lipids per dendrimer necessary for saturation and an increase in heat release (Fig. 4).
Figure 4.

A scatter plot of the ΔH0, nL−1, and nD−1 versus the number of primary amines per dendrimer. Smaller dendrimers (< G7) had (A) maximum heat release and (B) binding stoichiometries proportional to the number of primary amines per dendrimer. The binding of larger dendrimers (> G7) required fewer lipids and provided less enthalpy release per primary amine presumably due to the increasing density of primary amines on the dendrimer surface and steric limitations.
Small- and medium-sized polycationic dendrimers (≤G6) released heat upon interacting with anionic phospholipids in linear proportion to the number of protonated primary amines per dendrimer. As shown in Fig. 4, linear fits to nL−1, nD−1, and ΔH0 vs. the number of primary amines per dendrimer reveals that dendrimer-DMPG interaction can be characterized by 4.5 ± 0.1 lipids/primary amine, 2.2 ± 0.1 lipids/primary amine, and −6.3 ± 0.3 kJ/ mol primary amine, respectively. Fig. 4 does not include analysis of nA because nA is dependent on the initial concentrations of dendrimers and lipids and is not a robust characteristic of the molecules studied. These binding stoichiometries, with greater than one lipid/primary amine, indicate that the binding is more complex than simple ionic binding, as previously observed with sodium dodecyl sulfate (SDS) and PAMAM dendrimers.22
The largest dendrimers, G8 and G9, displayed significant decreases in the energy and stoichiometry of lipid binding per dendrimer terminal group. This was presumably due to the decreased steric accessibility and reduced surface area per terminal group in these larger dendrimers. This demonstrates the interplay of the polymer size and the total number of primary amines per dendrimer in affecting the dendrimer-lipid interaction. Previous studies of PAMAM dendrimers and phospholipids, which indicated a strong dependence on the generation and termination of the dendrimers,13, 14 are explained well by these observations of generation-dependent interactions with lipids.
An explanation for the role of the dendrimer generation and termination on membrane disruption is given below to address the following questions of the resulting dendrimer-lipid complex.
What are the dendrimer-lipid complexes that result from nanoparticle-induced membrane pore formation?
Is the membrane planar on the length scale of a dendrimer or is there significant curvature around the dendrimer?
Is the dendrimer located in the hydrophobic or hydrophilic region of the membrane?
Does the dendrimer simultaneously interact with the surface of one or two vesicles?
How does a lipid become bound to a dendrimer and unable to bind to another dendrimer?
Consideration of the lipids per dendrimer stoichiometry, the limited deformability of the dendrimer, and the density of the lipid bilayer addresses these questions. To bind to the lipids, as determined by ITC, means to interact with the lipids in such a way that heat is released and the lipids are associated with the dendrimer, limiting the lipids interaction with additional dendrimers. Once all of the lipids have been saturated by dendrimers, the further addition of dendrimers appears enthalpically identical to adding dendrimers to a solution deplete of lipids.
One model of the dendrimer-lipid bilayer interaction includes the dendrimer flattening over the bilayer while the bilayer stays generally planar, the flattened-dendrimer model (Model III from above, Figs. 5A and 6). The molar ratio of lipids per dendrimer in this model depends on the area over which the dendrimers spans the bilayer. G3 PAMAM dendrimers have been observed by AFM flattening on a hard, anionic surface covering an area of 32 nm2, at which time it is 1 nm tall.38 With a DMPG monolayer density of 0.58 nm2/lipid,39 110 lipids of a planar bilayer would be within the area of 32 nm2. Similarly, atomistic molecular dynamics simulations have measured G3 stretching over a fluid-disordered lipid bilayer where the dendrimer was in close proximity to 56 lipid molecules on the top bilayer leaflet (Fig. 6); doubling this number to incorporate both leaflets yields 112 lipids/G3.27 These estimates for the flattened dendrimer model are in good agreement with the ITC measured range of 76–140 lipids (nD−1 to nL−1) for G3-DMPG.
Figure 5.

(A) Flattened-dendrimer model and (B) dendrimer-encased vesicle model of dendrimer lipid complexes. These models depict the interaction of a single dendrimer with a lipid bilayer and suggest a fundamental structure of local dendrimer-lipid interaction. Aggregation of the flattened dendrimers may induce sufficient curvature to create a separated vesicle and separated vesicles may readily aggregate. (C) ITC determined binding stoichiometries for the dendrimer-lipid complexes compared with the expected stoichiometry of these models. Small and medium dendrimers (< G6) flatten over the membrane and induce slight membrane curvature and/or flocculation of vesicles. Larger dendrimers (> G6) become encased by a lipid vesicle. (A) G5 and (B) G7 are colored red. The hydrophilic head groups are colored blue and the hydrophobic tails are colored grey. This data is also shown in Table S2.
Figure 6.
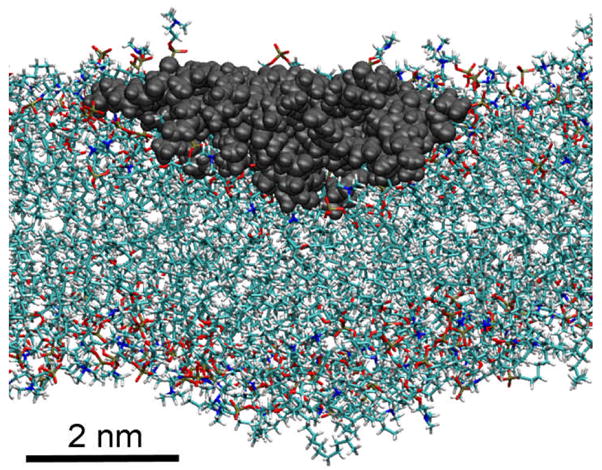
Molecular dynamics simulation result of G3 PAMAM dendrimer binding to a fluid-disordered phase DMPC bilayer. The dendrimer was within 3 Å of 56 lipid molecules. Doubling this to calculate the lipid molecules in the bilayer below the dendrimer yields 112 lipids/G3 and good agreement with ITC measured stoichiometries of 76–140 DMPG/G3.
The estimated number of lipids per dendrimer in the flattened-dendrimer model is shown in Fig. 5C. Varying experimental conditions yield a range of flattened dendrimers sizes, such as modifying the pH in AFM measurements,38 the phase of the bilayer,27 and the charge of the planar surface,40 commonly with 20% variation in diameter of the flattened dendrimer. Thus, the number of lipids per dendrimer in the flattened dendrimer model is estimated for a range of dendrimer sizes within 20 % of the AFM measurement, which is taken to be the upper-limit on dendrimer deformability.
The flattened-dendrimer model raises two important concerns: (1) how could the 1 nm tall dendrimer occupy both leaflets of the bilayer and (2) how does the membrane compensate for the large deformation energy required to flatten the dendrimer?40 This first concern is alleviated by allowing the dendrimer to bind simultaneously to two separate bilayers, thereby achieving saturation by occupying leaflets from two different bilayers. This explanation is only feasible in solution experiments, such as those presented here, and not on a monolayer of adherent living cells or on a supported lipid bilayer. Another possibility is that the dendrimer sequesters into the tail region of the bilayer, binding to both leaflets of one bilayer simultaneously, as the precursor to a micelle.32 The former option is expected if the dendrimer is found in the hydrophilic, head group region of the bilayers, while latter is expected if the dendrimer is found within the hydrophobic lipid tail region. ITC stoichiometric data cannot distinguish between these two possibilities, yet results from ITC on larger dendrimers (Fig. 5) and molecular dynamics simulations (Fig. 6) indicate the dendrimers are found in a hydrophilic environment.
The second concern of energy balance is clarified by considering the energetics of a pore in a bilayer. The energy to make a large pore within a lipid bilayer can be estimated by the line tension multiplied by the pore contour length. Lipid bilayer line tension has been estimated to be 40 pN and the perimeter of a circular pore resulting from the removal of 100 lipids is 27 nm;41 therefore, the energy required to form this pore would be approximately 650 kJ/mol. Since this value is greater than the energy necessary to flatten G3 (400 kJ/mol),40 the flattened-dendrimer model is energetically consistent for G3 and DMPG. The membrane may accommodate the dendrimer by forming a pocket to reduce the dendrimer deformation, as shown previously27 and in Figs. 5A and 6; however, this is not expected to cause pore formation from a single small dendrimer or significantly affect the estimates from the flattened-dendrimer model.
A similar analysis for G7 shows that the flattened-dendrimer model does not suffice to explain the ITC data. G7 on mica has been shown to stretch over 180 nm2, corresponding to 610 lipids on a DMPG bilayer.40 This is far fewer than the 1200–2300 lipids needed for saturation, as observed by ITC. Further, flattening G7 to 180 nm2 requires 80,000 kJ/mol40 and the removal of 2300 lipids from a membrane would require 3100 kJ/mol in the line tension and pore contour length. Thus, through both stoichiometric and energetic comparisons, G7 is not expected to reach the equilibrium stoichiometry by flattening on a planar bilayer.
A possible structure for the G7-DMPG complex is the dendrimer-encased vesicle model (Model I from above, Fig. 5B). This structure may be present as an isolated supramolecular complex in solution or as a component of a larger dendrimer-lipid aggregate. This model is defined as a bilayer wrapped around each dendrimer as the dendrimer interacts with the hydrophilic surface of the membrane. The resulting dendrimer-encased vesicle(s) may stay bound to the larger vesicle structure or detach and create a membrane pore.31 Regardless of the aggregated state of these structures, to maintain the average stoichiometry with this model, each dendrimer is on average individually wrapped by a bilayer of lipids and the diameter of a dendrimer-encased vesicle structure is approximately equal to the diameter of the dendrimer plus twice the bilayer thickness (Fig. 5B).
The number of lipids per vesicle encasing a G7 is estimated to be in the range of 1900 to 2200, in agreement with the 1200–2300 lipids/G7 observed via ITC (nD−1 to nL−1). This estimate assumes the lateral lipid head group density and the lipid tail volume are equal to that of dendrimer-free lipid vesicles and the inner radius of the surrounding vesicle equal to the outer diameter of the dendrimer, similar to previous analytical models of this complex.42 The lower bound for the outer radius of the dendrimers is given by molecular dynamics simulations of dendrimers in solution without the incentive for the dendrimers to stretch to large sizes for greater interaction with the lipids. According to variations observed in small angle x-ray scattering, small angle neutron scattering, and molecular dynamics studies,43 it is possible that the dendrimer could stretch as much as 20% to interact with more membrane surface, as represented in Fig. 5C. In this model, the dendrimer occupies both leaflets of a bilayer by inducing a highly convex membrane curvature on the vesicle exterior and limiting additional dendrimer binding to the outer leaflet. The induced membrane curvature is energetically costly due to the small radius of curvature, but encouraged by the numerous dendrimer-membrane interactions. This energy compensation has been previously estimated34 and dendrimers larger than or equal to G7 are energetically able to support such a dendrimer-encased vesicle complex.
Dendrimers of sixth-generation or smaller were not capable of individually supporting a surrounding vesicle. This conclusion is reached independently by either energetic or stoichiometric analysis. Stoichiometrically, the dendrimer-encased vesicle model for small dendrimers (≤G6) is inconsistent with the ITC data (Fig. 5C). The number of lipids required to surround the dendrimer in a bilayer vesicle with an inner vesicle radius equal to the outer dendrimer radius, while preserving lateral head group area and lipid tail volume from dendrimer-free vesicles, is significantly more lipids per dendrimer than experimentally measured for these small dendrimers. For example, the estimated 1600–1900 lipids/dendrimer for a vesicle-encased G6 is significantly higher than the ITC measured 410–860 DMPG/G6. Thus, the dendrimer-encased vesicle model was not the average structure for individual dendrimers of sixth-generation or smaller.
The ITC results for G8 and G9 suggest the dendrimer-encased vesicle model for these generations of dendrimers as well. Due to the large size of G8 and G9, the encasing vesicles experienced less curvature and greater stabilization by the numerous primary amines per dendrimer. Furthermore, significant flattening of these 260 kDa and 410 kDa macromolecules was predicted to be energetically prohibited. The agreement between the stoichiometry observed via ITC and the predicted number of lipids per vesicle encasing the dendrimer provide the strongest evidence to date of the dendrimer-encased vesicle complex (Fig. 5).
TEM and AFM results show complexes in a mixture of G8 and DMPG consistent with the dendrimer-encased vesicle model. TEM images created with uranyl acetate stain reveal isolated G8, as well as regions of aggregated dendrimers. Aggregates were not visible in control samples of dendrimers or lipids alone and thus the aggregates are concluded to be a mixture of DMPG and G8. Due to staining and contrast constraints of TEM, lipid molecules in close proximity to the dendrimers were not visible (Fig. 7A and 8A). The complimentary technique of AFM was employed to measure the volume of the isolated dendrimer complexes with an average molar ratio of nL (Fig. 7B). AFM experiments showed dendrimer-lipid aggregates as well as isolated complexes, in agreement with TEM results. Fig. 9 displays the distribution results from AFM, TEM, ITC, and predictions from the dendrimer-encased vesicle and flattened-dendrimer models.
Figure 7.

(A) TEM image of G8-DMPG complexes with a total molar ratio of nL = 0.0003 G8/DMPG and (B) AFM measured topography of this sample. The uranyl acetate staining shows G8 may be isolated or in large aggregates. G8 appear dark and the lipids are not visible with this staining procedure. While TEM shows that each isolated complex contains primarily one G8, presumably the same complexes imaged by AFM (e.g. as indicated by arrows) have an average volume consistent with the dendrimer-encased vesicle model (Fig. 9).
Figure 8.

(A) TEM image of an aggregate of > 200 G8-DMPG complexes with a total molar ratio of nD = 0.0006 G8/DMPG. An outline is drawn to separate the regions of individually resolvable dendrimers from multi-layers of non-resolvable dendrimers. (B) A distribution of area per G8 is obtained via a Voronoi diagram of the individual G8 and reveals an area per dendrimer consistent with the dendrimer-encased vesicle model (Fig. 9). Dendrimers within (A) that were not both individually resolvable and surrounded by individually resolvable dendrimers were not included in (B).
Figure 9.

Examination of dendrimer-lipid complexes, as measured by AFM, TEM, and ITC, and estimated from models. Results are compared by both volume and stoichiometry by assuming a constant density of lipids (1.5 nm3/lipid) and one dendrimer per complex. ITC, TEM, and AFM results suggest the average G8-DMPG complex is consistent with the dendrimer-encased vesicle model (Fig. 5B). The volume of dendrimers in the absence of lipids was previously measured.38, 43
In addition to TEM examination of the dendrimer lipid complexes at the stoichiometric ratio of nL (Fig. 7A), the dendrimer lipid complexes were also examined at the stoichiometric ratio of nD (Fig. 8A). Again, regions of large dendrimer-lipid aggregates and regions of isolated dendrimers are observed. These regions of isolated dendrimers may be the result of individual dendrimer-lipid complexes in solution absorbing onto the TEM grid in a two-dimensional layer and/or they may represent the structure of three-dimensional dendrimer-lipid aggregates where individual dendrimers are separated by lipid bilayers wrapping the dendrimers (Fig. 2C). To compare further the TEM images with isolated dendrimers and the dendrimer-encased vesicle model, the measured and predicted areas were compared (Fig. 8). A cross-section through the equatorial plane of the dendrimer-encased vesicle complex has a total area of 270 nm2, where 70 nm2 would be through the G8 and 200 nm2 would be through the bilayer wrapping the G8. Analysis of the isolated-dendrimer regions in Fig. 8A (i.e. surrounding the outlined aggregates) gives a total area of 88,000 nm2 and contains 298 dendrimers. Therefore, the area per dendrimer from the TEM is 295 nm2/G8 whereas the model predicts 270 nm2/G8. This excellent agreement further supports the dendrimer-encased vesicle model as a common stoichiometry for the dendrimers and lipids.
A distribution of the dendrimer complexes in Fig. 8A was obtained through creation of a Voronoi diagram to assess the area of each complex (Fig. 8B). Briefly, the Voronoi diagram was created by identifying a set of points on a plane (the center of each isolated G8 in this application) and then mapping regions of the entire plane to each point based on the closest neighboring points. This provided an assessment of the area surrounding each point and, in our case, the cross-sectional area (A) of each isolated G8-DMPG complex. Here, A is assumed to be a plane through a larger three-dimensional structure. For comparison with other models, the volume (V) of the structure was estimated by , as would be expected for a sphere. Again, good agreement is found between the dendrimer-encased vesicle model and TEM of the the G8-DMPG mixture with mean volumes of 3900 ± 600 nm3 and 3300 ± 1600 nm3, respectively.
These data suggest the following mechanism to describe the binding of dendrimers to lipid bilayers (Fig. 2C). (1) Dendrimer(s) bind to the membrane due to a combination of forces, such as electrostatics, hydrophobicity, desolvation, etc., (2) Dendrimer(s) and membrane deform to increase interaction area, including dendrimer flattening and membrane curving around the dendrimer(s). (3a) If the dendrimer is large enough and has enough primary amines, then the curvature of the membrane around the dendrimer results in a complete encapsulation of the dendrimer by the bilayer, yielding a dendrimer-encased vesicle complex, perhaps aided by cooperativity from other dendrimers and/or as part of a larger dendrimer-lipid aggregate. (3b) If an individual dendrimer smaller than G7 contacts the bilayer, then it is unable to individually become wrapped in a lipid bilayer or, thus, to produce a pore in the membrane. (3c) If the lipid concentration is relatively large compared to the dendrimer concentration, then the dendrimers can flocculate the vesicles, presumably by binding to multiple bilayers simultaneously. (3d) If the dendrimer concentration is relatively large relative to the lipid concentration, than multiple dendrimers may aggregate on the surface of a single bilayer and create a pore, analogous to the carpeting mechanism. Since each small dendrimer may be able to maintain a small amount of membrane curvature, if multiple small dendrimers act collectively, it is feasible that they could each stabilize a portion of a vesicle surrounding multiple small dendrimers. This model of collective action by small dendrimers would explain the presence of membrane pores from small dendrimers at higher dendrimer concentrations while being consistent with the ITC stoichiometric data. If such a cooperative mechanism of pore formation occurred, the relationship between saturating stoichiometries and number of primary amines per dendrimer indicates that multiple smaller dendrimers (e.g. two G6 or four G5) would collectively have as many primary amines as one G7 and, thus, be capable of supporting a bilayer wrapping around the aggregated dendrimers.
Further consideration of Fig. 1 reveals interesting similarities and differences between the interactions of PAMAM dendrimers and various phospholipids. For example, the observation that ΔH0 = 0 for G5 and DMPC can be understood as either (1) bilayer disruption was dependent on entropic effects, such as membrane curvature, dendrimer deformation, desolvation, or counter-ion release without a measureable enthalpy contribution or (2) bilayer disruption occurred on a time scale orders of magnitude longer than that of initial binding, and thus, is unobservable with ITC. This result is particularly interesting because experimental and theoretical techniques such as atomic force microscopy (AFM),13–16, 33, 34, 36, 42, 44 vesicle leakage,8, 37 whole-cell leakage,13–16, 21 computer simulations,26–30, 32 differential scanning calorimetry,7, 45–47 electron paramagnetic resonance,48, 49 and Raman spectroscopy45 demonstrated that a spontaneous interaction exists between protonated PAMAM dendrimers and fluid phase zwitterionic phospholipids, commonly results in membrane degradation within minutes of mixing. Since the interaction is experimentally observed within a few minutes of dendrimer-lipid mixing, option (2) is eliminated and entropy is determined to be the driving factor for membrane disruption on zwitterionic lipids. A hydrophobic interaction between the inner dendrimer and lipid tails may encourage a dendrimer-membrane interaction, as suggested by computational studies.27 Additionally, entropic contributions from counter ion release or desolvation from the charged macromolecules may yield an entropic driving force for dendrimer-lipid binding.50 Interestingly, toxicological and AFM studies indicated that the surface area and net charge of nanoparticles may be the best predictor of zwitterionic membrane disruption.12, 13
The ΔH from ITC is not directly comparable to the ΔH from implicit solvent computations. The ITC result of ΔH = 0 for G5-DMPC interactions incorporated desolvation effects, where as previous simulation results of a nonzero ΔH of dendrimer-DMPC interactions27 considered only the direct dendrimer-lipid interaction without incorporating contributions from desolvation.
The positive enthalpy of interaction for G5 and DMEPC data indicates the dendrimers entropically favored an interaction with the lipids and paid an enthalpic cost to do so. This endothermic interaction may be similar to the aggregation of G5 and anionic lipids; however, possibility a simultaneous exothermic interaction of G5-anionic lipids did not occur for G5-cationic lipids. This data is supportive of the hypothesis that the interaction between dendrimers and lipids is enhanced by hydrophobic interactions while their relative charge affects the enthalpic contribution to their interaction.
Conclusions
ITC, DLS, AFM, TEM, and MD were performed with assorted PAMAM dendrimers and phospholipids. Each step in the proposed interpretation of the complex dendrimer-lipid isotherm has experimental support. The initial flocculation (Fig. 2CI–III) is supported by the initial enthalpy values in agreement with published literature. The formation of dendrimer-lipid complexes (Fig. 2CII–IV) is supported by the lipid/dendrimer stoichiometry measured by ITC and is consistent withAFM and TEM measurements. The stoichiometries at which no further heat was released (Fig. 2CIII–IV) is consistent with the formation of the proposed structures, as previously hypothesized. Further, these saturating stoichiometries of G7–G9 change as expected (Fig. 5) according to both analytical models and experiments supporting the dendrimer-encased vesicle complex. The formation of aggregates (Fig. 2CIV–V) is supported by light scattering, AFM, and TEM (Figs. 7 and 8).
The interaction enthalpy depended largely on the relative electrostatic charge of the dendrimer and the phospholipids. The ΔH0 and saturating stoichiometryof the dendrimer-DMPG interactions were linearly dependent on the number of primary amines per dendrimer, regardless of dendrimer generation or termination, for dendrimers of sixth-generation and smaller. The lack of heat released upon dendrimer-DMPC interaction suggests the binding and eventual pore formation16 are driven by changes in entropy rather than enthalpy for these zwitterionic lipids. Models of the dendrimers bound to the lipids were analyzed by considering (1) the number of lipids per dendrimer, (2) the density of lipids molecules within the bilayer, and (3) the deformability of the dendrimer. For increasing dendrimer generation, the requirement of membrane curvature around the bilayer became a necessary component in the resulting dendrimer-lipid complex to achieve sufficient lipids in close proximity to each dendrimer. As isolated or aggregated complexes, dendrimers larger than G6 become encased in a bilayer of lipids, on average, while smaller dendrimers do not.
Methods
Purified, biomedical-grade PAMAM dendrimers were obtained from Dendritech, Inc. of generation (G) 3, 5, 6, 7, 8, and 9 with native primary amine termination (Fig. S1 and Table S1). All primary amine PAMAM dendrimers dialyzed with a molecular weight cutoff membrane against distilled water for at least three days with at least four washes. Potentiometric titration was conducted to determine the average number of primary amines. Molecular weight and dispersity were characterized with gel permeation chromatography. Acetylation was performed as published previously and shown in Fig. S1.51 Samples were lyophilized for three days resulting in a white solid. The primary amines are expected to be protonated at pH 7.4 and the tertiary amines are not; therefore, the charge of each dendrimer is equal to its number of primary amines. The mass and charge of each dendrimer are listed in Table S1.
Dried powders of 1,2-Dimyristoyl-sn-Glycero-3-(Phospho-L-Serine); 1,2-Dimyristoyl-sn-Glycero-3-(Phospho-rac-(1-glycerol)); 1,2-Dimyristoyl-sn-Glycero-3-Phosphocholine; and 1,2-Dimyristoyl-sn-Glycero-3-Ethylphosphocholine (DMPS, DMPG, DMPC, and DMEPC, respectively) were obtained from Avanti Polar Lipids, Inc. and prepared as small unilaminar vesicles (SUVs). Briefly, weighed lipid powders were mixed with chloroform, sonicated for > 5 min, and dried under vacuum for > 8 hours. The resulting film of lipids was mixed with buffer and alternately shaken vigorously for > 15 sec and incubated at 37°C for > 1 hr for at least two repetitions to produce multilaminar vesicles (MLVs). Small unilaminar vesicles (SUVs) were produced through sonication of MLVs, as previously reported.15 No lipids were kept at room temperature for greater than 4 days. The charge and transition temperatures of these phospholipids are listed in Table S1.
Dendrimer and phospholipid solutions were prepared in 1x Dulbecco's phosphate buffered saline without Calcium, Magnesium, or Phenol Red (PBS, Thermo Scientific, Inc., pH 7.4, 138 mM NaCl).
ITC was performed with a VP-ITC (MicroCal, Inc.) with dendrimers in the injection syringe and lipids in the experimental cell (usually 80 μM) while the references cell contained PBS. Stirring of the experimental cell occurred at 372 rpm throughout the titration. Sample degassing, instrument maintenance, and cleaning was performed according to manufacturers recommendations. Baseline fitting to raw ITC data was performed following automated routines within Origin 7.0 data acquisition and analysis software (OriginLab Corp.), with minor corrections at user’s discretion (Fig. S2). Resulting peak integrations of power vs. time from the raw ITC data are plotted as energy per mole of injectant (ΔH) at the molar ratio of dendrimers per lipid (n) in the sample cell after each injection. ITC experiments were performed at 50°C, well above the phase transition for all lipids used, resulting in fluid-disordered phase bilayers.52 The last injections of each titration yielded ΔH equal to control experiments without lipids present and these values were set equal to zero for analysis of the dendrimer-lipid interaction.
Analysis of the ITC data did not include mathematical fitting to traditional binding models due to the variety of possible models that fit the data for cationic dendrimers interacting with anionic lipids. If the processes that resulted in the observed ITC line shape were occurring simultaneously and independently, then these two processes may have both contributed to the observed net ΔH of interaction via an endothermic interaction at very low stoichiometries (n < 0.0001 dendrimer/lipid, e.g. flocculation), followed by an exothermic interaction at higher stoichiometries (0.0005 < n < 0.01 dendrimer/lipid, e.g. supramolecular complex formation) (Fig. 2). However, if these two processes are competitive or cooperative, then the entirety of the measured ΔH may be attributed to just one of the processes while the other processes were not enthalpically dependent.
Transmission electron microscopy (TEM) was performed on a Philips CM-100. Sample preparation included the following: Mixtures of DMPG and G8 in PBS were placed on a 200-grain carbon-coated copper TEM grid for 5 min and excess lipid was removed by blotting. The initial lipid concentration was 80 μM and dendrimer concentration varied to achieve the desired molar ratio. The grid was rinsed with distilled H20 and blotted dry to remove excess salt. 1% solution of urinal acetate in distilled H20 was placed on the grid for 10 min and blotted dry. The remaining urinal acetate was a counter stain on the samples, making the dendrimers dark in the resulting TEM images. Staining and imaging constraints prohibited the viewing of lipids in the presence of dendrimers.
Molecular dynamics (MD) simulations were performed as described elsewhere.27 Briefly, MD simulations utilized the CHARMM parameters for generic proteins (para22) for the dendrimer and CHARMM27 parameters for the lipids.53, 54 Simulations were run at 300 K. Non-bonded interactions were cutoff at 13 Å and switched from 8 Å. Time steps of 2 fs were taken with implementation of the SHAKE routine. Initial dendrimer configurations were made with a recursive script in CHARMM.55 Both the dendrimer and the lipids were separately equilibrated for 2 ns before being were combined. The simulation was run until dendrimer stopped moving along the direction perpendicular to the lipid bilayer for more than 5 ns. A distance-dependent dielectric function was employed as an implicit solvent model. This yielded significant (>10 fold) enhancement in required computational time but incorporated greater approximations through eliminating the entropic contribution from the solvent or counter ions.26 Images from MD results within this manuscript were created with the software VMD.56
The TEM samples were also measured with AFM. Samples were imaged using a PicoPlus 550 equipped with a multipurpose small scanner, capable of imaging up to 10 μm x 10 μm (Agilent (formerly Molecular Imaging); Santa Clara, CA). Scans were performed in tapping mode using silicon cantilevers (VistaProbes T300R, force constant 40 N/m, resonance frequency 300 kHz, length 125 μm; nanoScience Instruments; Phoenix, AZ). Scan rates were ≤ 2 Hz at 1024 lines per frame. All imaging was done in air at room temperature, nominally 25°C. Image flattening, line scans, and volume analysis were performed with Gwyddion (Czech Metrology Institute).
Supplementary Material
Acknowledgments
The authors thank L. Prevette and I. Majoros from Michigan Nanotechnology Institute for Medicine and Biological Sciences (MNiMBS) for insightful discussions. C.V.K. received fellowship support from the NIH Michigan Molecular Biophysics Training Program (T32 GM008270-20), the Applied Physics program, and the Graham Environmental Sustainability Institute. This research was supported by a grant from the National Institute of Biomedical Imaging and BioEngineering (R01-EB005028).
Footnotes
Conflict of Interest Statement
Dr. James R. Baker Jr. holds an ownership position in Avidimer Therapeutics, Inc., and is the inventor of technologies that the University has licensed to Avidimer Therapeutics, Inc. Some of these technologies are involved in this research. Avidimer Therapeutics, Inc. had no role in study design, data collection and analysis, decision to publish, or preparation of the manuscript.
Supporting Information Available: Line drawings of DMPG, DMPS, DMPC, and DMEPC, and a G3 PAMAM dendrimer are provided in Figure S1. The charge and Tm values for the lipids and the experimentally determined mass and charge of the dendrimers employed are given in Table S1. The raw power vs time and ΔH vs molar ration data for G3-G9 dendrimers titrated into DMPG SUVs at 50 °C in PBS is illustrated in Figure S2. The mean diameter of G5 dendrimer/DMPS aggregates as function of molar ratio is given in Figure S3. The stoichiometric comparison of ITC results with the flattened-dendrimer and the dendrimer-encased models is given in Table S2. This material is available free of charge via the Internet at http://pubs.acs.org.
References
- 1.Esfand R, Tomalia DA. Poly(amidoamine) (PAMAM) Dendrimers: From Biomimicry to Drug Delivery and Biomedical Applications. Drug Discovery Today. 2001;6:427–436. doi: 10.1016/s1359-6446(01)01757-3. [DOI] [PubMed] [Google Scholar]
- 2.Langer R. Drug Delivery and Targeting. Nature. 1998;392:5–10. [PubMed] [Google Scholar]
- 3.Quintana A, Raczka E, Piehler L, Lee I, Myc A, Majoros I, Patri AK, Thomas T, Mule J, Baker JR. Design and Function of a Dendrimer-Based Therapeutic Nanodevice Targeted to Tumor Cells through the Folate Receptor. Pharm Res. 2002;19:1310–1316. doi: 10.1023/a:1020398624602. [DOI] [PubMed] [Google Scholar]
- 4.Kukowska-Latallo JF, Candido KA, Cao ZY, Nigavekar SS, Majoros IJ, Thomas TP, Balogh LP, Khan MK, Baker JR. Nanoparticle Targeting of Anticancer Drug Improves Therapeutic Response in Animal Model of Human Epithelial Cancer. Cancer Res. 2005;65:5317–5324. doi: 10.1158/0008-5472.CAN-04-3921. [DOI] [PubMed] [Google Scholar]
- 5.Shiota M, Ikeda Y, Kaul Z, Itadani J, Kaul SC, Wadhwa R. Internalizing Antibody-Based Targeted Gene Delivery for Human Cancer Cells. Hum Gene Ther. 2007;18:1153–1160. doi: 10.1089/hum.2007.087. [DOI] [PubMed] [Google Scholar]
- 6.Parveen S, Sahoo SK. Polymeric Nanoparticles for Cancer Therapy. J Drug Targeting. 2008;16:108–123. doi: 10.1080/10611860701794353. [DOI] [PubMed] [Google Scholar]
- 7.Braun CS, Vetro JA, Tomalia DA, Koe GS, Koe JG, Middaugh CR. Structure/Function Relationships of Polyamidoamine/DNA Dendrimers as Gene Delivery Vehicles. J Pharm Sci. 2005;94:423–436. doi: 10.1002/jps.20251. [DOI] [PubMed] [Google Scholar]
- 8.Zhang ZY, Smith BD. High-Generation Polycationic Dendrimers Are Unusually Effective at Disrupting Anionic Vesicles: Membrane Bending Model. Bioconjugate Chem. 2000;11:805–814. doi: 10.1021/bc000018z. [DOI] [PubMed] [Google Scholar]
- 9.Zhang SB, Zhao B, Jiang HM, Wang B, Ma BC. Cationic Lipids and Polymers Mediated Vectors for Delivery of Sirna. J Controlled Release. 2007;123:1–10. doi: 10.1016/j.jconrel.2007.07.016. [DOI] [PubMed] [Google Scholar]
- 10.Fischer D, Li YX, Ahlemeyer B, Krieglstein J, Kissel T. In Vitro Cytotoxicity Testing of Polycations: Influence of Polymer Structure on Cell Viability and Hemolysis. Biomaterials. 2003;24:1121–1131. doi: 10.1016/s0142-9612(02)00445-3. [DOI] [PubMed] [Google Scholar]
- 11.Maynard AD, Aitken RJ, Butz T, Colvin V, Donaldson K, Oberdorster G, Philbert MA, Ryan J, Seaton A, Stone V, et al. Safe Handling of Nanotechnology. Nature. 2006;444:267–269. doi: 10.1038/444267a. [DOI] [PubMed] [Google Scholar]
- 12.Oberdorster G, Oberdorster E, Oberdorster J. Nanotoxicology: An Emerging Discipline Evolving from Studies of Ultrafine Particles. Environ Health Perspect. 2005;113:823–839. doi: 10.1289/ehp.7339. [DOI] [PMC free article] [PubMed] [Google Scholar]
- 13.Leroueil PR, Berry SA, Duthie K, Han G, Rotello VM, McNerny DQ, Baker JR, Orr BG, Holl MMB. Wide Varieties of Cationic Nanoparticles Induce Defects in Supported Lipid Bilayers. Nano Lett. 2008;8:420–424. doi: 10.1021/nl0722929. [DOI] [PubMed] [Google Scholar]
- 14.Leroueil PR, Hong SY, Mecke A, Baker JR, Orr BG, Holl MMB. Nanoparticle Interaction with Biological Membranes: Does Nanotechnology Present a Janus Face? Acc Chem Res. 2007;40:335–342. doi: 10.1021/ar600012y. [DOI] [PMC free article] [PubMed] [Google Scholar]
- 15.Hong SP, Leroueil PR, Janus EK, Peters JL, Kober MM, Islam MT, Orr BG, Baker JR, Holl MMB. Interaction of Polycationic Polymers with Supported Lipid Bilayers and Cells: Nanoscale Hole Formation and Enhanced Membrane Permeability. Bioconjugate Chem. 2006;17:728–734. doi: 10.1021/bc060077y. [DOI] [PubMed] [Google Scholar]
- 16.Hong SP, Bielinska AU, Mecke A, Keszler B, Beals JL, Shi XY, Balogh L, Orr BG, Baker JR, Holl MMB. Interaction of Poly(Amidoamine) Dendrimers with Supported Lipid Bilayers and Cells: Hole Formation and the Relation to Transport. Bioconjugate Chem. 2004;15:774–782. doi: 10.1021/bc049962b. [DOI] [PubMed] [Google Scholar]
- 17.Monteiro-Riviere NA, Nemanich RJ, Inman AO, Wang YYY, Riviere JE. Multi-Walled Carbon Nanotube Interactions with Human Epidermal Keratinocytes. Toxicol Lett. 2005;155:377–384. doi: 10.1016/j.toxlet.2004.11.004. [DOI] [PubMed] [Google Scholar]
- 18.Oberdorster E. Manufactured Nanomaterials (Fullerenes, C-60) Induce Oxidative Stress in the Brain of Juvenile Largemouth Bass. Environ Health Perspect. 2004;112:1058–1062. doi: 10.1289/ehp.7021. [DOI] [PMC free article] [PubMed] [Google Scholar]
- 19.Tinkle SS, Antonini JM, Rich BA, Roberts JR, Salmen R, DePree K, Adkins EJ. Skin as a Route of Exposure and Sensitization in Chronic Beryllium Disease. Environ Health Perspect. 2003;111:1202–1208. doi: 10.1289/ehp.5999. [DOI] [PMC free article] [PubMed] [Google Scholar]
- 20.Oberdorster G, Gelein RM, Ferin J, Weiss B. Association of Particulate Air-Pollution and Acute Mortality - Involvement of Ultrafine Particles. Inhalation Toxicol. 1995;7:111–124. doi: 10.3109/08958379509014275. [DOI] [PubMed] [Google Scholar]
- 21.El-Sayed M, Ginski M, Rhodes C, Ghandehari H. Transepithelial Transport of Poly(Amidoamine) Dendrimers across Caco-2 Cell Monolayers. J Controlled Release. 2002;81:355–365. doi: 10.1016/s0168-3659(02)00087-1. [DOI] [PubMed] [Google Scholar]
- 22.Wang C, Wyn-Jones E, Sidhu J, Tam KC. Supramolecular Complex Induced by the Binding of Sodium Dodecyl Sulfate to PAMAM Dendrimers. Langmuir. 2007;23:1635–1639. doi: 10.1021/la0625897. [DOI] [PubMed] [Google Scholar]
- 23.Sidhu J, Bloor DM, Couderc-Azouani S, Penfold J, Holzwarth JF, Wyn-Jones E. Interactions of Poly(amidoamine) Dendrimers with the Surfactants Sds, Dtab, and C12eo6: An Equilibrium and Structural Study Using-a Sds Selective Electrode, Isothermal Titration Calorimetry, and Small Angle Neutron Scattering. Langmuir. 2004;20:9320–9328. doi: 10.1021/la0494932. [DOI] [PubMed] [Google Scholar]
- 24.Wang B, Zhang L, Bae SC, Granick S. Nanoparticle-Induced Surface Reconstruction of Phospholipid Membranes. Proc Natl Acad Sci U S A. 2008;105:18171–18175. doi: 10.1073/pnas.0807296105. [DOI] [PMC free article] [PubMed] [Google Scholar]
- 25.Zhang LF, Granick S. How to Stabilize Phospholipid Liposomes (Using Nanoparticles) Nano Lett. 2006;6:694–698. doi: 10.1021/nl052455y. [DOI] [PubMed] [Google Scholar]
- 26.Kelly CV, Leroueil PR, Nett EJ, Wereszczynski JM, Baker JR, Orr BG, Holl MMB, Andricioaei I. Poly(amidoamine) Dendrimers on Lipid Bilayers I: Free Energy and Conformation of Binding. J Phys Chem B. 2008;112:9337–9345. doi: 10.1021/jp801377a. [DOI] [PMC free article] [PubMed] [Google Scholar]
- 27.Kelly CV, Leroueil PR, Orr BG, Holl MMB, Andricioaei I. Poly(amidoamine) Dendrimers on Lipid Bilayers Ii: Effects of Bilayer Phase and Dendrimer Termination. J Phys Chem B. 2008;112:9346–9353. doi: 10.1021/jp8013783. [DOI] [PMC free article] [PubMed] [Google Scholar]
- 28.Lee H, Larson RG. Coarse-Grained Molecular Dynamics Studies of the Concentration and Size Dependence of Fifth- and Seventh-Generation Pamam Dendrimers on Pore Formation in DMPC Bilayer. J Phys Chem B. 2008;112:7778–7784. doi: 10.1021/jp802606y. [DOI] [PMC free article] [PubMed] [Google Scholar]
- 29.Lee H, Larson RG. Lipid Bilayer Curvature and Pore Formation Induced by Charged Linear Polymers and Dendrimers: The Effect of Molecular Shape. J Phys Chem B. 2008;112:12279–12285. doi: 10.1021/jp805026m. [DOI] [PMC free article] [PubMed] [Google Scholar]
- 30.Lee H, Larson RG. Molecular Dynamics Simulations of Pamam Dendrimer-Induced Pore Formation in Dppc Bilayers with a Coarse-Grained Model. J Phys Chem B. 2006;110:18204–18211. doi: 10.1021/jp0630830. [DOI] [PubMed] [Google Scholar]
- 31.Smith KA, Jasnow D, Balazs AC. Designing Synthetic Vesicles That Engulf Nanoscopic Particles. J Chem Phys. 2007:127. doi: 10.1063/1.2766953. [DOI] [PubMed] [Google Scholar]
- 32.Ginzburg VV, Balijepailli S. Modeling the Thermodynamics of the Interaction of Nanoparticles with Cell Membranes. Nano Lett. 2007;7:3716–3722. doi: 10.1021/nl072053l. [DOI] [PubMed] [Google Scholar]
- 33.Mecke A, Uppuluri S, Sassanella TM, Lee DK, Ramamoorthy A, Baker JR, Orr BG, Holl MMB. Direct Observation of Lipid Bilayer Disruption by Poly(amidoamine) Dendrimers. Chem Phys Lipids. 2004;132:3–14. doi: 10.1016/j.chemphyslip.2004.09.001. [DOI] [PubMed] [Google Scholar]
- 34.Mecke A, Majoros IJ, Patri AK, Baker JR, Holl MMB, Orr BG. Lipid Bilayer Disruption by Polycationic Polymers: The Roles of Size and Chemical Functional Group. Langmuir. 2005;21:10348–10354. doi: 10.1021/la050629l. [DOI] [PubMed] [Google Scholar]
- 35.Oren Z, Shai Y. Mode of Action of Linear Amphipathic Alpha-Helical Antimicrobial Peptides. Biopolymers. 1998;47:451–463. doi: 10.1002/(SICI)1097-0282(1998)47:6<451::AID-BIP4>3.0.CO;2-F. [DOI] [PubMed] [Google Scholar]
- 36.Erickson B, Kelly CV, Leroueil PR, Berry SA, James R, Baker J, Orr BG, Holl MMB. Interactions of Poly(amidoamine) Dendrimers with Survanta Lung Surfactant: The Importance of Lipid Domains. Langmuir. 2008;24:11003–11008. doi: 10.1021/la801497d. [DOI] [PMC free article] [PubMed] [Google Scholar]
- 37.Karoonuthaisiri N, Titiyevskiy K, Thomas JL. Destabilization of Fatty Acid-Containing Liposomes By. Polyamidoamine Dendrimers. Colloids and Surfaces B-Biointerfaces. 2003;27:365–375. [Google Scholar]
- 38.Betley TA, Holl MMB, Orr BG, Swanson DR, Tomalia DA, Baker JR. Tapping Mode Atomic Force Microscopy Investigation of Poly(amidoamine) Dendrimers: Effects of Substrate and Ph on Dendrimer Deformation. Langmuir. 2001;17:2768–2773. [Google Scholar]
- 39.Garidel P, Blume A. 1,2-Dimyristoyl-Sn-Glycero-3-Phosphoglycerol (DMPG) Monolayers: Influence of Temperature, Ph, Ionic Strength and Binding of Alkaline Earth Cations. Chem Phys Lipids. 2005;138:50–59. doi: 10.1016/j.chemphyslip.2005.08.001. [DOI] [PubMed] [Google Scholar]
- 40.Mecke A, Lee I, Baker JR, Holl MMB, Orr BG. Deformability of Poly(Amidoamine) Dendrimers. European Physical Journal E. 2004;14:7–16. doi: 10.1140/epje/i2003-10087-5. [DOI] [PubMed] [Google Scholar]
- 41.Wohlert J, den Otter WK, Edholm O, Briels WJ. Free Energy of a Trans-Membrane Pore Calculated from Atomistic Molecular Dynamics Simulations. J Chem Phys. 2006;124:9. doi: 10.1063/1.2171965. [DOI] [PubMed] [Google Scholar]
- 42.Mecke A, Lee DK, Ramamoorthy A, Orr BG, Holl MMB. Synthetic and Natural Polycationic Polymer Nanoparticles Interact Selectively with Fluid-Phase Domains of Dmpc Lipid Bilayers. Langmuir. 2005;21:8588–8590. doi: 10.1021/la051800w. [DOI] [PMC free article] [PubMed] [Google Scholar]
- 43.Maiti PK, Cagin T, Wang GF, Goddard WA. Structure of Pamam Dendrimers: Generations 1 through 11. Macromolecules. 2004;37:6236–6254. [Google Scholar]
- 44.Parimi S, Barnes TJ, Prestidge CA. Pamam Dendrimer Interactions with Supported Lipid Bilayers: A Kinetic and Mechanistic Investigation. Langmuir. 2008;24:13532–13539. doi: 10.1021/la8022858. [DOI] [PubMed] [Google Scholar]
- 45.Gardikis K, Hatziantoniou S, Viras K, Wagner M, Demetzos C. A DSC and Raman Spectroscopy Study on the Effect of Pamam Dendrimer on DPPC Model Lipid Membranes. Int J Pharm. 2006;318:118–123. doi: 10.1016/j.ijpharm.2006.03.023. [DOI] [PubMed] [Google Scholar]
- 46.Klajnert B, Epand RM. Pamam Dendrimers and Model Membranes: Differential Scanning Calorimetry Studies. Int J Pharm. 2005;305:154–166. doi: 10.1016/j.ijpharm.2005.08.015. [DOI] [PubMed] [Google Scholar]
- 47.Klajnert B, Stanislawska L, Bryszewska M, Palecz B. Interactions between PAMAM Dendrimers and Bovine Serum Albumin. Biochimica Et Biophysica Acta-Proteins and Proteomics. 2003;1648:115–126. doi: 10.1016/s1570-9639(03)00117-1. [DOI] [PubMed] [Google Scholar]
- 48.Ottaviani MF, Daddi R, Brustolon M, Turro NJ, Tomalia DA. Structural Modifications of DMPS Vesicles Upon Interaction with Poly(Amidoamine) Dendrimers Studied by Cw-Electron Paramagnetic Resonance and Electron Spin-Echo Techniques. Langmuir. 1999;15:1973–1980. [Google Scholar]
- 49.Ottaviani MF, Matteini P, Brustolon M, Turro NJ, Jockusch S, Tomalia DA. Characterization of Starburst Dendrimers and Vesicle Solutions and Their Interactions by CW- and Pulsed-Epr, Tem, and Dynamic Light Scattering. J Phys Chem B. 1998;102:6029–6039. [Google Scholar]
- 50.Record MT, Lohman TM, Dehaseth P. Ion Effects on Ligand-Nucleic Acid Interactions. J Mol Biol. 1976;107:145–158. doi: 10.1016/s0022-2836(76)80023-x. [DOI] [PubMed] [Google Scholar]
- 51.Majoros IJ, Myc A, Thomas T, Mehta CB, Baker JR. Pamam Dendrimer-Based Multifunctional Conjugate for Cancer Therapy: Synthesis, Characterization, and Functionality. Biomacromolecules. 2006;7:572–579. doi: 10.1021/bm0506142. [DOI] [PubMed] [Google Scholar]
- 52.Ipsen JH, Karlstrom G, Mouritsen OG, Wennerstrom H, Zuckermann MJ. Phase-Equilibria in the Phosphatidylcholine-Cholesterol System. Biochim Biophys Acta. 1987;905:162–172. doi: 10.1016/0005-2736(87)90020-4. [DOI] [PubMed] [Google Scholar]
- 53.Brooks BR, Bruccoleri RE, Olafson BD, States DJ, Swaminathan S, Karplus M. Charmm - a Program for Macromolecular Energy, Minimization, and Dynamics Calculations. J Comput Chem. 1983;4:187–217. [Google Scholar]
- 54.MacKerell AD, Bashford D, Bellott M, Dunbrack RL, Evanseck JD, Field MJ, Fischer S, Gao J, Guo H, Ha S, et al. Ll-Atom Empirical Potential for Molecular Modeling and Dynamics Studies of Proteins. J Phys Chem B. 1998;102:3586–3616. doi: 10.1021/jp973084f. [DOI] [PubMed] [Google Scholar]
- 55.Mercier GA. Dendrimer Builder. 1996 http://server.ccl.net/chemistry/resources/messages/1996/05/20.009-dir/index.html.
- 56.Humphrey W, Dalke A, Schulten K. Vmd: Visual Molecular Dynamics. Journal of Molecular Graphics. 1996;14:33. doi: 10.1016/0263-7855(96)00018-5. [DOI] [PubMed] [Google Scholar]
Associated Data
This section collects any data citations, data availability statements, or supplementary materials included in this article.