

Abstract
Osteoporosis and obesity remain a major public health concern through its associated fragility and fractures. Several animal models for the study of osteoporotic bone loss, such as ovariectomy (OVX) and denervation, require unique surgical skills and expensive set up. The challenging aspect of these age-associated diseases is that no single animal model exactly mimics the progression of these human-specific chronic conditions. Accordingly, to develop a simple and novel model of post menopausal bone loss with obesity, we fed either a high fat diet containing 10% corn oil (CO) or standard rodent lab chow (LC) to 12 month old female C57Bl/6J mice for 6 months. As a result, CO fed mice exhibited increased body weight, total body fat mass (BFM), abdominal fat mass and reduced bone mineral density (BMD) in different skeletal sites measured by Dual Energy X-ray Absorptiometry (DXA). We also observed that decreased bone mineral density (BMD) with age in CO fed obese mice was accompanied by increased bone marrow adiposity, up-regulation of PPARγ, cathepsin k and increased pro-inflammatory cytokines (IL-6 and TNF-α) in bone marrow and splenocytes, when compared to that of LC fed mice. Therefore, this appears to be a simple, novel and convenient age-associated model of post menopausal bone loss, in conjunction with obesity, which can be used in pre-clinical drug discovery to screen new therapeutic drugs or dietary interventions for the treatment of obesity and osteoporosis in the human population.
Keywords: Adipocytes, animal model, bone adiposity, fat mass, obesity, osteoporosis, pro-inflammatory cytokines
1. Introduction
Osteoporosis and obesity, two disorders of body composition, are growing in high proportion in the United States of America (USA), as well as worldwide (1). These are major public health concerns characterized by excess storage of body fat and excessive skeletal fragility, respectively, in the aging population. The direct cost associated with obesity in the USA is ∼$100 billion and for osteoporosis, it has risen rapidly and reached ∼17.5 billion dollars per year (2). Bone tissue undergoes remodeling throughout life, balancing between bone resorption and bone formation. Imbalances of bone remodelling can result in gross perturbations in skeletal structure, function and potentially rise in morbidity and shortening of lifespan (3, 4). Overweight is defined by body mass index (BMI) >25 that exceeds a standard body weight; however, the excess weight may also come from muscle, bone, fat, or body water (5). Obesity specifically refers to having a high amount of body fat, which is usually accompanied by abnormalities in leptin and insulin secretion and their action, together with defects in lipid and carbohydrate metabolism (6, 7).
Interestingly, obesity and osteoporosis share several features, including a genetic predisposition and common progenitor mesenchymal stem cells (MSCs) (1). The relationship between bone and fat formation within the bone marrow (BM) microenvironment is complex and remains an area of active investigation (8). The BM stroma contains MSCs, which are capable of differentiating into osteoblasts, chondrocytes, and adipocytes, among other cell phenotypes (9). In later life, there is an ongoing bone loss because during remodeling, resorption exceeds formation. This imbalance becomes evident around 35 years of age, and is especially important after 55 years of age, since an increase of 50-75% in bone resorption occurs in this period (10). These findings were consistent with classic pathological (2, 11, 12) and epidemiological studies (13, 14) linking decreased bone mineral density, increased BM adiposity and subsequent osteoporosis with aging.
Given the obesity epidemic in the USA (6, 7, 15), and in many other countries, and in particular the rising number of extremely obese adult women (13, 14, 16), increased attention should be drawn to the significant and interrelated public health issues of obesity and osteoporosis. The challenging aspect of these diseases is that no single animal model exactly mimics the progression of these age-associated human-specific chronic conditions. To develop new therapeutic treatments or dietary interventions there should be a unique study model to be developed using obesity, as well as osteoporosis, together. Thus, in search of a unique and simple animal model, we hypothesized the present investigation. It has to be acknowledged that there are a number of methods adopted to induce obesity (17) and osteoporosis in animals (18-22). The attempts have been made to establish a high fat diet-induced model of obesity associated with BM adiposity, with subsequent related osteopenia and osteoporosis, in female aging mice. We also investigated the effect of chronic high fat diet on lipopolysaccharide (LPS) induced cytokines in BM cells and splenocytes. In the present study, we used female C57Bl/6J aging mice and fed American Institute of Nutrition (AIN) 93 diet, containing 10% corn oil (CO) as a dietary fat source. CO is known to promote bone loss, obesity, impaired glucose tolerance, insulin resistance and thus represents a useful model for studying the early stages in the development of obesity, hyperglycemia type 2 diabetes (23) and osteoporosis. We have used omega-6 fatty acids enriched diet as a fat source which is commonly observed in today's Western diets basically responsible for the pathogenesis of many diseases (24). In the conclusion, decreased bone mineral density (BMD) in CO fat fed obese insulin resistant female C57Bl/6J aging mice was accompanied by increased BM adiposity, increased BM and splenocytes pro-inflammatory cytokines (IL-6 and TNF-α). Therefore, this simple and convenient model has a significant application in pre-clinical drug discovery to screen new therapeutic drugs or dietary interventions for the treatment of obesity and osteoporosis in the human population.
2. Materials and Methods
2.1 Reagents and ELISA kits
Histopaque, α-modified minimal essential medium (α-MEM), Roswell Park Memorial Institute, (RPMI) 1640 medium, LPS and fetal bovine serum were purchased from Sigma-Aldrich, USA. Glucose (QuantiChrom, Hayward, CA), Triglycerides (TGs) (Cayman Chemical Company, MI), and non-esterified fatty acids (NEFA) (Wako Pure Industries Ltd, Japan), were analyzed spectrophotometrically using Colorimetric Assay Kits following manufacturers' protocol. Insulin was analyzed using a rat/mouse Ultra sensitive rat insulin ELISA kit (Crystal Chem Inc. Research, Downers Grove, IL). TNF-α and IL-6 were measured by ready-set-go ELISA kits (eBioscience, Inc. San Diego, CA).
2.2 Animals and diet
Eleven month-old female mice, weighing 24-25 g, were purchased from Jackson Laboratories (Bar Harbor, Maine 04609 USA) and provided water and standard chow AIN93G (diet recommended by AIN for growth) ad libitum for one month. At twelve months, weight matched animals were divided into two groups each containing 20 mice. Subsequently, the animals were housed in a standard controlled animal care facility in cages (5 mice/cage) and fed a diet containing CO and one group maintained on standard lab chow (LC) rodent diet ad libitum for 6 months. The animals were maintained in a temperature controlled room (22 -25°C, 45% humidity) on a 12:12-h dark-light cycle. National Institutes of Health guidelines were strictly followed, and all the studies were approved by the Institutional Laboratory Animal Care and Use Committee of the University of Texas Health Science Center at San Antonio (San Antonio, TX). Body weight was measured weekly. The CO diet as a high fat diet was prepared using 10% CO with AIN93 semi-purified powdered ingredients (Table 1). Primarily, we selected CO which contains omega-6 fatty acids to underline the mechanism for bone loss along with obesity, predominantly in aging mice. The standard rodent LC diet was procured from Harlan, USA (Catalog No. Harlan Teklad LM-485 Mouse/Rat Sterilizable Diet). Body composition was measured at the beginning and at the termination of study using Dual energy X-ray Absorptiometry (DXA) using a Lunar PIXImus bone densitometer (GE, Madison, WI).
Table 1.
Composition of semi-purified AIN93 experimental diet
| Ingredientsa | Percent |
|---|---|
| Casein | 14.00 |
| Corn starch | 42.43 |
| Dextronized corn starch | 14.50 |
| Sucrose | 9.00 |
| Cellulose | 5.00 |
| AIN-93 mineral mix | 3.50 |
| AIN-93 vitamin mix | 1.00 |
| l-cystine | 0.18 |
| Choline bitartrate | 0.25 |
| TBHQ | 0.10 |
| Vitamin E | 0.04 |
| Corn oil | 10.00 |
All diet ingredients were purchased from MP Biomedicals (Irvine, CA).
2.3 Measurement of BMD, total fat mass and abdominal fat mass by DXA
Region specific BMD was measured by DXA, and data were analyzed using Lunar PIXImus mouse software (25). Prior to scanning, mice were anesthetized by an intramuscular injection of cocktail (0.1 mL/100 g body weight) containing Ketamine/Xylazine/PBS (3:2:5, by vol). The densitometer was calibrated daily with a phantom supplied by the manufacturer. During measurements, the animals were laid in prone position, with posterior legs maintained in external rotation with tape. Hip, knee and ankle articulations were in 90° flexion. Upon completion of scanning, BMD was determined in the following bone areas using the PIXImus software, version 2.1: distal femoral metaphysis (DFM) (knee joint) to include cancellous (trabecular) bone, proximal tibial metaphysis (PTM), femoral diaphysis (FD) and tibial diaphysis (TD). Intra-scan coefficients of variation were 0.79%, 3.30%, 1.35% and 3.48%, for DFM, PTM, FD and TD, respectively; interscan coefficients of variation were 5.47%, 3.86%, 5.12% and 1.36%, for DFM, PTM, FD and TD respectively. The coefficients of variation are in agreement with studies examining the precision and accuracy of the PIXImus densitometer (26). Similarly, total body fat mass (BFM) and abdominal fat mass were measured using PIXImus software.
2.4 Blood and tissue collection for biochemical and histological analysis
One week prior to sacrifice, mice were fasted for 6-8 hours, blood samples were taken from the intraorbital, retrobulbar plexus from anesthetized mice to measure fasting glucose, insulin, TGs and NEFA. At sacrifice, after 6 months on the experimental diet, the mice were anaesthetized and blood was obtained by intraorbital capillary plexus. Serum was collected and stored at −80°C. Liver and adipose tissue were weighed and frozen in liquid nitrogen and stored in −80°C. Spleen, tibia and femur were processed for subsequent splenocyte culture and BM culture, respectively. Right side of complete hind leg was fixed in 4% formalin and processed for hematoxylin (H) and eosin (E) staining.
2.5 Serum metabolites
Fasting glucose, TGs, and NEFA were analyzed spectrophotometrically using Colorimetric Assay Kits following manufacturers' protocol. Insulin, TNF-α and IL-6 were analyzed using ELISA kits as per the protocol supplied by the manufacturer.
2.6 Splenocyte preparation and culture
Spleens were aseptically removed and placed in 5 ml of RPMI 1640 medium supplemented with 25 mmol/L HEPES, 2 mmol/L glutamine, 100,000 U/L penicillin and 100 mg/L streptomycin. Single-cell suspensions were made by teasing spleens between frosted ends of two sterile glass slides. After a 5-min centrifugation at 100× g to separate cells from debris, the cells were washed twice in RPMI medium. Splenic lymphocytes were isolated by layering over Histopaque, centrifuging at 1000 rpm for 15 min at 22°C and then washing twice in RPMI 1640 complete medium. Cells were counted, and viability was determined by trypan blue exclusion method. Cells (10×106 cells/well) were plated in 6-well plates, and bacterial LPS was added at a concentration of 5.0 μg/ml for 24 h at 37°C in a humidified atmosphere of air/CO2 95:5 (%). After 24 h, the culture medium was collected and analyzed for TNF-α and IL-6 by standard ELISA techniques (27).
2.7 Isolation of whole BM cells and culture
Whole BM cells were aseptically isolated as described (28). In brief, cells were counted and viability was determined by trypan blue exclusion method. Cells (10 × 106/well) were plated in 12 well plates and bacterial LPS was added at the concentration of 5.0 μg/ml for 24 h at 37°C in a humidified atmosphere of air/CO2 95:5 (%). After 24 h, cells and culture medium were collected together and centrifuged at 2000 rpm for 5 min. The pellets were stored at −80°C for gene expression assays and supernatants were analyzed for TNF-α and IL-6.
2.8 Measurement of Cathepsin K and PPARγ gene expression by real time RT-PCR
mRNA expression for genes encoding cathepsin K (ctsk) and PPARγ were measured using real time RT-PCR. Frozen bacterial LPS-stimulated, BM cells were vortexed in lysis buffer and RNA was isolated using RNeasy Mini Kit following the manufacturer's instructions (Qiagen, Valencia, CA). Total RNA concentration was assessed in NanoDrop™ 1000 spectrophotometer (Thermo Scientific, Wilmington, DE, USA). Real time RT-PCR was carried out using TaqMan® RNA-to-CT 1-step kit (Applied Biosystems, Foster City, CA) in an ABI Prism 7900HT Sequence Detection System (Applied Biosystems) using fluorescent TaqMan methodology. Real time quantitative RT-PCR was performed for each of the following genes, using ready-to-use primer and probe sets predeveloped by Applied Biosystems (TaqMan Gene Expression Assays) were used to quantify ctsk (ctsk, Mm00484036_m1), peroxisome proliferators-activated receptor (PPARγ) (pparγ, Mm01184321_m1) and Glyceraldehyde-3-phosphate dehydrogenase (Gapdh, Mm99999915_g1) as an endogenous control. mRNA Ct values for these genes were normalized to the house-keeping gene GAPDH, and expressed as relative increase or decrease to the LC group.
2.9 Histological evaluation of hind leg section for bone adiposity
Hind leg bones were cleaned, harvested in 10% phosphate buffered formalin, decalcified in 10% EDTA and processed as described (29) and stained with hematoxylin (H) and eosin (E). Lipid droplets were then evaluated as a relative vacuole area (μm2 or optical density) using a light microscope equipped with a digital camera and a Metaview image analysis system (Olympus America Inc, PA). The mean area of lipid droplets was calculated from six different fields.
2.10 HOMA and R-QUICKI
Homeostatic Model Assessment (HOMA) was calculated by the following formula: [fasting serum insulin (ng/mL) × fasting serum glucose (mM)]/22.5. A high HOMA index denotes low insulin sensitivity (30), although it should be acknowledged that the HOMA model has not been validated for use in animal models (31). To assess insulin sensitivity, another derived index of insulin resistance was suggested, i.e. the revised quantitative insulin sensitivity check index (R-QUICKI) (1/log insulin (mU/ml) + log glucose (mg/dl) + log NEFA (mmol/l)) (32).
2.11 Statistical analysis
Data are presented as mean values ± SEM. Students't-test was used to evaluate differences between samples of CO fed group and the corresponding LC as the control samples. A value P ≤0.05 was considered statistically significant. The analyses were performed using Graphpad prism for Windows (La Jolla, CA, USA).
3. Results
3.1 Body weights and serum metabolites
At 18 month of age, body weight (Figure 1) was higher for mice (37.18±0.85 g) fed a high-fat CO diet than for the mice (26.75 ± 0.85 g) fed a standard LC. As established in obesity prone C57BL/6J mice, age-related declines in vertebral and distal femoral trabecular bone volume occur early and continue throughout life and are more pronounced in females than males (33). Importantly, it should be emphasized that 10% CO in AIN-93 diet resulted in obesity, which is not caused by, 5% CO diet compared to LC (Data not shown). Therefore, 10% CO with chronic feeding is the initial threshold fat content at which there was development of obesity, as well as osteoporosis in female aging mice. Definitely increased CO fat content would accelerate the phenotypes of this animal model in short time. The visceral fat mass (intraorgan and periorgan fat) of the obese mice (2.84±0.33 g) was greater than that of the lean mice (0.91±0.24 g) (Table 2). The fasting serum glucose concentration was increased significantly in CO fed mice compared to that of LC fed mice (Table 3). The fasting serum insulin concentration was significantly increased (P<0.03) after a six months CO diet, demonstrating hyperinsulinemia compared to that of LC fed mice. However, the increased insulin levels were unable to control hyperglycemia, indicating insulin resistance. Fasting serum NEFA was significantly increased (P<0.001) in CO fed mice compared to LC group. The higher circulating levels of NEFA in CO fed mice represents insulin resistance, which is strongly associated with obesity. One responsible mechanism may be the generation of metabolic messengers, such as free fatty acids, by adipose tissue that inhibit insulin action on muscle (34). The serum TGs were significantly (P<0.02) increased in CO fed mice compared to that of LC fed mice (Table 3).
FIGURE 1.
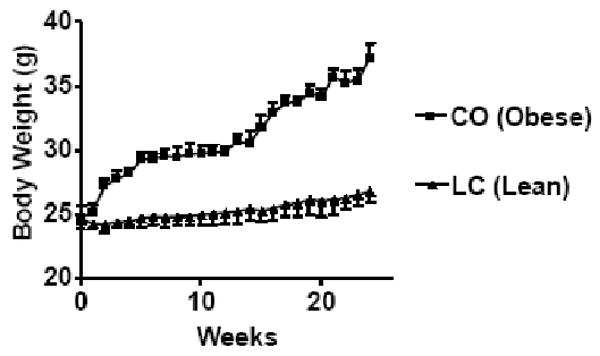
Body weight of 12 month old female C57Bl/6J mice fed CO diet and LC for 6 months. CO (obese) fed mice body weights were significantly different (P<0.001, CO Vs LC) compared to LC (lean) group analyzed by students t-test (unpaired).
Table 2.
Body composition of 12 month old female C57Bl/6J aging mice fed high fat diet CO and standard rodent LC diet for 6 months.
| Experimental Groups | |||
|---|---|---|---|
| Parameters /Diets | CO (Obese) | LC (Lean) | |
| Body weights | Baseline | 24.72±0.97 | 24.60±0.82 |
| Final | 37.18±1.12 (51)a | 26.75±0.44 (9)b | |
| Total body Fat mass | Baseline | 4.36±0.41 | 4.46±0.39 |
| Final | 14.23±0.63 (226) a | 4.51±0.34 (2) b | |
| Abdominal fat mass | Baseline | 1.33±0.32 | 1.46±0.29 |
| Final | 8.75±0.40 (557) a | 1.62±0.22 (10) b | |
Results are expressed as mean ± SEM, Means in row with superscripts without a common letter significantly different (P<0.05 CO Vs LC) analyzed using students t-test (unpaired). (n=15-17) Values in parentheses are % differences between baseline and final.
Table 3.
Serum metabolites and organ weights in 12 month old female C57Bl/6J aging mice fed with CO diet and standard LC diet for 6 months.
| Serum metabolites | ||
|---|---|---|
| Parameter | CO | LC |
| Glucose | 178.5±5.2 a | 86.0±3.97 b |
| Insulin | 0.21±0.04 a | 0.15±0.08 b |
| NEFA (mEq/L) | 1.60±0.13 a | 1.17±0.13 b |
| Triglycerides (mg/dl) | 59.2±3.5 a | 47.3±2.5 b |
| HOMA-IR | 1.66 ±0.21a | 0.57±0.14b |
| R-QUICKI | 0.56 ±0.13a | 0.85±0.10b |
| Organs weights | ||
| Liver (g) | 1.75±0.07 | 1.14±0.10 |
| Spleen (g) | 0.14±0.02 | 0.12±0.01 |
| Adipose tissue (g) | 2.84±0.33 a | 0.91±0.24 b |
Results are expressed as mean ± SEM, Means in row with superscripts without a common letter significantly different (P<0.05 CO Vs LC) analyzed by students (unpaired) t-test (n=15-17).
3.2 CO reduced BMD in femur and tibia regions and increased fat mass measured
We examined the baseline BMD of different bone regions prior to the start of the CO and LC diet, showed no differences in the baseline BMD values between the groups (Data not shown). To examine the effect of a high fat diet CO and LC on age-associated bone loss, we measured the BMD after 6 month, using DXA. The results are expressed as % difference (Figure 2). The BMD in femoral diaphysis (FD; P<0.02), distal end of the femoral metaphysis (DFM; P<0.01), proximal end of the tibial metaphysis (PTM; P<0.02), and tibial diaphysis (TD; P<0.01) regions of the CO fed mice was significantly lower than that of LC fed mice. In addition, CO fed mice had increased total body fat mass (BFM; P<0.001) and abdominal fat mass compared to that of LC group. These findings indicate that 12 month old mice, when placed on CO enriched high fat diet for 6 months, develop obesity as well as reduced bone density.
FIGURE 2.
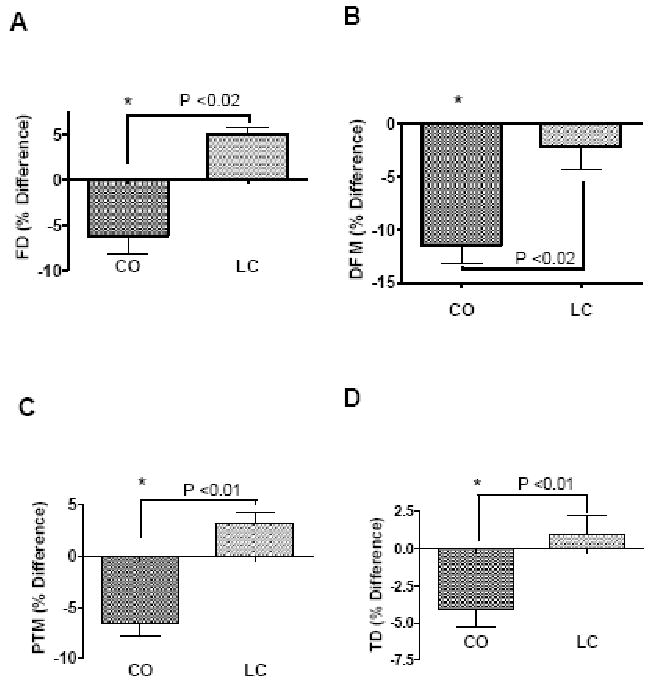
Effect of a high fat diet CO and LC feeding on BMD of (A) femoral diaphysis (FD), (B) distal femoral metaphysis (DFM), (C) proximal tibial metaphysis (PTM) and (D) tibial diaphysis (TD). Values represent percentage of change in BMD from baseline value determined at the beginning of the experiment. 12 month old female C57Bl/6J aging mice were fed with CO and LC diet for 6 months. Values with asterisk sign is significantly different (P<0.05 CO Vs LC) analyzed by students t-test (unpaired) (P<0.05).
3.3 CO increased bone adiposity
Hind leg bone sections from 18 month old mice fed an experimental diet for 6 months, revealed that CO-induced a significant accumulation of adipocytes (relative vacuole area and optical density) (Table 4) (Figure 3), when compared to LC. Bone forming osteoblasts and fat forming adipocytes are both derived from mesenchymal stem cells (MSCs) (35), which are found in many tissues and are abundant in the BM stroma (36). Increased bone adiposity in the hind leg bone section in CO group revealed a possible reduction of osteoblastogenesis compared to that of LC group.
Table 4.
Total adipocytes area in femur and tibia expressed as area in (μm2) and optical density (OD) in CO fed obese and LC fed lean female C57Bl/6J aging mice.
| Groups | CO (Obese) | LC (Lean) | ||
|---|---|---|---|---|
| Region of interest /Parameter |
Area (μm2) | OD | Area (μm2) | OD |
| FD | 54172.0±89.2 a | 444.3±12.3a | 1380.6±43.2 b | 90.7±12.4b |
| DFM | 35046.8±74.1 a | 469.4±19.4 a | 6858.7±44.7 b | 167.2±17.4 b |
| PTM | 221871.2±88.3 a | 462.0±23.4 a | 2070.1±38.4 b | 131.7±14.5b |
| TD | 126778.4±91.2 a | 814.1±15.0 a | 4588.0±51.8 b | 167.6±15.4b |
Results are expressed as mean ± SEM, Means in row with superscripts without a common letter significantly different (P<0.05 CO Vs LC) analyzed by students t-test (unpaired) (n=6-8). DFM: Distal femoral metaphysis, FD: femoral diaphysis, PTM: Proximal tibial metaphysis, TD: Tibial diaphysis.
FIGURE 3.
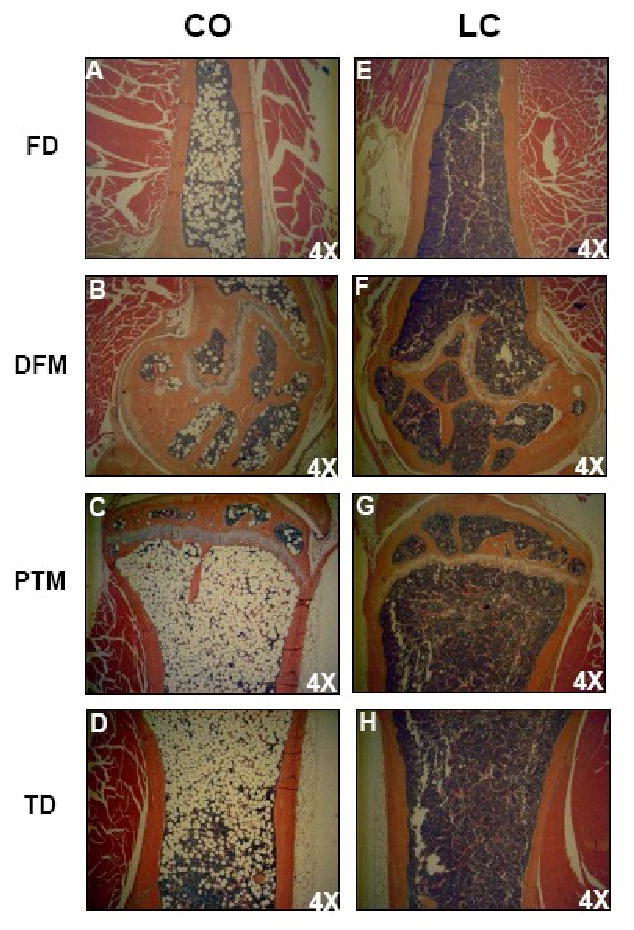
Photomicrographs of femur and tibia of CO and LC fed mice. CO fed obese (left) mice showing increased bone marrow adiposity of femur (FD, DFM) and tibia (PTM, TD) than lean mice (right) maintained on standard LC diet. In CO fed mice the bone marrow from femur and tibia showing increased number of adipocytes filling the cavity of femur and tibia in obese mice (left) than LC (right).
3.4 CO fed mice increased Cathepsin K and PPARγ gene expression by LPS stimulated BM cells
Quantitative real time RT-PCR further demonstrated that, bacterial LPS-stimulated mRNA expression of ctsk was significantly increased (P<0.02) in the BM of CO fed mice as compared to that of LC fed mice, suggesting that CO increased osteoclastogenic bone resorption, thus a decline in BMD (Figure 4A). Attempts were made to determine the RUNX2 mRNA expression, however, the levels were not detectable in BM cells (Data not shown). Furthermore, as expected the PPARγ was significantly increased (P<0.04) in CO group as compared to that of LC group (Figure 4B). The stimulatory effects on ctsk by CO in BM cells, using quantitative real-time RT-PCR analyses, confirmed the possible role of a high fat diet in the induction of bone resorption in aging mice.
FIGURE 4.
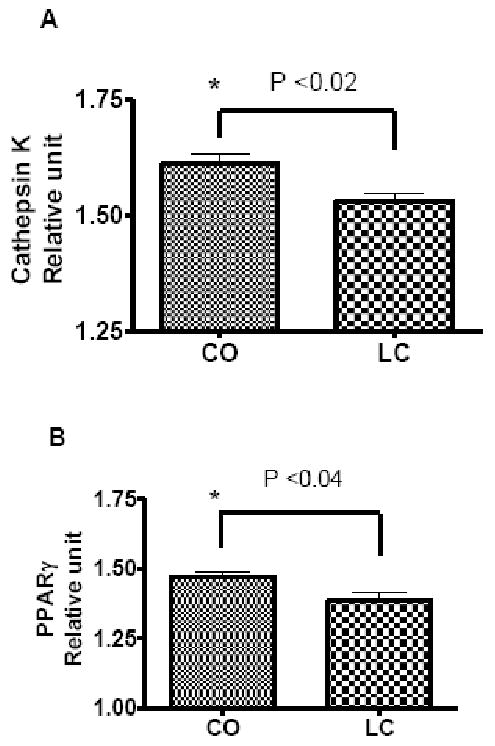
CO up-regulates osteoclasts specific gene cathepsin K (A) expression and bone marrow adiposity specific gene PPARγ (B). Expression of cathepsin K and PPARγ was determined by real-time RT-PCR in LPS-stimulated bone marrow cells of female C57Bl/6J aging mice fed either a high fat diet CO or LC as a control for 6 months. Results are expressed as means ± SEM; Values with asterisk sign is significantly different (P<0.05 CO Vs LC) analyzed by students t-test (unpaired) (P<0.05).
3.5 CO fed mice increased LPS stimulated pro-inflammatory cytokines by BM cells and splenocytes
We observed an accelerated age-associated BMD-loss in CO fed mice, which had an impact on bone-resorbing inflammation-related cytokines expression. Pro-inflammatory cytokines, like IL-6 and TNF-α, are key regulators of osteoclastogenic activity and have been shown to increase bone resorption with age in humans (37). We found a significant increase in IL-6 (P<0.03) and TNF-α (P<0.04) production by LPS treated splenocytes (Figure 5 A and B) and BM cells (Figure 5 C and D) of the CO group than that of the LC group. These results indicate that the induction or stimulation of pro-inflammatory cytokines by BM and splenocytes may be promoting age-associated bone loss in high fat fed mice indirectly by stimulating bone resorbing osteoclastogenesis.
FIGURE 5.
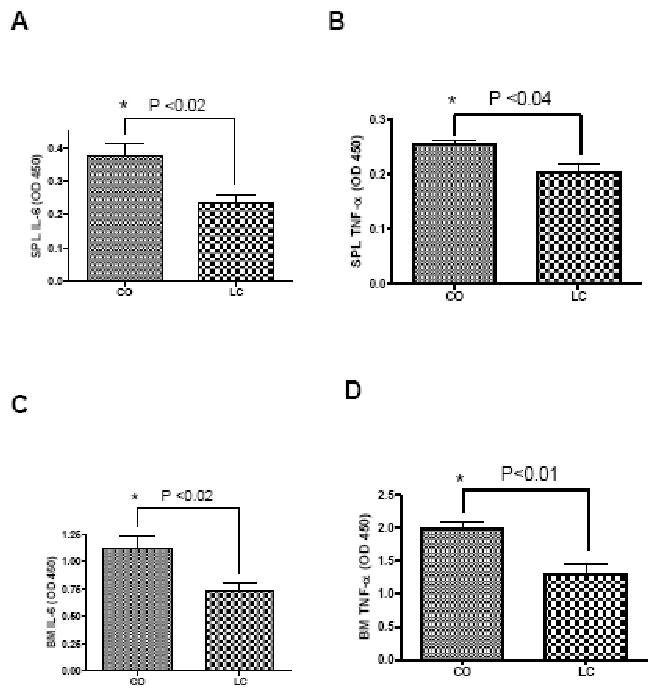
LPS-stimulated cytokines IL-6 and TNF-α by splenocytes (SPL) (A and B) and bone marrow (BM) cells (C and D) of CO fed mice and LC fed control mice. 12 month old female C57Bl/6J mice were fed with CO and LC diets for 6 months used for SPL and BM cultures. Values with asterisk sign is significantly different (P<0.05 CO Vs LC) analyzed by students t-test (unpaired) (P<0.05).
4. Discussion
There are several useful models of bone loss induced by ovariectomy (OVX) (18, 19), denervation (21), LPS administration (22) and tail-suspension (20) which however, require distinctive surgical skills, care and are also traumatic to animals. Alternatively, a high fat diet-induced obesity in mice is a simple and convenient method. The OVX model is considered as the gold standard for the evaluation of pharmaceuticals or dietary interventions for postmenopausal osteoporosis (18, 19), which requires expensive set up, as well as highly surgical skilled personnel. However, considering the enormous population of obese women (13, 16) with osteoporosis (14), there is no single animal model available to screen the new pharmaceutical drugs or dietary interventions to treat these chronic age related conditions together. We established a simple and novel model of post menopausal bone loss and obesity together, in female C57Bl/6J aging mice fed this diet for 6 months. Importantly, this model can be established very conveniently and is useful to mimic age-associated post menopausal osteoporosis as well as obesity, as these conditions are commonly observed in aging post menopausal women populations (14, 16).
The epidemiologic study of osteoporosis showed that the prevalence of bone loss among women and men aged 60 years and over is 22.8% and 14.5%, respectively, giving rise to about 80,000 new fractures a year, which is the main feature of the aging process (38). This chronic disease observed in postmenopausal women is also associated with obesity (16). It is characterized by an increased bone loss in women more than men (16, 38). In our current study, we observed a significant bone loss, particularly in FD, DFM, PTM and TD regions in 18 month old female C57Bl/6J mice, fed a high fat diet for 6 months, demonstrating an age-associated bone loss animal model combined with obesity.
Several potential mechanisms have been proposed to explain the complex relationship between fat and bone mass. One straightforward explanation is that, larger fat mass imposes a greater mechanical stress on bone, and in response, bone mass increases to accommodate the greater load. However, only ∼ 27% and 38% of total body weight in white men and women respectively is attributable to fat mass (39). Therefore, weight-associated gravitational forces coupled with increased fat mass may be inadequate to explain the impact of fat mass on bone. Studies of adipocyte function have revealed that adipose tissue is not just an inert organ for energy storage. It expresses and secretes a variety of biologically active molecules, including TNF-α and IL-6 (40). Besides, adipocytes and osteoblasts originate from a common progenitor, the pluripotential MSCs (Figure 6) (41, 42). These stem cells exhibit an equivalent tendency for differentiation into adipocytes or osteoblasts, that may contribute to the ultimate effect of fat mass on bone (2). In this investigation, we clearly observed the negative effect of obesity on bone and noted a significant bone loss in obese female aging mice fed a high fat diet.
FIGURE 6.
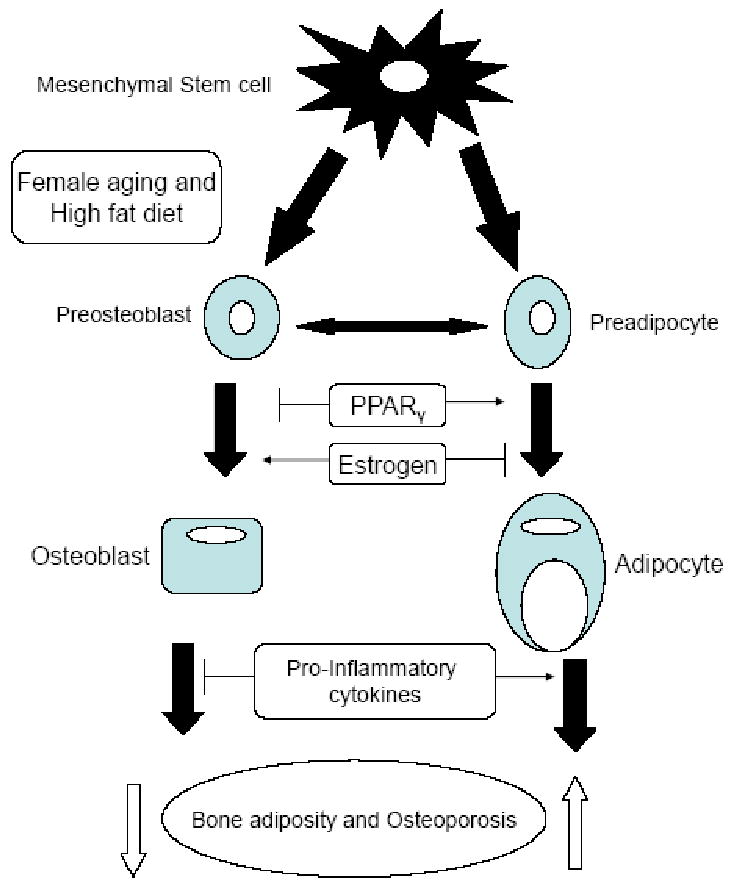
Common factors shared in osteoblast and adipocyte differentiation. Osteoblast and adipocytes originate from common progenitor-mesenchymal stem cells. The balance of their differentiation is determined by several common factors including PPARγ and estrogen. Adipocyte secretes a variety of inflammatory cytokines including IL-6 and TNF-α may be involved in bone metabolism and human energy homeostasis. Adapted from J Bone Miner Res 2008; 23; 17-29 with permission of the American Society for Bone and Mineral Research (2).
There is growing evidence supporting cysteine proteases, such ctsk in the adipogenesis and the onset of obesity, while it has been found to be over expressed in the white adipose tissue of obese individuals (43, 44). With respect to BM, ctsk is the most abundantly expressed cysteine protease in the osteoclasts (45) and is believed to be instrumental in bone matrix degradation necessary for bone resorption. The bone loss is brought about by an imbalance between bone resorption and formation. Increased ctsk in LPS stimulated whole BM indicated that the observed bone loss in a high fat diet fed mice may be due to increased osteoclasts. Moreover, increased adipocytes in BM, provides a novel target for developing agents to treat osteoporosis, characterized by increased bone resorption (46) and BM adiposity (47). Furthermore, our present findings of increased ctsk in high fat fed mice may be associated with increased bone resorption and enhanced ostoclastogenesis, as observed by other investigators (46).
The PPARγ signaling plays a key regulatory role in commencing adipogenesis (48). In the BM, PPARγ2 regulates osteoblast development and bone formation negatively and regulates BM adipocyte differentiation positively. Importantly, n-6 fatty acids activate PPARγ expression in BM cells which contributes to fatty bone formation in this model. (49). PPARγ ligands not only induce murine BM stem cell adipogenesis but also inhibit osteogenesis (50). It has been established that the PPARγ pathway is also associated with fat redistribution and bone loss related to aging (51). In fact, the expression of PPARγ in subcutaneous fat tissue is lower in older monkeys than young and mutations of the PPARγ gene are associated with an altered balance between bone and fat formation in the marrow (8, 51, 52). In advanced age, subcutaneous and visceral fat deposit size increases in menopausal women (53), whereas fat deposits in BM also increases. It has been suggested that PPARγ accounts for increased BM fat and decreased production of osteoblasts related to aging.
Adipocytes and osteoblasts originate from MSCs (Figure 6) (1, 41, 42). These cells show an equal proclivity for differentiation into adipocytes or osteoblasts, and the balance of the differentiation is synchronized by numerous interacting pathways that may contribute to the effect of fat mass on bone. In the present study, increased BM adiposity in high fat fed female aging mice suggests the suitability of this model for the development of dietary intervention or drugs for the treatment of age-associated post menopausal bone loss, linked with obesity.
The association of obesity, insulin resistance, and chronic low-grade inflammation has been evident for several years (40). Since, these factors are related to aging as well, the mechanisms underlying this association are of critical importance in gerontology. Pro-inflammatory cytokines (TNF-α and IL-6) are released from adipocytes, the adipose tissue matrix, and elsewhere (40, 54). Overweight and obese women generally have elevated serum levels of IL-6 and TNF-α (2, 40). It has been reported that IL-6 and TNF-α stimulates osteoclastogenesis (55) and these are generally recognized as osteoresorptive factors (56). Increased LPS-induced pro-inflammatory cytokines by BM cells and splenocytes of obese CO fed mice suggested that the possible bone loss may be due to increased bone resorption.
The importance of the present findings is emphasized by the fact that millions of menopausal women worldwide are affected by osteoporosis every year and the universal prevalence of obesity has reached epidemic proportions. In order to develop new treatment therapies, we found that using female C57Bl/6J aging mice fed on high fat diet, developed BM adiposity, associated with reduced BMD and increased pro-inflammatory cytokines, would be very helpful. This novel animal model provides us with a simple and effective method to develop new molecules or dietary interventions for the treatment of osteoporosis and obesity, which is widespread in the aging women population.
Acknowledgments
Funding sources: Supported by National Institutes of Health 1R01AT004259-01 grant.
Footnotes
Publisher's Disclaimer: This is a PDF file of an unedited manuscript that has been accepted for publication. As a service to our customers we are providing this early version of the manuscript. The manuscript will undergo copyediting, typesetting, and review of the resulting proof before it is published in its final citable form. Please note that during the production process errors may be discovered which could affect the content, and all legal disclaimers that apply to the journal pertain.
References
- 1.Rosen CJ, Bouxsein ML. Mechanisms of disease: is osteoporosis the obesity of bone? Nat Clin Pract Rheumatol. 2006;2:35–43. doi: 10.1038/ncprheum0070. [DOI] [PubMed] [Google Scholar]
- 2.Zhao LJ, Jiang H, Papasian CJ, et al. Correlation of obesity and osteoporosis: effect of fat mass on the determination of osteoporosis. J Bone Miner Res. 2008;23:17–29. doi: 10.1359/JBMR.070813. [DOI] [PMC free article] [PubMed] [Google Scholar]
- 3.Boyle WJ, Simonet WS, Lacey DL. Osteoclast differentiation and activation. Nature. 2003;423:337–42. doi: 10.1038/nature01658. [DOI] [PubMed] [Google Scholar]
- 4.Rodan GA, Martin TJ. Therapeutic approaches to bone diseases. Science. 2000;289:1508–14. doi: 10.1126/science.289.5484.1508. [DOI] [PubMed] [Google Scholar]
- 5.Nelson-Dooley C, Della-Fera MA, Hamrick M, Baile CA. Novel treatments for obesity and osteoporosis: targeting apoptotic pathways in adipocytes. Curr Med Chem. 2005;12:2215–25. doi: 10.2174/0929867054864886. [DOI] [PubMed] [Google Scholar]
- 6.Batsis JA, Nieto-Martinez RE, Lopez-Jimenez F. Metabolic syndrome: from global epidemiology to individualized medicine. Clin Pharmacol Ther. 2007;82:509–24. doi: 10.1038/sj.clpt.6100355. [DOI] [PubMed] [Google Scholar]
- 7.Lorenzo C, Serrano-Rios M, Martinez-Larrad MT, et al. Which obesity index best explains prevalence differences in type 2 diabetes mellitus? Obesity (Silver Spring) 2007;15:1294–301. doi: 10.1038/oby.2007.151. [DOI] [PubMed] [Google Scholar]
- 8.Gimble JM, Zvonic S, Floyd ZE, Kassem M, Nuttall ME. Playing with bone and fat. J Cell Biochem. 2006;98:251–66. doi: 10.1002/jcb.20777. [DOI] [PubMed] [Google Scholar]
- 9.Rodriguez JP, Astudillo P, Rios S, Pino AM. Involvement of adipogenic potential of human bone marrow mesenchymal stem cells (MSCs) in osteoporosis. Curr Stem Cell Res Ther. 2008;3:208–18. doi: 10.2174/157488808785740325. [DOI] [PubMed] [Google Scholar]
- 10.Manolagas SC, Jilka RL. Bone marrow, cytokines, and bone remodeling. Emerging insights into the pathophysiology of osteoporosis. N Engl J Med. 1995;332:305–11. doi: 10.1056/NEJM199502023320506. [DOI] [PubMed] [Google Scholar]
- 11.Vost A. Osteoporosis: A Necropsy Study Of Vertebrae And Iliac Crests. Am J Pathol. 1963;43:143–51. [PMC free article] [PubMed] [Google Scholar]
- 12.Hartsock RJ, Smith EB, Petty CS. Normal Variations With Aging Of The Amount Of Hematopoietic Tissue In Bone Marrow From The Anterior Iliac Crest. A Study Made From 177 Cases Of Sudden Death Examined By Necropsy. Am J Clin Pathol. 1965;43:326–31. doi: 10.1093/ajcp/43.4.326. [DOI] [PubMed] [Google Scholar]
- 13.Miller ME, Kral JG. Surgery for obesity in older women. Menopause Int. 2008;14:155–62. doi: 10.1258/mi.2008.008028. [DOI] [PubMed] [Google Scholar]
- 14.Nunez NP, Carpenter CL, Perkins SN, et al. Extreme obesity reduces bone mineral density: complementary evidence from mice and women. Obesity (Silver Spring) 2007;15:1980–7. doi: 10.1038/oby.2007.236. [DOI] [PubMed] [Google Scholar]
- 15.James PT, Leach R, Kalamara E, Shayeghi M. The worldwide obesity epidemic. Obes Res. 2001;9(Suppl 4):228S–233S. doi: 10.1038/oby.2001.123. [DOI] [PubMed] [Google Scholar]
- 16.Hagey AR, Warren MP. Role of exercise and nutrition in menopause. Clin Obstet Gynecol. 2008;51:627–41. doi: 10.1097/GRF.0b013e318180ba84. [DOI] [PubMed] [Google Scholar]
- 17.Buettner R, Scholmerich J, Bollheimer LC. High-fat diets: modeling the metabolic disorders of human obesity in rodents. Obesity (Silver Spring) 2007;15:798–808. doi: 10.1038/oby.2007.608. [DOI] [PubMed] [Google Scholar]
- 18.Turner RT, Vandersteenhoven JJ, Bell NH. The effects of ovariectomy and 17 beta-estradiol on cortical bone histomorphometry in growing rats. J Bone Miner Res. 1987;2:115–22. doi: 10.1002/jbmr.5650020206. [DOI] [PubMed] [Google Scholar]
- 19.Kalu DN. The ovariectomized rat model of postmenopausal bone loss. Bone Miner. 1991;15:175–91. doi: 10.1016/0169-6009(91)90124-i. [DOI] [PubMed] [Google Scholar]
- 20.Bateman TA, Dunstan CR, Ferguson VL, Lacey DL, Ayers RA, Simske SJ. Osteoprotegerin mitigates tail suspension-induced osteopenia. Bone. 2000;26:443–9. doi: 10.1016/S8756-3282(00)00256-8. [DOI] [PubMed] [Google Scholar]
- 21.Bateman TA, Dunstan CR, Lacey DL, Ferguson VL, Ayers RA, Simske SJ. Osteoprotegerin ameliorates sciatic nerve crush induced bone loss. J Orthop Res. 2001;19:518–23. doi: 10.1016/S0736-0266(00)00057-7. [DOI] [PubMed] [Google Scholar]
- 22.Amar S, Zhou Q, Shaik-Dasthagirisaheb Y, Leeman S. Diet-induced obesity in mice causes changes in immune responses and bone loss manifested by bacterial challenge. Proc Natl Acad Sci USA. 2007;104:20466–71. doi: 10.1073/pnas.0710335105. [DOI] [PMC free article] [PubMed] [Google Scholar]
- 23.Surwit RS, Kuhn CM, Cochrane C, McCubbin JA, Feinglos MN. Diet-induced type II diabetes in C57BL/6J mice. Diabetes. 1988;37:1163–7. doi: 10.2337/diab.37.9.1163. [DOI] [PubMed] [Google Scholar]
- 24.Simopoulos AP. The importance of the ratio of omega-6/omega-3 essential fatty acids. Biomed Pharmacother. 2002;56:365–79. doi: 10.1016/s0753-3322(02)00253-6. [DOI] [PubMed] [Google Scholar]
- 25.Sun D, Krishnan A, Zaman K, Lawrence R, Bhattacharya A, Fernandes G. Dietary n-3 fatty acids decrease osteoclastogenesis and loss of bone mass in ovariectomized mice. J Bone Miner Res. 2003;18:1206–16. doi: 10.1359/jbmr.2003.18.7.1206. [DOI] [PubMed] [Google Scholar]
- 26.Nagy TR, Clair AL. Precision and accuracy of dual-energy X-ray absorptiometry for determining in vivo body composition of mice. Obes Res. 2000;8:392–8. doi: 10.1038/oby.2000.47. [DOI] [PubMed] [Google Scholar]
- 27.Rahman M, Halade GV, El Jamali A, Fernandes G. Conjugated linoleic acid (CLA) prevents age-associated skeletal muscle loss. Biochem Biophys Res Commun. 2009;383:513–8. doi: 10.1016/j.bbrc.2009.04.071. [DOI] [PMC free article] [PubMed] [Google Scholar]
- 28.Bhattacharya A, Rahman M, Sun D, Fernandes G. Effect of fish oil on bone mineral density in aging C57BL/6 female mice. J Nutr Biochem. 2007;18:372–9. doi: 10.1016/j.jnutbio.2006.07.002. [DOI] [PubMed] [Google Scholar]
- 29.Hiraga T, Williams PJ, Ueda A, Tamura D, Yoneda T. Zoledronic acid inhibits visceral metastases in the 4T1/luc mouse breast cancer model. Clin Cancer Res. 2004;10:4559–67. doi: 10.1158/1078-0432.CCR-03-0325. [DOI] [PubMed] [Google Scholar]
- 30.Matthews DR, Hosker JP, Rudenski AS, Naylor BA, Treacher DF, Turner RC. Homeostasis model assessment: insulin resistance and beta-cell function from fasting plasma glucose and insulin concentrations in man. Diabetologia. 1985;28:412–9. doi: 10.1007/BF00280883. [DOI] [PubMed] [Google Scholar]
- 31.Wallace TM, Levy JC, Matthews DR. An increase in insulin sensitivity and basal beta-cell function in diabetic subjects treated with pioglitazone in a placebo-controlled randomized study. Diabet Med. 2004;21:568–76. doi: 10.1111/j.1464-5491.2004.01218.x. [DOI] [PubMed] [Google Scholar]
- 32.Perseghin G, Caumo A, Caloni M, Testolin G, Luzi L. Incorporation of the fasting plasma FFA concentration into QUICKI improves its association with insulin sensitivity in nonobese individuals. J Clin Endocrinol Metab. 2001;86:4776–81. doi: 10.1210/jcem.86.10.7902. [DOI] [PubMed] [Google Scholar]
- 33.Glatt V, Canalis E, Stadmeyer L, Bouxsein ML. Age-related changes in trabecular architecture differ in female and male C57BL/6J mice. J Bone Miner Res. 2007;22:1197–207. doi: 10.1359/jbmr.070507. [DOI] [PubMed] [Google Scholar]
- 34.Boden G. Role of fatty acids in the pathogenesis of insulin resistance and NIDDM. Diabetes. 1997;46:3–10. [PubMed] [Google Scholar]
- 35.Pittenger MF, Mackay AM, Beck SC, et al. Multilineage potential of adult human mesenchymal stem cells. Science. 1999;284:143–7. doi: 10.1126/science.284.5411.143. [DOI] [PubMed] [Google Scholar]
- 36.Chen JL, Hunt P, McElvain M, Black T, Kaufman S, Choi ES. Osteoblast precursor cells are found in CD34+ cells from human bone marrow. Stem Cells. 1997;15:368–77. doi: 10.1002/stem.150368. [DOI] [PubMed] [Google Scholar]
- 37.Cheleuitte D, Mizuno S, Glowacki J. In vitro secretion of cytokines by human bone marrow: effects of age and estrogen status. J Clin Endocrinol Metab. 1998;83:2043–51. doi: 10.1210/jcem.83.6.4848. [DOI] [PubMed] [Google Scholar]
- 38.Crepaldi G, Romanato G, Tonin P, Maggi S. Osteoporosis and body composition. J Endocrinol Invest. 2007;30:42–7. [PubMed] [Google Scholar]
- 39.Zhao LJ, Liu YJ, Liu PY, Hamilton J, Recker RR, Deng HW. Relationship of obesity with osteoporosis. J Clin Endocrinol Metab. 2007;92:1640–6. doi: 10.1210/jc.2006-0572. [DOI] [PMC free article] [PubMed] [Google Scholar]
- 40.Rasouli N, Kern PA. Adipocytokines and the metabolic complications of obesity. J Clin Endocrinol Metab. 2008;93:S64–73. doi: 10.1210/jc.2008-1613. [DOI] [PMC free article] [PubMed] [Google Scholar]
- 41.Akune T, Ohba S, Kamekura S, et al. PPARgamma insufficiency enhances osteogenesis through osteoblast formation from bone marrow progenitors. J Clin Invest. 2004;113:846–55. doi: 10.1172/JCI19900. [DOI] [PMC free article] [PubMed] [Google Scholar]
- 42.Gregoire FM, Smas CM, Sul HS. Understanding adipocyte differentiation. Physiol Rev. 1998;78:783–809. doi: 10.1152/physrev.1998.78.3.783. [DOI] [PubMed] [Google Scholar]
- 43.Funicello M, Novelli M, Ragni M, et al. Cathepsin K null mice show reduced adiposity during the rapid accumulation of fat stores. PLoS ONE. 2007;2:e683. doi: 10.1371/journal.pone.0000683. [DOI] [PMC free article] [PubMed] [Google Scholar]
- 44.Chiellini C, Costa M, Novelli SE, et al. Identification of cathepsin K as a novel marker of adiposity in white adipose tissue. J Cell Physiol. 2003;195:309–21. doi: 10.1002/jcp.10253. [DOI] [PubMed] [Google Scholar]
- 45.Saftig P, Hunziker E, Wehmeyer O, et al. Impaired osteoclastic bone resorption leads to osteopetrosis in cathepsin-K-deficient mice. Proc Natl Acad Sci USA. 1998;95:13453–8. doi: 10.1073/pnas.95.23.13453. [DOI] [PMC free article] [PubMed] [Google Scholar]
- 46.Kyung TW, Lee JE, Phan TV, Yu R, Choi HS. Osteoclastogenesis by bone marrow-derived macrophages is enhanced in obese mice. J Nutr. 2009;139:502–6. doi: 10.3945/jn.108.100032. [DOI] [PubMed] [Google Scholar]
- 47.Stoch SA, Wagner JA. Cathepsin K inhibitors: a novel target for osteoporosis therapy. Clin Pharmacol Ther. 2008;83:172–6. doi: 10.1038/sj.clpt.6100450. [DOI] [PubMed] [Google Scholar]
- 48.Gimble JM, Robinson CE, Wu X, et al. Peroxisome proliferator-activated receptor-gamma activation by thiazolidinediones induces adipogenesis in bone marrow stromal cells. Mol Pharmacol. 1996;50:1087–94. [PubMed] [Google Scholar]
- 49.Huang JT, Welch JS, Ricote M, et al. Interleukin-4-dependent production of PPAR-gamma ligands in macrophages by 12/15-lipoxygenase. Nature. 1999;400:378–82. doi: 10.1038/22572. [DOI] [PubMed] [Google Scholar]
- 50.Lecka-Czernik B, Moerman EJ, Grant DF, Lehmann JM, Manolagas SC, Jilka RL. Divergent effects of selective peroxisome proliferator-activated receptor-gamma 2 ligands on adipocyte versus osteoblast differentiation. Endocrinology. 2002;143:2376–84. doi: 10.1210/endo.143.6.8834. [DOI] [PubMed] [Google Scholar]
- 51.Kirkland JL, Tchkonia T, Pirtskhalava T, Han J, Karagiannides I. Adipogenesis and aging: does aging make fat go MAD? Exp Gerontol. 2002;37:757–67. doi: 10.1016/s0531-5565(02)00014-1. [DOI] [PubMed] [Google Scholar]
- 52.Hotta K, Bodkin NL, Gustafson TA, Yoshioka S, Ortmeyer HK, Hansen BC. Age-related adipose tissue mRNA expression of ADD1/SREBP1, PPARgamma, lipoprotein lipase, and GLUT4 glucose transporter in rhesus monkeys. J Gerontol A Biol Sci Med Sci. 1999;54:B183–8. doi: 10.1093/gerona/54.5.b183. [DOI] [PubMed] [Google Scholar]
- 53.Brooks ER, Heltz D, Wozniak P, Partington C, Lovejoy JC. Lateral spine densitometry in obese women. Calcif Tissue Int. 1998;63:173–6. doi: 10.1007/s002239900510. [DOI] [PubMed] [Google Scholar]
- 54.Fernandez-Real JM, Ricart W. Insulin resistance and chronic cardiovascular inflammatory syndrome. Endocr Rev. 2003;24:278–301. doi: 10.1210/er.2002-0010. [DOI] [PubMed] [Google Scholar]
- 55.Kitaura H, Sands MS, Aya K, et al. Marrow stromal cells and osteoclast precursors differentially contribute to TNF-alpha-induced osteoclastogenesis in vivo. J Immunol. 2004;173:4838–46. doi: 10.4049/jimmunol.173.8.4838. [DOI] [PubMed] [Google Scholar]
- 56.Rodan GA. Introduction to bone biology. Bone. 1992;13(Suppl 1):S3–6. doi: 10.1016/s8756-3282(09)80003-3. [DOI] [PubMed] [Google Scholar]