

Abstract
Tumor suppressor p53 is reported to be an attractive immunotherapy target because it is mutated in approximately half of human cancers, resulting in inactivation and often an accumulation of the protein in the tumor cells. Only low amounts of protein are detectable in normal tissues. The differential display of antigen in normal versus tumor tissues has been reported to create an opportunity to target p53 by immunotherapy. We sought to determine the relationship between p53 expression and its recognition by cognate T cells in human tumors including common epithelial malignancies. Inasmuch as nonsense or missense p53 mutations may disrupt processing and presentation, we studied tumors with either identified wild-type or mutated p53, based on our gene-sequencing studies or published data. T cells transduced with a high-affinity, p53264–272-reactive T cell receptor (TCR) derived from HLA-A2.1 transgenic mice recognized a wide panel of human tumor lines. There was no significant correlation between p53 expression in tumors and recognition by the anti-p53 TCR-transduced T cells. This conclusion was based on the study of 48 cell lines and is in contrast to several prior studies that used only a limited number of selected cell lines. A panel of normal cells was evaluated for recognition, and some of these populations were capable of stimulating anti-p53 T cells, albeit at low levels. These studies raise doubts concerning the suitability of targeting p53 in the immunotherapy of cancer patients.
Introduction
Tumor suppressor p53 is directly mutated in approximately half of human cancers and, including other mechanisms for inactivation such as MDM2 amplification, p53 function is believed to be disrupted in most of the remaining cases (Vogelstein et al., 2000). With mutation, critical p53 functions including cell cycle regulation, apoptosis induction, DNA repair, and angiogenesis are impaired, thus enabling tumorigenesis (Vogelstein et al., 2000). Mutant p53 also is thought to have a dominant transforming function in vivo, resulting in selective pressure to maintain its expression throughout tumor growth (Lang et al., 2004; Olive et al., 2004). In addition, p53 mutations often result in increased protein levels ascribed to an increased half-life from several minutes observed in normal cells to a t1/2 of hours (Reich et al., 1983; Rogel et al., 1985). The mechanism underlying the accumulation of p53 in tumors is not generally attributed to enhanced RNA transcription (Calabretta et al., 1986; Matlashewski et al., 1986) but to impaired MDM2-mediated ubiquitination of p53 and diminished proteasomal degradation (Kubbutat et al., 1997). The relatively low levels of p53 present in normal tissues compared with the elevated levels due to enhanced p53 stability in tumors is proposed to create a therapeutic window in which to target this antigen by immunotherapy (Theobald et al., 1995). This, in conjunction with the wide spectrum of tumors that possess p53 mutations, make it an attractive target for immunotherapy.
The evidence that p53 is targeted by the immune system results from multiple studies that demonstrated antibody and T cell responses specific for this antigen in patients with multiple forms of cancer. Immunogenicity of p53 in cancer patients was first suggested to occur because anti-p53 antibodies were demonstrated in the sera of breast cancer (Crawford et al., 1982), childhood B cell lymphoma (Defromentel et al., 1987), and lung cancer (Winter et al., 1992) patients but not in normal control subjects, a finding often correlated with missense mutations within the p53 gene (Winter et al., 1992; von Brevern et al., 1996). Cellular immune responses to p53 have been generated by in vitro stimulation of peripheral blood lymphocytes (PBLs) from normal donors and cancer patients (Tilkin et al., 1995; Röpke et al., 1996; Hoffmann et al., 2000, 2002; Albers et al., 2005; Black et al., 2005), and in vivo anti-p53 T cells have been raised from patients through peptide-pulsed cell and recombinant virus-based vaccines (van der Burg et al., 2002; Carbone et al., 2005; Antonia et al., 2006; Svane et al., 2007). Because of thymic and peripheral tolerogenic mechanisms, it has been proposed that the lack of high-affinity T cells specific for this self-antigen may be responsible for the difficulty in isolating high-affinity clones from humans (Theobald et al., 1995, 1997).
The success of adoptive cell transfer approaches for the treatment of patients with metastatic melanoma and the demonstration that treatment with autologous lymphocytes transduced with genes encoding anti-tumor T cell receptor (TCR) could mediate tumor regression has stimulated interest in generating high-affinity TCR capable of recognizing p53 epitopes (Dudley et al., 2005; Morgan et al., 2006). To circumvent tolerance to this self-antigen, several investigators immunized HLA-A2.1 mice with heteroclitic peptides with sequences that differed between human and mouse wild-type p53 to generate high-affinity T cells capable of killing human tumor cell lines (Theobald et al., 1995, 1997; Liu et al., 2000; Kuball et al., 2005). Indeed, we and others have demonstrated that PBLs transduced with a murine TCR isolated from these mouse T cell clones specific for the p53264–272 epitope were capable of lysing p53-expressing tumor cell lines while a limited number of p53-negative lines and normal cells were ignored (Liu et al., 2000; Cohen et al., 2005; Kuball et al., 2005). Thus, it has been postulated that these high-affinity anti-p53 TCR-transduced T cells may be useful in the gene therapy of cancer patients whose tumors overexpress p53.
The administration or generation of high-avidity T cells specific for a ubiquitously expressed antigen such as p53 relies on a differential antigenic display between tumor versus normal cells. Although there is considerable confusion in the literature, a correlation between p53 protein overexpression in tumor cells and cognate T cell recognition compared with absent or limited p53 expression in tumors or normal cells that are ignored is purported to provide the basis for targeting p53 by immunotherapy. In addition to the studies with anti-p53 TCR-transduced T cells that implicated the requirement for p53 expression in tumors to serve as T cell targets based on relatively few cell lines (Liu et al., 2000; Cohen et al., 2005; Kuball et al., 2005), the requirement of p53 overexpression for anti-p53 T cell recognition was also reported with T cells generated from mice (Theobald et al., 1995, 1997) and humans (Gnjatic et al., 1998; Tokunaga et al., 2005). The requirement for p53 overexpression in tumors for T cell recognition has certainly been challenged, and investigators have reported instances of T cell recognition of tumors without demonstrable p53 expression, especially in the context of human papilloma virus (HPV) infection, a setting leading to enhanced proteasomal degradation of p53 (Röpke et al., 1996; Vierboom et al., 2000; Sirianni et al., 2004).
In human tumors, we thus sought to study the relationship between p53 expression in tumor cell lines and recognition by T cells expressing a high-affinity TCR specific for the immunodominant p53 epitope, p53264–272. We employed a panel of melanoma cell lines and well-characterized tumor cell lines with known p53 gene sequences from multiple cancer origins, such as the NCI-60 cell lines, to investigate this relationship. From our studies we concluded that there was no correlation between p53 expression in tumors and cognate T cell recognition. In addition, some normal cell lines also stimulated the production of interferon (IFN)-γ, although generally at lower levels. These findings raise questions concerning the suitability of p53 as an immunotherapy target and have broader implications for the screening of appropriate candidate patients for p53-based immunotherapy as well as clinical monitoring for autoimmunity in these patients.
Materials and Methods
Tumor cell lines
HLA-A2.1+ melanoma cell lines (2436, 2207, 1861, 2319, 1890, 2081, 2218, 2098, 2224, 1994, 526, 624, and 1833) and HLA-A2− cell lines (888, 938, 1350, and 1848) were generated at the Surgery Branch of the National Cancer Institute (NCI; National Institutes of Health [NIH], Bethesda, MD) as previously described (Topalian et al., 1989). The NCI-60 cell lines were obtained from the Developmental Therapeutics Program (NCI, NIH) and the TC-71 cell line was a gift from H. Khong (Surgery Branch, NCI). IM-9 (CCL-159; American Type Culture Collection [ATCC], Manassas, VA), U-937 (CRL-1593.2; ATCC), H2087 (CRL-5922; ATCC), and SaOS2/143 (Theobald et al., 1995) cell lines were obtained. Tumor cells were cultured in RPMI (Lonza Walkersville, Walkersville, MD) with 10% fetal calf serum (FCS; Invitrogen, Carlsbad, CA) supplemented with penicillin (100 U/ml)/streptomycin (100 μg/ml) and l-glutamine (2 mM; Lonza) and maintained in a 37°C incubator at 5% CO2.
Normal cell lines and autologous cell targets
Peripheral blood mononuclear cells (PBMCs) were collected by leukapheresis from metastatic melanoma patients at the Surgery Branch of the NCI and separated by centrifugation in Ficoll/Hypaque medium. PBLs were cryopreserved in a liquid nitrogen freezer. A renal epithelial cell line was a gift from S. Garrett and D. Sens (University of North Dakota, Grand Forks, ND); fibroblast cell lines were generated at the Surgery Branch of the NCI; and an astrocyte cell line was obtained from All Cells (Berkeley, CA). PBLs were from metastatic melanoma patients treated at the Surgery Branch of the NCI.
Peripheral blood stem cells (PBSCs) were obtained from melanoma patients at the Surgery Branch of the NCI. Briefly, PBSCs were obtained by granulocyte colony-stimulating factor (G-CSF) mobilization followed by apheresis and CD34+ cell selection (CliniMACS; Miltenyi Biotec, Bergisch Gladbach, Germany). To obtain activated lymphocytes, thawed PBLs was placed into culture at 1–2 × 10⁶ cells/ml in 162-cm2 flasks (Costar; Corning Life Sciences, New York NY) in AIM V (Invitrogen) medium supplemented with 5% human AB serum (Valley Biomedical, Winchester, VA), l-glutamine, Pen/Strep, interleukin (IL)-2 (300 IU/ml) (Chiron), and OKT3 (Orthoclone, 50 ng/ml; Ortho Biotech, Bridgewater, NJ) and maintained between 0.5 × 10⁶ and 3 × 10⁶ cells/ml for 96 hr. Dendritic cells were generated from PBMCs as previously described (Sallusto and Lanzavecchia, 1994). Briefly, thawed PBMCs were placed in 162-cm2 flasks in AIM V for 2 hr, and nonadherent cells were washed away with RPMI. Medium was replaced with RPMI supplemented with 10% heat-inactivated human AB, Pen/Strep, l-glutamine, and 1000-IU/ml concentrations of recombinant human IL-4 and recombinant human granulocyte-macrophage colony-stimulating factor (GM-CSF) (PeproTech, Rocky Hill, NJ). Cells remained in culture for 4 days before use in experiments.
Transduction of PBLs
The MSGV1-based retrovirus encoding the TCR α and β chains specific for the human p53264–272 epitope (p53:264 TCR) used in this study was previously described (Cohen et al., 2005). A retrovirus using a similar MSGV1-based backbone encoding a TCR cloned from a T cell line isolated in HLA-A2.1 transgenic mice and targeting the gp100154–162 epitope was used as a control (gp100:154 TCR; a generous gift from Z. Yu, NCI). Thawed PBLs were placed into culture at 1–2 × 10⁶ cells/ml in 162-cm2 flasks (Costar) in AIM-V medium supplemented with 5% human AB serum (Valley Biomedical), l-glutamine, Pen/Strep, IL-2 (300 IU/ml), and OKT3 (Orthoclone, 50 ng/ml) for 48 hr. Retroviral vector transduction was performed with RetroNectin (Takara Bio, Otsu, Japan)-coated 6-well plates as described by the manufacturer. Cells were harvested and placed into 6-well (Becton Dickinson, Franklin Lakes, NJ) retrovirus-coated transduction plates at 0.25 to 0.5 × 10⁶ cells/ml in a total volume of 4 ml. After overnight incubation at 37°C, the process was repeated for a second transduction. The next day, cells were transferred into 162-cm2 flasks and expanded for up to 16 days while maintaining the cell density between 0.5 and 3 × 10⁶ cells/ml in a 37°C, 5% CO2 incubator. GLp53TCR is a p53:264 TCR-transduced T cell line that was transduced and expanded as described previously for 16 days after stimulation, aliquoted, and stored in liquid nitrogen. Flow cytometric analysis demonstrated that >99% of the cells were CD3+, 93.8% were CD8−, and 86.9% of the cells expressed the murine p53:264 TCR. In multiple experiments, these cells recognized p53264–272 peptide-pulsed T2 cells at a level of 1 nM as measured by specific IFN-γ release by enzyme-linked immunosorbent assay (ELISA).
p53 gene sequencing
Six pairs of primers to amplify exons 2–11 of p53 including splice junctions and accompanying sequencing primers were designed with Vector NTI (Invitrogen). Tumor cell line genomic DNA was isolated (Qiagen, Valencia, CA) and amplified by polymerase chain reaction (PCR) with a high-fidelity Taq polymerase (Invitrogen) on a thermocycler (MJ Research, Waltham, MA). PCR products were purified and sequenced on an ABI PRISM thermocycler (Applied Biosystems, Foster City, CA). Sequences were compared with a p53 reference sequence, GenBank X54156, to identify mutations.
Flow cytometry
Transduction efficiency for p53:264 or gp100:154 TCR insertion into PBLs was assessed by anti-murine TCR Vβ3 monoclonal antibody (mAb; clone KJ25, BD Biosciences, San Jose, CA) and HLA-A2.1/p53264–272 pentamer or HLA-A2.1/gp100154–162 pentamer (ProImmune, Bradenton, FL), respectively. For intracellular staining, cells were fixed and permeabilized with intracellular staining buffer (eBioscience, San Diego, CA) and stained with anti-p53 mAb or an isotype control (clone DO-7 and clone 27-35, respectively; BD Biosciences). Specific intracellular p53 staining is reported as percentage p53 (percentage anti-p53 mAb positive minus isotype control background) and as mean fluorescence intensity (MFI) p53 (MFI of anti-p53 mAb minus MFI of corresponding isotype control). Surface staining of normal cell populations included HLA-A2 (clone BB7.2), CD3 (SK-7), CD11c (B-ly6), CD34 (581), or the relevant isotype controls mIgG1 and mIgG2bκ (clones X40 and 27-35, respectively; BD Biosciences).
Western blot
From 5 × 10⁶ to 10 × 106 tumor cells were lysed in radioimmunoprecipitation assay (RIPA) buffer (EMD Biosciences, San Diego, CA) containing protease inhibitor cocktail (EMD Biosciences) and incubated for 30 min on ice. Lysate was centrifuged for 10 min at 12,000 rpm (Eppendorf, Hamburg, Germany) and the supernatant was transferred to a new microcentrifuge tube (Eppendorf). Sixty micrograms of protein was loaded on a sodium dodecyl sulfate (SDS) protein gel and electrophoresed. The separated proteins were blotted onto a nitrocellulose membrane for 1 hr at 30 V (Invitrogen). The membrane was blocked for 30 min with 5% dry milk–0.05% Tween 20 in phosphate-buffered saline (PBS). The washed membrane was incubated for 1 hr with anti-p53 mAb (D07 clone, 2 μg/ml; BD Biosciences); washed and incubated with horseradish peroxidase (HRP)-conjugated anti-mouse (diluted 1:10,000; BD Biosciences) for 60 min; and developed with chemoluminescent reagent (Pierce Biotechnology, Rockford, IL).
ELISA
Stimulation of TCR-transduced PBLs with tumor or normal cells were assessed by IFN-γ secretion. TCR-transduced PBLs (1 × 10⁵) were cultured with 1 × 10⁵ target cells overnight in a 96-well U-bottom plate (Costar) in 200 μl of RPMI 1640 (BioFluids, Rockville, MD) containing 10% FCS (BioFluids), Pen/Strep, and l-glutamine. Supernatants were harvested and analyzed for IFN-γ by ELISA (Pierce Biotechnology).
Results
p53:264 TCR-transduced T cell recognition of HLA-A2+ melanoma cell lines
To evaluate the relationship between p53 overexpression and recognition by T cells transduced with a p53-specific TCR cloned from HLA-A2.1 transgenic mice, we employed a panel of melanoma cell lines generated at the Surgery Branch of the NCI. p53:264 TCR-transduced T cells developed from the PBLs of two different patients were expanded in vitro for 7 days and assessed for recognition of the melanoma cell lines as measured by IFN-γ production in a standard overnight coculture assay. The level of transgenic TCR expression determined by murine Vβ3 immunocytofluorometric analysis was 48% and 44% in patient 1 and patient 2, respectively. As demonstrated in Fig. 1 (top), 11 of 13 of the HLA-A2+ melanoma lines were specifically recognized by cognate T cells compared with corresponding untransduced T cells. Control tumor cell lines including HLA-A2− melanoma lines (1350 and 1848) and the HLA-A2+, p53-deleted cell osteosarcoma line (SaOS2) did not stimulate anti-p53 T cells. A breast cancer cell line, MDA-231, containing a p53 missense mutation resulting in an amino acid change from an arginine to a lysine at position 280 and an SaOS2/143 tumor cell line stably transfected (Dittmer et al., 1993) with the p53 gene containing a mutation at position 143 were recognized by the antitumor T cells. In the same experiment, these tumor lines were tested for p53 expression by intracellular immunocytofluorometric analysis. Figure 1 (bottom) demonstrated p53 expression as indicated by specific percentage positive tumor cells and specific MFI in the control and melanoma lines. The melanoma lines are oriented from left to right in order of their ability to stimulate p53:264 TCR-transduced T cells. The melanoma lines inducing the three highest amounts of IFN-γ production demonstrated little if any specific p53 expression. Conversely, the melanoma lines with the four highest levels of p53 expression stimulated p53:264 TCR-transduced T cells to produce little IFN-γ (average, 606 pg/ml). Although not well recognized by p53:264 TCR-transduced T cells, three of these four melanoma lines were specifically recognized by a melanoma-specific cytotoxic T lymphocyte (CTL) line, JKF6, recognizing MART-127–35 with IFN-γ production of 8280, 5640, 5280, and 74 pg/ml, indicating the ability to process and present antigen in the context of HLA-A2.1 on the surface of tumor cells (data not shown). Concordance between p53 staining by immunohistochemistry in tumor cells and the presence of p53 mutations has been reported (Soong et al., 1996; Kressner et al., 1999), and the lack of recognition of the highest p53 expressers may have been related to particular nonsense mutations resulting in truncated proteins not containing the relevant p53264–272 epitope or missense mutations occurring at the epitope, thereby altering the recognition by our transduced T cells. To evaluate this possibility the p53 gene was sequenced in these cultured lines.
FIG. 1.
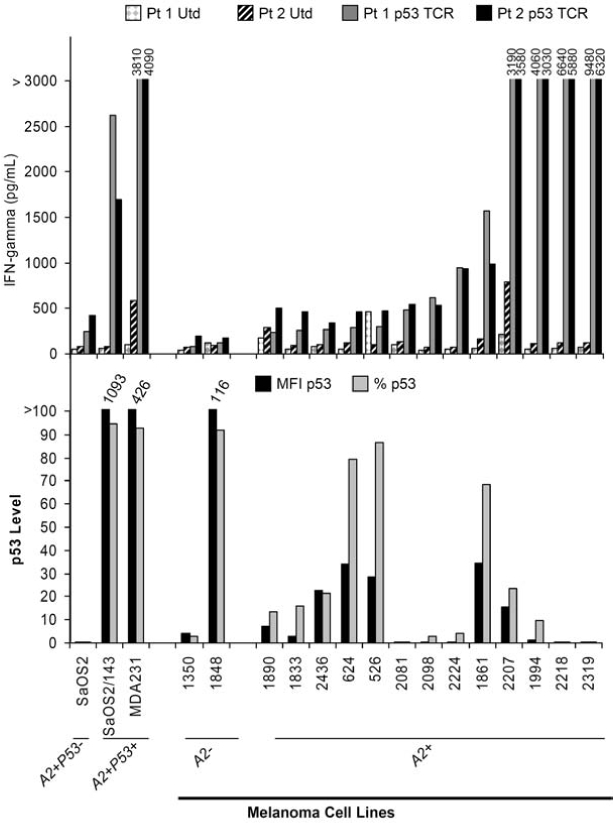
p53 expression by melanoma cell lines and stimulation of p53:264 TCR-transduced T cells. Top: PBLs from two patients (Pt 1 and Pt 2) were stimulated with OKT3 and left untransduced (Utd) or transduced (Td) on two separate days (days 2 and 3) with an MSGV1-based retrovirus encoding the α/β p53264–272 murine TCR (p53 TCR), resulting in a transduction efficiency of 48% (Pt 1 p53 TCR) and 44% (Pt 2 p53 TCR). T cells were expanded for an additional 5 days in vitro before culturing 1 × 10⁵ T cells with 1 × 10⁵ tumor cells overnight. IFN-γ production was determined by ELISA. Bottom: In the same experiment, 1 × 10⁶ tumor cells were assayed for p53 expression by flow cytometry with a PE-labeled mAb specific for mutant and wild-type p53 or isotype control. Both mean fluorescence intensity (MFI p53) and percentage of tumor cells (% p53) expressing p53 are shown (both values are corrected for background staining with the isotype control). SaOS2 (HLA-A2+p53−, osteosarcoma), SaOS2/143 (HLA-A2+p53+, osteosarcoma line transfected with a mutant p53 gene encoding an amino acid change at position 143), MDA-231 (HLA-A2+p53+, breast cancer), and HLA-A2− (1350 and 1848) or HLA-A2− (1890, 1833, 2436, 624, 526, 2081, 2098, 2224, 181, 2207, 1994, 2218, and 2319) melanoma cell lines were assayed.
p53 gene sequencing studies of melanoma lines reveals no relationship between p53 expression and recognition by cognate T cells
To determine whether the lack of correlation between p53 expression and recognition could be ascribed to particular p53 mutations that interrupt or disrupt the presentation of the p53264–272 epitope, we developed genomic primers that encompassed the coding sequence of p53, exons 2–11. Table 1 summarizes the p53 gene sequencing results of the 13 HLA-A2+ melanoma lines that were tested in the experiment illustrated in Fig. 1. Of these lines, 3 of the 13 were found to contain mutations within the p53-coding sequence, and as would be predicted these 3 lines indeed exhibited the highest levels of p53 protein by melanoma lines in Fig. 1B. Interestingly, 624, a line not recognized by the p53:264 TCR-transduced T cells, contained a missense mutation with an amino acid change from a cysteine to a tryptophan flanking the target epitope at codon 275. It is unclear whether the close proximity to amino acid 272 adversely affected the processing and presentation of the relevant epitope, similar to the arginine-to-histidine mutation at amino acid 273 that has been described to abrogate cognate T cell recognition of the p53264–272 epitope (Theobald et al., 1998). Tumor cell lines 526 and 1861 were found to have mutations in the DNA-binding domain, and along with a wild-type p53 tumor cell line, 2224, contained a polymorphism in p53 at amino acid 72 with an arginine-to-proline change (R72P) that has been reported to increase positive feedback and production of MDM2 (Yang et al., 2007). Mutation of p53 in the melanoma lines was not required for specific p53:264 TCR-transduced T cell recognition. Nine of 11 melanoma cell lines that were recognized contained only wild-type p53 sequences (i.e., 1833, 2436, 2081, 2098, 2224, 2207, 1994, 2218, and 2319).
Table 1.
p53 Gene Sequencing of Melanoma Lines
| |
|
Mutation or polymorphisma |
|
||
|---|---|---|---|---|---|
| Tumor cell line | p53 gene | Exon | Coding sequence | Amino acid change | Comment |
| 1890 | Wild-type | ||||
| 1833 | Wild-type | ||||
| 2436 | Wild-type | ||||
| 624 | Mutant | 8 | bp 825, T > G | C275W | DNA-binding region |
| 526 | Mutant | 5 | bp 389, T > C | L130P | DNA-binding region |
| 4 | bp 215, G > C | R72P | Polymorphism | ||
| 2081 | Wild-type | ||||
| 2098 | Wild-type | ||||
| 2224 | Wild-type | 4 | bp 215, G > C | R72P | Polymorphism, heterozygous |
| 1861 | Mutant | 5 | bp 389, T > C | L130P | DNA-binding region |
| 4 | bp 215, G > C | R72P | Polymorphism | ||
| 2207 | Wild-type | ||||
| 1994 | Wild-type | ||||
| 2218 | Wild-type | ||||
| 2319 | Wild-type | ||||
Mutations or polymorphisms indicated are homozygous unless otherwise noted.
To evaluate the correlation between p53 expression by immunocytofluorometric analysis and recognition by p53:264 TCR-transduced T cells, we employed linear regression analysis including only HLA-A2+ tumor cell lines that did not contain p53 deletions (e.g., SaOS2) or missense mutations flanking the epitope with unknown effect on p53264–272 epitope processing (624 cell line). In Fig. 2, the relationship between IFN-γ production by p53:264 TCR-transduced T cells and specific p53 expression as indicated by MFI is shown. There was no statistically significant relationship observed between the specific level of p53 protein expression in tumor cell lines and secretion of IFN-γ by anti-p53 TCR-transduced PBLs (p > 0.1). This was true even with exclusion from the analysis of MDA-231 and SaOS2/143, control tumors that express 1 log higher p53 levels assessed by MFI.
FIG. 2.
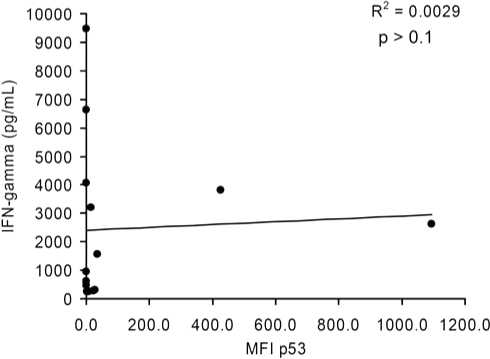
Linear regression analysis of p53 expression in melanoma cell lines and IFN-γ production by cognate T cells. Twelve of the 13 HLA-A2+ melanoma cell lines analyzed in Fig. 1 and Table 1 were included with the 2 HLA-A2+p53+ tumor control lines (SaOS2/143 and MDA-231) in a linear regression analysis investigating the relationship between the specific MFI of p53 and IFN-γ production by cognate effectors from patient 1. Tumor cell line 624 was excluded from this analysis because of the close proximity of the amino acid change to the p53264–272 epitope. This analysis is representative of results obtained with IFN-γ values by p53:264 TCR-transduced T cells from patient 2 (R2 = 0.0013, p > 0.1), and an analysis performed by excluding the outliers MDA-231 and SaOS2/143.
Correlation between p53 expression and recognition in tumor cell lines from multiple cancer origins with known p53 mutations
To determine whether there was a correlation between p53 expression levels and specific T cell recognition for tumors other than melanoma, we tested the ability of 17 tumor cell lines from multiple origins including breast, colon, lung, renal, ovarian, CNS, hematopoietic, and melanoma with described wild-type or mutated p53 to stimulate p53:264 TCR-transduced T cells to produce IFN-γ. For this analysis we used a panel of 59 tumor cell lines previously HLA typed and sequenced for p53 mutations used in the screening of anticancer agents by the Developmental Therapeutics Program of the NCI (O'Connor et al., 1997; Adams et al., 2005). Of the 59 cell lines previously reported, HLA-typing results indicated that 23 cell lines were either HLA-A2.1 (11 lines), HLA-A2 unknown subtype (9 lines), or HLA-A2 new subtype (1 line); or HLA-A typing was not at a resolution allowing identification (2 lines). In addition, four HLA-A2+ tumor cell lines (HepG2, H2087, A375, and IM-9) with previously described wild-type or mutated p53 were obtained (Mitsudomi et al., 1992; Hsu et al., 1993; Muller et al., 1997; Bamford et al., 2004). Tumor cell lines with unclear HLA-A2 subtypes were pulsed with the HLA-A2.1-restricted epitopes, MART-127–35 or p53264–272, and cultured with cognate effector T cells. COLO 205, HCT-15, OVCAR-5, SW-620, and NCI-H522 stimulated the cognate effectors to secrete IFN-γ and were included for further testing, but HCC-2998 and KM12 did not present the relevant epitopes and were excluded (data not shown). We further excluded cell lines with p53 missense mutations within amino acids 264–272 (COLO 205), missense mutations resulting in an arginine-to-histidine change at position 273 (HCT-15, SW-620, SNB-19, and U251), and nonsense mutations occurring before this epitope (NCI-H522 and OVCAR-5). This resulted in the identification of 13 additional lines capable of presenting the p53264–272 epitope.
PBLs were transduced with either an anti-p53:264 TCR or a melanoma-specific anti-gp100:154 TCR similarly derived from HLA-A2.1 transgenic mice, or were left untransduced and cocultured overnight with control HLA-A2− (888 and 938) or HLA-A2+p53:264− (SaOS2 and NCI-H522) tumor lines in addition to the 17 tumor cell lines being investigated. PBLs from four individual patients were used, and the IFN-γ production from two representative PBLs are shown in Table 2. The control gp100:154 TCR-transduced T cells specifically recognized three of the five melanomas; one unrecognized melanoma line, A375, lacks expression of the gp100 antigen (Zhai et al., 1996). p53:264 TCR-transduced T cells derived from patient 1 PBLs specifically recognized 16 of the 17 tumor cell lines compared with the two control non-A2 and the two p53264–272 epitope-disrupted cell lines. p53:264-transduced T cells from patient 2 specifically recognized 12 of 17 tumors and none of the 4 control lines. Eleven of the 17 tumors included in this panel were p53 wild type, and neither of the p53:264 TCR-transduced T cells exhibited a relationship between IFN-γ production and the p53 mutational status (either wild type or mutant) of the target. A linear regression analysis was performed to evaluate p53 expression assessed by MFI and T cell IFN-γ production, and in the panel of tumors representing nine different cancer origins there was no correlation demonstrated (p = 0.49; see Fig. 3A). The lack of correlation between p53 expression and IFN-γ production by p53:264 TCR-transduced T cells was confirmed in 12 additional experiments, including 2 that assessed p53 protein expression by Western blot (data not shown).
Table 2.
Wild-Type or Mutated p53 Tumors and T Cell Recognition
| |
|
|
|
Patient 1a |
Patient 2a |
||
|---|---|---|---|---|---|---|---|
| Targets | Tumor type | Comment | CMa | UTD | gp100:154 TCR | p53:264 TCR | (p53:264 TCR) |
| Controls | |||||||
| CM | 35 | 89 | 355 | 273 | 424 | ||
| 888 | Melanoma | HLA-A2− | 29 | 49 | 164 | 127 | 312 |
| 938 | Melanoma | HLA-A− | 29 | 58 | 211 | 149 | 213 |
| SaOS2 | Osteosarcoma | A2+/p53:264 deleted | 29 | 66 | 171 | 572 | 110 |
| NCIH522 | NSCLC | A2+/p53:264 deleted | 32 | 39 | 111 | 730 | 505 |
| HLA-A+ wild-type p53 tumor cell lines | |||||||
| SF539b | Glioma | 42 | 106 | 537 | 5500 | 2127 | |
| HepG2 | HCC | 31 | 58 | 330 | 3869 | 2486 | |
| SK MEL5 | Melanoma | 47 | 67 | 52194 | 1671 | 610 | |
| UAcc62 | Melanoma | 32 | 62 | 285 | 2685 | 544 | |
| UACC57 | Melanoma | 41 | 116 | 82128 | 17717 | 9033 | |
| a498 | RCC | 35 | 57 | 534 | 14927 | 5914 | |
| HCT116 | Colon carcinoma | 33 | 52 | 238 | 4350 | 3702 | |
| MCF7 | Breast carcinoma | 31 | 56 | 463 | 8136 | 7646 | |
| A375 | Melanoma | 32 | 116 | 542 | 3806 | 864 | |
| IM9 | Multiple myeloma | 32 | 577 | 15195 | 35638 | 8913 | |
| MALME-3M | Melanoma | 32 | 117 | 77458 | 20203 | 9106 | |
| HLA-A2+ mutated p53 tumor cell lines | |||||||
| p53 mutation | |||||||
|---|---|---|---|---|---|---|---|
| H2087 | NSCLC | 157 V/F | 25 | 99 | 443 | 43103 | 24301 |
| RXF393 | RCC | 175 R/H | 30 | 31 | 593 | 5069 | 2878 |
| OVCAR3 | Ovarian cancer | 248 R/Q | 28 | 56 | 198 | 3515 | 781 |
| BT549 | Breast carcinoma | 249 R/S | 25 | 72 | 241 | 932 | 479 |
| SNB75 | Glioma | 258 E/K | 30 | 118 | 408 | 15001 | 8421 |
| MDA-MB231 | Breast carcinoma | 280 R/K | 28 | 124 | 4046 | 23483 | 12497 |
Abbreviations: A2, HLA-A2; CM, complete media; HCC, hepatocellular carcinoma; NSCLC, non-small-cell lung cancer; p53:264 deleted, the p53 epitope encompassing amino acids 264 to 272 is not expressed in these cell lines; RCC, renal cell carcinoma; TCR, T cell receptor; UTD, untransduced.
Values represent IFN-γ (pg/ml) after overnight coculture. Specific recognition is indicated by boldface and designated as twice background (tumor cell and CM controls) and greater than 200 pg/ml.
FIG. 3.
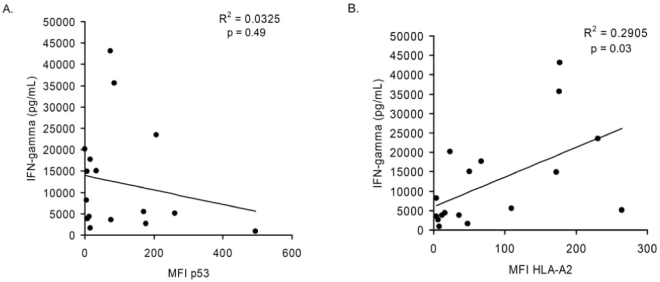
Linear regression analysis of p53 and HLA-A2 expression in various wild-type p53 and mutant p53 tumor cell lines and corresponding recognition by p53:264 TCR-transduced T cells. p53:264 TCR-transduced T cells (1 × 10⁵) were cocultured overnight with 1 × 10⁵ HLA-A2+ tumor cells from various cancer origins including breast, colon, lung, melanoma, glioma, renal cell, ovarian, hepatocellular, and hematopoietic tumors. In the same experiment, immunocytofluorometric analysis was performed to determine p53 and HLA-A2 expression levels as assessed by MFI (corrected for the background MFI obtained with the isotype control; see Materials and Methods). Data plotted for patient 1 (IFN-γ values are depicted in Table 2), and the correlation between (A) p53 expression or (B) HLA-A2 expression and IFN-γ production by p53:264 TCR-transduced cells is shown. Data are representative of four independent p53:264 TCR-transduced PBLs tested against these tumors. Data for this analysis included only tumor cell lines that were HLA-A2+ and did not contain mutations within the p53 gene that are known to affect processing and presentation of the p53264–272 epitope.
Interestingly, HLA-A2 expression was assessed by flow cytometry in this same experiment and in three of four patient PBL lines transduced with the p53:264 TCR, there was a trend toward a positive relationship between HLA-A2 expression and IFN-γ production (p values of 0.06, 0.12, and 0.07 for each of the three p53:264 TCR-transduced T cells) and in p53:264 TCR-transduced T cells from the other patient this correlation reached the level of significance, with a p value of 0.03 (Fig. 3B). Of 20 analyses performed to evaluate HLA-A2 expression by flow cytometry of tumor cells (without mutations known to be deleterious to presentation of p53264–272 epitope) and stimulation of p53:264 TCR-transduced T cells to produce IFN-γ, 9 tests demonstrated correlation with p < 0.1; three of these reached significance (p < 0.05; data not shown).
The possibility existed that the isolation of the p53:264 TCR from HLA-A2.1 transgenic mice and resultant CD8 independence may convey background HLA-A2 molecule recognition to transduced T cells regardless of the epitope presented. To investigate this further, we employed multiple HLA-A2+ tumor cell lines with mutations that resulted in defective or absent p53264–272 epitope presentation. Figure 4 summarizes 18 independent experiments incorporating data for each cell line from a range of 2 to 26 measurements of p53:264 TCR-transduced T cell production of IFN-γ in response to either tumor or normal cell populations. Control HLA-A2− tumor lines were not recognized by the p53-specific T cells. Importantly, HLA-A2+ tumor lines, including those with high HLA-A2 expression levels (data not shown), encoding a p53 mutation that resulted in a truncation before amino acid 264 (four tumor lines), or encoding a mutation within the p53264–272 epitope (one tumor line), or containing a mutation at codon 273 (five tumor lines) did not stimulate p53:264-transduced T cells to produce IFN-γ. Conversely, HLA-A2+ tumor lines with wild-type or mutant p53 were recognized in these experiments. Taken together, these data indicate that the presence of cognate epitope on the surface of the tumor cells is required to stimulate p53:264 TCR-transduced T cells.
FIG. 4.
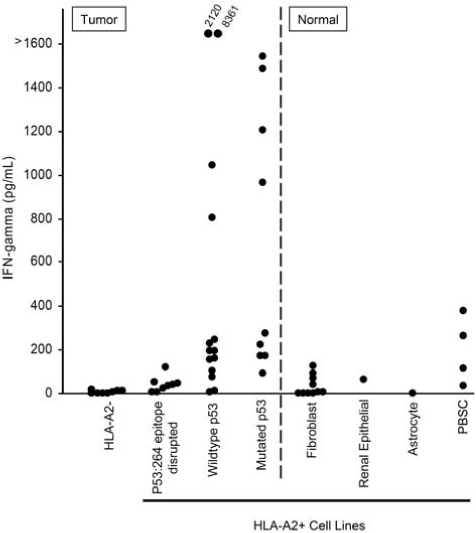
Specificity of p53:264 TCR-transduced T cells for tumor and normal cells. Tumor or normal cells (1 × 10⁵) were cultured overnight with 1 × 10⁵ p53:264 TCR-transduced T cells, and supernatants were collected and analyzed for IFN-γ by ELISA. Tumor and normal cell populations are separated by the divided line. Tumor cell lines included HLA-A2− (888, 938, A549, HCC-2998, HOP-92, IGR-OV1, KM12, and OVCAR-8), HLA-A2+, p53264–272 epitope-disrupted (BIC-1, HCT-15, NCI-H522, OVCAR 5, Saos-2, SW 620, TC71, SNB-19, and U251), and HLA-A2+ tumor lines with an intact p53264–272 epitope containing either mutant p53 (BT549, OVCAR 3, RXF-393, Saos2/143, SNB-75, 526, H2087, MDA 231, and 1861) or wild-type p53 (A375, A498, HCT-116, HepG2, MALME-3M, MCF-7, SF 539, SK-MEL-5, 1890, 1994, 2081, 2207, UACC 257, and UACC 62). Normal cell lines included fibroblasts, a renal epithelial line, and an astrocyte line. Peripheral blood stem cells (PBSCs) were obtained freshly from patients after CD34+ cell selection and tested immediately. These data are compiled from 21 experiments using the same p53:264 TCR-transduced effector T cell line, GLp53TCR, that had been previously expanded and cryopreserved, and the average IFN-γ value is reported for targets that were tested in multiple experiments (range, 2 to 18 individual experiments). Recognition of targets tested in one experiment (e.g., PBSCs) was validated with an additional p53:264 TCR-transduced T cell line.
Recognition of normal cell lines by anti-p53 TCR-transduced PBLs
p53 is tightly regulated at the level of protein degradation, and in normal tissues without cellular stresses the p53 protein is rapidly ubiquitinated and processed through the proteasome (Vogelstein et al., 2000). We and others have demonstrated that normal cells were not recognized by anti-p53 TCR-transduced PBLs; however, the number tested included relatively few lines (Theobald et al., 1995; Cohen et al., 2005; Kuball et al., 2005). This, in part, is due to the availability of relatively few nontransformed cell lines derived from normal tissues. To extend our experience with normal cell types, we evaluated the ability of anti-p53 TCR-transduced T cells to recognize a variety of normal cell lines including mobilized CD34+ peripheral blood stem cells (PBSCs), OKT3-activated PBLs (aPBLs), DCs generated from PBMCs, fibroblasts, astrocytes, and renal epithelial cell lines (Figs. 4 and 5). T cells transduced with the p53:264 TCR were used to investigate the ability to recognize autologous cell populations including DCs, PBSCs, and aPBLs. Nonspecific T cell stimulation was controlled for by including PBLs transduced with a gp100:154 melanoma-specific TCR that was similarly isolated in HLA-A2.1 transgenic mice and was cloned into the same retroviral backbone. In all three patients, DCs stimulated specific IFN-γ production by anti-p53 TCR T cells, indicated by a ratio of IFN-γ production by p53:264 to control TCR-transduced cells (stimulation index) greater than 1. Autologous PBSCs were substantially recognized by p53:264 TCR-transduced T cells in a single patient (patient 2; Fig. 5A) at a level of IFN-γ of 2410 pg/ml with a stimulation index of 8. In Fig. 5A, the stimulation index was 2.5 for PBSCs from a second patient (patient 3), but the level of autologous p53:264 TCR-transduced T cell production of IFN-γ was low (84.9 pg/ml). p53:264 TCR-transduced T cells did not specifically produce IFN-γ on coculture with autologous aPBLs or a control HLA-A2+p53− tumor, SaOS2. The stimulation index was 0.2 to 0.3 for 2218, a melanoma line that is recognized by both p53:264 TCR-transduced and melanoma-specific TCR-transduced T cells, although this value indicates stronger recognition by the melanoma-specific T cells in all three patient PBLs used in the TCR transductions. Coculture of HLA-A2−p53+ tumors H2087 and MDA-231 with p53:264 TCR-transduced T cells resulted in a higher stimulation index compared with their respective autologous cell targets in three of three (H2087) and two of three (MDA-231) cases. Interestingly, for the tumor cell lines there was trend toward a correlation between HLA-A2 expression as assessed by MFI and IFN-γ production by p53:264 TCR-transduced T cells, but for the normal cell populations there was no correlation (p > 0.1; data not shown).
FIG. 5.
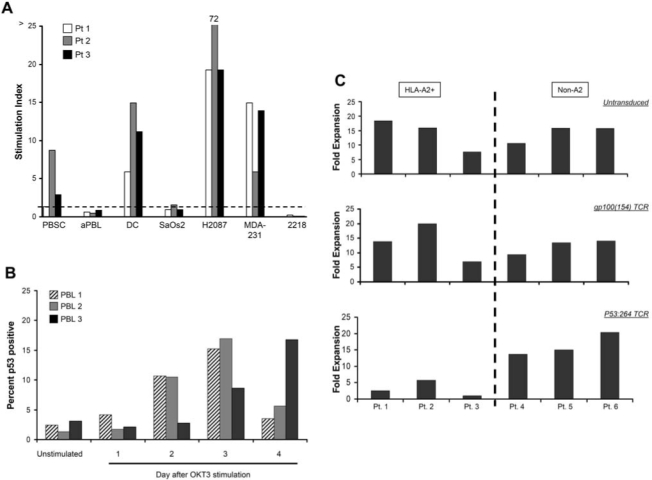
Autologous p53:264 TCR-transduced T cell recognition of normal cell populations. (A) PBLs from three patients were transduced with the p53:264 TCR or a control melanoma-specific gp100:154 TCR similarly derived from HLA-A2.1 transgenic mice and expanded for 8 days in vitro. Autologous targets from these three patients included peripheral blood stem cells (PBSCs) that had been previously cryopreserved, activated PBLs (aPBLs) previously stimulated with OKT3 and IL-2 for 4 days, or dendritic cells (DCs) generated from plastic-adherent purified PBMCs cultured for 4 days in GM-CSF and IL-4. Transduced T cells (1 × 10⁵) were cultured overnight with 1 × 10⁵ tumor and normal target cells, IFN-γ was assessed by ELISA. SaOS2 (HLA-A2+p53−), H2087 (HLA-A2+p53+), and MDA-231 (HLA-A2+p53+) cell lines, and HLA-A2+ melanoma line 2218, were used as tumor controls. The stimulation index represents the ratio of IFN-γ production by p53:264 TCR-transduced T cells to the control melanoma-specific T cells. A ratio less than 1 represents a cell line that stimulated T cells transduced with gp100:154 TCR to produce more IFN-γ compared with p53:264 TCR-transduced T cells. (B) PBLs from three donors were left unstimulated or stimulated with OKT3 and individual cultures were cryopreserved on the indicated days. Intracellular flow cytometry was performed in the same assay on all thawed samples to assess the percentage of p53-positive cells (anti-p53 mAb, DO7 clone) gated on CD3+ cells. (C) Donor PBLs from three HLA-A2+ (patients 1–3) and three HLA-A2− (Non-A2, patients 4–6) were stimulated and left untransduced (top) or transduced with a murine-derived control melanoma-specific, gp100:154 TCR (middle) or p53:264 TCR (bottom) as described in Materials and Methods. Seven days after initial stimulation, the fold expansion of individual cultures was determined and is shown for HLA-A2− donor PBLs (left) and HLA-A2− PBLs (right).
The lack of specific p53:264 TCR-transduced T cell recognition by OKT3-activated PBLs in Fig. 5A was unexpected in light of prior studies demonstrating p53 protein induction in concanavalin A- or phytohemagglutinin-activated T cells with increased protein accumulation 20 to 72 hr poststimulation (Milner, 1984; Mercer and Baserga, 1985; Mateo et al., 1995). To determine the time course of p53 protein accumulation in our transduction system, that is, PBL stimulation in OKT3 and IL-2, individual PBL cultures obtained from three patients were stimulated, harvested sequentially, and stored in liquid nitrogen 0 to 4 days post-stimulation. Intracellular p53 levels in T cells from the cultures isolated on day 0 through day 4 were measured by immunocytofluorometric analysis. Peak T cell p53 expression levels were identified on day 3 after stimulation in two patients and continued to increase by day 4 for one patient (Fig. 5B), corresponding to 24 to 48 hr after the first retroviral TCR transduction in the generation of p53:264 TCR-transduced T cells.
To further evaluate the recognition of p53 epitopes on activated T cells, untransduced and TCR-transduced (p53:264 or a control gp100:154) T cell cultures were assessed for total expansion in (1) activated HLA-A2− PBLs, thus unable to present the HLA-A2-restricted p53264–272 epitope, and (2) HLA-A2+ PBLs, capable of presenting the cognate peptide to transduced T cells (Fig. 5C). The untransduced, control gp100:154 TCR-transduced and p53:264 TCR-transduced HLA-A2− PBL cultures expanded similarly within each patient PBL group; however, HLA-A2+ PBLs transduced with the p53:264 TCR did not expand to the same degree as the untransduced or control TCR-transduced cultures. Importantly, similar transduction efficiencies were achieved with the gp100:154 and p53:264 TCR vectors; these ranged between 45.2–60.2% and 53.3–63.3% versus 51.6–59.5% and 65.4–69.2% for the HLA-A2+ and HLA-A2− PBL groups, respectively. The equivalent expansion of HLA-A2− PBLs with the control and p53:264 TCR vectors indicated that the p53:264 TCR retroviral vector is not acting as a nonspecific toxin to activated T cells. Diminished expansion limited to HLA-A2+ p53:264 TCR-transduced T cell cultures is suggestive of antigen-specific recognition by the activated T cells; however, similar to the results in Fig. 5A, specific lysis or IFN-γ release by p53:264 TCR-transduced T cells cultured with stimulated HLA-A2+ PBLs, tested from 0 to 6 days after activation, has not been detected (data not shown).
Sixteen additional normal cell populations, composed mainly of fibroblast lines but also including an astrocyte line, a renal epithelial line, and freshly isolated PBSCs, were cultured with a p53:264 TCR-transduced T cell line shown in Fig. 4 to evaluate the possibility of normal cell recognition by self-specific T cells. Although the level of IFN-γ production was low for all normal cell populations (<500 pg/ml), there was some degree of self-reactivity, specifically for freshly isolated PBSCs.
Discussion
Unlike the significant correlation that exists for gp100 and fibroblast growth factor-5 antigenic expression in melanoma and renal cell tumors, respectively, and stimulation of cognate effector T cells (Riker et al., 2000; Hanada et al., 2001), this study indicates that there is no relationship between tumor cell overexpression of p53 and recognition by T cells transduced with a TCR conferring reactivity to an immunodominant epitope within p53, p53264–272. This is in contrast to that previously suggested using a limited number of cell lines (Theobald et al., 1995, 1997; Gnjatic et al., 1998; Liu et al., 2000; Cohen et al., 2005; Kuball et al., 2005; Tokunaga et al., 2005).
In the present study, to evaluate the relationship between p53 expression and recognition by p53:264-specific T cells we used an extensive panel of human tumors with known p53 gene sequences or sequenced the p53 gene directly, and determined the level of p53 expression by Western blot and/or flow cytometry. In three prior studies evaluating the murine-derived p53:264-specific TCR and responses against human tumors, of the multiple HLA-A2− tumors from various origins that were tested, an analysis of the level of p53 expression and recognition by the cognate T cells was not described (Theobald et al., 1995; Cohen et al., 2005; Kuball et al., 2005). Tumors were noted only to be p53 positive or negative, and this was based on either published accounts (Theobald et al., 1995; Kuball et al., 2005) or immunocytofluorometric analysis (Cohen et al., 2005) of the tumors tested. In addition, the evidence that p53 expression was requisite for recognition was based on a combined total of five individual HLA-A2+p53− tumor cell lines that did not significantly stimulate p53-specific T cells measured by ELISpot, 51Cr lysis, and/or cytokine release. Tumor line SaOS2 (Theobald et al., 1995), tumor cell lines SaOS2 and K562 (Kuball et al., 2005), and tumor cell lines SaOS2, TC71, SKNAS/A2, and H2228 (Cohen et al., 2005) were used in the studies. Importantly, not all p53-negative cell lines were known to contain deletions of the p53264–272 epitope (e.g., SKNAS/A2, TC71, and H2228). In contrast to the results reported for these five HLA-A2+p53− cell lines, we observed five melanoma cell lines that could be considered p53 negative as assessed by flow cytometry (Fig. 1) that stimulated p53:264 TCR-transduced T cells to specifically produce IFN-γ, and two of these lines stimulated cognate T cells to produce the highest levels of this cytokine. Accordingly, analyses to investigate a relationship between p53 expression levels in tumors and anti-p53 T cell production of IFN-γ for melanoma (Fig. 2) or a diverse panel of human tumors (Fig. 3A) revealed no statistically significant correlation. This finding was consistent when using both a p53 TCR-transduced T cell line or bulk p53:264 TCR-transduced cultures. Indeed, there are isolated reports of anti-p53 T cell recognition of p53-negative tumors in a murine model of HPV-induced p53 degradation (Vierboom et al., 2000) and in humans (Röpke et al., 1996; Sirianni et al., 2004). Although extensive cytotoxicity studies were not performed, we previously published 51Cr lysis results from several tumor cell lines including SaOS2, MDA-231, H2087, and BE3 (Cohen et al., 2005) and on examination of intracellular p53 expression by immunocytofluorometric analysis there was no clear relationship to cell lysis (data not shown).
In the absence of a correlation between p53 overexpression and recognition by self-specific, anti-p53 T cells, the premise that the immune system can discriminate malignant from normal cells on the basis of increased antigen expression in the former is questionable. If accurate, the biology of p53 may not lend support to the concept that p53 is a suitable tumor antigen for immunotherapy. Tight regulation of p53 protein levels in normal tissues occurs because of MDM2-mediated ubiquitination and proteolysis leading to a half-life of several minutes; this compared with the half-life of 2 to 24 hr commonly seen in tumors with mutated p53. Interestingly, with the exception of spleen, mRNA levels have been reported to be lower in normal tissues compared with a variety of tumor targets (Rogel et al., 1985; Calabretta et al., 1986) but in a steady state p53 mRNA levels are believed to be equivalent in benign and malignant cell populations when normalized to the degree of cell proliferation (Calabretta et al., 1986; Matlashewski et al., 1986). Thus, benign tissues with a high growth fraction may serve as targets for anti-p53 T cells. Indeed, the studies herein do indicate that cultured normal cells are targets for p53:264 TCR-transduced cells in several cases, especially monocyte-derived dendritic cells (Fig. 5A). This is in contrast to results using similar dendritic cell populations and anti-p53 effectors containing the same specificity (Theobald et al., 1995). Autologous PBSCs were recognized by p53:264 TCR-transduced T cells in two of three patients tested. It is unclear whether this is an artifact of the liquid nitrogen freeze–thaw process, but similarly mobilized and CD34+ cell-enriched PBSCs from four other patients tested fresh were relatively ignored (Fig. 4). Other normal cell populations that did not stimulate p53-specific T cells included multiple fibroblast lines, an astrocyte line, and a renal epithelial line (Fig. 4). This may not be the case for OKT3-stimulated lymphocytes that upregulate p53 expression by 48 hr after stimulation (Fig. 5B). In multiple patients tested, p53:264 TCR-transduced PBLs from HLA-A2− patients did not expand to the same degree as TCR vector or untransduced controls, a stark difference between the equivalent expansion of p53:264 TCR-transduced PBLs with untransduced or gp100:154 TCR-transduced vector from HLA-A2− patients. Although p53:264-transduced T cells did not secrete specific IFN-γ in response to OKT3-activated lymphocytes (Fig. 5A), the diminished T cell expansion in p53:264-transduced PBLs was MHC restricted, suggesting that transduced T cell recognition of the p53264–272 epitope occurred in activated lymphocytes. One explanation may be that p53:264 TCR-transduced T cells commit T cell fratricide, but the mechanism has not yet been delineated.
The normal cell populations that were recognized in our studies were highly manipulated populations such as PBMC-derived DCs, G-CSF-mobilized and cryopreserved CD34+ PBSCs, and retrovirally transduced T cells; and in vivo these normal cell populations presenting a relevant peptide–MHC complex may be ignored by the immune system. Studies by Vierboom and coworkers are reassuring in that an effective antitumor CTL response can be orchestrated against p53 without consequent autoimmunity in mouse models that investigated the adoptive transfer of a high-affinity T cell line from p53 knockout mice into C57BL/6 mice bearing tumors that overexpress p53 (Vierboom et al., 1997). In these experiments, mice were cured of subcutaneous tumors without histologic evidence of damage to normal tissues including skin, lung, liver, and small intestine. Less conclusive evidence exists in humans. Vaccine studies that administered a p53-directed immunogen successfully generated anti-p53 CTLs without inducing autoimmunity (van der Burg et al., 2002; Svane et al., 2004, 2007).
These studies have important implications concerning the suitability of targeting the ubiquitous p53 self-antigen with immune-based therapies for the treatment of cancer. Our studies of human tumor cell lines in melanoma and many other cancer origins demonstrate there is no relationship between antibody-based measurement of tumor cell p53 levels and the ability to be recognized by cognate T cells. However, in addition to direct p53 mutations, multiple other mechanisms have been reported that result in functional p53 inhibition in tumors, for example, methylation or mutation of transcriptional regulatory genes such as HOXA5 have been reported in breast cancer resulting in low p53 expression (Raman et al., 2000). At a minimum, immunohistochemical demonstration of p53 overexpression would appropriately exclude such patients. However, tumors also disrupt p53 function through processes that enhance p53 proteasomal degradation and that presumptively lead to enhanced presentation of p53 epitope–MHC complexes on the surface of tumor cells, such as MDM2 amplification and overexpression or HPV infection with enhanced p53 degradation (Scheffner et al., 1993; Kubbutat et al., 1997).
To determine the quantity of an epitope presented on the surface of tumor cells, antibodies with TCR-like specificity for the p53264–272 peptide/HLA-A2 complex could be generated by technology such as phage display, but none currently exist for this antigen (Denkberg and Reiter, 2006). Alternatively, Zhu and coworkers used p53264–272-reactive single-chain TCRs complexed to horseradish peroxidase and reported the ability to measure p53264–272-specific epitope complexes on the surface of colorectal and breast tumors from paraffin-embedded, formalin-fixed tissue microarrays (Zhu et al., 2006). We used this technology for tumor specimens from HLA-A2 and non-HLA-A2 melanoma patients, but preliminary data did not indicate the level of discrimination necessary to use for the selection of candidate patients. In situ identification of peptide–MHC epitopes for melanoma differentiation antigens has been described (Denkberg et al., 2003) and we plan to pursue similar reagents to enhance patient screening as we advance clinical trials with adoptively transferred p53:264 TCR in cancer patients.
Patients being considered for T cell-based immunotherapy targeting wild-type p53 epitopes should undergo p53 gene sequencing of their tumors to exclude those patients with mutations within the epitope or mutations that negatively impact the processing and presentation of the relevant epitope such as nonsense mutations or, in our case, the arginine-to-histidine change at position 273 (Theobald et al., 1998). Because of the previously mentioned limitations of patient selection by p53 immunohistochemistry, new screening techniques are necessary to identify appropriate candidates, with desirable candidates presenting high amounts of the relevant peptide–MHC on the tumor surface. Although at first glance, p53 would appear to be an optimal tumor-associated antigen because of its critical role in regulating life and death of the cell, the disconnect between antigen expression in tumors and reactivity with p53-specific T cells, in addition to the recognition of normal cell populations illustrated in this study, casts doubt on whether its touted potential as a widely applicable target of tumor-specific immunotherapy will be realized.
Acknowledgments
Funding to support this work was provided by the Intramural Research Program, National Cancer Institute, National Institutes of Health. The authors thank Dr. Scott Garrett, Dr. Donald Sens, and Dr. Hung Khong for providing cell lines; Dr. Zhiya Yu for providing a melanoma-specific, gp100154–162-specific T cell receptor; and Dr. John Wunderlich, Dr. Bianca Heemskerk, Arnold Mixon, and Shawn Farid for help and expertise.
Author Disclosure Statement
No competing financial interests exist.
References
- Adams S. Robbins F.M. Chen D. Wagage D. Holbeck S.L. Morse H.C., III Stroncek D. Marincola F.M. HLA class I and II genotype of the NCI-60 cell lines. J. Transl. Med. 2005;3:11. doi: 10.1186/1479-5876-3-11. [DOI] [PMC free article] [PubMed] [Google Scholar]
- Albers A.E. Ferris R.L. Kim G.G. Chikamatsu K. DeLeo A.B. Whiteside T.L. Immune responses to p53 in patients with cancer: Enrichment in tetramer+ p53 peptide-specific T cells and regulatory T cells at tumor sites. Cancer Immunol. Immunother. 2005;54:1072–1081. doi: 10.1007/s00262-005-0670-9. [DOI] [PMC free article] [PubMed] [Google Scholar]
- Antonia S.J. Mirza N. Fricke I. Chiappori A. Thompson P. Williams N. Bepler G. Simon G. Janssen W. Lee J.H. Menander K. Chada S. Gabrilovich D.I. Combination of p53 cancer vaccine with chemotherapy in patients with extensive stage small cell lung cancer. Clin. Cancer Res. 2006;12:878–887. doi: 10.1158/1078-0432.CCR-05-2013. [DOI] [PubMed] [Google Scholar]
- Bamford S. Dawson E. Forbes S. Clements J. Pettett R. Dogan A. Flanagan A. Teague J. Futreal P.A. Stratton M.R. Wooster R. The COSMIC (Catalogue of Somatic Mutations in Cancer) database and website. Br. J. Cancer. 2004;91:355–358. doi: 10.1038/sj.bjc.6601894. [DOI] [PMC free article] [PubMed] [Google Scholar]
- Black A.P. Bailey A. Jones L. Turner R.J. Hollowood K. Ogg G.S. p53-specific CD8+ T-cell responses in individuals with cutaneous squamous cell carcinoma. Br. J. Dermatol. 2005;153:987–991. doi: 10.1111/j.1365-2133.2005.06878.x. [DOI] [PubMed] [Google Scholar]
- Calabretta B. Kaczmarek L. Selleri L. Torelli G. Ming P.M. Ming S.C. Mercer W.E. Growth-dependent expression of human Mr 53, 000 tumor antigen messenger RNA in normal and neoplastic cells. Cancer Res. 1986;46:5738–5742. [PubMed] [Google Scholar]
- Carbone D.P. Ciernik I.F. Kelley M.J. Smith M.C. Nadaf S. Kavanaugh D. Maher V.E. Stipanov M. Contois D. Johnson B.E. Pendleton C.D. Seifert B. Carter C. Read E.J. Greenblatt J. Top L.E. Kelsey M.I. Minna J.D. Berzofsky J.A. Immunization with mutant p53- and K-ras-derived peptides in cancer patients: Immune response and clinical outcome. J. Clin. Oncol. 2005;23:5099–5107. doi: 10.1200/JCO.2005.03.158. [DOI] [PubMed] [Google Scholar]
- Cohen C.J. Zheng Z. Bray R. Zhao Y. Sherman L.A. Rosenberg S.A. Morgan R.A. Recognition of fresh human tumor by human peripheral blood lymphocytes transduced with a bicistronic retroviral vector encoding a murine anti-p53 TCR. J. Immunol. 2005;175:5799–5808. doi: 10.4049/jimmunol.175.9.5799. [DOI] [PMC free article] [PubMed] [Google Scholar]
- Crawford L.V. Pim D.C. Bulbrook R.D. Detection of antibodies against the cellular protein p53 in sera from patients with breast cancer. Int. J. Cancer. 1982;30:403–408. doi: 10.1002/ijc.2910300404. [DOI] [PubMed] [Google Scholar]
- Defromentel C.C. Maylevin F. Mouriesse H. Lemerle J. Chandrasekaran K. May P. Presence of circulating antibodies against cellular protein p53 in a notable proportion of children with B-cell lymphoma. Int. J. Cancer. 1987;39:185–189. doi: 10.1002/ijc.2910390211. [DOI] [PubMed] [Google Scholar]
- Denkberg G. Reiter Y. Recombinant antibodies with T-cell receptor-like specificity: Novel tools to study MHC class I presentation. Autoimmun. Rev. 2006;5:252–257. doi: 10.1016/j.autrev.2005.07.004. [DOI] [PubMed] [Google Scholar]
- Denkberg G. Lev A. Eisenbach L. Benhar I. Reiter Y. Selective targeting of melanoma and APCs using a recombinant antibody with TCR-like specificity directed toward a melanoma differentiation antigen. J. Immunol. 2003;171:2197–2207. doi: 10.4049/jimmunol.171.5.2197. [DOI] [PubMed] [Google Scholar]
- Dittmer D. Pati S. Zambetti G. Chu S. Teresky A.K. Moore M. Finlay C. Levine A.J. Gain of function mutations in p53. Nat. Genet. 1993;4:42–46. doi: 10.1038/ng0593-42. [DOI] [PubMed] [Google Scholar]
- Dudley M.E. Wunderlich J.R. Yang J.C. Sherry R.M. Topalian S.L. Restifo N.P. Royal R.E. Kammula U. White D.E. Mavroukakis S.A. Rogers L.J. Gracia G.J. Jones S.A. Mangiameli D.P. Pelletier M.M. Gea-Banacloche J. Robinson M.R. Berman D.M. Filie A.C. Abati A. Rosenberg S.A. Adoptive cell transfer therapy following non-myeloablative but lymphodepleting chemotherapy for the treatment of patients with refractory metastatic melanoma. J. Clin. Oncol. 2005;23:2346–2357. doi: 10.1200/JCO.2005.00.240. [DOI] [PMC free article] [PubMed] [Google Scholar]
- Gnjatic S. Cai Z. Viguier M. Chouaib S. Guillet J.G. Choppin J. Accumulation of the p53 protein allows recognition by human CTL of a wild-type p53 epitope presented by breast carcinomas and melanomas. J. Immunol. 1998;160:328–333. [PubMed] [Google Scholar]
- Hanada K. Perry-Lalley D.M. Ohnmacht G.A. Bettinotti M.P. Yang J.C. Identification of fibroblast growth factor-5 as an overexpressed antigen in multiple human adenocarcinomas. Cancer Res. 2001;61:5511–5516. [PubMed] [Google Scholar]
- Hoffmann T.K. Nakano K. Elder E.M. Dworacki G. Finkelstein S.D. Appella E. Whiteside T.L. DeLeo A.B. Generation of T cells specific for the wild-type sequence p53264–272 peptide in cancer patients: Implications for immunoselection of epitope loss variants. J. Immunol. 2000;165:5938–5944. doi: 10.4049/jimmunol.165.10.5938. [DOI] [PubMed] [Google Scholar]
- Hoffmann T.K. Donnenberg A.D. Finkelstein S.D. Donnenberg V.S. Friebe-Hoffmann U. Myers E.N. Appella E. DeLeo A.B. Whiteside T.L. Frequencies of tetramer+ T cells specific for the wild-type sequence p53264–272 peptide in the circulation of patients with head and neck cancer. Cancer Res. 2002;62:3521–3529. [PubMed] [Google Scholar]
- Hsu I.C. Tokiwa T. Bennett W. Metcalf R.A. Welsh J.A. Sun T. Harris C.C. p53 gene mutation and integrated hepatitis B viral DNA sequences in human liver cancer cell lines. Carcinogenesis. 1993;14:987–992. doi: 10.1093/carcin/14.5.987. [DOI] [PubMed] [Google Scholar]
- Kressner U. Inganas M. Byding S. Blikstad I. Pahlman L. Glimelius B. Lindmark G. Prognostic value of p53 genetic changes in colorectal cancer. J. Clin. Oncol. 1999;17:593–599. doi: 10.1200/JCO.1999.17.2.593. [DOI] [PubMed] [Google Scholar]
- Kuball J. Schmitz F.W. Voss R.H. Ferreira E.A. Engel R. Guillaume P. Strand S. Romero P. Huber C. Sherman L.A. Theobald M. Cooperation of human tumor-reactive CD4+ and CD8+ T cells after redirection of their specificity by a high-affinity p53A2.1-specific TCR. Immunity. 2005;22:117–129. doi: 10.1016/j.immuni.2004.12.005. [DOI] [PubMed] [Google Scholar]
- Kubbutat M.H. Jones S.N. Vousden K.H. Regulation of p53 stability by Mdm2. Nature. 1997;387:299–303. doi: 10.1038/387299a0. [DOI] [PubMed] [Google Scholar]
- Lang G.A. Iwakuma T. Suh Y.A. Liu G. Rao V.A. Parant J.M. Valentin-Vega Y.A. Terzian T. Caldwell L.C. Strong L.C. El Naggar A.K. Lozano G. Gain of function of a p53 hot spot mutation in a mouse model of Li-Fraumeni syndrome. Cell. 2004;119:861–872. doi: 10.1016/j.cell.2004.11.006. [DOI] [PubMed] [Google Scholar]
- Liu X. Peralta E.A. Ellenhorn J.D. Diamond D.J. Targeting of human p53-overexpressing tumor cells by an HLA A*0201-restricted murine T-cell receptor expressed in Jurkat T cells. Cancer Res. 2000;60:693–701. [PubMed] [Google Scholar]
- Mateo M.S. Sanchez-Beato M. Martinez J.C. Orfao A. Orradre J.L. Piris M.A. p53, Rb and bcl-2 expression during the cell cycle: A study in phytohaemagglutinin stimulated lymphocytes and microwave irradiated lymphoid tissue sections. J. Clin. Pathol. 1995;48:151–159. doi: 10.1136/jcp.48.2.151. [DOI] [PMC free article] [PubMed] [Google Scholar]
- Matlashewski G. Banks L. Pim D. Crawford L. Analysis of human p53 proteins and mRNA levels in normal and transformed cells. Eur. J. Biochem. 1986;154:665–672. doi: 10.1111/j.1432-1033.1986.tb09449.x. [DOI] [PubMed] [Google Scholar]
- Mercer W.E. Baserga R. Expression of the p53 protein during the cell cycle of human peripheral blood lymphocytes. Exp. Cell Res. 1985;160:31–46. doi: 10.1016/0014-4827(85)90233-2. [DOI] [PubMed] [Google Scholar]
- Milner J. Different forms of p53 detected by monoclonal antibodies in non-dividing and dividing lymphocytes. Nature. 1984;310:143–145. doi: 10.1038/310143a0. [DOI] [PubMed] [Google Scholar]
- Mitsudomi T. Steinberg S.M. Nau M.M. Carbone D. D'Amico D. Bodner S. Oie H.K. Linnoila R.I. Mulshine J.L. Minna J.D., et al. p53 gene mutations in non-small-cell lung cancer cell lines and their correlation with the presence of ras mutations and clinical features. Oncogene. 1992;7:171–180. [PubMed] [Google Scholar]
- Morgan R.A. Dudley M.E. Wunderlich J.R. Hughes M.S. Yang J.C. Sherry R.M. Royal R.E. Topalian S.L. Kammula U.S. Restifo N.P. Zheng Z.L. Nahvi A. de Vries C.R. Rogers-Freezer L.J. Mavroukakis S.A. Rosenberg S.A. Cancer regression in patients after transfer of genetically engineered lymphocytes. Science. 2006;314:126–129. doi: 10.1126/science.1129003. [DOI] [PMC free article] [PubMed] [Google Scholar]
- Muller M. Strand S. Hug H. Heinemann E.M. Walczak H. Hofmann W.J. Stremmel W. Krammer P.H. Galle P.R. Drug-induced apoptosis in hepatoma cells is mediated by the CD95 (APO-1/Fas) receptor/ligand system and involves activation of wild-type p53. J. Clin. Invest. 1997;99:403–413. doi: 10.1172/JCI119174. [DOI] [PMC free article] [PubMed] [Google Scholar]
- O'Connor P.M. Jackman J. Bae I. Myers T.G. Fan S. Mutoh M. Scudiero D.A. Monks A. Sausville E.A. Weinstein J.N. Friend S. Fornace A.J., Jr. Kohn K.W. Characterization of the p53 tumor suppressor pathway in cell lines of the National Cancer Institute anticancer drug screen and correlations with the growth-inhibitory potency of 123 anticancer agents. Cancer Res. 1997;57:4285–4300. [PubMed] [Google Scholar]
- Olive K.P. Tuveson D.A. Ruhe Z.C. Yin B. Willis N.A. Bronson R.T. Crowley D. Jacks T. Mutant p53 gain of function in two mouse models of Li-Fraumeni syndrome. Cell. 2004;119:847–860. doi: 10.1016/j.cell.2004.11.004. [DOI] [PubMed] [Google Scholar]
- Raman V. Martensen S.A. Reisman D. Evron E. Odenwald W.F. Jaffee E. Marks J. Sukumar S. Compromised HOXA5 function can limit p53 expression in human breast tumours. Nature. 2000;405:974–978. doi: 10.1038/35016125. [DOI] [PubMed] [Google Scholar]
- Reich N.C. Oren M. Levine A.J. Two distinct mechanisms regulate the levels of a cellular tumor antigen, p53. Mol. Cell. Biol. 1983;3:2143–2150. doi: 10.1128/mcb.3.12.2143. [DOI] [PMC free article] [PubMed] [Google Scholar]
- Riker A.I. Kammula U.S. Panelli M.C. Wang E. Ohnmacht G.A. Steinberg S.M. Rosenberg S.A. Marincola F.M. Threshold levels of gene expression of the melanoma antigen gp100 correlate with tumor cell recognition by cytotoxic T lymphocytes. Int. J. Cancer. 2000;86:818–826. doi: 10.1002/(sici)1097-0215(20000615)86:6<818::aid-ijc10>3.0.co;2-w. [DOI] [PubMed] [Google Scholar]
- Rogel A. Popliker M. Webb C.G. Oren M. p53 cellular tumor antigen: Analysis of mRNA levels in normal adult tissues, embryos, and tumors. Mol. Cell. Biol. 1985;5:2851–2855. doi: 10.1128/mcb.5.10.2851. [DOI] [PMC free article] [PubMed] [Google Scholar]
- Röpke M. Hald J. Guldberg P. Zeuthen J. Norgaard L. Fugger L. Svejgaard A. van der Burg S. Nijman H.W. Melief C.J. Claesson M.H. Spontaneous human squamous cell carcinomas are killed by a human cytotoxic T lymphocyte clone recognizing a wild-type p53-derived peptide. Proc. Natl. Acad. Sci. U.S.A. 1996;93:14704–14707. doi: 10.1073/pnas.93.25.14704. [DOI] [PMC free article] [PubMed] [Google Scholar]
- Sallusto F. Lanzavecchia A. Efficient presentation of soluble antigen by cultured human dendritic cells is maintained by granulocyte/macrophage colony-stimulating factor plus interleukin 4 and downregulated by tumor necrosis factor α. J. Exp. Med. 1994;179:1109–1118. doi: 10.1084/jem.179.4.1109. [DOI] [PMC free article] [PubMed] [Google Scholar]
- Scheffner M. Huibregtse J.M. Vierstra R.D. Howley P.M. The HPV-16 E6 and E6–AP complex functions as a ubiquitin-protein ligase in the ubiquitination of p53. Cell. 1993;75:495–505. doi: 10.1016/0092-8674(93)90384-3. [DOI] [PubMed] [Google Scholar]
- Sirianni N. Ha P.K. Oelke M. Califano J. Gooding W. Westra W. Whiteside T.L. Koch W.M. Schneck J.P. DeLeo A. Ferris R.L. Effect of human papillomavirus-16 infection on CD8+ T-cell recognition of a wild-type sequence p53264–272 peptide in patients with squamous cell carcinoma of the head and neck. Clin. Cancer Res. 2004;10:6929–6937. doi: 10.1158/1078-0432.CCR-04-0672. [DOI] [PubMed] [Google Scholar]
- Soong R. Robbins P.D. Dix B.R. Grieu F. Lim B. Knowles S. Williams K.E. Turbett G.R. House A.K. Iacopetta B.J. Concordance between p53 protein overexpression and gene mutation in a large series of common human carcinomas. Hum. Pathol. 1996;27:1050–1055. doi: 10.1016/s0046-8177(96)90282-8. [DOI] [PubMed] [Google Scholar]
- Svane I.M. Pedersen A.E. Johnsen H.E. Nielsen D. Kamby C. Gaarsdal E. Nikolajsen K. Buus S. Claesson M.H. Vaccination with p53-peptide-pulsed dendritic cells, of patients with advanced breast cancer: Report from a phase I study. Cancer Immunol. Immunother. 2004;53:633–641. doi: 10.1007/s00262-003-0493-5. [DOI] [PMC free article] [PubMed] [Google Scholar]
- Svane I.M. Pedersen A.E. Johansen J.S. Johnsen H.E. Nielsen D. Kamby C. Ottesen S. Balslev E. Gaarsdal E. Nikolajsen K. Claesson M.H. Vaccination with p53 peptide-pulsed dendritic cells is associated with disease stabilization in patients with p53 expressing advanced breast cancer: Monitoring of serum YKL-40 and IL-6 as response biomarkers. Cancer Immunol. Immunother. 2007;56:1485–1499. doi: 10.1007/s00262-007-0293-4. [DOI] [PMC free article] [PubMed] [Google Scholar]
- Theobald M. Biggs J. Dittmer D. Levine A.J. Sherman L.A. Targeting p53 as a general tumor antigen. Proc. Natl. Acad. Sci. U.S.A. 1995;92:11993–11997. doi: 10.1073/pnas.92.26.11993. [DOI] [PMC free article] [PubMed] [Google Scholar]
- Theobald M. Biggs J. Hernandez J. Lustgarten J. Labadie C. Sherman L.A. Tolerance to p53 by A2.1-restricted cytotoxic T lymphocytes. J. Exp. Med. 1997;185:833–841. doi: 10.1084/jem.185.5.833. [DOI] [PMC free article] [PubMed] [Google Scholar]
- Theobald M. Ruppert T. Kuckelkorn U. Hernandez J. Haussler A. Ferreira E.A. Liewer U. Biggs J. Levine A.J. Huber C. Koszinowski U.H. Kloetzel P.M. Sherman L.A. The sequence alteration associated with a mutational hotspot in p53 protects cells from lysis by cytotoxic T lymphocytes specific for a flanking peptide epitope. J. Exp. Med. 1998;188:1017–1028. doi: 10.1084/jem.188.6.1017. [DOI] [PMC free article] [PubMed] [Google Scholar]
- Tilkin A.F. Lubin R. Soussi T. Lazar V. Janin N. Mathieu M.C. Lefrere I. Carlu C. Roy M. Kayibanda M. Bellet D. Guillet J.G. Bressacdepaillerets B. Primary proliferative T-cell response to wild-type p53 protein in patients with breast cancer. Eur. J. Immunol. 1995;25:1765–1769. doi: 10.1002/eji.1830250642. [DOI] [PubMed] [Google Scholar]
- Tokunaga N. Murakami T. Endo Y. Nishizaki M. Kagawa S. Tanaka N. Fujiwara T. Human monocyte-derived dendritic cells pulsed with wild-type p53 protein efficiently induce CTLs against p53 overexpressing human cancer cells. Clin. Cancer Res. 2005;11:1312–1318. [PubMed] [Google Scholar]
- Topalian S.L. Solomon D. Rosenberg S.A. Tumor-specific cytolysis by lymphocytes infiltrating human melanomas. J. Immunol. 1989;142:3714–3725. [PubMed] [Google Scholar]
- van der Burg S.H. Menon A.G. Redeker A. Bonnet M.C. Drijfhout J.W. Tollenaar R.A. van de Velde C.J. Moingeon P. Kuppen P.J. Offringa R. Melief C.J. Induction of p53-specific immune responses in colorectal cancer patients receiving a recombinant ALVAC-p53 candidate vaccine. Clin. Cancer Res. 2002;8:1019–1027. [PubMed] [Google Scholar]
- Vierboom M.P. Nijman H.W. Offringa R. van der Voort E.I. van Hall T. van den Broeck L. Fleuren G.J. Kenemans P. Kast W.M. Melief C.J. Tumor eradication by wild-type p53-specific cytotoxic T lymphocytes. J. Exp. Med. 1997;186:695–704. doi: 10.1084/jem.186.5.695. [DOI] [PMC free article] [PubMed] [Google Scholar]
- Vierboom M.P. Zwaveling S. Bos G.M.J. Ooms M. Krietemeijer G.M. Melief C.J. Offringa R. High steady-state levels of p53 are not a prerequisite for tumor eradication by wild-type p53-specific cytotoxic T lymphocytes. Cancer Res. 2000;60:5508–5513. [PubMed] [Google Scholar]
- Vogelstein B. Lane D. Levine A.J. Surfing the p53 network. Nature. 2000;408:307–310. doi: 10.1038/35042675. [DOI] [PubMed] [Google Scholar]
- von Brevern M.C. Hollstein M.C. Cawley H.M. De Benedetti V.M.G. Bennett W.P. Liang L. He A.G. Zhu S.M. Tursz T. Janin N. Trivers G.E. Circulating anti-p53 antibodies in esophageal cancer patients are found predominantly in individuals with p53 core domain mutations in their tumors. Cancer Res. 1996;56:4917–4921. [PubMed] [Google Scholar]
- Winter S.F. Minna J.D. Johnson B.E. Takahashi T. Gazdar A.F. Carbone D.P. Development of antibodies against p53 in lung cancer patients appears to be dependent on the type of p53 mutation. Cancer Res. 1992;52:4168–4174. [PubMed] [Google Scholar]
- Yang M. Guo Y. Zhang X. Miao X. Tan W. Sun T. Zhao D. Yu D. Liu J. Lin D. Interaction of P53 Arg72Pro and MDM2 T309G polymorphisms and their associations with risk of gastric cardia cancer. Carcinogenesis. 2007;28:1996–2001. doi: 10.1093/carcin/bgm168. [DOI] [PubMed] [Google Scholar]
- Zhai Y. Yang J.C. Kawakami Y. Spiess P. Wadsworth S.C. Cardoza L.M. Couture L.A. Smith A.E. Rosenberg S.A. Antigen-specific tumor vaccines: Development and characterization of recombinant adenoviruses encoding MART1 or gp100 for cancer therapy. J. Immunol. 1996;156:700–710. [PubMed] [Google Scholar]
- Zhu X. Belmont H.J. Price-Schiavi S. Liu B. Lee H.I. Fernandez M. Wong R.L. Builes J. Rhode P.R. Wong H.C. Visualization of p53264–272/HLA-A*0201 complexes naturally presented on tumor cell surface by a multimeric soluble single-chain T cell receptor. J. Immunol. 2006;176:3223–3232. doi: 10.4049/jimmunol.176.5.3223. [DOI] [PubMed] [Google Scholar]