

Abstract
Palm oil is the world's most important vegetable oil in terms of production quantity. Indonesia, the world's largest palm-oil producer, plans to double its production by 2020, with unclear implications for the other national priorities of food (rice) production, forest and biodiversity protection, and carbon conservation. We modeled the outcomes of alternative development scenarios and show that every single-priority scenario had substantial tradeoffs associated with other priorities. The exception was a hybrid approach wherein expansion targeted degraded and agricultural lands that are most productive for oil palm, least suitable for food cultivation, and contain the lowest carbon stocks. This approach avoided any loss in forest or biodiversity and substantially ameliorated the impacts of oil-palm expansion on carbon stocks (limiting net loss to 191.6 million tons) and annual food production capacity (loss of 1.9 million tons). Our results suggest that the environmental and land-use tradeoffs associated with oil-palm expansion can be largely avoided through the implementation of a properly planned and spatially explicit development strategy.
Keywords: oil palm, biofuels, conservation biology, sustainability, tropical deforestation
Palm oil is the world's most important vegetable oil in terms of production quantity (1). In 2009 global palm-oil production amounted to 43.4 million tons, of which 47% was produced in Indonesia (1). The meteoric expansion of oil-palm agriculture in Southeast Asia and other tropical regions is testament to an almost insatiable global demand for palm oil and the consequent financial lure to ramp up production. Despite environmental and social concerns (2), it is difficult to deny that oil palm has contributed greatly to regional, national, and local economies, as reflected by the promotion and uptake of oil palm by actors at these scales, including policymakers, plantation corporations, and smallholder farmers (3). This trend likely will continue: Indonesia has indicated the potential for a near doubling of oil-palm hectarage from the current 9.7 million ha to 18 million ha “without disturbing forest preservation efforts” (Indonesian Agriculture Minister Suswono at the fifth Indonesian Palm Oil Conference, Bali, Indonesia, December 2009) (4). Oil palm may well improve the economies of rural communities, but can it really do so without incurring substantial environmental costs in terms of loss of forest cover and associated biodiversity (5)? Additionally, can oil-palm expansion proceed without compromising the other priorities of meeting domestic and global demands for food (Indonesia is the world's third largest producer of rice, at 60 million tons per year) (6) or curtailing carbon emissions from land-use change and forestry (Indonesia is the world's second largest emitter, at 1.46 billion tons per year) (7)?
To answer these questions, we developed a multiple-scenario computer model that simulates the spatial pattern of oil-palm expansion in Indonesia as oil-palm demand and production continue to grow. These scenarios include (i) a business-as-usual scenario whereby oil-palm expansion proceeded from the most productive to least productive areas for oil palm; (ii) a food production scenario whereby oil-palm expansion proceeded from the least productive to most productive areas for rice; (iii) a forest preservation scenario whereby expansion proceeded in sequence from degraded lands, through agricultural lands and secondary forests, to primary forests; (iv) a carbon conservation scenario whereby expansion proceeded in areas from lowest to highest carbon stock; and (v) a hybrid approach whereby expansion proceeded by simultaneously accounting for the priorities of maximizing oil-palm production, while minimizing impacts on food production capacity, forest cover, and carbon stocks.
For each oil-palm expansion scenario, we evaluated the consequences for the following outcome variables: (i) area of primary and secondary forests, (ii) forest biodiversity (modeled using a matrix-calibrated species-area model) (8), (iii) biomass and peat soil carbon stocks, and (iv) annual rice production capacity.
Results
Indonesia plans to increase its annual production of oil-palm fruit from the current 80 million tons to 160 million tons over the next 10 years (9). From a conservation perspective, our analyses suggest that Indonesian oil-palm production can indeed double without necessarily impacting forest cover or biodiversity. Under the forest preservation scenario, forests were not converted (and biodiversity not impacted) until all suitable degraded and agricultural lands had been used for oil palm—when annual oil-palm production exceeded ≈450 million tons (Fig. 1). However, strict enforcement of forest protection as implied by the forest preservation scenario incurred substantial tradeoffs in terms of carbon stocks (net carbon loss of 479 million tons) and rice production (reduction of 10 million tons in annual production capacity, or 66% of Indonesia's future potential for rice production) (Fig. 1 and Table 1). This is due primarily to the significantly larger land area (5.4 million ha) needed to be turned over to oil palm under this scenario compared with the business-as-usual approach (3.1 million ha) (Table 1).
Fig. 1.

Simulated impacts of Indonesia's projected oil-palm expansion on land use and land cover, biodiversity, biomass, and peat soil carbon stocks (gross losses), and food production capacity under five development scenarios.
Table 1.
Implications of doubling Indonesia's annual oil-palm production (increase by 80 million tons) for land use, biodiversity, carbon, and food production under each development scenario
| Land uses converted (103 ha) | ||||||||
| Scenario | Oil-palm expansion (103 ha) | Primary forest | Secondary forest | Agricultural land | Degraded land | Biodiversity loss (%) | Net carbon loss (106 tons) | Loss in annual food production capacity (106 tons) |
| Business-as-usual | 3,097.09 ± 18.54 | 735.94 ± 92.5 | 684.38 ± 54.37 | 1,223.46 ± 66.47 | 453.31 ± 29.41 | 0.43 ± 0.04 | 278.16 ± 16.5 | 5.13 ± 0.26 |
| Food production | 3,181.89 ± 14.86 | 1,310.82 ± 48.08 | 767.29 ± 40.34 | 786.95 ± 22.61 | 316.83 ± 19.8 | 0.7 ± 0.02 | 366.22 ± 11.39 | 0 ± 0 |
| Forest preservation | 5,435.34 ± 70.59 | 0 ± 0 | 0 ± 0 | 0 ± 0 | 5,435.34 ± 70.59 | 0 ± 0 | 478.95 ± 40.44 | 9.97 ± 0.12 |
| Carbon conservation | 5,451.86 ± 0 | 178.71 ± 0 | 634.52 ± 0 | 2,527.33 ± 0 | 2111.3 ± 0 | 0.18 ± 0 | −158.76 ± 0 | 9.78 ± 0 |
| Hybrid approach | 3,430.86 ± 3.65 | 0 ± 0 | 0 ± 0 | 1,601.74 ± 0 | 1,829.12 ± 3.65 | 0 ± 0 | 191.64 ± 5.38 | 1.88 ± 0 |
Net carbon loss was calculated as the difference between carbon loss (total biomass and peat soil carbon stocks) and carbon gain (above-ground carbon biomass in oil palm plantations). Values are mean ± SD of each outcome variable for 10,000 simulation runs.
The business-as-usual scenario reflects the land-sparing approach that has been advocated by many as a way to minimize land requirements by intensifying production (10, 11). The positive effect of land sparing is illustrated by the curvilinear relationship between oil-palm production and hectarage in the business-as-usual scenario (Fig. 1), which suggests that for any given oil-palm production quantity, this approach would require the least amount of land compared with other scenarios. Consequently, business-as-usual performed better than the forest preservation approach in terms of both conserving carbon stocks (limiting net loss to 278.2 million tons) and maintaining annual food production capacity (loss of 5.1 million tons) (Table 1). Nevertheless, business-as-usual still resulted in biodiversity losses of 0.43% (equivalent, for birds alone, to the local extirpation of seven species or global extinction of two species).
Reducing emissions from deforestation and forest degradation (REDD) is a carbon conservation and payment scheme designed to compensate landowners for the value of carbon stored in forests that would otherwise be released into the atmosphere (12). A REDD or REDD+ approach, which additionally recognizes efforts at reforestation and sustainable forestry, is best represented by our carbon conservation scenario. This scenario performed the best in ameliorating the impacts of oil-palm expansion on carbon stocks. In fact, net carbon stocks increased by 158.8 million tons (Table 1). However, this scenario too impacted annual rice production substantially (loss of 9.8 million tons) in the context of a doubling of oil-palm production.
The scenarios of business-as-usual, forest preservation, and carbon conservation imposed constraints on future food production capacities and may also be undermined by system leakages as increasing demand for food forces agricultural expansion into forested land (13). In fact, such indirect land-use changes resulting from biofuel expansion in Brazil are shown to pose significant threats to the Amazon forest (14). Expanding Indonesian and global populations (projected to be 262 million and 7.7 billion people by 2020, respectively) (15) will enhance premiums for land suitable for food production and likely render a strict forest preservation or carbon conservation strategy as untenable. The impacts of development on food production could be reduced by avoiding the most productive areas for rice (food production scenario): food production did not begin to be affected by oil-palm expansion until annual oil-palm production exceeded ≈400 million tons (Fig. 1). However, the prioritization of food production has the most serious implications for biodiversity among all scenarios considered: a doubling of oil-palm production caused a 0.7% biodiversity decline (extirpation of 11 species, or global extinction of 3 species) (Table 1).
Every single-priority scenario we explored produced both benefits and tradeoffs. This is not surprising given the multiple competing priorities of maximizing oil-palm production while avoiding losses in forest cover, biodiversity, carbon stocks, and food production capacity. The best prospect for an optimal solution proved to be the hybrid approach that would enable Indonesia to double its oil-palm production by bringing an additional 3.4 million ha of land into cultivation (Fig. 1 and Table 1), most of which would be located in provinces on the islands of Borneo (62%) and Sumatra (32%) (Table 2 and Fig. S1). Under this scenario, oil-palm expansion would be targeted at degraded (53%) and agricultural (47%) lands that are most productive for oil palm, least suitable for food cultivation, and contain the lowest carbon stocks. Indeed, by taking account of all these factors, the hybrid approach produced the second-best results for maintaining annual food production capacity (limiting loss to 1.9 million tons) and carbon stock (net loss of 191.6 million tons), while avoiding any impact on forest or biodiversity. An oil-palm expansion strategy based on this hybrid approach can therefore avoid many of the tradeoffs inherent in other scenarios that prioritize one aspect or another. Furthermore, by virtue of its implicit recognition of a wider set of priorities, the hybrid approach represents a more nuanced strategy than forest preservation, land sparing, REDD, or food-production driven approaches and is therefore more likely to be politically and socially acceptable.
Table 2.
Priority areas for oil-palm development in Indonesia under the hybrid approach
| Geographical unit | Province | Required area (ha) | Percentage of required area |
| Kalimantan | East Kalimantan | 856,745 | 25.0 |
| Kalimantan | Central Kalimantan | 620,349 | 18.1 |
| Kalimantan | West Kalimantan | 591,148 | 17.2 |
| Sumatra | Jambi | 408,526 | 11.9 |
| Sumatra | South Sumatra | 201,665 | 5.9 |
| Western New Guinea | Papua | 134,176 | 3.9 |
| Sumatra | Bengkulu | 121,964 | 3.6 |
| Sumatra | Aceh (Nanggroe Aceh Darussalam) | 92,276 | 2.7 |
| Sumatra | Riau | 87,482 | 2.6 |
| Sumatra | North Sumatra | 100,552 | 2.9 |
| Sumatra | Lampung | 71,920 | 2.1 |
| Kalimantan | South Kalimantan | 52,773 | 1.5 |
| Western New Guinea | West Papua | 27,472 | 0.8 |
| Sumatra | West Sumatra | 4,642 | 0.1 |
| Java | Banten | 3,918 | 0.1 |
| Java | West Java | 5,422 | 0.2 |
| Others | 47,551 | 1.4 | |
| Total | 3,428,583 |
Discussion
Doubling oil-palm production will increase net profits to individuals, companies, and the nation of Indonesia and improve the livelihoods of people involved directly and indirectly in the oil-palm industry. Conserving biodiversity or carbon is therefore associated with potentially substantial financial opportunity costs: at current palm-oil prices (≈$750 per ton of crude palm oil), an 80-million-ton increase in oil-palm production across Indonesia will require 3.1–5.5 million ha of land (Table 1), representing net present values of $30–53 billion over the 30-year lifespan of oil-palm plantations (12), potentially generating net profits of more than $1 billion annually. Furthermore, more than 4.5 million Indonesians are currently involved directly or indirectly in the oil-palm industry (16). These employment opportunities are likely to double with the projected doubling of oil-palm production in Indonesia. If so, the oil-palm industry would provide jobs for nearly 10 million people, or more than one third of Indonesia's rural poor (27.4 million people) (17). These are admittedly crude comparisons because we have not considered the secondary benefits of oil-palm development (e.g., from downstream processing) nor the ecosystem goods and services (e.g., carbon storage and sequestration) that might be lost because of oil-palm expansion (18). Indeed, the opportunity costs of withholding oil-palm development may be partially or wholly offset by income from REDD, which has been estimated to range from $614 to $6,605 per ha (12). The accounting of other ecosystem services and their tradeoffs would further inform and support societal decisions with regard to future land-use allocation options and help developing nations achieve the goal of sustainable development (19, 20).
Implementing the hybrid approach does necessitate the loss of at least some degraded and agricultural land, particularly in the Indonesian provinces of East, Central, and West Kalimantan, which may result in the displacement of people, and conflicts over issues of land rights and tenure. Nevertheless, the alternatives—whereby food production has priority over oil-palm expansion (food production scenario) or oil-palm development trumps everything else (business-as-usual scenario)—imply substantial biodiversity losses. The question that remains is whether Indonesian and/or global society is prepared to either pay the financial and societal costs of withholding oil-palm development or accept a comparatively small tradeoff with agricultural land (hybrid approach), in return for the conservation of its forests and biodiversity. We have shown through our analyses that it is at least possible to pursue a course of development that substantially minimizes the tradeoffs of oil-palm expansion—so that we may have our cake and eat most of it too.
Materials and Methods
Data Description for Land Use and Land Cover.
Data for land use and land cover were based on a dataset on 2003 land cover of Indonesia compiled by the World Resources Institute, Sekala (an Indonesian nonprofit organization), and the Indonesian Ministry of Forestry (21). This dataset was produced by interpreting Landsat 7 Enhanced Thematic Mapper Plus images from the year 2003. The Landsat images were georectified using base maps data and ground control points. The Landcover classes include the following: airport, barren land, brush, cloud, dry land agriculture mixed with brush, dry land agriculture, estate company, fishpond, mining areas, paddy field, primary dry land forest, primary mangrove forest, primary swamp forest, savanna, secondary dry land forest, secondary mangrove forest, secondary swamp forest, settlement, swamp brush, swamp, and timber estate.
Data Description for Peat Soil Carbon.
Data for peat soil carbon were based on a dataset on Indonesia's peat lands compiled by the World Resources Institute, Sekala, and the Indonesian Ministry of Forestry (21). This dataset was digitized by Sekala from three atlases of peat land distribution in Sumatra, Kalimantan, and Papua (Wetlands International–Indonesia Program). Maps are available digitally online at http://www.wetlands.or.id/publications_maps.php.
Simulating Land-Use Change Resulting from Oil-Palm Expansion.
We first compiled geographic information system (GIS) data on land use and land cover, peat soil carbon stock, above- and below-ground living vegetation (biomass) carbon stock, and potential land suitability and yield for oil-palm and rice production (21–23). Second, we overlaid these GIS data to produce a new data layer of intersected polygons (i.e., land areas that share the same GIS data; n = 656,941); polygons containing complete information on the above variables were included in subsequent analyses (n = 511,433; representing 86% of Indonesia's total land area; complete dataset available at http://www.ites.ethz.ch/). Third, we simulated oil-palm expansion by “converting” an increasing number of polygons to oil palm, on the basis of quantitative probability assignments according to the following five development scenarios. Business-as-usual scenario, whereby polygons were assigned conversion probabilities proportional to the potential yield for oil-palm production (23); this simulated expansion from the most productive to least productive areas for oil palm, except for areas already planted with oil palm (classified as “estate company”) areas not suitable for oil palm (classified as “not suitable”, “very marginal”, or “marginal”), and human-dominated land uses (classified as “settlement”, “transmigration area”, “airport”, “fishpond”, or “mining area”) (21, 23). Food production scenario, whereby polygons were assigned conversion probabilities inversely proportional to the potential yield for rice production (23); this simulated expansion from the least productive to most productive areas for rice. Forest preservation scenario, whereby polygons were assigned conversion probabilities inversely proportional to habitat quality (in terms of approximating primary forests in the broadest sense) (21); oil-palm expansion proceeded in the following sequence: (i) degraded lands (classified as “barren land”, “brush”, “swamp”, or “swamp brush”), (ii) agricultural lands (classified as “dry land agriculture”, “dry land agriculture mixed with brush”, “paddy field”, or “timber estate”), (iii) secondary forests (classified as “secondary dry land forest”, “secondary mangrove forest”, or “secondary swamp forest”), and (iv) primary forests (classified as “primary dry land forest”, “primary mangrove forest”, or “primary swamp forest”). Carbon conservation scenario, whereby polygons were assigned conversion probabilities inversely proportional to biomass and peat soil carbon stock (21, 22); oil-palm expansion proceeded in areas from lowest to highest carbon stock. Hybrid approach, whereby polygons were assigned conversion probabilities derived from multiplying the conversion probabilities for the above scenarios; oil-palm expansion proceeded by taking account of the priorities of maximizing oil-palm production, while minimizing impacts on food production capacity, forest cover, and carbon stocks. By performing a total of 10,000 simulation runs, we calculated the average values for the following outcome variables: (i) area of primary and secondary forests, (ii) forest biodiversity (modeled using a matrix-calibrated species-area model) (8), (iii) biomass and peat soil carbon stocks, and (iv) annual rice production capacity.
We point out that in developing the business-as-usual scenario, we make the simplifying assumption that economies of scale in oil-palm production by large corporations would overwhelm geographic variability in production costs such that oil-palm productivity would reflect profitability, which in turn would be indicative of where future expansions might occur. We have empirical support for this approach: we fitted a generalized linear model on data on potential oil-palm productivity (based on land suitability; see below) as predictor variable, and current presence of oil-palm estates as response variable. We restrict the geographic focus of this analysis to the island of Sumatra, which has undergone the most intensive oil-palm development over the past few decades. We found that oil-palm productivity was a significant predictor of the current location of oil-palm estates (number of polygons, n = 128,440, P < 0.0001). We reiterate that we are not seeking to pin down the determinants of oil-palm expansion, which would require the consideration of a larger suite of predictor variables and multiple competing hypotheses. Rather, through this analysis we are simply giving empirical support for using oil-palm productivity as the basis of our business-as-usual scenario.
Modeling Change in Biodiversity.
Species-area models have been applied widely to predict biodiversity losses resulting from deforestation (24–28). We modeled change in biodiversity using a matrix-calibrated species-area model developed by Koh and Ghazoul (8). This model partitions the z value (i.e., slope) of species-area models into two components: γ, a constant, and σ, a measure of the sensitivity of the taxon to the transformed habitat [quantified as the proportional decrease in the number of species (0 < σ < 1)]. The model accounts for situations whereby land-use change results in a mosaic of several habitat types of varying quality for the taxon, by incorporating an area-weighted average of the taxon's response to each component of the heterogeneous transformed landscape. The matrix-calibrated species-area model is expressed as:
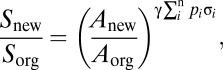 |
where p is the proportional area of the ith habitat type relative to the total converted land area (matrix), and n represents the total number of habitat types. We focused our analysis on forest-dwelling birds—defined as those species that may occur in nonforested habitats but require forests for long-term persistence—as an indicator of potential change in forest biodiversity. Birds are arguably the best-studied tropical taxon in terms of the effects of land-use change on biodiversity (29). On the basis of data on z values compiled by Watling and Donnelly (30), we calculated the mean slope of species-area relationships of birds on land-bridge archipelagos and used this value, z = 0.35 (SEM 0.06, n = 6), as the γ value in the matrix-calibrated model (see ref. 6 for detailed discussion of the rationale for doing so). Additionally, on the basis of the data compiled by Sodhi et al. (29), we determined the sensitivity (i.e., the σ value) of birds to secondary forest [σ = 0.25 (SEM 0.03), n = 42] or agricultural land [σ = 0.68 (SEM 0.05), n = 17]. Given the lack of data on the biodiversity value of degraded land for tropical birds, we assumed that birds are as sensitive to degraded land as they are to agricultural land (σ = 0.68). We further assumed that human-dominated land uses are completely inhospitable to birds (σ = 1). For each of six scenarios, we simulated oil-palm expansion by “converting” an increasing number of polygons to oil palm, until all polygons included for simulation had been converted. At each simulation step, we calculated the potential percentage change in biodiversity—based on the matrix-calibrated model and above-mentioned assumptions—resulting from oil palm–driven changes in land use. We projected the number of locally extirpated species and globally extinct species of birds in Indonesia by multiplying the modeled percentage change in biodiversity with the country's total number of bird species (1,604 species) and number of endemic bird species (443 species), respectively (31).
Modeling Change in Biomass and Peat Soil Carbon Stocks.
At each simulation step, we calculated the potential loss in biomass carbon stock by multiplying the per-hectare content of biomass (22) with the area of the polygon being converted. We performed the same calculation for peat soil carbon (21). We made the simplifying assumption that all biomass and peat soil carbon stock would be lost upon conversion to oil palm. We calculated the increase in carbon sequestered by oil palm by multiplying the per-hectare carbon biomass of oil palm (76 t/ha; see ref. 12 and references therein) with the area converted to oil palm. Net carbon loss was calculated as the difference between carbon loss (total biomass and peat soil carbon stocks) and carbon gain (above-ground carbon biomass in oil-palm plantations).
Modeling Change in Rice Production Capacity and Oil-Palm Production.
On the basis of data on potential land suitability and yield for rice and oil-palm production (23), we derived rice and oil-palm yield factors for each polygon: “not suitable” = yield factor of 0; “very marginal” = 0.025; “marginal” = 0.15; “moderate” = 0.325; “medium” = 0.475; “good” = 0.625; “high” = 0.775; and “very high” = 0.925. Next, we calculated the potential loss in rice production capacity due to the conversion of each polygon by multiplying this yield factor with the global maximum attainable yield for rice (10 t/ha) (6) and the area of the polygon being converted. We performed the same calculation for oil-palm production (for which we assumed global maximum attainable yield to be 28 t/ha) (6).
Modeling Financial Opportunity Cost.
We calculated the opportunity cost of withholding oil-palm development in Indonesia according to a financial model developed by Butler et al. (12). Under their “high yield constant price” scenario, which assumed an average lifetime oil-palm yield of 20.5 tons per year and a constant palm-oil pricing scenario of $749 per ton of crude palm oil (see ref. 10 for their other model assumptions), oil-palm agriculture has a net present value (NPV) of $9,630/ha over the 30-year lifespan of oil-palm plantations. We calculated the range in opportunity cost of withholding oil-palm development by multiplying the NPV of oil-palm plantations ($9,630/ha) with the range in area of projected oil-palm expansion (3.1–5.5 million ha).
Supplementary Material
Acknowledgments
We thank the editor and two anonymous reviewers for useful comments and G. Gradinger and T. Grossmann for technical assistance. L.P.K. is supported by an Eidgenössische Technische Hochschule Fellowship and the Swiss National Science Foundation.
Footnotes
The authors declare no conflict of interest.
This article is a PNAS Direct Submission. S.P. is a guest editor invited by the Editorial Board.
This article contains supporting information online at www.pnas.org/lookup/suppl/doi:10.1073/pnas.1000530107/-/DCSupplemental.
References
- 1.USDA-FAS. Oilseeds: World Markets and Trade. Washington, DC: US Department of Agriculture–Foreign Agricultural Service; 2010. Circular Series FOP 3-10. [Google Scholar]
- 2.Koh LP, Ghazoul J. Biofuels, biodiversity, and people: Understanding the conflicts and finding opportunities. Biol Conserv. 2008;141:2450–2460. [Google Scholar]
- 3.Zen Z, Barlow C, Gondowarsito R. Oil Palm in Indonesian Socioeconomic Improvement. A Review of Options. Working Paper. Canberra, Australia: Australian National University; 2005. [Google Scholar]
- 4.Jakarta Post (December 2, 2009) 18 million hectares of land for palm oil. Jakarta Post. Available at http://www.thejakartapost.com/news/2009/12/02/indonesia-allocates-18-million-hectares-land-palm-oil.html.
- 5.World Growth . Palm Oil—The Sustainable Oil. Arlington, VA: World Growth; 2009. [Google Scholar]
- 6.FAO . FAOSTAT Online Statistical Service. Rome, Italy: Food and Agriculture Organization of the United Nations; 2009. [Google Scholar]
- 7.WRI . Climate Analysis Indicators Tool. Washington, DC: World Resources Institute; 2009. [Google Scholar]
- 8.Koh LP, Ghazoul J. A matrix-calibrated species-area model for predicting biodiversity losses due to land-use change. Conserv Biol. 2010 doi: 10.1111/j.1523-1739.2010.01464.x. 10.1111/j.1523-1739.2010.01464.x. [DOI] [PubMed] [Google Scholar]
- 9.Bahroeny JJ. Palm oil as an economic pillar of Indonesia. Jakarta Post. December 2, 2009. Available at http://www.thejakartapost.com/news/2009/12/02/palm-oil-economic-pillar-indonesia.html.
- 10.Fischer J, et al. Should agricultural policies encourage land sparing or wildlife-friendly farming? Front Ecol Environ. 2008;6:380–385. [Google Scholar]
- 11.Koh LP, Levang P, Ghazoul J. Designer landscapes for sustainable biofuels. Trends Ecol Evol. 2009;24:431–438. doi: 10.1016/j.tree.2009.03.012. [DOI] [PubMed] [Google Scholar]
- 12.Butler RA, Koh LP, Ghazoul J. REDD in the red: Palm oil could undermine carbon payment schemes. Conserv Lett. 2009;2:67–73. [Google Scholar]
- 13.Murray BC. Leakage from an Avoided Deforestation Compensation Policy: Concepts, Empirical Evidence, and Corrective Policy Options. Durham, NC: Nicholas Institute for Environmental Policy Solutions, Duke University; 2008. [Google Scholar]
- 14.Lapola DM, et al. Indirect land-use changes can overcome carbon savings from biofuels in Brazil. Proc Natl Acad Sci USA. 2010;107:3388–3393. doi: 10.1073/pnas.0907318107. [DOI] [PMC free article] [PubMed] [Google Scholar]
- 15.United Nations . World Population Prospects: The 2006 Revision. New York: Population Division of the Department of Economic and Social Affairs of the United Nations Secretariat; 2007. [Google Scholar]
- 16.Sargeant HJ. Vegetation Fires in Sumatra, Indonesia. Oil Palm Agriculture in the Wetlands of Sumatra: Destruction or Development? Jakarta, Indonesia: European Union and Ministry of Forestry; 2001. [Google Scholar]
- 17.World Bank . PovcalNet Online Poverty Analysis Tool. Washington, DC: The World Bank; 2009. [Google Scholar]
- 18.Ghazoul J, Butler RA, Mateo-Vega J, Koh LP. REDD: A reckoning of environment and development implications. Trends Ecol Evol. 2010 doi: 10.1016/j.tree.2010.03.005. 10.1016/j.tree.2010.03.005. [DOI] [PubMed] [Google Scholar]
- 19.Raudsepp-Hearne C, Peterson GD, Bennett EM. Ecosystem service bundles for analyzing tradeoffs in diverse landscapes. Proc Natl Acad Sci USA. 2010;107:5242–5247. doi: 10.1073/pnas.0907284107. [DOI] [PMC free article] [PubMed] [Google Scholar]
- 20.Mäler KG, Aniyar S, Jansson A. Accounting for ecosystem services as a way to understand the requirements for sustainable development. Proc Natl Acad Sci USA. 2008;105:9501–9506. doi: 10.1073/pnas.0708856105. [DOI] [PMC free article] [PubMed] [Google Scholar]
- 21.Minnemeyer S, et al. Interactive Atlas of Indonesia's Forests CD-ROM. Washington, DC: World Resources Institute; 2009. [Google Scholar]
- 22.Ruesch A, Gibbs HK. New IPCC Tier-1 Global Biomass Carbon Map for the Year 2000. Oak Ridge, TN: Carbon Dioxide Information Center, Oak Ridge National Laboratory; 2008. [Google Scholar]
- 23.Fischer G, Shah M, van Velthuizen H, Nachtergaele FO. Global Agro-ecological Assessment for Agriculture in the 21st Century. Laxenburg, Austria: International Institute for Applied Systems Analysis; 2001. [Google Scholar]
- 24.Brook BW, Sodhi NS, Ng PKL. Catastrophic extinctions follow deforestation in Singapore. Nature. 2003;424:420–426. doi: 10.1038/nature01795. [DOI] [PubMed] [Google Scholar]
- 25.Brooks TM, Balmford A. Atlantic forest extinctions. Nature. 1996;380:115. [Google Scholar]
- 26.Brooks TM, et al. Habitat loss and extinction in the hotspots of biodiversity. Conserv Biol. 2002;16:909–923. [Google Scholar]
- 27.Brooks TM, Pimm SL, Collar NJ. Deforestation predicts the number of threatened birds in insular Southeast Asia. Conserv Biol. 1997;11:382–394. [Google Scholar]
- 28.Brooks TM, Pimm SL, Oyugi JO. Time lag between deforestation and bird extinction in tropical forest fragments. Conserv Biol. 1999;13:1140–1150. [Google Scholar]
- 29.Sodhi NS, Lee TM, Koh LP, Brook BW. A meta-analysis of the impact of anthropogenic forest disturbance on Southeast Asia's biotas. Biotropica. 2009;41:103–109. [Google Scholar]
- 30.Watling JI, Donnelly MA. Fragments as islands: A synthesis of faunal responses to habitat patchiness. Conserv Biol. 2006;20:1016–1025. doi: 10.1111/j.1523-1739.2006.00482.x. [DOI] [PubMed] [Google Scholar]
- 31.WCMC-UNEP . Species Data. Cambridge, UK: World Conservation Monitoring Centre of the United Nations Environment Programme; 2004. [Google Scholar]
Associated Data
This section collects any data citations, data availability statements, or supplementary materials included in this article.