Abstract
A central challenge in systems biology today is to understand the network of interactions among biomolecules and, especially, the organizing principles underlying such networks. Recent analysis of known networks has identified small motifs that occur ubiquitously, suggesting that larger networks might be constructed in the manner of electronic circuits by assembling groups of these smaller modules. Using a unique process-based approach to analyzing such networks, we show for two cell-cycle networks that each of these networks contains a giant backbone motif spanning all the network nodes that provides the main functional response. The backbone is in fact the smallest network capable of providing the desired functionality. Furthermore, the remaining edges in the network form smaller motifs whose role is to confer stability properties rather than provide function. The process-based approach used in the above analysis has additional benefits: It is scalable, analytic (resulting in a single analyzable expression that describes the behavior), and computationally efficient (all possible minimal networks for a biological process can be identified and enumerated).
Keywords: biological network, Boolean network, modulization and motif, process centric analysis
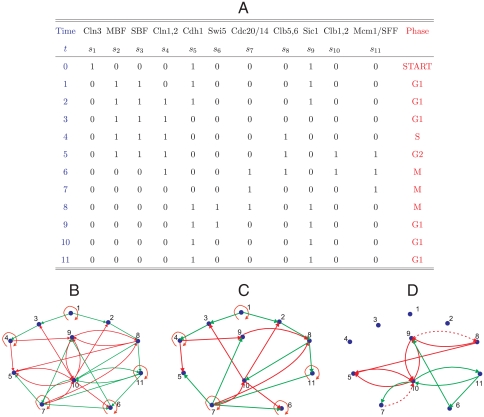
Micro-biological networks are representations of biological processes involving transformation of molecular species through a sequence of interactions. Graphically, each biologically active kind of molecule is a “node,” and interactions between molecules is represented by connections called “edges.” A central theme in systems biology is to reveal the intricate relationship among network structure, dynamical properties, and biological function (1–6). Consider for example the 11-molecule cell-cycle network model for the budding yeast cell described in ref. 3 and shown here in Fig. 1B. Even a modest sized network like this one captures important questions about the architecture of biological networks: What do different parts of the network contribute to the network’s function and its dynamic behavior? Can the same functionality be achieved with a smaller network (fewer edges)? What effect would a simpler network have on the biological stability (robustness)? Is the network irreducible, or can it be described by an assemblage of smaller modules?
Fig. 1.
Budding yeast. (A) The time course of the 11 nodes as a representation of the cell-cycle process. (B) The full cell-cycle network. (C) The backbone subnetwork contained in the full network. (D) The supplemental edges are characterized by various feedback loops. The edges r98 and r7,10 are shown as dashed lines because they are shared with the backbone.
Prior work on network decomposition—understanding a network’s components—has focused on two types of analysis. The first, which we will call motif occurrence analysis, examines all possible small motifs with two, three, or four nodes and by searching for these motifs in known networks, identifies those motifs that occur most frequently across all known networks (7–9). The assumption is that frequently occurring motifs then form a useful building block or module that confers some functionality or property. The second type of work, which we will call motif function analysis, focuses more closely on network function or dynamics. This approach starts with a given network and its known dynamic behavior (the function of the network) and, by removing the edges in a small motif, tries to characterize the effect of the motif. The thinking here is if the removal of a motif results in a loss of function, the motif can be said to contribute to the function. Note that, because any subset of connected edges can be a plausible motif, the number of trials needed for a systematic search of all motifs grows exponentially large, a limitation that also afflicts the motif-occurrence approach. These approaches leave open the question: Do networks contain large motifs that are a primary determining factor in achieving a network’s function?
In this paper, we present a unique approach to decomposition that addresses the above large-motif question in the affirmative. This approach, which we call process-based analysis, starts by characterizing the space of all possible networks that provide the desired function (process) and then identifies, among these, the minimal networks (with the fewest edges). These minimal networks, it turns out, are few in number and capture the primary functionality—the removal of any single edge from a minimal network destroys the network’s function. Thus, such a minimal network forms a giant backbone motif whose edges touch all the nodes and every edge of which is needed to maintain the original network’s functionality.
One advantage of identifying possible large backbone motifs becomes clear when examining the remaining edges in the network. For the two examples we study—cell-cycle models of the budding and fission yeast—the remaining edges form small motifs whose purpose is readily apparent. These small motifs do not provide the network’s main function but instead confer stability properties: They either make the network more robust to perturbation (more states lead to the main attractor) or strengthen the dynamics (more states lead to the main trajectory).
The approach and conclusions we present is not without limitations, however. Perhaps the biggest limitation is the fact that we rely on the Boolean model, which abstracts away molecular concentrations into two molecular states “on” (active) or “off” (inactive). Furthermore, interactions are modeled as either stimulatory or inhibitory. We note that such assumptions are standard in the Boolean model (1, 10, 11), which is often used in place of models based on differential equations to elicit higher-level network properties.
These general limitations notwithstanding, our particular approach provides several benefits. First, as a natural consequence of the technique, the collection of all possible networks that produce a given behavior is characterized by a single equation that directly reveals useful structure: For example, edges that are necessary for function are identified by algebraically factoring the equation. Second, the equation can be analyzed to enumerate all minimal networks (possible backbone motifs), as we do in this paper. These turn out to be small enough in number to identify which one is actually present in the given network. Third, the existence of a solution to the equation can be solved very efficiently (in polynomial time), which suggests that the technique will scale efficiently to larger numbers of nodes. Finally, and importantly, the equation allows one to quickly categorize edges into three useful types: edges that are rigid (the edges common to all minimal networks), edges that are interchangeable (these edges can be substituted by alternatives but are essential for the process), and supplemental (these are not essential to function but confer stability properties).
The above categorization of edges is independently useful because it allows one to immediately identify edges that contribute to function and those that contribute to stability. For the budding yeast network, this leads to an additional insight about how small motifs help control the separation of cell-cycle phases.
Methods
The Boolean Network Model.
The starting point for our model is a collection of N kinds of interacting molecules, each of which at any given time is modeled as either “on” (active, or highly expressed) or “off” (inactive). Then, at any given time, the system of N molecules is in a system- or network-state, and over time the system dynamically changes from state to state depending on the interactions between the molecules. Thus, from a given start state, there is a well-defined sequence of system states that end up in a stable system state often called an attractor. We term this sequence or trajectory of such system states a Boolean process, examples of which are shown in Figs. 1A and 2A for the budding yeast and fission yeast cell-cycles, respectively. Given the initial cell-cycle state, the outcome of the network is a well-defined trajectory of states that correspond to different phases of the cell cycle. Such a trajectory can thus be considered the cell-cycle function of the network. More formally, let si(t)∈{0,1} denote the state of molecule i and S(t) = (s1(t),…,sN(t)) the state of the system at time t. Here, time is assumed to be discrete: t = 0,1,2,… and thus a molecule possibly changes state in a time step. A sequence of such systems states, S∗ = S(0),S(1),…,S(T - 1) is what we have termed a Boolean process. Intuitively, in biological terms, a Boolean process corresponds to discretized time-course data. Thus, a sequence of microarray snapshots taken for a system of molecules taken over a time course can be converted into this Boolean form by noting which molecules are active and which are not.
Fig. 2.
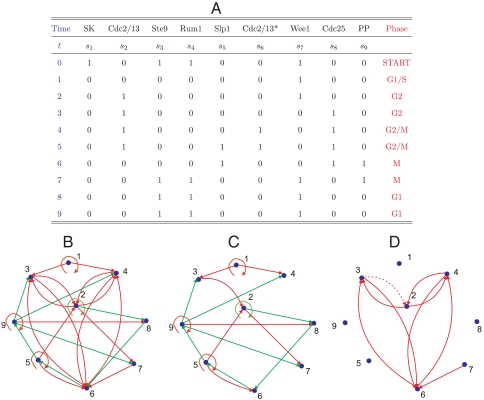
Fission yeast. (A) The time course of the nine nodes as a representation of the cell-cycle process. (B) The full cell-cycle network. (C) The backbone subnetwork contained in the full network. (D) The remaining edges are characterized by mutual inhibitive loops. The edge r32 is shown as dashed line because it is shared with the backbone.
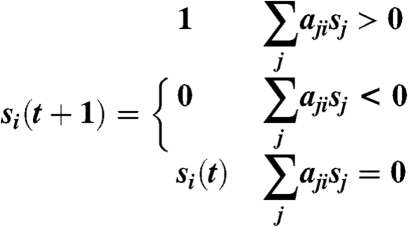
The dynamics of a Boolean network (BN) model (determining the next state from the current state) can be described as follows (3):
 |
[1] |
where (aji) is a N × N matrix encoding the network structure. The diagonal entries, aii, take the value -1 (self degradation), 1 (self activation), or 0 (no action). The nondiagonal entries, aji (j ≠ i), take the value -γ, 1, or 0, depending on whether node j inhibits, activates, or does not interact with node i.
The parameter γ models the relative dominance of inhibition over stimulation. Because inhibition is dominant over stimulation for most biomolecular interactions, one prefers γ≥1. Moreover, the network dynamics is usually not sensitive to the value of γ (the network topology is more important than the actual interaction strength). For the budding yeast network, the cases γ = 3,4,5,⋯,∞ produce exactly the same dynamics and are only slightly different from the cases γ = 1, 2. For the fission yeast network, the cases γ = 2,3,4,⋯,∞ produce exactly the same dynamics and are only slightly different from the cases γ = 1. We therefore follow the “dominant inhibition” assumption (12, 13, 14) by setting γ = ∞. This assumption renders a simpler, logical representation of (Eq. 1), namely:
 |
[2] |
where rji represents a putative inhibitory (red) edge from node j to node i, gji represents a putative stimulatory (green) edge from node j to node i, addition represents the Boolean operator OR, and multiplication represents AND; the bar on a variable represents NOT.
Satisfiability of the Network Equation.
Because, in principle, each pair of nodes might have a green or red edge between them, the number of variables is of the order of N2. For the 11-node cell-cycle example, it is possible to write down the equation by hand and simplify the equation sufficiently to find solutions. However, we now show how the solution can be automated by an algorithm that exploits the fact that the equations [2] are nodewise independent (because they do not share any variables). Next, let I(t) = {j: sj(t) = 1} the states that are “on” at time t. The steps in the algorithm are:
-
// Identify those edges that cannot be red
// because they would interfere with a 0 → 1
// or 1 → 1 transition:
CannotBeRed = ∅
NoEdge = ∅
for all t such that si(t) = 1
for all j∈I(t - 1)
CannotBeRed←CannotBeRed ∪{j}
-
// Identify those cases where self-degradation
// is necessary.
for all t such that si(t - 1) = 1, si(t) = 0
if I(t - 1)⊆CannotBeRed
SelfDegradation←true
NoEdge←NoEdge ∪I(t - 1)
-
// Now assign red edges
for all j∈I(t - 1) - CannotBeRed - NoEdge
rji←1
-
// Next, identity edges that cannot be green.
for all t such that si(t - 1) = 0, si(t) = 0
if I(t - 1) has no red edges
// None of them can be green,
// else si(t) would be 1.
CannotBeGreen←CannotBeGreen ∪I(t - 1)
for all t such that si(t - 1) = 1, si(t) = 0
if I(t - 1) has no red edges
and not SelfDegradation = true
// None of them can be green,
// else si(t) would be 1.
CannotBeGreen←CannotBeGreen ∪I(t - 1)
-
// Assign the remaining to green.
for all j∈ CannotBeRed - NoEdge - CannotBeGreen
gji←1
Finally, note that once the edges have been identified, we “run” the network on the process to see if it is consistent with the process. If not, no solution exists.
The above algorithm identifies whether a solution exists in polynomial time (O(MN2)).
Solving the Network Equation.
Because the state variables S(t) are known from the biological process, Eq. 2, for t = 0,1,⋯,T - 1, are used to infer the network connections to node i. As illustrated by the example in SI Appendix, the equations can be simplified because many variables are already factored out. The simplified equations are then solved by enumeration.
The number of solution networks is called the designability of the process (5); the idea is that a process with many network solutions is likely to be more favored in nature because it would be easier for an evolutionary process to create. Nochomovitz and Li (5) compute the designability (for very small networks) using time-consuming exhaustive enumeration, while our approach can compute the designability directly from the equation. For example, the budding yeast process has a designability of 2.84 × 1031, whereas the fission yeast process has a designability of 9.61 × 10²¹.
Minimal Networks and Edge Classification.
An obvious question is: What is the smallest network that solves the equation? Such a minimal network serves as the backbone motif discussed earlier. Again, we can enumerate all such minimal networks to identify which minimal network (backbone) is present in a given network (see SI Appendix). For example, there are 108,864 minimal networks that arise from analyzing the budding yeast cell-cycle process (Fig. 1A), among which one and only one is contained in the budding yeast network.
Network Dynamical Properties.
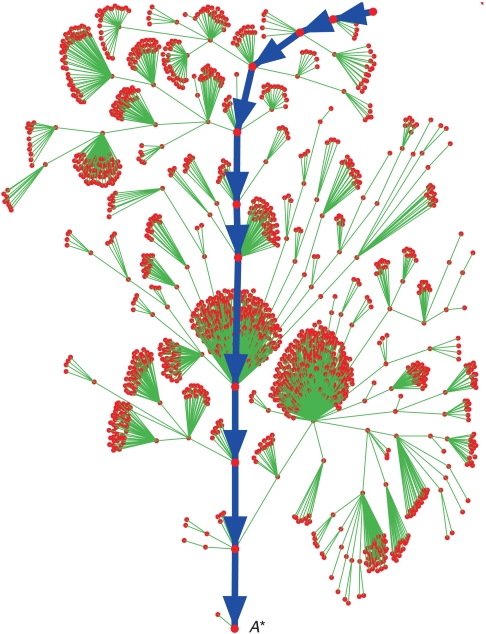
To study the dynamical properties of putative networks, we use two well-known measures of robustness. Both are based on constructing the state-transition graph or attractor-basin portrait, an example of which (for the budding yeast) is shown in Fig. 3. The figure also shows the sequence of states corresponding to the process, the main trajectory (or process) through the transition graph. The first and most commonly used measure is the basin size B: the number of states that converge to the main attractor. A large basin is considered an indication of stability (3) because a perturbation in state results in a convergent path to the main attractor.
Fig. 3.
Phase transition portrait of the budding yeast network. The 1875 network states in the basin of the attractor A∗ are shown as red dots. The main dynamical trajectory, colored in blue, corresponds to the normal cell-cycle process. The other 173 states converge into six other attractors.
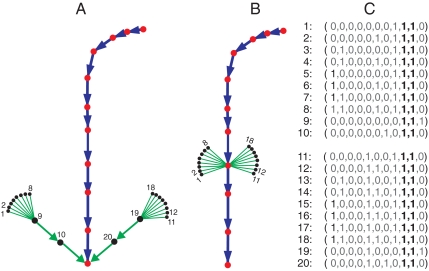
A more refined measure of robustness is suggested in ref. 3, based on observing that it is not sufficient to require a perturbed state to converge to the attractor but rather to require a perturbed state to return to the main trajectory. One way to quantify this idea is to compute the trajectory overlap W using the trajectory of states from every single state to its attractor. In Fig. 5B, for example, there is a larger trajectory overlap than in Fig. 5A, which correlates with the fact that most states go through the main process. In ref. 3, a quantity wn (n = 1,2,⋯,2N) was defined for each of the 2N network states that measures the overlap of its trajectory with all other trajectories. The overlap of all trajectories was defined to be W = 〈wn〉, where the average was over all network states (3). Note that our focus is the main attractor A*, hence, W = 〈wn〉, where the average is over the basin of A*.
Fig. 5.
The change of trajectories caused by mutual inhibition. The middle, blue trajectory represents the budding yeast cell-cycle process S∗. States with (s9 s10) = (1 1) are shown as black dots, including 16 initial states that are smaller. (A) In the minimal network, the states follow harmful trajectories to converge to the attractor. There are three successive durations of (s9 s10) = (1 1). (B) In the full network, the 16 initial states immediately converge to the normal cell-cycle process. (C) The actual states represented by the black dots.
What can these measures tell us? Clearly, high values of B and W are desirable—an indication that there is a single strong trajectory to the main attractor and that perturbations almost always lead back to this trajectory. Below, we will examine how our edge classification relates to these measures.
Model Systems Studied.
We applied our methods to the cell-cycle networks of the budding yeast (Saccharomyces cerevisiae) and fission yeast (Schizosaccharomyces pombe) cells. The Boolean model for the budding yeast cell cycle is from (3) and is shown in Fig. 1B. The network has N = 11 nodes and 34 edges. The cell-cycle process is represented by the sequence of states depicted in Fig. 1A, the last of which is the main attractor A* with a large basin size 1875 (91.6%) of the total 2N = 2048 states).
The Boolean network for fission yeast is from ref. 15, which has N = 9 nodes and 26 edges (Fig. 2B). The biological process is shown in Fig. 2A. Here, the main attractor has a basin size of 416, about 81.3% of the total 2N = 512 states.
Results
The Backbone Motif and Smaller Motifs.
We applied Eq. 2 to the budding and fission processes of Figs. 1A and 2A, respectively, and obtained the following results:
Budding yeast. The equation for the budding yeast yielded 108,864 minimal networks, each with 23 edges, one (and only one) of which is a complete subset of the full network in Fig. 1B. This minimal network, the backbone motif, is shown in Fig. 1C. Upon analyzing the remaining 11 edges, shown in Fig. 1D, we find a negative feedback loop (g10,7 r7,10), a positive feedback loop (g10,11 g11,10), and three mutual-inhibition loops (r5,10 r10,5), (r9,10 r10,9), and (r8,9 r9,8).
Fission yeast. For the fission yeast, the equation yielded 1,024 minimal networks, each with 18 edges, one (and only one) of which is the backbone shown in Fig. 2C. Analysis of the remaining edges shown in Fig. 2D reveals four mutually inhibitory loops.
Thus, in both cases, the approach has identified for each network a spanning subnetwork (the backbone motif) and several smaller motifs. Identification of the smaller motifs was made possible when the backbone edges were removed from the network.
Thus far we have only shown how to identify the backbone and the smaller motifs. What we have not shown yet is evidence for our claim that the backbone network carries out the main function while the smaller motifs confer stability properties. This we take up next.
Edge Classification and Robustness.
To see why the backbone motif is crucial to function, we return to the edge classification described earlier: Rigid edges are edges that must be present in all minimal networks, supplemental edges are those whose values do not contribute to the solution of Eq. 2, and interchangeable edges are the ones remaining (these are how the minimal networks differ). Any minimal network consists of all the rigid edges and some interchangeable edges and, thus, one would like to determine the contribution of these edges to the network’s function.
To examine the contribution of any group of edges, we remove the edges from the cell-cycle network and compute the robustness measures B and W for the resulting network. We define three types of networks that result from selective deletion of edges: In Group I, some combination of rigid edges are removed. Similarly, Group II networks consist of the networks one gets when removing a random subset of interchangeable edges. Likewise, Group III networks result from removing some combination of supplemental edges.
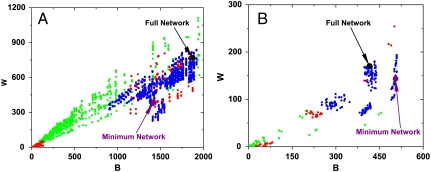
We would expect Group II and III networks to be less robust than the original network, while Group I networks should experience an almost total loss of function. This is indeed the case, as shown by plotting B vs. W in Fig. 4 A and B for budding and fission yeast, respectively.
Rigid edges. Removing any rigid edge results in a loss of function because, by definition, any network that satisfies the given process must contain these edges. However, one may still ask whether the resulting (Group I) networks, even if they lack function, still have robustness properties. The red dots in Fig. 4 Aand B represent these perturbed networks. Interestingly, they fall into two categories. The red dots on the left are those with severely impaired function and virtually no robustness, as one would expect from removing backbone edges. However, the red dots on the right (higher robustness), while nonfunctional, still display some robustness, something that requires explanation. A careful analysis of the edges involved in the right cluster reveals edges that play a role in the early steps of the process. Thus, their removal still leaves the latter part of the process intact, with some degree of robustness.
Supplemental edges. Consider the budding yeast network of Fig. 1B and the 11 supplemental edges shown in Fig. 1D. These 11 supplemental edges, when removed in all possible combinations, result in 211 = 2048 perturbed networks, each of which will have a B and W value. These 2,048 points are plotted as blue dots in Fig. 4A. Clearly, the blue dots spread toward lower B and W values, indicating loss of robustness. Fig. 4B confirms the same result for the fission yeast.
Interchangeable edges. To complete the robustness analysis, we examine the effects of removing interchangeable edges. Recall that these edges are needed in minimal networks, but there is some choice in using them—every minimal network has some (but not all) of them. For the budding yeast, there are 13 such interchangeable edges and thus 213 = 8,192 perturbed networks can be created by removing a subset of them, shown by the green dots in Fig. 4A. Similarly, the green dots in Fig. 4B represent perturbed networks for the fission yeast. Removal of some of these edges results in both loss of robustness as well as loss of function; in this case, the loss of robustness is more severe.
Fig. 4.
The B and W values of perturbed networks derived from the budding yeast and fission yeast networks. Group I, II, and III networks are represented by red, green, and blue dots respectively. The big black point and the big purple point represent the full network and the minimal network, respectively. (A) The B-W diagram for budding yeast. (B) The B-W diagram for fission yeast.
Fig. 4 also shows two special networks. The black dot indicates the (B, W) value for the original network, while the purple dot indicates the (B, W) value for the minimal network.
Small Motifs and Phase Regulation.
We now examine some of the small motifs exposed by the analyses of the two cell-cycle networks. Together, they reveal a number of valuable insights related to regulating the phases of the cell cycle. The first is that many of the motifs involve nodes [5, 8, 9, 10 in budding yeast (16–20) and 2, 3, 4, 6 in fission (21–25)] known to be master regulators. This is not surprising, but it is a confirmation that the type of analysis presented here correlates with what is known by biologists. What one would like to know is whether motifs that involve these molecules explain the phase-regulation role.
Consider the budding yeast motif with edges r9,10 and r10,9. These edges prevent the simultaneous occurrence of s9 = 1 and s10 = 1, a state that might be considered as a harmful overlap of the G1 and M phases. To further analyze, we consider what happens when this motif is removed. Fig. 5A shows the relevant portion of the state-transition diagram (the attractor-basin portrait), with the process shown in blue and the (harmful) states with (s9,s10) = (1,1) shown as black dots. The minimal network (without the regulatory motif) shows these states converging independently and directly to the attractor, whereas when the motif is added to the minimal network we get the behavior in Fig. 5B. Here, there are two observations to be made. The first is that harmful states are quickly invalidated: Each harmful combination state lasts only one step when the motif is used. The second, equally important but different observation is that the motif directs the harmful states directly to the cell-cycle process (whereas in the motif-free network, the harmful states last longer and follow an independent path to the attractor, bypassing the main process). Thus, it is as if the motif provides a checkpoint to ensure that the process of cell phases is carried out both fully and separately.
Summary
We have presented a technique based on the Boolean model to decompose a network into motifs and then applied this technique to two cell-cycle networks. For each network, one of these motifs turns out to be a large backbone motif that spans all the network nodes and carries the main functionality of the network. The remaining edges form smaller motifs that contribute to the stability of the network. Furthermore, the technique enables a classification of edges that helps in identifying the purpose of the smaller motifs. The results suggest that for new networks, one may be able to rapidly identify their backbone structure and the hypothesize the function of the remaining interactions. Because the technique characterizes the class of networks producing a given process, it may be used to reduce the search space for the network inference problem where the goal is to infer the network from expression data. Note that the technique is scalable and computationally efficient and may be applied to larger networks.
Supplementary Material
Acknowledgments.
The authors thank Prof. William C. Parke for his suggestions. The work is supported by National Science Foundation (NSF) Grant CDI-0941228 (C.Z., R.S., Y.R., G.W.), the Project of Knowledge Innovation Program of the Chinese Academy of Sciences (G.W.), NSF Grant DMR-0313129 (C.Z.), and Grant 30525037 from the National Science Foundation of China (Y.X.).
Footnotes
The authors declare no conflict of interest.
This article is a PNAS Direct Submission.
This article contains supporting information online at www.pnas.org/lookup/suppl/doi:10.1073/pnas.0914180107/-/DCSupplemental.
References
- 1.Bornholdt S. Less is more in modeling large genetic networks. Science. 2005;310:449–451. doi: 10.1126/science.1119959. [DOI] [PubMed] [Google Scholar]
- 2.Kauffman S-A. Origins of Order: Self-Organization and Selection in Evolution. Oxford: Oxford Univ Press; 1993. [Google Scholar]
- 3.Li F, Long T, Lu Y, Ouyang Q, Tang C. The yeast cell-cycle network is robustly designed. Proc Natl Acad Sci USA. 2004;101:4781–4786. doi: 10.1073/pnas.0305937101. [DOI] [PMC free article] [PubMed] [Google Scholar]
- 4.Lau K, Ganguli S, Tang C. Function constrains network architecture and dynamics: A case study on the yeast cell cycle Boolean network. Phys Rev E. 2007;75:051907. doi: 10.1103/PhysRevE.75.051907. [DOI] [PubMed] [Google Scholar]
- 5.Nochomovitz Y-D, Li H. Highly designable phenotypes and mutational buffers emerge from a systematic mapping between network topology and dynamic output. Proc Natl Acad Sci USA. 2006;103:4180–4185. doi: 10.1073/pnas.0507032103. [DOI] [PMC free article] [PubMed] [Google Scholar]
- 6.Kashtan N, Alon U. Spontaneous evolution of modularity and network motifs. Proc Natl Acad Sci USA. 2005;102:13773–13778. doi: 10.1073/pnas.0503610102. [DOI] [PMC free article] [PubMed] [Google Scholar]
- 7.Alon U. An Introduction to Systems Biology: Design Principles of Biological Circuits. Boca Raton, FL: Chapman & Hall; 2006. [Google Scholar]
- 8.Alon U. Network motifs: Theory and experimental approaches. Nat Rev Genet. 2007;8:450–461. doi: 10.1038/nrg2102. [DOI] [PubMed] [Google Scholar]
- 9.Dobrin R, Beg Q-K, Barabasi A-L, Oltvai Z-N. Aggregation of topological motifs in the E.coli transcriptional regulatory network. BMC Bioinformatics. 2004;5:10. doi: 10.1186/1471-2105-5-10. [DOI] [PMC free article] [PubMed] [Google Scholar]
- 10.Albert I, Thakar J, Li S, Zhang R, Albert R. Boolean network simulations for life scientists. Source Code for Biology and Medicine. 2008;3:16. doi: 10.1186/1751-0473-3-16. [DOI] [PMC free article] [PubMed] [Google Scholar]
- 11.Assmann S-M, Albert R. Discrete dynamic modeling with asynchronous update or, how to model complex systems in the absence of quantitative information. In: Belostotsky D, editor. Methods in Molecular Biology: Plant Systems Biology. NJ: Humana Press; 2009. [DOI] [PubMed] [Google Scholar]
- 12.Albert R, Othmer H-G. The topology of the regulatory interactions predicts the expression pattern of the segment polarity genes in Drosophila melanogaster. J Theor Biol. 2003;223:1–18. doi: 10.1016/s0022-5193(03)00035-3. [DOI] [PMC free article] [PubMed] [Google Scholar]
- 13.Tan N, Ouyang Q. Design of a network with state stability. J Theor Biol. 2006;240:592–598. doi: 10.1016/j.jtbi.2005.10.019. [DOI] [PubMed] [Google Scholar]
- 14.Fortuna M-A, Melián C-J. Do scale-free regulatory networks allow more expression than random ones? J Theor Biol. 2007;247:331–336. doi: 10.1016/j.jtbi.2007.03.017. [DOI] [PubMed] [Google Scholar]
- 15.Davidich M-I, Bornholdt S. Boolean network model predicts cell cycle sequence of fission yeast. PLoS One. 2008;3:e1672. doi: 10.1371/journal.pone.0001672. [DOI] [PMC free article] [PubMed] [Google Scholar]
- 16.Surana U, et al. The role of CDC28 and cyclins during mitosis in the budding yeast S. cerevisiae. Cell. Cell. 1991;65:145–161. doi: 10.1016/0092-8674(91)90416-v. [DOI] [PubMed] [Google Scholar]
- 17.Schwob E, Nasmyth K. CLB5 and CLB6, a new pair of B cyclins involved in DNA replication in Saccharomyces cerevisiae. Genes Dev. 1993;7:1160–1175. doi: 10.1101/gad.7.7a.1160. [DOI] [PubMed] [Google Scholar]
- 18.Mendenhall M-D, Hodge A-E. Regulation of Cdc28 cyclin-dependent protein kinase activity during the cell cycle of the yeast Saccharomyces cerevisiae. Microbiol Mol Biol Rev. 1998;62:1191–1243. doi: 10.1128/mmbr.62.4.1191-1243.1998. [DOI] [PMC free article] [PubMed] [Google Scholar]
- 19.Tripodi F, Zinzalla V, Vanoni M, Alberghina L. In CK2 inactivated cells the cyclin dependent kinase inhibitor Sic1 is involved in cell-cycle arrest before the onset of S phase. Biochem Biophys Res Commun. 2007;359:921–927. doi: 10.1016/j.bbrc.2007.05.195. [DOI] [PubMed] [Google Scholar]
- 20.Skaar J-R, Pagano M. Cdh1: A master G0/G1 regulator. Nat Cell Biol. 2008;10:755–757. doi: 10.1038/ncb0708-755. [DOI] [PMC free article] [PubMed] [Google Scholar]
- 21.Novak B, Tyson J-J. Modeling the control of DNA replication in fission yeast. Proc Natl Acad Sci USA. 1997;94:9147–9152. doi: 10.1073/pnas.94.17.9147. [DOI] [PMC free article] [PubMed] [Google Scholar]
- 22.Novak B, Csikasz-Nagy A, Gyorffy B, Chen K, Tyson J-J. Mathematical model of the fission yeast cell cycle with checkpoint controls at the G1/S, G2/M and metaphase/anaphase transitions. Biophys Chem. 1998;72:185–200. doi: 10.1016/s0301-4622(98)00133-1. [DOI] [PubMed] [Google Scholar]
- 23.Novak B, Pataki Z, Ciliberto A, Tyson J-J. Mathematical model of the cell division cycle of fission yeast. Chaos. 2001;11:277–286. doi: 10.1063/1.1345725. [DOI] [PubMed] [Google Scholar]
- 24.Sveiczer A, Csikasz-Nagy A, Gyorffy B, Tyson J-J, Novak B. Modeling the fission yeast cell cycle: Quantized cycle times in wee1- cdc25Delta mutant cells. Proc Natl Acad Sci USA. 2000;97:7865–7870. doi: 10.1073/pnas.97.14.7865. [DOI] [PMC free article] [PubMed] [Google Scholar]
- 25.Tyson J-J, Chen K-C, Novak B. Network dynamics and cell physiology. Nat Rev Mol Cell Bio. 2001;2:908–916. doi: 10.1038/35103078. [DOI] [PubMed] [Google Scholar]
Associated Data
This section collects any data citations, data availability statements, or supplementary materials included in this article.


