The authors describe the cytoplasmic calcium responses at the onset of hydrostatic pressure increases that lead to ERK1/2, p90RSK, and NHE1 phosphorylation.
Abstract
Purpose.
Elevated intraocular pressure is associated with glaucomatous optic nerve damage. Other investigators have shown functional changes in optic nerve head astrocytes subjected to elevated hydrostatic pressure (HP) for 1 to 5 days. Recently, the authors reported ERK1/2, p90RSK and NHE1 phosphorylation after 2 hours. Here they examine calcium responses at the onset of HP to determine what precedes ERK1/2 phosphorylation.
Methods.
Cytoplasmic calcium concentration ([Ca2+]i) was measured in cultured rat optic nerve astrocytes loaded with fura-2. The cells were placed in a closed imaging chamber and subjected to an HP increase of 15 mm Hg. Protein phosphorylation was detected by Western blot analysis.
Results.
The increase of HP caused an immediate slow increase in [Ca2+]i. The response persisted in calcium-free solution and when nickel chloride (4 mM) was added to suppress channel-mediated calcium entry. Previous depletion of the ER calcium stores by cyclopiazonic acid abolished the HP-induced calcium level increase. The HP-induced increase persisted in cells exposed to xestospongin C, an inhibitor of IP3R-mediated calcium release. In contrast, ryanodine receptor (RyR) antagonist ruthenium red (10 μM) or dantrolene (25 μM) inhibited the HP-induced calcium increase. The HP-induced calcium increase was abolished when ryanodine-sensitive calcium stores were pre-depleted with caffeine (3 mM). HP caused ERK1/2 phosphorylation. The magnitude of the ERK1/2 phosphorylation response was reduced by ruthenium red and dantrolene.
Conclusions.
Increasing HP causes calcium release from a ryanodine-sensitive cytoplasmic store and subsequent ERK1/2 activation. Calcium store release appears to be a required early step in the initial astrocyte response to an HP increase.
In the normal eye the aqueous humor (AH) inflow from the ciliary epithelium and its exit through the outflow pathways, mainly through a sieve-like tissue at the corneoscleral junction (the trabecular meshwork), is balanced to create a physiological intraocular pressure (IOP) of ∼15 mm Hg. This normal hydrostatic pressure is essential to maintain the spherical shape of the globe and the refractive surface of the cornea, a requirement for good vision. Increased IOP as a result of abnormally high resistance to AH outflow, gives rise to a condition called primary open angle glaucoma,1,2 the second leading cause of blindness.3 IOP can more than double, and disease progression is marked by gradual deformation of the optic nerve head, where retinal ganglion cell axons exit the eye. Optic nerve head remodeling and deformation associated with increased intraocular pressure are thought to be the probable cause of retinal ganglion cell death and consequent vision loss. Elevated IOP and progressive visual field loss in primary open angle glaucoma appear linked.4–6
Retinal ganglion cell axons in the optic nerve head have a complex relationship with glial cells and the extracellular matrix (ECM). Astrocytes play a key role in the optic nerve head, and ganglion cells are dependent on them for structural support, metabolic support, and regulation of extracellular ion composition and pH.7 Astrocytes synthesize ECM, and it has been reported that abnormal astrocyte function and consequent changes in the extracellular matrix composition contribute to remodeling of the optic nerve head in glaucoma.8–15 Interestingly, it has been found that cultured astrocytes subjected for 24 to 48 hours to a 10- to 20-mm Hg increase in hydrostatic pressure applied in vitro respond by increased expression of MMPs and TIMPs16 and an altered pattern of ECM expression.17 Expression of small heat shock proteins Hsp27 and αB-crystallin18 and several other genes also is changed in cells subjected to hydrostatic pressure.19,20 Recently this laboratory examined earlier responses that occur in optic nerve astrocytes subjected to elevated hydrostatic pressure. After 2 hours, a pressure challenge of 15 mm Hg was found to activate ERK. Subsequently, ERK activation led to the phosphorylation of p90RSK and stimulation of the NHE-1 sodium-hydrogen exchanger.21 Here, we examined astrocytes at the onset of a hydrostatic pressure increase and discovered an important role for calcium. There have been previous reports that an increase of cytoplasmic calcium occurs in bovine articular chondrocytes subjected to elevated hydrostatic pressure.22,23 In one of these studies, the increase in cytoplasmic calcium appeared to be the result of calcium entry from extracellular space since it was abolished in calcium-free solution and inhibited by gadolinium.22,23 In the other study, the increase in intracellular calcium was attributed to release from an IP3-sensitive intracellular calcium store.22,23 We devised a method to measure cytoplasmic calcium in rat optic nerve astrocytes while the cells are subjected to hydrostatic pressure. A pressure challenge of 15 mm Hg caused an immediate increase of cytoplasmic calcium concentration that appeared to originate from a ryanodine-sensitive cytoplasmic store.
Materials and Methods
Reagents
Dulbecco's modified Eagle's medium (DMEM)/F12, fura-2 AM, and calcium calibration buffer kit were purchased from Invitrogen (Carlsbad, CA). All other chemicals were purchased from Sigma (St. Louis, MO). Polyclonal rabbit anti-glial fibrillary acidic protein (GFAP) was obtained from Dako Cytomation (Carpinteria, CA). Protease inhibition tablets were purchased from Roche Diagnostics (Complete Mini Protease Inhibitor Cocktail; Indianapolis, IN). p44/42 (ERK1/2) mitogen-activated protein kinase (MAPK) rabbit monoclonal antibody and phospho-p44/42 (ERK1/2) MAPK (Thr202/Tyr204) mouse monoclonal antibody were obtained from Cell Signaling Technology (Danvers, MA). Alexa Fluor 680–conjugated goat anti-mouse secondary antibody was purchased from Invitrogen. Goat anti-rabbit conjugated secondary antibody was obtained from Rockland (IRDye 800; Gilbertsville, PA).
Cell Culture
Astrocytes were isolated and cultured according to a modification of a previous method.21,24 Eyes from 1- to 5-day-old Sprague-Dawley rat pups of both sexes were obtained from Hilltop Laboratories (Scottsdale, PA). The pups were killed by the supplier using CO2 in accordance with the American Veterinary Medical Association's guidelines for animal welfare assurance, as confirmed by the supplier. We used 400 eyes for this study. The eyes were washed in DMEM/F12 containing penicillin (100 U/mL) and streptomycin (0.1 mg/mL). Optic nerves were dissected, transferred to 35-mm culture dishes, and maintained at 37°C in a humidified atmosphere of 95% air 5% CO2 in DMEM/F12 medium containing fetal bovine serum (10%), penicillin (100 U/mL), streptomycin (0.1 mg/mL), and epidermal growth factor (EGF; 5 ng/mL). The medium was changed on alternate days. After 7 to 8 days, when enough cells had grown onto the petri dish, the remnant of the optic nerve was removed, and the cells were stained for GFAP expression to confirm astrocyte identity. More than 95% of the cultured cells showed GFAP expression. Thus, the purity was >95%. Cells were trypsinized and passaged for propagation. Confluence was attained in approximately 2 weeks. Third- to fifth-passage cells were used in this study.
Hydrostatic Pressure
Cells were grown to 70% to 80% confluence on 60-mm dishes for Western blot analysis. Pressure was applied by placing the culture dish at the bottom of a glass column filled with 500 mL DMEM/F12 complete medium saturated, by bubbling, with 95% air 5% CO2 for 30 minutes. The column was then maintained at 37°C in a humidified atmosphere of 95% air/5% CO2 and bubbled with 95% air/5% CO2 to maintain a dissolved gas concentration identical throughout the column. The height of the fluid column was 20 cm; thus, pressure at the base of the column was 15 mm Hg. Control cells were kept at ambient pressure. As a control for the change in volume of the culture medium, some cells were transferred to a horizontal tray containing 500 mL DMEM/F12, but the height of fluid was 1.25 cm, approximately the same as in a normal culture dish. Test agents were dissolved either in dimethylsulfoxide (0.06% final concentration) or in water according to solubility. Control cells received only the vehicle.
Real-Time Measurement of Cytoplasmic Calcium under Hydrostatic Pressure
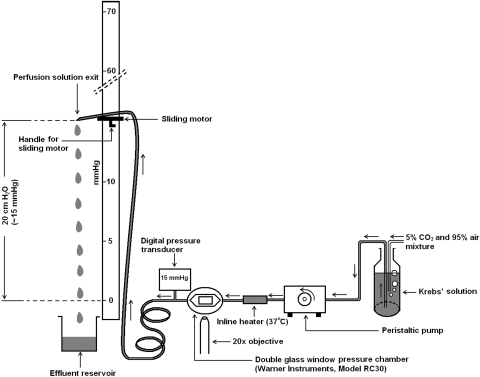
Cytoplasmic calcium was recorded in cells loaded with fura-2 AM by measuring the fluorescence intensity at alternating excitation wavelengths of 340 nm and 380 nm using a method described previously.25 Cells grown on rectangular glass coverslips (22 × 40 mm, thickness #1.5) were loaded for 20 minutes with 5 μM fura-2 AM in Krebs solution: NaCl, 119 mM; KCl, 4.7 mM; KH2PO4, 1.2 mM; NaHCO3, 25 mM; dextrose, 5.5 mM; MgCl2, 1 mM; CaCl2, 2.5 mM; pH adjusted to 7.4; osmolarity, ∼300 mOsm. After five washes, the coverslip with fura-2 AM–loaded cells was mounted airtight, using silicone grease, as the bottom window of an imaging chamber (RC30; Warner instruments, Hamden, CT), which has a shallow rectangular groove to receive the coverslip. The top window of the chamber is formed by a different 22 × 30 coverslip positioned at the center of an annular plastic coverslip plate. The coverslip plate has outlets for the entry and exit of Krebs solution. A circular silicone rubber gasket with a hexagonal opening at the center, called the chamber-forming gasket, was placed on the plate surrounding the coverslip. The assembly was then inverted and positioned over the bottom window. The chamber thus formed between the bottom and the top window was sealed by tightening an annular metal pressure plate using a wrench. The chamber volume was 0.5 mL. The inlet of the chamber was connected to the exit end of an inline heater (SH-27B; Warner Instruments). The inline heater (set at 37°C) was then connected, by thick-walled silicone tubing through a peristaltic pump (520S; Watson Marlow, Wilmington, MA), to the reservoir of Krebs solution. The Krebs solution was continuously bubbled with 95% air/5% CO2. The outlet of the chamber was connected, immediately after the exit point, to a digital pressure transducer (item #724496; Harvard Apparatus, Holliston, MA) using a T-piece. The outlet was connected to a length of flexible, but pressure-resistant, outflow tubing, the exit end of which was attached to a sliding motor. The sliding motor permitted adjustment of the height of the solution exit end of the outlet tube so as to obtain a particular hydrostatic pressure. The hydrostatic pressure was continuously monitored by the transducer. A schematic diagram of the instrumentation is shown (Fig. 1).
Figure 1.
Schematic diagram of the hydrostatic pressure application system.
Cells were superfused for 5 minutes at atmospheric pressure with control Krebs solution to obtain a stable baseline measurement. The flow rate was adjusted to 1 mL/min. Hydrostatic pressure was then applied to the cells by raising the height of the exit end of the outflow tube. The pressure inside the chamber was monitored continuously using the attached digital pressure transducer. Cells were exposed to drugs by switching the feeding reservoir to one with a fixed concentration of the intended drug.
The ratio of fluorescence intensity was determined at alternating excitation wavelengths of 340 nm and 380 nm using an established method.25 Experimental fluorescence ratios were converted to free calcium concentration by system-integrated software by plotting the respective data on the calibration curve. The calibration curve was obtained frequently using a fura-2 calcium calibration kit supplied by Invitrogen (catalog no. C-3008MP) according to the manufacturer's recommended protocol. In brief, fluorescence ratios (340 nm/380 nm) were derived using a set of standards containing 0-, 38-, 100-, 225-, 351-, 602-, and 1350-nM concentrations of free calcium. A calibration curve was constructed by plotting the fura-2 fluorescence ratios (F340 nm/F380 nm) against the free calcium concentrations. In each experiment, data from 15 to 30 individual cells on the coverslip were averaged and considered as n = 1.
Western Blot Analysis
Cells were lysed in radioimmunoprecipitation assay (RIPA) buffer containing 50 mM HEPES, 150 mM NaCl, 1.0 mM EDTA, 10 mM sodium pyrophosphate, 2.0 mM sodium orthovanadate, 10 mM sodium fluoride, 10% glycerol, 1.0% Triton X-100, 1.0% sodium deoxycholate, protease inhibitor cocktail tablets (Complete Mini; 3 tablets/20 mL; Roche Diagnostics, Indianapolis, IN), 1% phosphatase inhibitor cocktails 1 and 2 (Sigma), and 1 mM phenylmethylsulfonyl fluoride. The cell lysate was centrifuged at 14,000g for 30 minutes, the supernatant was added to Laemmli buffer, and the proteins were separated by electrophoresis on a 10% SDS-polyacrylamide mini-gel. Proteins were then transferred by electrophoresis to nitrocellulose membrane, and the membrane was blocked overnight with blocking buffer (Odyssey; LI-COR Biosciences, Lincoln, NE) at 4°C. The membranes were incubated overnight at 4°C with anti p44/42 (ERK1/2) MAP kinase rabbit monoclonal (1:1000) and anti-phospho-p44/42 (ERK1/2) MAPK (Thr202/Tyr204) mouse monoclonal (1:1000) antibodies. All antibodies were diluted in the blocking buffer (LI-COR; Odyssey). After three washes in TTBS (30 mM Tris, 150 mM NaCl, 0.5% [vol/vol] Tween-20 at pH 7.4), each membrane was incubated for 1 hour with an appropriate secondary antibody (IRDye 680–conjugated goat anti-mouse secondary antibody; 1:40000; Alexa-Fluor; [Invitrogen, Carlsbad, CA] or IRDye 800–conjugated goat anti-rabbit secondary antibody [Rockland, Gilbertsville, PA]). Protein bands were visualized by infrared laser scan detection (LI-COR; Odyssey). Protein concentration was measured with a BCA protein assay kit (Pierce, Rockford, IL) based on a published method26 using bovine serum albumin as the standard.
Statistical Analysis
One-way analysis of variance was used to compare multiple groups of data, and Student's t-test was used to compare two groups of data. P < 0.05 was considered significant. Results were shown as mean ± SEM.
Results
Effect of Hydrostatic Pressure on Cytoplasmic Calcium Concentration
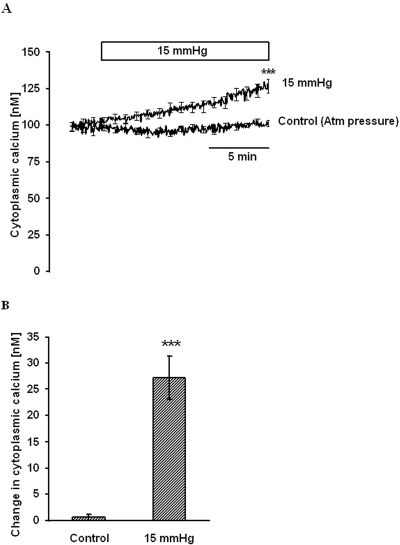
Cytoplasmic calcium concentration ([Ca2+]i) was measured at normal atmospheric pressure for 5 minutes to obtain a stable baseline. The steady baseline [Ca2+]i under this condition was 100.6 ± 2.1 nM (n = 10). Application of 15 mm Hg hydrostatic pressure, above the normal atmospheric pressure, caused a slow and steady increase in [Ca2+]i. After 15 minutes, the [Ca2+]i was 27.2 ± 4.1 nM (n = 6) above the baseline (Fig. 2). In control cells, in which [Ca2+]i was measured at atmospheric pressure, [Ca2+]i after 15 minutes was not significantly different from the starting baseline value (Fig. 2).
Figure 2.
[Ca2+]i change on elevation of hydrostatic pressure. Cells were grown on a coverslip at normal pressure, loaded with fura-2 AM in Krebs solution, and placed in an imaging chamber. After establishing stable baseline [Ca2+]i, pressure in the chamber was raised to 15 mm Hg, and [Ca2+]i was monitored continuously for 15 minutes. Control cells remained at atmospheric pressure. (A) Record of [Ca2+]i concentration measured over time. (B) Changes in [Ca2+]i concentration measured 15 minutes after the onset of the pressure increase. Results are mean ± SEM of 4 to 6 independent experiments. [Ca2+]i was measured every 10 seconds, but for clarity the SEM values are only shown at 1-minute intervals in (A). ***P < 0.001; significant difference between [Ca2+]i in control and pressure-treated cells measured 15 minutes after the onset of the pressure increase.
Effect of Calcium-Free Solution and NiCl2
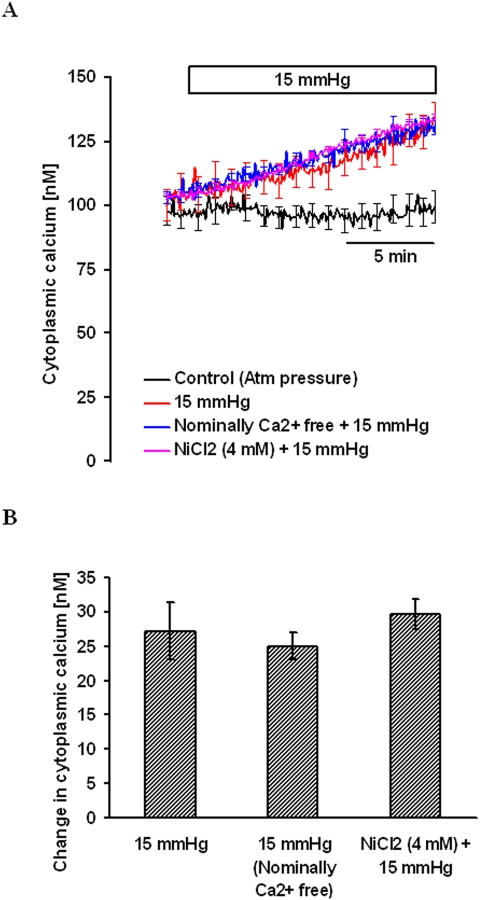
To examine the mechanism responsible for the hydrostatic pressure-dependent increase in [Ca2+]i, some experiments were performed with nominally calcium-free Krebs solution. [Ca2+]i, was measured in calcium-free Krebs solution for 5 minutes to obtain a stable baseline. Then 15 mm Hg hydrostatic pressure was applied, and measurement of [Ca2+]i continued for another 15 minutes. The hydrostatic pressure-dependent increase in [Ca2+]i under calcium-free conditions was 25.0 ± 1.9 nM (n = 4), which was not significantly different from the increase observed in the presence of 2.5 mM external calcium (Fig. 3). In some cells, [Ca2+]i was measured in the presence of 2.5 mM external calcium and 4 mM nickel chloride. Nickel chloride is a nonselective calcium channel antagonist that suppresses calcium entry into most cells. After establishing a stable baseline for [Ca2+]i in the presence of NiCl2, 15 mm Hg hydrostatic pressure was applied and [Ca2+]i was measured for another 15 minutes. NiCl2 did not alter the magnitude of the [Ca2+]i increase (Fig. 3). Results of the experiments suggested that increased hydrostatic pressure-induced [Ca2+]i does not require the entry of external calcium.
Figure 3.
The magnitude of the hydrostatic pressure-induced [Ca2+]i increase in cells bathed either in nominally calcium-free medium or in the presence of 4 mM nickel chloride in calcium-containing medium. (A) Record of [Ca2+]i concentration measured over time. (B) Changes in [Ca2+]i concentration measured 15 minutes after the onset of the pressure increase. Results are mean ± SEM of 4 to 6 independent experiments. [Ca2+]i was measured every 10 seconds, but for clarity the SEM values are only shown at 1-minute intervals in (A).
Manipulation of Calcium Stores
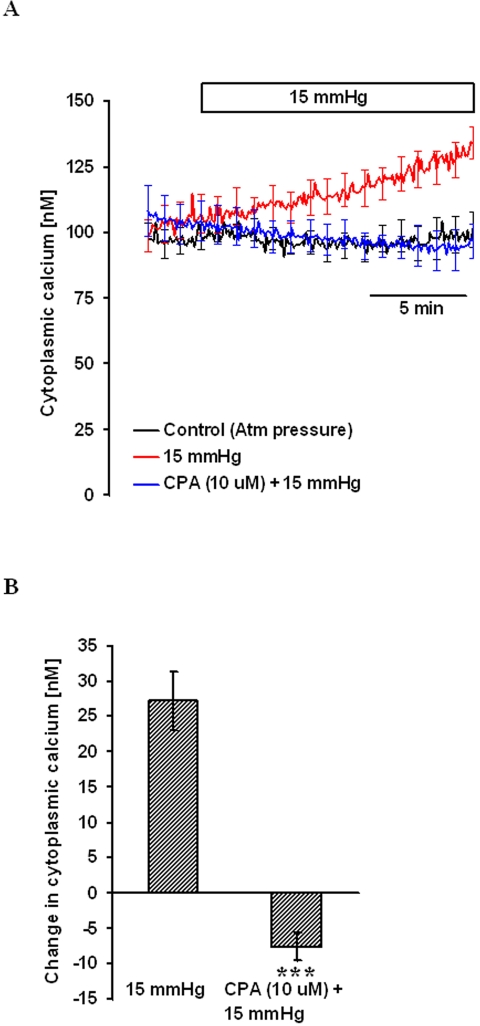
Cells were treated with 10 μM cyclopiazonic acid (CPA), a specific inhibitor of the sarcoendoplasmic reticulum Ca2+ pump, for 15 minutes to empty the endoplasmic reticulum (ER) calcium stores. Cytoplasmic calcium concentration was then measured in nominally calcium-free solution in the continued presence of CPA. After 5 minutes of baseline measurement, 15 mm Hg hydrostatic pressure was applied and [Ca2+]i measured for another 15 minutes. Under this condition, the hydrostatic pressure-induced [Ca2+]i increase was abolished (Fig. 4).
Figure 4.
The effect of hydrostatic pressure on [Ca2+]i in cells pretreated with 10 μM CPA for 15 minutes in nominally calcium-free solution. After establishing baseline [Ca2+]i, pressure was increased to 15 mm Hg, and [Ca2+]i was monitored continuously for 15 minutes. Control cells were kept at atmospheric pressure. (A) Record of [Ca2+]i concentration measured over time. (B) Changes in [Ca2+]i concentration measured 15 minutes after the onset of the pressure increase. Results are mean ± SEM of 3 to 5 independent experiments. [Ca2+]i was measured every 10 seconds, but for clarity the SEM values are only shown at 1-minute intervals in (A). ***P < 0.001; significant difference compared with pressure-treated cells.
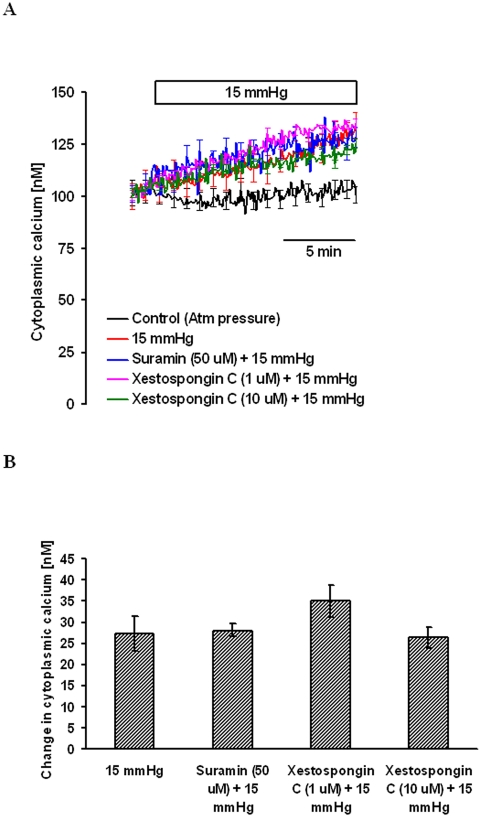
To examine the possible contribution of an IP3-sensitive ER calcium pool to the hydrostatic pressure-induced increase in [Ca2+]i, experiments were conducted on cells treated with xestospongin C, an IP3 receptor antagonist.27 Cells were preincubated with xestospongin C (1.0 μM or 10 μM) in nominally calcium-free solution for 15 minutes, and the baseline [Ca2+]i was established. Then 15 mm Hg hydrostatic pressure was applied, and [Ca2+]i measurement continued for another 15 minutes. Xestospongin C at 1 or 10 μM concentration produced no detectable effect on the hydrostatic pressure-induced [Ca2+]i increase (Fig. 5).
Figure 5.
Magnitude of the hydrostatic pressure-induced [Ca2+]i change in cells treated with suramin or xestospongin C. Cells were pretreated with suramin or xestospongin C for 15 minutes in nominally calcium-free solution. After establishing baseline [Ca2+]i, pressure was increased to 15 mm Hg, and [Ca2+]i was monitored continuously for 15 minutes. Control cells were kept at atmospheric pressure. (A) Record of [Ca2+]i concentration measured over time. (B) Changes in [Ca2+]i concentration measured 15 minutes after the onset of the pressure increase. Results are mean ± SEM of 3 to 8 independent experiments. [Ca2+]i was measured every 10 seconds, but for clarity the SEM values are only shown at 1-minute intervals in (A).
Astrocytes are known to respond to stress by adenosine triphosphate (ATP) release and autostimulation of purinergic receptors. To inhibit purinergic receptor–mediated calcium release, experiments were conducted with suramin. Cells were incubated with 50 μM suramin for 15 minutes in nominally calcium-free solution. After 5 minutes of baseline measurement, 15 mm Hg hydrostatic pressure was applied, and [Ca2+]i was measured for another 15 minutes. Suramin at 50 μM concentration produced no detectable effect on the hydrostatic pressure-induced [Ca2+]i increase (Fig. 5).
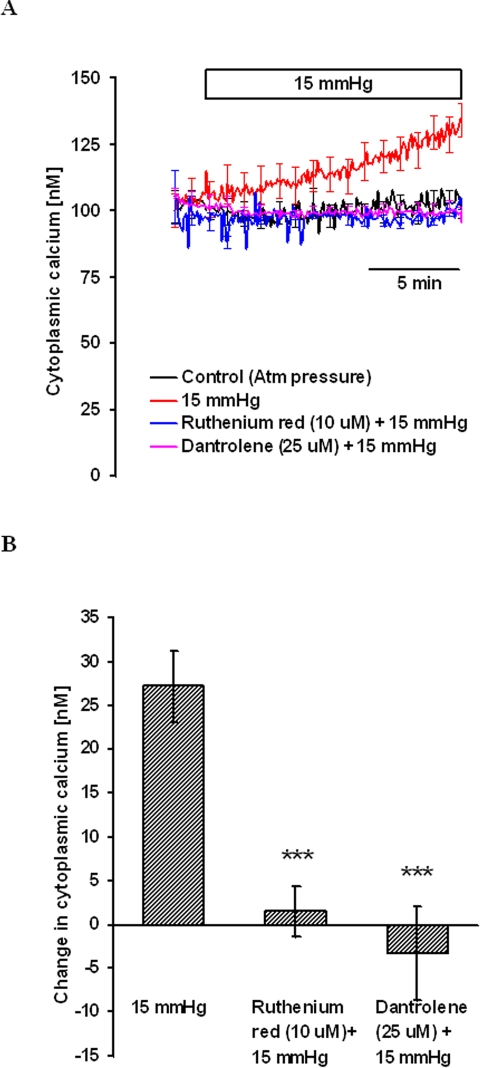
To examine the possible contribution of calcium release from ryanodine-sensitive stores, cells were treated with 10 μM ruthenium red for 15 minutes. Ruthenium red competitively binds to ryanodine receptor channels to inhibit calcium release.28,29 After obtaining a stable baseline [Ca2+]i, 15 mm Hg hydrostatic pressure was applied, and [Ca2+]i was measured for 15 minutes. Ruthenium red completely blocked the pressure-dependent increase in [Ca2+]i (Fig. 6). In the same manner some experiments were carried out with dantrolene, a specific inhibitor of ryanodine receptor-mediated calcium release.30 In the presence of 25 μM dantrolene, the pressure-dependent increase in [Ca2+]i was abolished (Fig. 6).
Figure 6.
Magnitude of the hydrostatic pressure-induced [Ca2+]i change in cells treated with ruthenium red or dantrolene. Cells were pretreated with ruthenium red or dantrolene for 15 minutes, and then [Ca2+]i was measured in calcium-containing medium. After establishing baseline [Ca2+]i, pressure was increased to 15 mm Hg, and [Ca2+]i was monitored continuously for 15 minutes. Control cells were kept at atmospheric pressure. (A) Record of [Ca2+]i concentration measured over time. (B) Changes in [Ca2+]i concentration measured 15 minutes after the onset of the pressure increase. Results are mean ± SEM of 3 to 10 independent experiments. [Ca2+]i was measured every 10 seconds, but for clarity the SEM values are only shown at 1-minute intervals in (A). ***P < 0.001; significant difference compared with pressure-treated cells.
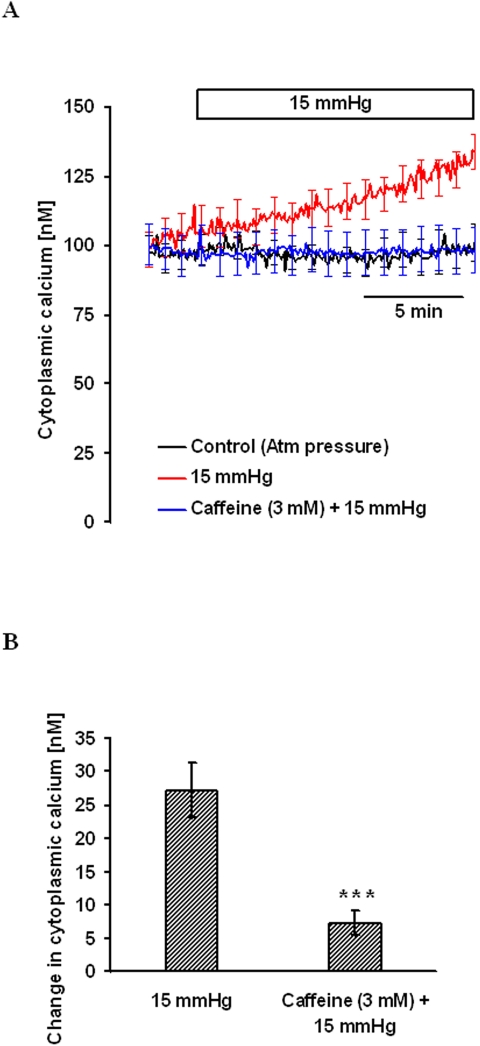
These experiments point to the involvement of a ryanodine-sensitive calcium pool to pressure-dependent calcium release. To deplete this calcium pool before applying hydrostatic pressure, cells were exposed for 15 minutes to the ryanodine receptor-sensitive calcium release agonist, caffeine (3 mM). After baseline [Ca2+]i measurement, 15 mm Hg hydrostatic pressure was applied, and [Ca2+]i was measured for another 15 minutes. Caffeine pretreatment abolished the pressure-induced [Ca2+]i increase (Fig. 7), consistent with the involvement of ryanodine receptor–mediated calcium release.
Figure 7.
Effect of hydrostatic pressure on [Ca2+]i in cells pretreated with 3 mM caffeine for 15 minutes in nominally calcium-free solution. After establishing stable baseline [Ca2+]i, pressure was increased to 15 mm Hg, and [Ca2+]i was monitored continuously for 15 minutes. Control cells were kept at atmospheric pressure. (A) Record of [Ca2+]i concentration measured over time. (B) Changes in [Ca2+]i concentration measured 15 minutes after the onset of the pressure increase. Results are mean ± SEM of 3 to 5 independent experiments. [Ca2+]i was measured every 10 seconds, but for clarity the SEM values are only shown at 1-minute intervals in (A). ***P < 0.001; significant difference compared with pressure-treated cells.
Effect of Ruthenium Red and Dantrolene on ERK Phosphorylation
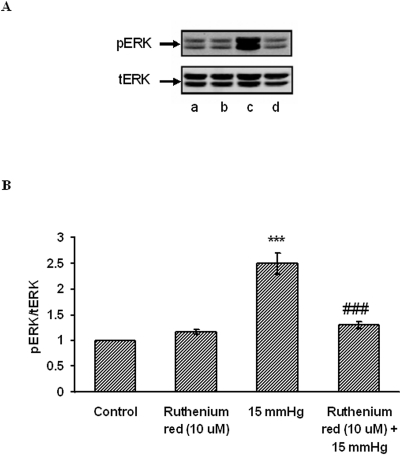
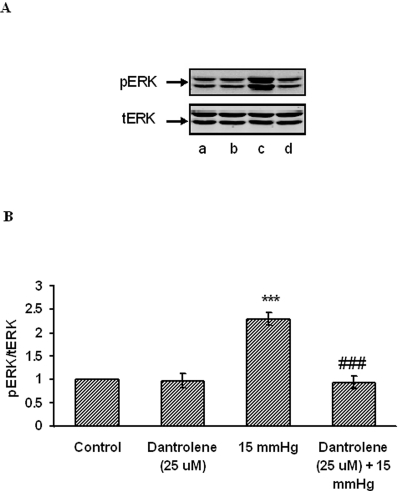
Western blot analysis of ERK1/2 phosphorylation was conducted on lysate obtained from cells subjected to 15 mm Hg hydrostatic pressure for 2 hours. Consistent with our earlier studies, ERK1/2 phosphorylation increased significantly (Fig. 8). Some cells were exposed to ruthenium red (10 μM)), added before challenge with hydrostatic pressure. Ruthenium red significantly reduced the increase in band density of phosphorylated ERK1/2 in cells subjected to 15 mm Hg. Dantrolene (25 μM) similarly suppressed the increase in phosphorylated ERK1/2 band density in cells subjected to 15 mm Hg (Fig. 9). Added alone, neither ruthenium red nor dantrolene caused any significant change in band density.
Figure 8.
Effect of hydrostatic pressure and ruthenium red on ERK phosphorylation. Cells were subjected to 15 mm Hg hydrostatic pressure for 2 hours, then lysed and analyzed by Western blot. Some cells were exposed to 10 μM ruthenium red added for the duration of the experiment. Control cells received neither pressure nor ruthenium red. (A) Representative blot. Lane a, control; lane b, ruthenium red; lane c, 15 mm Hg; lane d, ruthenium red + 15 mm Hg. (B) Pooled data on band density obtained from three independent experiments. ***P < 0.001; significant difference from control. ###P<0.001; significant difference from 15 mm Hg pressure.
Figure 9.
Effect of hydrostatic pressure and dantrolene on ERK phosphorylation. Cells were subjected to 15 mm Hg hydrostatic pressure for 2 hours, then lysed and analyzed by Western blot. Some cells were exposed to 25 μM dantrolene added for the duration of the experiment. Control cells received neither pressure nor dantrolene. (A) Representative blot. Lane a, control; lane b, dantrolene; lane c, 15 mm Hg; lane d, dantrolene + 15 mm Hg. (B) Pooled data on band density obtained from three independent experiments. ***P < 0.001; significant difference from control. ###P < 0.001; significant difference from 15 mm Hg pressure.
Discussion
A modest increase in hydrostatic pressure was found to cause an immediate slow increase in [Ca2+]i in cultured rat optic nerve head astrocytes. The results are consistent with release of calcium from a ryanodine-sensitive store. Importantly, the hydrostatic pressure-induced increase in [Ca2+]i appeared necessary for the ERK1/2 phosphorylation that occurs in astrocytes subjected to elevated hydrostatic pressure.
In the presence of ruthenium red, hydrostatic pressure failed to elicit either an increase in [Ca2+]i or ERK phosphorylation. The same was true for the specific ryanodine receptor antagonist dantrolene. Earlier we published findings showing that challenge with 15 mm Hg hydrostatic pressure for 2 hours caused ERK1/2 activation and subsequent p90RSK and NHE1 phosphorylation in cultured astrocytes.21 The present finding bridges the gap between hydrostatic pressure and ERK activation. The pressure-induced increase in [Ca2+]i precedes ERK phosphorylation. Calcium-dependent ERK activation has been observed previously in astrocytes in response to perturbations such as mechanical deformation31 or osmotic swelling.32,33
A pressure increase of 15 mm Hg is the same order of magnitude as the 1- to 5-day hydrostatic pressure challenges (7.5–15 mm Hg) reported previously to increase elastin secretion in cultured human optic nerve astrocytes.17 Hydrostatic pressure at 60 mm Hg applied for 6, 24, and 48 hours has been shown to influence the expression and distribution of small heat shock proteins Hsp27 and αB-crystallin18 and changes of gene expression34 in human optic nerve head astrocytes. A hydrostatic pressure increase of 20 cm H2O (∼15 mm Hg) for 7 hours in serum-free DMEM resulted in time-dependent decreases in MMP-1, MMP-2, and MMP-9 activity (15%, 37%, and 25%) compared with controls maintained at atmospheric pressure in human urinary bladder smooth muscle cells.35 To the best of our knowledge, [Ca2+]i responses to the application of hydrostatic pressure challenge of this magnitude have not been reported before. However, increased [Ca2+]i was observed in response to a much higher hydrostatic pressure challenge of 0.5 MPa (3750 mm Hg) in bovine articular chondrocytes.23 In a separate study, a wide range of pressure challenge between 0.1 MPa and 30 MPa (750 and 225,000 mm Hg) also increased [Ca2+]i in bovine articular chondrocytes.22 In one study,23 the increase in [Ca2+]i appeared to be the result of calcium entry from the extracellular space and of calcium-induced calcium release from cytoplasmic stores since it was abolished by calcium-free solution, inhibited by the stretch-activated calcium channel blocker gadolinium, and inhibited by the ryanodine-sensitive calcium release (calcium-induced calcium release) blocker dantrolene. In the other study,22 the increase in [Ca2+]i was shown to be caused by release from the IP3-sensitive pool.
We considered whether the observed [Ca2+]i response was the consequence of pressure-dependent distortion of the coverslips. This is particularly relevant because calcium-dependent ERK activation has been observed previously in astrocytes after having occurred in response to perturbations such as mechanical deformation31 and osmotic swelling.32,33 Coverslip deformation may have a mechanical effect on the attached cells or may move the cells out of focus, introducing an artifact in the epifluorescence measurement. To minimize coverslip deformation, experiments were conducted using thick glass (thickness #1.5). Moreover, the 15 mm Hg challenge used throughout the study was modest. We can rule out an optical effect caused by coverslip deformation because the pressure-induced [Ca2+]i increase was prevented by an RyR antagonist. However, we have no direct way in which to rule out a mechanical effect on the cells caused by pressure-induced coverslip deformation. Nevertheless, an RyR antagonist prevented both the pressure-induced [Ca2+]i increase and ERK1/2 phosphorylation. This argues indirectly against a mechanical effect because ERK1/2 phosphorylation occurred in the absence of a bending force, when coverslips were submerged in 20 cm bathing solution and pressure was equal on both sides of the glass. In comparative experiments using thin (thickness #1) and thick (thickness #1.5) coverslips, there was no significant difference between the [Ca2+]i increase measured 15 minutes after the onset of the pressure increase (thin coverslip 23.34 ± 1.58 [n = 3] vs thick coverslip 25.40 ±1.22 [n = 3] nM above baseline) and between the rate of the [Ca2+]i increase (thin coverslip 1.56 ± 0.03 [n = 3] vs thick coverslip 1.69 ±0.08 [n = 3] nM/min) elicited by 15 mm Hg. Interestingly, the [Ca2+]i increase caused by the application of hydrostatic pressure did not return to baseline on the removal of pressure, at least not during the 10-minute observation period. We do not have an explanation for this because cells usually have effective calcium-removing mechanisms. The nonreversible calcium increase could perhaps be explained by the inherent property of the ryanodine receptor that interacts with Ca2+ and causes calcium-induced calcium release (CICR). Once the receptor is stimulated by hydrostatic pressure, subsequent slow CICR may continue for a considerable period. The failure of cytoplasmic calcium to return to baseline on the removal of pressure is one more argument against pressure-induced distortion of coverslips moving the cells out of focus.
In studies to examine the mechanism of the [Ca2+]i increase, our findings strongly suggest that the pressure-induced increase in [Ca2+]i was not caused by the entry of extracellular calcium because the magnitude of the increase in [Ca2+]i was undiminished in calcium-free solution or in the presence of nickel chloride. Nickel is a nonspecific blocker of calcium channels that blocks multiple routes of calcium entry. On the other hand, several lines of evidence point to the release of calcium from a ryanodine-sensitive ER calcium store, when astrocytes are subjected to an increase in hydrostatic pressure. First, the hydrostatic pressure-induced [Ca2+]i increase was prevented by previous emptying of the ER calcium store with CPA, an agent that depletes calcium stores as the result of selective inhibition of Ca-ATPase-mediated calcium accumulation by the endoplasmic reticulum. Second, the [Ca2+]i increase caused by pressure did not occur when cells were treated with caffeine before they were subjected to 15 mm Hg hydrostatic pressure. Caffeine, which is known to cause the release of ryanodine-sensitive calcium stores in other tissues, likely caused the release of stored calcium before the onset of the hydrostatic pressure challenge. Third, dantrolene, a selective inhibitor of ryanodine-sensitive calcium release, prevented the pressure-induced increase in [Ca2+]i, as did ruthenium red. It is known that ruthenium red has several effects on cell calcium, but its reported ability to inhibit CICR through competitive binding to ryanodine receptor has been shown in diverse tissues, including microglia,36 skeletal muscle,28,29 and smooth muscle cells.37,38
Many cell types have two or more functionally distinct ER calcium stores,39 usually distinguished by the second messenger, which induces the release of stored calcium. Astrocytes have been shown to have both IP3-sensitive40,41 and caffeine/ryanodine-sensitive41,42 ER calcium stores. It has been reported that in some cell types, IP3R and RyR interact functionally to coordinate the release of calcium or the propagation of calcium waves (or both) through a regenerative process in which the IP3-initiated release of calcium leads to the subsequent activation of RyR and the additional release of calcium.43,44 In astrocytes, the main source of calcium release from internal stores is reported to be mediated through the activation of IP3 receptors45,46; therefore, amplification of an increase in RyR-mediated [Ca2+]i may operate through this pathway. In other words, it could be argued that the hydrostatic pressure-induced calcium release in the present study could have been initiated by the release from IP3-sensitive stores, which subsequently acted to amplify calcium-induced calcium release through ryanodine receptors. However, this does not seem to be the case because the magnitude of pressure-induced calcium release was unaffected by xestospongin C, a membrane-permeable, potent, and specific inhibitor of IP3 receptor–mediated calcium release.27
Astrocytes use ATP as a signaling molecule to communicate among themselves and with neighboring neurons.47 Various stimuli have been shown to elicit ATP release from astrocytes, including mechanical stimulation,47,48 osmotic stress,49,50 ischemic stress mimicked by oxygen-glucose deprivation,51 and receptor agonists such as UTP,52 norepinephrine,53 and glutamate.54,55 A relatively small hydrostatic pressure challenge of 3.5 cm H2O (2.5 mm Hg) has been reported to release ATP in urinary bladder epithelium,56 whereas a higher pressure challenge of 700 cm H2O (50 mm Hg) caused ATP release by guinea pig ureter epithelium.57 Hydrostatic pressure of 20 mm Hg applied to the retina in an eyecup preparation has been shown to increase ATP concentration by threefold in the vitreous.58 However, in the whole retina study, it was not possible to pinpoint the source of ATP to a particular cell type because ATP can be released from retinal ganglion cells,59 Müller cells,60,61 microglia,62 and retinal pigment epithelium.63 Thus, although there is evidence that astrocytes release ATP under many different conditions, leading to purinergic P2 receptor-mediated calcium signaling in the same or neighboring cell,64 there was no evidence for such an underlying mechanism in the observed pressure-evoked calcium increase. Suramin, a broad-spectrum purinergic receptor antagonist, failed to diminish the pressure-induced calcium increase. However, effective concentrations of suramin are higher for some P2 receptors, particularly the rodent P2 × P7 receptor, in which an inhibitory effect of suramin less than 300 μM is uncommon.65,66 Here, we targeted ATP-mediated calcium release. Such calcium mobilization is usually mediated by the activation of P2Y receptors.67 Suramin is a potent antagonist at the P2Y receptor.68
In summary our results show that astrocytes are able to respond to increases in hydrostatic pressure by releasing stored calcium from a ryanodine-sensitive ER calcium pool. Calcium released from a ryanodine-sensitive pool appears to be required for the phosphorylation of ERK. Phosphorylated ERK, in turn, causes the subsequent phosphorylation and activation of p90RSK and NHE1, as we have shown earlier.21 Astrocytes are not alone in displaying such ERK responses. Chondrocytes also display ERK activation when subjected to elevated hydrostatic pressure, though the magnitude of required pressure challenge is much higher. Although our findings point to a role for calcium stores, further studies will be needed before we are able to understand the mechanistic nature of the process that triggers calcium release when hydrostatic pressure increases or its possible contribution to the development of glaucomatous optic nerve head damage. Anatomic differences between the lamina cribrosa of primates and of rodents may also influence astrocytic contribution to the disease process.
Acknowledgments
The authors thank Ryan Pelis for helpful discussions and suggestions during the experimental stage of this project and Patricia B. Hoyer (Department of Physiology, University of Arizona) for her cooperation throughout the study.
Footnotes
Supported by National Institutes of Health Grant EY014069.
Disclosure: A. Mandal, None; M. Shahidullah, None; N.A. Delamere, None
References
- 1.Distelhorst JS. Open-angle glaucoma. Am Fam Physician 2003;67:1937–1944 [PubMed] [Google Scholar]
- 2.Kwon YH, Fingert JH, Kuehn MH, Alward WLM. Primary open-angle glaucoma. N Engl J Med 2009;360:1113–1124 [DOI] [PMC free article] [PubMed] [Google Scholar]
- 3.Quigley HA. Number of people with glaucoma worldwide [see comment]. Br J Ophthalmol 1996;80:389–393 [DOI] [PMC free article] [PubMed] [Google Scholar]
- 4.Inatani M, Iwao K, Inoue T, et al. Long-term relationship between intraocular pressure and visual field loss in primary open-angle glaucoma. J Glaucoma 2008;17:275–279 [DOI] [PubMed] [Google Scholar]
- 5.Lichter PR, Musch DC, Gillespie BW, et al. Interim clinical outcomes in the Collaborative Initial Glaucoma Treatment Study comparing initial treatment randomized to medications or surgery [see comment]. Ophthalmology 2001;108:1943–1953 [DOI] [PubMed] [Google Scholar]
- 6.Nouri-Mahdavi K, Hoffman D, Coleman AL, et al. Predictive factors for glaucomatous visual field progression in the Advanced Glaucoma Intervention Study. Ophthalmology 2004;111:1627–1635 [DOI] [PubMed] [Google Scholar]
- 7.Butt AM, Pugh M, Hubbard P, James G. Functions of optic nerve glia: axoglial signalling in physiology and pathology. Eye 2004;18:1110–1121 [DOI] [PubMed] [Google Scholar]
- 8.Fukuchi T, Sawaguchi S, Hara H, Shirakashi M, Iwata K. Extracellular matrix changes of the optic nerve lamina cribrosa in monkey eyes with experimentally chronic glaucoma. Graefes Arch Clin Exp Ophthalmol 1992;230:421–427 [DOI] [PubMed] [Google Scholar]
- 9.Fukuchi T, Sawaguchi S, Yue BY, Iwata K, Hara H, Kaiya T. Sulfated proteoglycans in the lamina cribrosa of normal monkey eyes and monkey eyes with laser-induced glaucoma. Exp Eye Res 1994;58:231–243 [DOI] [PubMed] [Google Scholar]
- 10.Gong H, Ye W, Freddo TF, Hernandez MR. Hyaluronic acid in the normal and glaucomatous optic nerve. Exp Eye Res 1997;64:587–595 [DOI] [PubMed] [Google Scholar]
- 11.Hernandez MR. Ultrastructural immunocytochemical analysis of elastin in the human lamina cribrosa: changes in elastic fibers in primary open-angle glaucoma. Invest Ophthalmol Vis Sci 1992;33:2891–2903 [PubMed] [Google Scholar]
- 12.Hernandez MR, Ye H. Glaucoma: changes in extracellular matrix in the optic nerve head. Ann Med 1993;25:309–315 [DOI] [PubMed] [Google Scholar]
- 13.Morrison JC, Dorman-Pease ME, Dunkelberger GR, Quigley HA. Optic nerve head extracellular matrix in primary optic atrophy and experimental glaucoma. Arch Ophthalmol 1990;108:1020–1024 [DOI] [PubMed] [Google Scholar]
- 14.Pena JD, Netland PA, Vidal I, Dorr DA, Rasky A, Hernandez MR. Elastosis of the lamina cribrosa in glaucomatous optic neuropathy. Exp Eye Res 1998;67:517–524 [DOI] [PubMed] [Google Scholar]
- 15.Hernandez MR. The optic nerve head in glaucoma: role of astrocytes in tissue remodeling. Prog Retinal Eye Res 2000;19:297–321 [DOI] [PubMed] [Google Scholar]
- 16.Agapova OA, Ricard CS, Salvador-Silva M, Hernandez MR. Expression of matrix metalloproteinases and tissue inhibitors of metalloproteinases in human optic nerve head astrocytes. Glia 2001;33:205–216 [DOI] [PubMed] [Google Scholar]
- 17.Hernandez MR, Pena JD, Selvidge JA, Salvador-Silva M, Yang P. Hydrostatic pressure stimulates synthesis of elastin in cultured optic nerve head astrocytes. Glia 2000;32:122–136 [DOI] [PubMed] [Google Scholar]
- 18.Salvador-Silva M, Ricard CS, Agapova OA, Yang P, Hernandez MR. Expression of small heat shock proteins and intermediate filaments in the human optic nerve head astrocytes exposed to elevated hydrostatic pressure in vitro. J Neurosci Res 2001;66:59–73 [DOI] [PubMed] [Google Scholar]
- 19.Hashimoto K, Parker A, Malone P, et al. Long-term activation of c-Fos and c-Jun in optic nerve head astrocytes in experimental ocular hypertension in monkeys and after exposure to elevated pressure in vitro. Brain Res 2005;1054:103–115 [DOI] [PubMed] [Google Scholar]
- 20.Ricard CS, Kobayashi S, Pena JD, Salvador-Silva M, Agapova O, Hernandez MR. Selective expression of neural cell adhesion molecule (NCAM)-180 in optic nerve head astrocytes exposed to elevated hydrostatic pressure in vitro. Brain Res Mol Brain Res 2000;81:62–79 [DOI] [PubMed] [Google Scholar]
- 21.Mandal A, Shahidullah M, Delamere NA. Elevated hydrostatic pressure activates sodium/hydrogen exchanger-1 in rat optic nerve head astrocytes. Am J Physiol Cell Physiol 2009;297:C111–C120 [DOI] [PMC free article] [PubMed] [Google Scholar]
- 22.Browning JA, Saunders K, Urban JPG, Wilkins RJ. The influence and interactions of hydrostatic and osmotic pressures on the intracellular milieu of chondrocytes. Biorheology 2004;41:299–308 [PubMed] [Google Scholar]
- 23.Mizuno S. A novel method for assessing effects of hydrostatic fluid pressure on intracellular calcium: a study with bovine articular chondrocytes. Am J Physiol 2005;288:C329–C337 [DOI] [PubMed] [Google Scholar]
- 24.Hartford AK, Messer ML, Moseley AE, Lingrel JB, Delamere NA. Na, K-ATPase alpha2 inhibition alters calcium responses in optic nerve astrocytes. Glia 2004;45:229–237 [DOI] [PubMed] [Google Scholar]
- 25.Hou Y, Wu Q, Delamere NA. H+ATPase-mediated cytoplasmic pH-responses associated with elevation of cytoplasmic calcium in cultured rabbit nonpigmented ciliary epithelium. J Membr Biol 2001;V182:81–90 [DOI] [PubMed] [Google Scholar]
- 26.Smith PK, Krohn RI, Hermanson GT, et al. Measurement of protein using bicinchoninic acid. Anal Biochem 1985;150:76–85 [DOI] [PubMed] [Google Scholar]
- 27.Gafni J, Munsch JA, Lam TH, et al. Xestospongins: potent membrane permeable blockers of the inositol 1,4,5-trisphosphate receptor. Neuron 1997;19:723–733 [DOI] [PubMed] [Google Scholar]
- 28.Damiani E, Margreth A. Characterization study of the ryanodine receptor and of calsequestrin isoforms of mammalian skeletal muscles in relation to fibre types. J Muscle Res Cell Motil 1994;15:86–101 [DOI] [PubMed] [Google Scholar]
- 29.Imagawa T, Smith JS, Coronado R, Campbell KP. Purified ryanodine receptor from skeletal muscle sarcoplasmic reticulum is the Ca2+-permeable pore of the calcium release channel. J Biol Chem 1987;262:16636–16643 [PubMed] [Google Scholar]
- 30.Zhao F, Li P, Chen SRW, Louis CF, Fruen BR. Dantrolene inhibition of ryanodine receptor Ca2+ release channels: molecular mechanism and isoform selectivity. J Biol Chem 2001;276:13810–13816 [DOI] [PubMed] [Google Scholar]
- 31.Neary JT, Kang Y, Willoughby KA, Ellis EF. Activation of extracellular signal-regulated kinase by stretch-induced injury in astrocytes involves extracellular ATP and P2 purinergic receptors. J Neurosci 2003;23:2348–2356 [DOI] [PMC free article] [PubMed] [Google Scholar]
- 32.Schliess F, Sinning R, Fischer R, Schmalenbach C, Haussinger D. Calcium-dependent activation of Erk-1 and Erk-2 after hypo-osmotic astrocyte swelling. Biochem J 1996;320:167–171 [DOI] [PMC free article] [PubMed] [Google Scholar]
- 33.Sinning R, Schliess F, Kubitz R, Haussinger D. Osmosignalling in C6 glioma cells. FEBS Lett 1997;400:163–167 [DOI] [PubMed] [Google Scholar]
- 34.Yang P, Agapova O, Parker A, et al. DNA microarray analysis of gene expression in human optic nerve head astrocytes in response to hydrostatic pressure. Physiol Genomics 2004;17:157–169 [DOI] [PubMed] [Google Scholar]
- 35.Backhaus BO, Kaefer M, Haberstroh KM, et al. Alterations in the molecular determinants of bladder compliance at hydrostatic pressures less than 40 cm. H2O. J Urol 2002;168:2600–2604 [DOI] [PubMed] [Google Scholar]
- 36.Sappington RM, Calkins DJ. Contribution of TRPV1 to microglia-derived IL-6 and NFκB translocation with elevated hydrostatic pressure. Invest OphthalmolVis Sci 2008;49:3004–3017 [DOI] [PMC free article] [PubMed] [Google Scholar]
- 37.Lynn S, Gillespie JI. Basic properties of a novel ryanodine-sensitive, caffeine-insensitive calcium-induced calcium release mechanism in permeabilised human vascular smooth muscle cells. FEBS Lett 1995;367:23–27 [DOI] [PubMed] [Google Scholar]
- 38.Morgan JM, Gillespie JI. The modulation and characterisation of the Ca(2+)-induced Ca2+ release mechanism in cultured human myometrial smooth muscle cells. FEBS Lett 1995;369:295–300 [DOI] [PubMed] [Google Scholar]
- 39.Pozzan T, Rizzuto R, Volpe P, Meldolesi J. Molecular and cellular physiology of intracellular calcium stores. Physiol Rev 1994;74:595–636 [DOI] [PubMed] [Google Scholar]
- 40.Finkbeiner SM. Glial calcium. Glia 1993;9:83–104 [DOI] [PubMed] [Google Scholar]
- 41.Golovina VA, Bambrick LL, Yarowsky PJ, Krueger BK, Blaustein MP. Modulation of two functionally distinct Ca2+ stores in astrocytes: role of the plasmalemmal Na/Ca exchanger. Glia 1996;16:296–305 [DOI] [PubMed] [Google Scholar]
- 42.Langley D, Pearce B. Ryanodine-induced intracellular calcium mobilisation in cultured astrocytes. Glia 1994;12:128–134 [DOI] [PubMed] [Google Scholar]
- 43.Berridge MJ. Neuronal calcium signaling. Neuron 1998;21:13–26 [DOI] [PubMed] [Google Scholar]
- 44.Leite MF, Burgstahler AD, Nathanson MH. Ca2+ waves require sequential activation of inositol trisphosphate receptors and ryanodine receptors in pancreatic acini. Gastroenterology 2002;122:415–427 [DOI] [PubMed] [Google Scholar]
- 45.Charles AC, Dirksen ER, Merrill JE, Sanderson MJ. Mechanisms of intercellular calcium signaling in glial cells studied with dantrolene and thapsigargin. Glia 1993;7:134–145 [DOI] [PubMed] [Google Scholar]
- 46.Venance L, Stella N, Glowinski J, Giaume C. Mechanism involved in initiation and propagation of receptor-induced intercellular calcium signaling in cultured rat astrocytes. J Neurosci 1997;17:1981–1992 [DOI] [PMC free article] [PubMed] [Google Scholar]
- 47.Koizumi S, Fujishita K, Tsuda M, Shigemoto-Mogami Y, Inoue K. Dynamic inhibition of excitatory synaptic transmission by astrocyte-derived ATP in hippocampal cultures. Proc Natl Acad Sci U S A 2003;100:11023–11028 [DOI] [PMC free article] [PubMed] [Google Scholar]
- 48.Stout CE, Costantin JL, Naus CCG, Charles AC. Intercellular calcium signaling in astrocytes via ATP release through connexin hemichannels. J Biol Chem 2002;277:10482–10488 [DOI] [PubMed] [Google Scholar]
- 49.Liu H-T, Toychiev AH, Takahashi N, Sabirov RZ, Okada Y. Maxi-anion channel as a candidate pathway for osmosensitive ATP release from mouse astrocytes in primary culture. Cell Res 2008;18:558–565 [DOI] [PubMed] [Google Scholar]
- 50.Darby M, Kuzmiski JB, Panenka W, Feighan D, MacVicar BA. ATP released from astrocytes during swelling activates chloride channels [see comment]. J Neurophysiol 2003;89:1870–1877 [DOI] [PubMed] [Google Scholar]
- 51.Liu H-T, Sabirov RZ, Okada Y. Oxygen-glucose deprivation induces ATP release via maxi-anion channels in astrocytes. Purinergic Signalling 2008;4:147–154 [DOI] [PMC free article] [PubMed] [Google Scholar]
- 52.Cotrina ML, Lin JH, Alves-Rodrigues A, et al. Connexins regulate calcium signaling by controlling ATP release. Proc Natl Acad Sci U S A 1998;95:15735–15740 [DOI] [PMC free article] [PubMed] [Google Scholar]
- 53.Gordon GRJ, Baimoukhametova DV, Hewitt SA, Rajapaksha WRAKJS, Fisher TE, Bains JS. Norepinephrine triggers release of glial ATP to increase postsynaptic efficacy. Nat Neurosci 2005;8:1078–1086 [DOI] [PubMed] [Google Scholar]
- 54.Zhang J-m, Wang H-k, Ye C-q, et al. ATP released by astrocytes mediates glutamatergic activity-dependent heterosynaptic suppression [see comment]. Neuron 2003;40:971–982 [DOI] [PubMed] [Google Scholar]
- 55.Werry EL, Liu GJ, Bennett MR. Glutamate-stimulated ATP release from spinal cord astrocytes is potentiated by substance P. J Neurochem 2006;99:924–936 [DOI] [PubMed] [Google Scholar]
- 56.Ferguson DR, Kennedy I, Burton TJ. ATP is released from rabbit urinary bladder epithelial cells by hydrostatic pressure changes–a possible sensory mechanism? J Physiol 1997;505:503–511 [DOI] [PMC free article] [PubMed] [Google Scholar]
- 57.Knight GE, Bodin P, De Groat WC, Burnstock G. ATP is released from guinea pig ureter epithelium on distension. Am J Physiol Renal Physiol 2002;282:F281–F288 [DOI] [PubMed] [Google Scholar]
- 58.Reigada D, Lu W, Zhang M, Mitchell CH. Elevated pressure triggers a physiological release of ATP from the retina: possible role for pannexin hemichannels. Neuroscience 2008;157:396–404 [DOI] [PMC free article] [PubMed] [Google Scholar]
- 59.Resta V, Novelli E, Vozzi G, et al. Acute retinal ganglion cell injury caused by intraocular pressure spikes is mediated by endogenous extracellular ATP. Eur J Neurosci 2007;25:2741–2754 [DOI] [PubMed] [Google Scholar]
- 60.Newman EA. Glial cell inhibition of neurons by release of ATP. J Neurosci 2003;23:1659–1666 [DOI] [PMC free article] [PubMed] [Google Scholar]
- 61.Newman EA. Glial modulation of synaptic transmission in the retina. Glia 2004;47:268–274 [DOI] [PMC free article] [PubMed] [Google Scholar]
- 62.Kim SY, Moon JH, Lee HG, Kim SU, Lee YB. ATP released from beta-amyloid-stimulated microglia induces reactive oxygen species production in an autocrine fashion. Exp Mol Med 2007;39:820–827 [DOI] [PubMed] [Google Scholar]
- 63.Reigada D, Mitchell CH. Release of ATP from retinal pigment epithelial cells involves both CFTR and vesicular transport. Am J Physiol Cell Physiol 2005;288:C132–C140 [DOI] [PubMed] [Google Scholar]
- 64.Burnstock G, Williams M. P2 purinergic receptors: modulation of cell function and therapeutic potential. J Pharmacol Exp Ther 2000;295:862–869 [PubMed] [Google Scholar]
- 65.Anderson CM, Nedergaard M. Emerging challenges of assigning P2X7 receptor function and immunoreactivity in neurons. Trends Neurosci 2006;29:257–262 [DOI] [PubMed] [Google Scholar]
- 66.North RA. Molecular physiology of P2X receptors. Physiol Rev 2002;82:1013–1067 [DOI] [PubMed] [Google Scholar]
- 67.Ralevic V, Burnstock G. Receptors for purines and pyrimidines. Pharmacol Rev 1998;50:413–492 [PubMed] [Google Scholar]
- 68.Charlton SJ, Brown CA, Weisman GA, Turner JT, Erb L, Boarder MR. PPADS and suramin as antagonists at cloned P2Y- and P2U-purinoceptors. Br J Pharmacol 1996;118:704–710 [DOI] [PMC free article] [PubMed] [Google Scholar]


