

Abstract
The impact of high-resolution magic angle spinning (HR-MAS) spectroscopy on the histopathologic and mRNA integrity of human prostate tissues was evaluated. Forty prostate tissues were harvested at transrectal ultrasound (TRUS) guided biopsy (n =20) or radical prostatectomy surgery (n =20), snap-frozen on dry ice, and stored at −80°C until use. Twenty-one samples (n =11 biopsy, n =10 surgical) underwent HR-MAS spectroscopy prior to histopathologic and cDNA microarray analysis, while 19 control samples (n =9 biopsy, n =10 surgical) underwent only histopathologic and microarray analysis. Frozen tissues were sectioned at 14-μm intervals and placed on individual histopathology slides. Every 8th slide was stained with hematoxylin and eosin (H&E) and used to target areas of predominantly epithelial tissue on the remaining slides for mRNA integrity and cDNA microarray analysis. Histopathologic integrity was graded from 1 (best) to 5 (worst) by two ‘blinded’ pathologists. Histopathologic integrity scores were not significantly different for post-surgical tissues (HR-MAS vs controls); however, one pathologist’s scores were significantly lower for biopsy tissues following HR-MAS while the other pathologist’s scores were not. mRNA integrity assays were performed using an Agilent 2100 Bioanalyzer and the electrophoretic traces were scored with an RNA integrity number (RIN) from 1 (degraded) to 10 (intact). RIN scores were not significantly different for surgical tissues, but were significantly lower for biopsy tissues following HR-MAS spectroscopy. The isolated mRNA then underwent two rounds of amplification, conversion to cDNA, coupling to Cy3 and Cy5 dyes, microarray hybridization, imaging, and analysis. Significance analysis of microarrays (SAM) identified no significantly over- or under-expressed genes, including 14 housekeeping genes, between HR-MAS and control samples of surgical and biopsy tissues (5% false discovery rate). This study demonstrates that histopathologic and genetic microarray analysis can be successfully performed on prostate surgical and biopsy tissues following HR-MAS analysis; however, biopsy tissues are more fragile than surgical tissues.
Keywords: cDNA microarray, gene expression, high resolution magic angle spinning (HR-MAS) spectroscopy, prostate cancer, radical prostatectomy, RNA integrity number (RIN), significance analysis of microarrays (SAM), transrectal ultrasound (TRUS) guided biopsy
INTRODUCTION
High resolution magic angle spinning (HR-MAS) spectroscopy is an emerging nuclear magnetic resonance (NMR) technique for the metabolic analysis of intact tissues. Historically, NMR studies of tissue metabolism were often performed on extracts because the spectral resolution is inherently better in the liquid vs solid state. By spinning the sample at moderate spin rates and at a specific angle (54.7°), HR-MAS spectroscopy reduces spectral broadness due to restricted molecular motion and approaches the resolution observed in liquids. Because HR-MAS spectroscopy is applied to intact tissue, the same sample can undergo subsequent histopathologic (1–4), genetic (5–7), and/or other analyses (8,9). There is much interest in correlating metabolic patterns with histopathologic (Gleason score) and immunohistochemical markers (e.g. Ki67) of prostate cancer aggressiveness (3,4). Gene expression data obtained from cDNA microarrays or reverse transcription polymerase chain reaction (RT-PCR) assays could provide important insight into the underlying mechanisms resulting in altered citrate (3,4,10,11), zinc (12), polyamine (2–4,13), lactate (14), and phospholipid metabolism (15–17) observed in prostate cancer. This information could then be used to better understand the complex metabolic changes observed clinically in vivo and help clinicians distinguish between indolent (18) and aggressive (19) prostate cancers.
Recent HR-MAS studies from our group have focused on both post-surgical and transrectal ultrasound (TRUS) guided biopsy tissues and each has advantages and disadvantages (3,4,14,16). Post-surgical prostate tissues can typically be obtained in larger quantities (>100 mg per patient), which allows for many replicate studies; however, repeated freezing and thawing can be detrimental to the integrity of the tissue (20,21). Additionally, the ischemia time between surgical resection and pathologic dissection varies widely (22,23). Biopsy tissues can be harvested and frozen in seconds and provide a means to serially monitor patients after therapy (e.g. radiation). Biopsy tissues also provide a better snap shot of in vivo metabolism and demonstrate lower concentrations of lactate, alanine, and free choline than surgical tissues (14). However, biopsy samples are very small (<10 mg) and often contain contaminants from periprostatic lipids and topical analgesics (14). Furthermore, only a few research biopsies can be acquired per patient and they are potentially more heterogeneous than surgical tissues because they linearly sample the prostate and can be up to 2 cm in length.
Much research effort has focused on optimizing experimental conditions for HR-MAS analysis of tissue. Because the samples are analyzed unfrozen, they are subject to various enzymatic degradation processes (4,16). To minimize degradation, HR-MAS experiments are typically performed at 1–4°C in tissue (4,24,25). Investigators have reported differences in the HR-MAS spectra of fresh and previously frozen prostate and kidney tissue (20,26). However, in practice, tissues are usually frozen upon harvesting and the metabolic and pathologic artifacts from the initial freezing cannot be removed. The spin rates used for HR-MAS spectroscopy can also impact the tissue integrity and a number of slower spin rate experiments have been proposed (25,27,28). However, slower spinning techniques have not been universally adopted and a survey of recent studies shows spin rates ranging from 2,250 to 5,000 Hz (4,24,29–31). Moreover, the impact of these degradation processes on tissue integrity depends on the amount of time in the spectrometer. Therefore, the data should be acquired as quickly and efficiently as possible. The purpose of this study was to quantitatively assess the impact of HR-MAS spectroscopy on the histopathologic and mRNA integrity of post-surgical and biopsy tissues under routine experimental conditions.
EXPERIMENTAL
Patient population and tissue harvesting
This study was approved by our institutional review board and informed written consent was obtained from all patients. Forty prostate tissues were harvested from 22 previously untreated patients (mean age of patients: 62.4 years) at the time of transrectal ultrasound (TRUS) guided biopsy (n =20) or radical prostatectomy surgery (n =20). All surgical patients had biopsy-proven prostate cancer (Gleason score range: G3 +3 to G4 +5); however, all samples used in this study were pathologically benign and were collected distantly from the region of cancer. The biopsy tissues used in this study were obtained from patients who had negative clinical biopsies. At tissue harvesting, samples were placed in cryogenic storage vials, snap frozen on dry ice, and stored at −80°C until use. Twenty-one tissue samples (n =11 biopsy, n =10 surgical) underwent HR-MAS spectroscopy prior to histopathologic and genetic analysis, while 19 control samples underwent histopathologic and genetic analysis without HR-MAS spectroscopy.
HR-MAS Spectroscopy
HR-MAS spectroscopy data were acquired at 11.7 T (500 MHz for 1H), 1°C, and a 2,250 Hz spin rate using a Varian INOVA NMR spectrometer equipped with a 4 mm gHX nanoprobe (Varian, Inc., Palo Alto, CA) and processed using ACD/Labs 1D NMR processor (Version 9, ACD Labs, Toronto, Canada). Tissue samples were analyzed inside custom designed 20 or 35 μl volume leak-proof zirconium rotors. The rotors used and the specific system requirements for obtaining cold dry air were previously described in detail (4). At sample preparation, 3.0 μl of deuterium oxide (99.9% atom D) containing 0.75 wt % 3-(trimethylsilyl)propionic-2,2,3,3-d4 acid (D2O + TSP) (Sigma-Aldrich, St. Louis, MO) was pipetted into the bottom of a tared rotor and weighed to 0.01 mg. For biopsy tissues, ~1 mm was cut and removed from both sides of the core to remove periprostatic fat, while for surgical tissues a 3.5 mm biopsy punch (Sklar Instruments, West Chester, PA) was used to excise the sample from the bulk tissue. Tissue samples were then weighed to 0.01 mg (mean surgical wt: 13.84 ±4.25 mg, mean biopsy wt: 5.07 ±0.95 mg) and placed inside the rotor. The rotor was carefully assembled to avoid air bubbles, closed tightly to prevent leakage, and placed in the spectrometer for analysis.
An automated routine was used to optimize the magnetic field homogeneity across the sample (<10 min), after which a 1D spectrum was acquired with a 2.0 s water-suppression delay, 2.0 s acquisition time (repetition rate =4.0 s), 20 000 Hz spectral width, 40 000 complex points, 4 steady state pulses, and 64 or 128 transients (~4.5 or 9 min). Following HR-MAS analysis, tissues were placed in cryomolds, frozen in Tissue-Tek™ optimal cutting temperature (OCT) tissue embedding medium (Fisher Scientific, Pittsburgh, PA), and stored at −80°C until sectioning. The mean total time from beginning sample preparation to refreezing was 28±11 min (range: 12–50 min).
Histopathology
At the time of sectioning, the control tissue samples were thawed, placed in cryomolds, and re-frozen in OCT. The HR-MAS and control samples were then processed side by side in the exact same manner through each step of the histopathologic, mRNA isolation, amplification, RNA integrity and cDNA microarray hybridization protocols. Tissues were sectioned at 14 μm intervals using a Leica CM1850 cryostat (Leica Microsystems, Bannockburn, IL) maintained at −21°C. Typically, 24 sections were placed on individual histology slides and every 8th slide was stained with hematoxylin and eosin (H&E) (Fisher Scientific, Pittsburgh, PA) using a standard protocol. The remaining unstained slides were kept frozen at −80°C for up to 48 hours prior to mRNA isolation.
Histopathologic integrity was graded by two pathologists, who each had over 12 years experience in the interpretation of prostate histopathology, using a five-point scale (1 =excellent, 5 =poor) and allowing for half integer scores. The slides were evaluated ‘blinded’ on two separate days and the scores were then averaged. The criteria used to grade the slides were the quality of the tissue architecture, cytology (including cell lysis and nuclear details), the severity of freezing artifacts, and the general overall appearance of the sections, as follows: (1) Crisp histology with minimal freezing artifacts; (2) freezing artifact present but clearly interpretable, glandular morphology intact; (3) freezing artifact present, morphology partially compromised but still interpretable; (4) very difficult to interpret, some cells autolyzed; (5) not interpretable. When interpreting the slides the pathologists were asked to ignore artifacts such as tissue folding, tangential cutting, crushing, and uneven counterstaining intensities which are related to processing rather than tissue integrity. The pathologists also estimated the percentages of benign glandular, benign stroma, atrophy, chronic inflammation, and cancer. Prostatic intraepithelial neoplasia (PIN) was considered benign glandular and benign prostatic hyperplasia (BPH) was considered either benign glandular or benign stroma depending on the type. Samples containing any amount of cancer or PIN, or having >5% inflammation were excluded from further analysis.
Isolation/purification of total RNA and mRNA integrity assay
The unstained slides were dehydrated in 70, 95, and 100% ethanol (~1 min each), regions of predominantly epithelial tissue, identified from the H&E slides, were scraped into an Eppendorf tube containing 700 μL of RLT lysis buffer (Qiagen Inc., Valencia, CA) plus 7 μl β-mercaptoethanol (Sigma-Aldrich, St. Louis, MO), and homogenized using a tissue miser (Fisher Scientific, Pittsburgh, PA). Total RNA was isolated using RNeasy columns (Qiagen Inc., Valencia, CA) according to the manufacturer’s instructions, with the modification that DNAse was used to remove DNA contamination.
The RNA integrity assays (32) were performed using a 2100 Bioanalyzer (Agilent Techologies, Santa Clara, CA) with an RNA 6000 Pico kit and Ladder (Ambion/Applied Biosystems, Austin, TX), according to the manufacturer’s instructions. The bioanalyzer produces an electropherogram, which shows the distribution of RNA transcripts in the sample. In an ideal sample, the two peaks of the ribosomal RNA 18S and 28S bands are primarily observed, while additional peaks suggest RNA degradation and/or DNA contamination. The 2100 Bioanalyzer Expert software program (version B.01.03.SI158) was used to assign an RNA integrity number (RIN) from 1 to 10, with 1 =poor, 10 =excellent (33).
Statistical analysis
Histopathologic integrity and RIN scores were compared between post-surgical and biopsy tissues, with and without HR-MAS analysis, using a Mann–Whitney U-test, assuming a significance level of p <0.05.
RNA amplification and microarrays
One microgram of total target RNA, side by side with 1 μg of universal human reference RNA (Stratagene, La Jolla, CA, USA), was linearly amplified through two rounds of modified in vitro transcription (34). Amplified RNAs were converted to aminoallyl-modified cDNA and coupled to N-hydroxysuccinimidyl esters of Cy3 and Cy5 (Amersham-Pharmacia, Piscataway, NJ), then hybridized to a microarray slide containing 40 207 cDNAs, corresponding to 33 065 unique genes, for 12–16 h at 65°C (35). Slides were then washed and immediately scanned with an Axon-imager 4000B (Molecular Devices, Sunnyvale, CA) using GenePixPro3.0 software. The protocols for printing and post-processing of the arrays are available at http://derisilab.ucsf.edu/data/microarray/.
Microarray data analysis and hierarchical clustering
Primary analysis was performed using the GenePixPro3.0 software package (Molecular Devices, Sunnyvale, CA). Cy3-to-Cy5 ratios were determined for the individual genes along with various quality-control parameters such as spot intensity over local background. In addition, bad spots or areas of the array with obvious defects were manually flagged and excluded from the subsequent analysis. Gene expression was analyzed using the program Cluster (36) by using the average-linkage hierarchal clustering of an uncentered Pearson correlation similarity matrix and displayed using Java TreeView (37). GenePixPro3.0 median of ratio values from the experiment were subjected to linear normalization in NOMAD (http://ucsf-nomad.sourceforge.net/), log-transformed (base 2), and filtered for genes where data were present in 95% of experiments, and where the absolute value of at least one measurement was >1. For biopsy tissues, 13 387 cDNAs (10 880 unique genes) passed filtering, whereas for surgical tissues, 14 322 cDNAs (11 638 unique genes) passed filtering.
Significance analysis of microarrays (SAM)
After linear normalization, log (base 2) transformation, and hierarchical clustering, the resulting cluster data table was imported into the SAM software package (38). SAM is a statistical technique for determining whether changes in gene expression are statistically significant. SAM software computes a two-sample t-statistic for the normalized log ratios of gene expressions for each gene, including the following 14 housekeeping genes: hypoxanthine-guanine phosphoribosyltransferase (HPRT), TATA-box binding protein (TBP), beta-2-microglobulin (B2M), amino-levulinate, delta-, synthase 1 (ALAS1), succinate dehydrogenase complex, subunit A, flavoprotein (SDHA), large ribosomal protein (LRP), cyclophilin A (CYC), phosphoglycerokinase 1 (PGK), transferrin receptor (TfR), ATP synthase 6 (ATP6), RNA polymerase II (RPOL2), phospholipase A2 (PLA), β-actin (BACT), and ribosomal protein L13a (RPL13A). Groups were defined based on the comparison performed; for example, group 1 =post-surgical tissues that underwent HR-MAS spectroscopy, and group 2 =post-surgical tissues that did not undergo HR-MAS spectroscopy. Data was censored if more than one data value was flagged in each group to eliminate poor quality array data. SAM thresholds the t-statistics to provide a significant gene list and provides an estimate of the false discovery rate (the percentage of genes identified by chance alone). A relatively low false discovery rate (FDR) of 5% was used to identify a relatively high number of significant genes if applicable.
RESULTS
Figure 1 shows representative 1H HR-MAS spectra of benign surgical (Fig. 1a) and TRUS-guided biopsy tissues (Fig. 1b). The major metabolites in the HR-MAS spectrum are labeled, including choline (Cho), phosphocholine (PC), glycerophosphocholine (GPC), polyamines, creatine, citrate, alanine, and lactate. Consistent with benign glandular prostate tissue (2–4), both spectra show high levels of citrate and polyamines and low levels of choline containing metabolites (Cho, PC, GPC). However, note that the levels of lactate and alanine are much higher in the post-surgical sample (Fig. 1a) than the TRUS-guided biopsy sample (Fig. 1b) C14). Additionally, the TRUS-guided biopsy sample contains contaminants from the local anesthetic (Hurricaine) while the post-surgical sample does not. The resonances from these contaminants obscure a large portion of the 1D proton spectrum; however, the choline to citrate region is unaffected and additional metabolites of interest can be resolved using 2D experiments (16).
Figure 1.
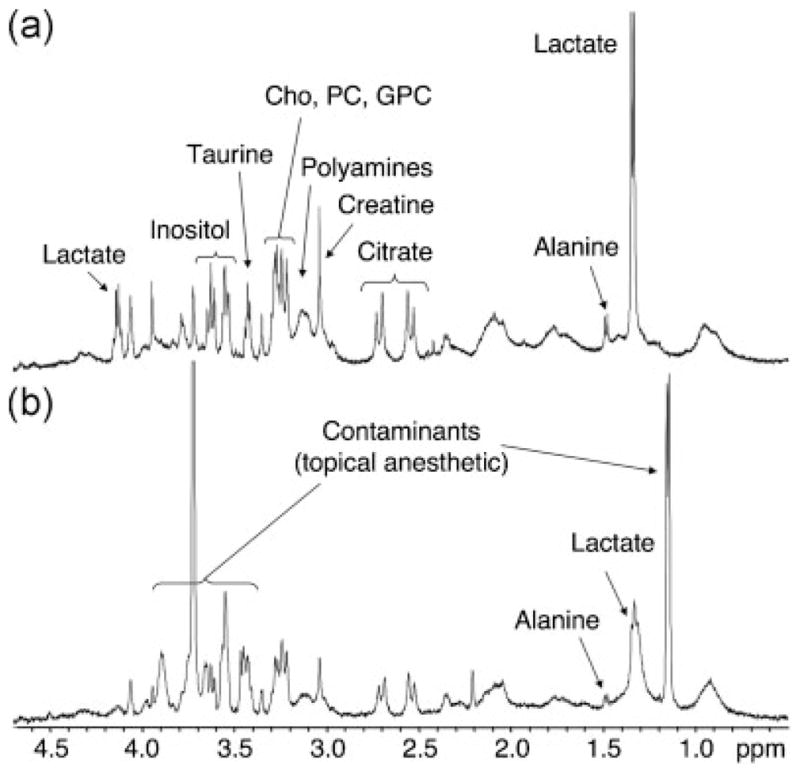
1H HR-MAS spectra of benign post-surgical (a) and TRUS-guided biopsy (b) prostate tissues. The major prostate metabolites are indicated. Benign prostate tissues demonstrate high levels of citrate and polyamines and low levels of choline containing metabolites (Cho, PC, GPC). Biopsy tissues contain significantly lower levels of lactate and alanine than surgical tissues, but may contain contaminants from topical anesthetics.
Figure 2 shows hematoxylin and eosin (H&E) stained sections and corresponding pathologic integrity scores (shown inset) for the post-surgical and TRUS-guided biopsy samples shown in Figure 1 and representative control samples. Table 1 summarizes the mean (± standard deviation) histopathologic integrity scores and their respective ranges for the post-surgical and TRUS-guided biopsies used in this study. For surgical tissues, there was no significant difference in the histopathologic integrity scores for HR-MAS samples vs control samples. For biopsy tissues, one pathologist scored the HR-MAS samples significantly lower (better) than the control samples, whereas there was no significant difference in the other pathologist’s readings. However, when the scores of the two pathologists were averaged, the difference was not statistically significant. At pathologic evaluation, surgical tissues contained an average of 39 ±10% (range: 20–56%) glandular tissue and 61 ±10% stromal tissue (range: 44–80%). Biopsy tissues contained an average of 35 ±11% (range: 20–80%) glandular tissue and 65 ±11% (range: 20–80%) stromal tissue. Based on previous criteria (3,14) the samples all contained sufficient amounts of glandular epithelial tissue and were metabolically active, and therefore, considered well-suited for subsequent microarray analysis.
Figure 2.

Hematoxylin and eosin (H&E) sections from the HR-MAS (a) and control (b) post-surgical tissues and HR-MAS (c) and control (d) TRUS-guided biopsy tissues. The HR-MAS samples (a and c) are the same as shown in Figure 1.
Table 1.
Histopathologic integrity and RNA integrity number (RIN) scores of prostate surgical and biopsy tissues following HR-MAS spectroscopy vs controls
| Pathologist 1 | Pathologist 2 | Path Average | RIN score | |
|---|---|---|---|---|
| Surgical tissues | ||||
| HR-MAS | 2.90 ±0.99 | 2.65 ±0.64 | 2.78 ±0.76 | 6.40 ±1.15 |
| Range | 1.0–4.0 | 2.0–4.0 | 1.0–4.0 | 4.1–7.7 |
| Controls | 2.50 ±0.85 | 2.33 ±0.69 | 2.41 ±0.68 | 6.77 ±1.04 |
| Range | 1.0–4.0 | 1.75–4.0 | 1.0–4.0 | 5.1–8.4 |
| p-value | 0.326 | 0.140 | 0.151 | 0.521 |
| Biopsy tissues | ||||
| HR-MAS | 2.68 ±0.78 | 2.61 ±0.49 | 2.65 ±0.38 | 4.84 ±0.84 |
| Range | 1.0–4.0 | 2.0–3.0 | 1.0–4.0 | 3.7–6.5 |
| Controls | 3.46 ±0.82 | 2.78 ±1.06 | 3.12 ±0.84 | 6.31 ±0.94 |
| Range | 2.0–4.5 | 1.25–5.0 | 1.25–5.0 | 4.8–7.4 |
| p-value | 0.048 | 0.732 | 0.053 | 0.002 |
Figure 3 shows the electrophoretic traces and corresponding RIN scores (shown inset) for the same HR-MAS and control samples shown in Figure 2. The 18S and 28S peaks corresponding to the major RNA subunits are indicated in Figure 3a. As shown in Table 1, RIN scores were not significantly different for surgical samples following HR-MAS analysis vs control samples. RIN scores were significantly lower (more degraded) for HR-MAS biopsies vs control biopsies; however, the mean value for the biopsy controls was very similar to those of the post-surgical samples (HR-MAS and controls). Figure 4 shows significance analysis of microarrays (SAM) plots for surgical (a) and biopsy (b) tissues comparing HR-MAS vs controls. The expected axis visually presents the number of genes that would characterize HR-MAS vs non-HR-MAS samples by chance alone using a false discovery rate (FDR) of 5%. The observed distribution is not statistically different, and therefore, there are no reliably different genes between these two categories, observed and expected, indicating a negative result. Therefore, there were no significantly up-regulated or down-regulated genes, including 14 housekeeping genes, in either group of samples.
Figure 3.

Electrophoretic traces and corresponding RIN scores (shown inset) for the same HR-MAS and control samples shown in Figure 2. The 18S and 28S peaks are indicated in Figure 3a.
Figure 4.

Significance analysis of microarray (SAM) plots for surgical (a) and biopsy (b) tissues (HR-MAS vs control, 5% false discovery rate). The observed axis shows the normalized median Cy3 to Cy5 ratios across all microarrays for each cDNA that passed filtering (surgical: 14 322 cDNAs; biopsy: 13 387 cDNAs), while the expected axis visually presents the number of genes that would characterize HR-MAS vs control samples by chance alone.
DISCUSSION
Since its initial application (39), HR-MAS spectroscopy has become an important technique for the study of tissue metabolism. Although NMR analyses of tissue extracts provide complementary information, extraction procedures are time consuming, require large amounts of tissue (≥50 mg), and are inherently destructive, thus preventing any histopathologic or genetic analyses on the same tissue (40). Consequently, extract samples are often assumed to contain cancer, based on the pathology of adjacent tissue, but may actually contain very little or no cancer at all. HR-MAS spectroscopy can be performed on ≤5 mg of tissue and requires minimal sample preparation. While quantitative histopathologic analysis has been routinely performed on samples following HR-MAS spectroscopy (2–4), genetic microarray analysis of the same samples has not been reported. In this study, the histopathologic and mRNA integrity of prostate surgical and biopsy tissues was evaluated following HR-MAS spectroscopy as part of an ongoing study to characterize metabolic and genetic changes associated with prostate cancer presence, aggressiveness, and response to therapy (e.g. radiation).
Consistent with the mean histopathologic integrity scores reported in Table 1, all tissues included in this study were pathologically interpretable. There were no significant differences in histopathologic integrity for surgical HR-MAS vs control samples. One pathologist scored the biopsy HR-MAS samples significantly lower (better) than the control biopsies. However, the significance was marginal and when the histopathology scores of the two pathologists were combined, the difference was no longer statistically significant. The finding that biopsy samples appeared to have better pathology after HR-MAS spectroscopy was performed is most likely due to freezing artifacts dominating the pathologic quality and because biopsy tissues are inherently more difficult to interpret than surgical tissues due to their much smaller size. While formalin fixation and paraffin embedding (FFPE) of fresh prostate tissue is the standard for clinical diagnosis, the use of frozen sections has also been reported (41). Because HR-MAS spectroscopy must be performed on fresh (unfixed) tissues, the tissues must be frozen to prevent degradation unless the spectrometer is immediately available. Previous studies from our group have indicated that several metabolites (e.g. Cho, PC, GPC, Eth, PE, GPE) degrade or change over time while the tissue is in the spectrometer; however, the rate of degradation can be minimized by maintaining the samples at 1 °C (4,16). This study confirms that HR-MAS spectroscopy has no detrimental impact on the quantitative histopathologic analysis of prostate tissues provided that the experiments are performed as efficiently as possible and under optimal conditions. (i.e. cold temperature and moderate spin rates).
There was no significant difference in mRNA integrity between surgical prostate tissues with and without HR-MAS spectroscopy. However, the mRNA integrity scores for biopsy tissues were significantly lower following HR-MAS. This is not surprising since the biopsy tissues were much smaller than the surgical samples. Biopsy tissues are also more delicate than surgical tissues because they are ~1 mm in diameter. Nonetheless, SAM analysis demonstrated no significantly over or under-expressed genes for either surgical or biopsy samples following HR-MAS analysis compared to controls. Both post-surgical (42–44) and biopsy (41,45,46) tissues have been used in previous microarray studies of prostate tissue indicating that ischemia is not detrimental to the RNA. However, since genetic changes are known to occur early-on during radical prostatectomy surgery (23,47,48), caution should be used when comparing surgical samples to biopsy samples.
Our findings are in agreement those of several other studies, which suggest that moderate amounts of RNA degradation due to ischemia and freeze thawing processes do not adversely affect gene expression profiles (21,22,49–53). Notably, Ohashi and co-workers reported no loss of RNA integrity in breast tissues kept at room temperature for up to 3 h after surgery (51). Jochumsen and co-workers reported that ovarian tissue could be frozen and thawed at least three times without compromising the RNA integrity and genetic expression profile (21). Therefore, the amount of time needed to perform HR-MAS spectroscopy experiments (< 1 h) and the thawing and refreezing of prostate tissues does not preclude the subsequent genetic analysis of the same tissues.
Finally, there were a number of challenges and obstacles in this study that should be stated. Our results only included samples that had high quality HR-MAS data, were histopathologically benign, and underwent successful mRNA amplification, conversion to cDNA, coupling to Cy3 and Cy5 dyes, and finally microarray hybridization, imaging, and analysis. Several pitfalls could occur at any time during this process. First, the HR-MAS data can be unusable due to poor resolution, poor signal to noise, or contamination by anesthetics and/or lipids (in the case of biopsies) (14). Although HR-MAS spectra may visually appear to be benign (high citrate and polyamines) or malignant (high choline metabolites, low citrate and polyamines), the histopathology of the tissues is never known until they have been sectioned and stained. Because this was a validation study, samples were not included if they contained cancer, PIN, >5% inflammation, or an insufficient amount of glandular tissue. For these reasons, it was not possible to use patient-matched samples in all cases in this study. Finally, mRNA amplification and cDNA microarray analysis is a time consuming multi-step process and is associated with a significant technical failure rate (54,55). These problems could potentially be minimized by using commercial microarray kits.
In conclusion, this study demonstrates that histopathologic and cDNA microarray analysis is feasible following HR-MAS spectroscopy of prostate tissues. The pathologic and associated genetic heterogeneity of the benign prostate and prostate cancer warrants a direct correlation of metabolism and mRNA obtained from the same piece of tissue. Even in the case of a single biopsy core, there can be several different pathologies including variable amounts of benign glandular and stromal tissue, as well as inflammation, atrophy, prostatic epithelial neoplasia (PIN), and varying grades of cancer. However, since any manipulation of the tissue affects its RNA integrity, the approach used in this study may not be warranted for other more homogeneous diseases. While this study focused on benign prostatic tissues, the mechanical impact of HR-MAS on prostate cancer tissues would be similar due to the presence of comparable amounts of connective stroma in both tissue types. However, this may not be the case for other types of cancers. Since beginning this work, microarray experiments have been successfully performed using prostate cancer tissues, and those results are the subject of a forthcoming manuscript.
Acknowledgments
Contract/grant sponsor: National Institutes of Health; contract/grant number: K01 CA096618, R01 CA102751, R01 CA101042.
Contract/grant sponsor: American Cancer Society; contract/grant number: RSG-05-241-01-CCE.
Contract/grant sponsor: University of California Discovery Grant; contract/grant number: ITL-BIO04-10148.
The authors acknowledge and thank the UCSF Center for Advanced Technology for providing the array fabrication equipment used to produce the cDNA microarrays for this study.
Abbreviations
- Cho
choline
- Eth
ethanolamine
- FID
free induction decay
- GPC
glycerophosphocholine
- GPE
glycerophosphoethanolamine
- H&E
hematoxylin and eosin
- HR-MAS
high resolution magic angle spinning
- OCT
optimal cutting temperature
- PC
phosphocholine
- PE
phosphoethanolamine
- PIN
prostatic intraepithelial neoplasia
- RIN
RNA integrity number
- RT-PCR
reverse transcription polymerase chain reaction
- SAM
Significance Analysis of Microarrays
- TRUS
transrectal ultrasound
- TSP
3-(trimethylsilyl) propionic-2,2, 3,3-d4 acid
References
- 1.Cheng LL, Anthony DC, Comite AR, Black PM, Tzika AA, Gonzalez RG. Quantification of microheterogeneity in glioblastoma multiforme with ex vivo high-resolution magic-angle spinning (HRMAS) proton magnetic resonance spectroscopy. Neuro-Oncol. 2000;2(2):87–95. doi: 10.1093/neuonc/2.2.87. [DOI] [PMC free article] [PubMed] [Google Scholar]
- 2.Cheng LL, Wu CL, Smith MR, Gonzalez RG. Non-destructive quantitation of spermine in human prostate tissue samples using HRMAS H-1 NMR spectroscopy at 9.4 T. FEBS Lett. 2001;494(1–2):112–116. doi: 10.1016/s0014-5793(01)02329-8. [DOI] [PubMed] [Google Scholar]
- 3.Swanson MG, Vigneron DB, Tabatabai ZL, Males RG, Schmitt L, Carroll PR, James JK, Hurd RE, Kurhanewicz J. Proton HR-MAS spectroscopy and quantitative pathologic analysis of MRI/3D-MRSI-targeted post-surgical prostate tissues. Magn Reson Med. 2003;50(5):944–954. doi: 10.1002/mrm.10614. [DOI] [PubMed] [Google Scholar]
- 4.Swanson MG, Zektzer AS, Tabatabai ZL, Simko J, Jarso S, Keshari KR, Schmitt L, Carroll PR, Shinohara K, Vigneron DB, Kurhanewicz J. Quantitative analysis of prostate metabolites using H-1 HR-MAS spectroscopy. Magn Reson Med. 2006;55(6):1257–1264. doi: 10.1002/mrm.20909. [DOI] [PubMed] [Google Scholar]
- 5.Tzika AA, Astrakas L, Cao HH, Mintzopoulos D, Andronesi OC, Mindrinos M, Zhang JW, Rahme LG, Blekas KD, Likas AC, Galatsanos NP, Carroll RS, Black PM. Combination of high-resolution magic angle spinning proton magnetic resonance spectroscopy and microscale genomics to type brain tumor biopsies. Int J Mol Med. 2007;20(2):199–208. [PubMed] [Google Scholar]
- 6.Griffin JL, Blenkiron C, Valonen PK, Caldas C, Kauppinen RA. High-resolution magic angle spinning H-1 NMR spectroscopy and reverse transcription-PCR analysis of apoptosis in a rat glioma. Anal Chem. 2006;78(5):1546–1552. doi: 10.1021/ac051418o. [DOI] [PubMed] [Google Scholar]
- 7.Griffin JL, Bonney SA, Mann C, Hebbachi AM, Gibbons GF, Nicholson JK, Shoulders CC, Scott J. An integrated reverse functional genomic and metabolic approach to understanding orotic acid-induced fatty liver. Physiol Genomics. 2004;17(2):140–149. doi: 10.1152/physiolgenomics.00158.2003. [DOI] [PubMed] [Google Scholar]
- 8.Griffin JL, Shockcor JP. Metabolic profiles of cancer cells. Nat Rev Cancer. 2004;4(7):551–561. doi: 10.1038/nrc1390. [DOI] [PubMed] [Google Scholar]
- 9.Kurhanewicz J, Swanson MG, Nelson SJ, Vigneron DB. Combined magnetic resonance imaging and spectroscopic imaging approach to molecular imaging of prostate cancer. J Magn Reson Imaging. 2002;16(4):451–463. doi: 10.1002/jmri.10172. [DOI] [PMC free article] [PubMed] [Google Scholar]
- 10.Costello LC, Franklin RB. ’Why do tumour cells glycolyse?’: From glycolysis through citrate to lipogenesis. Mol Cell Biochem. 2005;280(1–2):1–8. doi: 10.1007/s11010-005-8841-8. [DOI] [PMC free article] [PubMed] [Google Scholar]
- 11.Altenberg B, Greulich KO. Genes of glycolysis are ubiquitously over-expressed in 24 cancer classes. Genomics. 2004;84(6):1014–1020. doi: 10.1016/j.ygeno.2004.08.010. [DOI] [PubMed] [Google Scholar]
- 12.Franklin RB, Feng P, Milon B, Desouki MM, Singh KK, Kajdacsy-Balla A, Bagasra O, Costello LC. hZIP1 zinc uptake transporter down regulation and zinc depletion in prostate cancer. Mol Cancer. 2005;4:32. doi: 10.1186/1476-4598-4-32. [DOI] [PMC free article] [PubMed] [Google Scholar]
- 13.Liu X, Wang L, Lin Y, Teng Q, Zhao C, Hu H, Chi W. Ornithine decarboxylase activity and its gene expression are increased in benign hyperplastic prostate. Prostate. 2000;43(2):83–87. doi: 10.1002/(sici)1097-0045(20000501)43:2<83::aid-pros2>3.0.co;2-o. [DOI] [PubMed] [Google Scholar]
- 14.Tessem MG, Swanson MG, Keshari KR, Albers MJ, Joun D, Tabatabai ZL, Simko JP, Shinohara K, Nelson SJ, Vigneron DB, Gribbestad IS, Kurhanewicz J. Evaluation of lactate and alanine as metabolic biomarkers of prostate cancer using 1H HR-MAS spectroscopy of biopsy tissues. Magn Reson Med. 2008;60(3):510–516. doi: 10.1002/mrm.21694. [DOI] [PMC free article] [PubMed] [Google Scholar]
- 15.Dahiya R, Boyle B, Goldberg BC, Yoon WH, Konety B, Chen K, Yen TS, Blumenfeld W, Narayan P. Metastasis-associated alterations in phospholipids and fatty acids of human prostatic adenocarcinoma cell lines. Biochem Cell Biol. 1992;70(7):548–554. doi: 10.1139/o92-085. [DOI] [PubMed] [Google Scholar]
- 16.Swanson MG, Keshari KR, Tabatabai ZL, Simko JP, Shinohara K, Carroll PR, Zektzer AS, Kurhanewicz J. Quantitation of choline- and ethanolamine-containing metabolites in human prostate tissues using 1H HR-MAS total correlation spectroscopy. Magn Reson Med. 2008;60(1):33–40. doi: 10.1002/mrm.21647. [DOI] [PMC free article] [PubMed] [Google Scholar]
- 17.Narayan P, Dahiya R. Alterations in sphingomyelin and fatty acids in human benign prostatic hyperplasia and prostatic cancer. Biomed Biochim Acta. 1991;50(9):1099–1108. [PubMed] [Google Scholar]
- 18.Ornish D, Magbanua MJM, Weidner G, Weinberg V, Kemp C, Green C, Mattie MD, Marlin R, Simko J, Shinohara K, Haqq CM, Carroll PR. Changes in prostate gene expression in men undergoing an intensive nutrition and lifestyle intervention. Proc Natl Acad Sci USA. 2008;105(24):8369–8374. doi: 10.1073/pnas.0803080105. [DOI] [PMC free article] [PubMed] [Google Scholar]
- 19.Stamey TA, Caldwell MC, Fan ZB, Zhang ZM, McNeal JE, Nolley R, Chen ZX, Mahadevappa M, Warrington JA. Genetic profiling of Gleason grade 4/5 prostate cancer: Which is the best prostatic control tissue? J. Urol. 2003;170(6):2263–2268. doi: 10.1097/01.ju.0000096414.25583.0d. [DOI] [PubMed] [Google Scholar]
- 20.Wu CL, Taylor JL, He WL, Zepeda AG, Halpern EF, Bielecki A, Gonzalez RG, Cheng LL. Proton high-resolution magic angle spinning NMR analysis of fresh and previously frozen tissue of human prostate. Magn Reson Med. 2003;50(6):1307–1311. doi: 10.1002/mrm.10645. [DOI] [PubMed] [Google Scholar]
- 21.Jochumsen KM, Tan QH, Dahlgaard J, Kruse TA, Mogensen O. RNA quality and gene expression analysis of ovarian tumor tissue undergoing repeated thaw-freezing. Exp Mol Pathol. 2007;82(1):95–102. doi: 10.1016/j.yexmp.2006.05.004. [DOI] [PubMed] [Google Scholar]
- 22.Best S, Sawers Y, Fu VX, Almassi N, Huang W, Jarrard DF. Integrity of prostatic tissue for molecular analysis after robotic-assisted laparoscopic and open prostatectomy. Urology. 2007;70(2):328–332. doi: 10.1016/j.urology.2007.04.005. [DOI] [PMC free article] [PubMed] [Google Scholar]
- 23.Schlomm T, Naekel E, Luebke A, Buness A, Chun FKH, Steuber T, Graefen M, Simon R, Sauter CG, Poustka A, Huland H, Erbersdobler A, Sueltmann H, Hellwinkel OJC. Marked gene transcript level alterations occur early during radical prostatectomy. Eur Urol. 2008;53(2):333–346. doi: 10.1016/j.eururo.2007.03.075. [DOI] [PubMed] [Google Scholar]
- 24.Martinez-Granados B, Monleon D, Martinez-Bisbal MC, Rodrigo JM, del Lmo J, Lluch P, Ferrandez A, Marti-Bonmati L, Celda B. Metabolite identification in human liver needle biopsies by high-resolution magic angle spinning H-1 NMR spectroscopy. NMR Biomed. 2006;19(1):90–100. doi: 10.1002/nbm.1005. [DOI] [PubMed] [Google Scholar]
- 25.Burns MA, Taylor JL, Wu CL, Zepeda AG, Bielecki A, Cory D, Cheng LL. Reduction of spinning sidebands in proton NMR of human prostate tissue with slow high-resolution magic angle spinning. Magn Reson Med. 2005;54(1):34–42. doi: 10.1002/mrm.20523. [DOI] [PubMed] [Google Scholar]
- 26.Middleton DA, Bradley DP, Connor SC, Mullins PG, Reid DG. The effect of sample freezing on proton magic-angle spinning NMR spectra of biological tissue. Magn Reson Med. 1998;40(1):166–169. doi: 10.1002/mrm.1910400122. [DOI] [PubMed] [Google Scholar]
- 27.Taylor JL, Wu CL, Cory D, Gonzalez RG, Bielecki A, Cheng LL. High-resolution magic angle spinning proton NMR analysis of human prostate tissue with slow spinning rates. Magn Reson Med. 2003;50(3):627–632. doi: 10.1002/mrm.10562. [DOI] [PubMed] [Google Scholar]
- 28.Wind RA, Hu JZ. In vivo and ex vivo high-resolution H-1 NMR in biological systems using low-speed magic angle spinning. Prog Nucl Mag Res Sp. 2006;49:207–259. [Google Scholar]
- 29.Payne GS, Troy H, Vaidya SJ, Griffiths JR, Leach MO, Chung YL. Evaluation of P-31 high-resolution magic angle spinning of intact tissue samples. NMR Biomed. 2006;19(5):593–598. doi: 10.1002/nbm.1040. [DOI] [PubMed] [Google Scholar]
- 30.Sitter B, Lundgren S, Bathen TF, Halgunset J, Fjosne HE, Gribbestad IS. Comparison of HR MAS MR spectroscopic profiles of breast cancer tissue with clinical parameters. NMR Biomed. 2006;19(1):30–40. doi: 10.1002/nbm.992. [DOI] [PubMed] [Google Scholar]
- 31.Tugnoli V, Schenetti L, Mucci A, Parenti F, Cagnoli R, Righi V, Trinchero A, Nocetti L, Toraci C, Mavilla L, Trentini G, Zunarelli E, Tosi MR. Ex vivo HR-MAS MRS of human meningiomas: a comparison with in vivo H-1 MR spectra. Int J Mol Med. 2006;18(5):859–869. [PubMed] [Google Scholar]
- 32.Sodowich BI, Fadl I, Burns C. Method validation of in vitro RNA transcript analysis on the Agilent 2100 Bioanalyzer. Electrophoresis. 2007;28(14):2368–2378. doi: 10.1002/elps.200600673. [DOI] [PubMed] [Google Scholar]
- 33.Schroeder A, Mueller O, Stocker S, Salowsky R, Leiber M, Gassmann M, Lightfoot S, Menzel W, Granzow M, Ragg T. The RIN: an RNA integrity number for assigning integrity values to RNA measurements. BMC Mol Biol. 2006;7:3. doi: 10.1186/1471-2199-7-3. [DOI] [PMC free article] [PubMed] [Google Scholar]
- 34.Baugh LR, Hill AA, Brown EL, Hunter CP. Quantitative analysis of mRNA amplification by in vitro transcription. Nucleic Acids Res. 2001;29(5):e29. doi: 10.1093/nar/29.5.e29. [DOI] [PMC free article] [PubMed] [Google Scholar]
- 35.Derisi J, Penland L, Brown PO, Bittner ML, Meltzer PS, Ray M, Chen YD, Su YA, Trent JM. Use of a cDNA microarray to analyse gene expression patterns in human cancer. Nat Genet. 1996;14(4):457–460. doi: 10.1038/ng1296-457. [DOI] [PubMed] [Google Scholar]
- 36.Eisen MB, Spellman PT, Brown PO, Botstein D. Cluster analysis and display of genome-wide expression patterns. Proc Natl Acad Sci USA. 1998;95(25):14863–14868. doi: 10.1073/pnas.95.25.14863. [DOI] [PMC free article] [PubMed] [Google Scholar]
- 37.Saldanha AJ. Java Treeview-extensible visualization of microarray data. Bioinformatics. 2004;20(17):3246–3248. doi: 10.1093/bioinformatics/bth349. [DOI] [PubMed] [Google Scholar]
- 38.Tusher VG, Tibshirani R, Chu G. Significance analysis of microarrays applied to the ionizing radiation response. Proc Natl Acad Sci USA. 2001;98(9):5116–5121. doi: 10.1073/pnas.091062498. [DOI] [PMC free article] [PubMed] [Google Scholar]
- 39.Cheng LL, Lean CL, Bogdanova A, Wright SC, Ackerman JL, Brady TJ, Garrido L. Enhanced resolution of proton NMR spectra of malignant lymph nodes using magic-angle spinning. Magn Reson Med. 1996;36(5):653–658. doi: 10.1002/mrm.1910360502. [DOI] [PubMed] [Google Scholar]
- 40.Beckonert O, Keun HC, Ebbels TMD, Bundy J, Holmes E, Lindon JC, Nicholson JK. Metabolic profiling, metabolomic and metabonomic procedures for NMR spectroscopy of urine, plasma, serum and tissue extracts. Nat Protocols. 2007;2(11):2692–2703. doi: 10.1038/nprot.2007.376. [DOI] [PubMed] [Google Scholar]
- 41.Scott KM, Fanta P, Calaluce R, Dalkin B, Weinstein RS, Nagle RB. Diagnostic frozen prostate sextant biopsies: An approach for preserving protein and RNA for additional studies. Prostate. 2000;44(4):296–302. doi: 10.1002/1097-0045(20000901)44:4<296::aid-pros6>3.0.co;2-u. [DOI] [PubMed] [Google Scholar]
- 42.Ohl F, Jung M, Xu CL, Stephan C, Rabien A, Burkhardt M, Nitsche A, Kristiansen G, Loening SA, Radonic A, Jung K. Gene expression studies in prostate cancer tissue: which reference gene should be selected for normalization? J Mol Med. 2005;83(12):1014–1024. doi: 10.1007/s00109-005-0703-z. [DOI] [PubMed] [Google Scholar]
- 43.Rhodes DR, Sanda MG, Otte AP, Chinnaiyan AM, Rubin MA. Multiplex biomarker approach for determining risk of prostate-specific antigen-defined recurrence of prostate cancer. J Natl Cancer Inst. 2003;95(9):661–668. doi: 10.1093/jnci/95.9.661. [DOI] [PubMed] [Google Scholar]
- 44.Luo J, Duggan DJ, Chen YD, Sauvageot J, Ewing CM, Bittner ML, Trent JM, Isaacs WB. Human prostate cancer and benign prostatic hyperplasia: molecular dissection by gene expression profiling. Cancer Res. 2001;61(12):4683–4688. [PubMed] [Google Scholar]
- 45.Jhavar S, Corbishley CM, Dearnaley D, Fisher C, Falconer A, Parker C, Eeles R, Cooper CS. Construction of tissue microarrays from prostate needle biopsy specimens. Br J Cancer. 2005;93(4):478–482. doi: 10.1038/sj.bjc.6602726. [DOI] [PMC free article] [PubMed] [Google Scholar]
- 46.Singh SS, Mehedint DC, Ford OH, Maygarden SJ, Ruiz B, Mohler JL. Feasibility of constructing tissue microarrays from diagnostic prostate biopsies. Prostate. 2007;67(10):1011–1018. doi: 10.1002/pros.20603. [DOI] [PubMed] [Google Scholar]
- 47.Lin DW, Coleman IM, Hawley S, Dumpit R, Gifford D, Kezele P, Hung H, Knudsen BS, Kristal AR, Nelson PS. Influence of surgical manipulation on prostate gene expression: Implications for molecular correlates of treatment effects and disease prognosis. J Clin Oncol. 2006;24(23):3763–3770. doi: 10.1200/JCO.2005.05.1458. [DOI] [PubMed] [Google Scholar]
- 48.Dash A, Maine IP, Varambally S, Shen R, Chinnaiyan AM, Rubin MA. Changes in differential gene expression because of warm ischemia time of radical prostatectomy specimens. Am J Pathol. 2002;161(5):1743–1748. doi: 10.1016/S0002-9440(10)64451-3. [DOI] [PMC free article] [PubMed] [Google Scholar]
- 49.Schoor O, Weinschenk T, Hennenlotter J, Corvin S, Stenzl A, Ram-mensee HG, Stevanovic S. Moderate degradation does not preclude microarray analysis of small amounts of RNA. Biotechniques. 2003;35(6):1192–1201. doi: 10.2144/03356rr01. [DOI] [PubMed] [Google Scholar]
- 50.Strand C, Enell J, Hedenfalk I, Ferno M. RNA quality in frozen breast cancer samples and the influence on gene expression analysis – a comparison of three evaluation methods using microcapillary electrophoresis traces. BMC Mol Biol. 2007;8:38. doi: 10.1186/1471-2199-8-38. [DOI] [PMC free article] [PubMed] [Google Scholar]
- 51.Ohashi Y, Creek KE, Pirisi L, Kalus R, Young SR. RNA degradation in human breast tissue after surgical removal: a time-course study. Exp Mol Pathol. 2004;77(2):98–103. doi: 10.1016/j.yexmp.2004.05.005. [DOI] [PubMed] [Google Scholar]
- 52.Almeida A, Thiery JP, Magdelenat H, Radvanyi F. Gene expression analysis by real-time reverse transcription polymerase chain reaction: influence of tissue handling. Anal Biochem. 2004;328(2):101–108. doi: 10.1016/j.ab.2004.02.004. [DOI] [PubMed] [Google Scholar]
- 53.Copois V, Bibeau F, Bascoul-Mollevi C, Salvetat N, Chalbos P, Bareil C, Candeil L, Fraslon C, Conseiller E, Granci V, Maziere P, Kramar A, Ychou M, Pau B, Martineau P, Molina F, Del Rio M. Impact of RNA degradation on gene expression profiles: Assessment of different methods to reliably determine RNA quality. J Biotechnol. 2007;127(4):549–559. doi: 10.1016/j.jbiotec.2006.07.032. [DOI] [PubMed] [Google Scholar]
- 54.Bustin SA. Absolute quantification of mRNA using real-time reverse transcription polymerase chain reaction assays. J Mol Endocrinol. 2000;25(2):169–193. doi: 10.1677/jme.0.0250169. [DOI] [PubMed] [Google Scholar]
- 55.Schrader AJ, Lauber J, Lechner O, Heidenreich A, Hofmann R, Buer J. Application of real-time reverse transcriptase-polymerase chain reaction in urological oncology. J Urol. 2003;169(5):1858–1864. doi: 10.1097/01.ju.0000047363.03411.6b. [DOI] [PubMed] [Google Scholar]