

Abstract
CD38 is an ecto-enzyme that hydrolyzes NAD. Its expression is a prognostic marker for chronic lymphocytic leukemia. We have characterized individual variation in CD38 expression in lymphoblastoid cell lines from 288 healthy subjects of three ethnicities. Expression varied widely, with significant differences among ethnic groups, and was correlated significantly with CD38 enzymatic activity and protein levels. The CD38 gene was then resequenced using DNA from the same cell lines, with the identification of 53 single nucleotide polymorphisms (SNPs) and one indel – 39 novel. One SNP, rs1130169, was significantly associated with CD38 mRNA expression and explained a portion of the difference in expression among ethnic groups. EMS assay showed nuclear protein binding at or near this SNP. We also determined that variation in CD38 expression in these cell lines was associated with variation in antineoplastic drug sensitivity. These results represent a step toward understanding mechanisms involved in CD38 expression.
Keywords: CD38, mRNA expression, gene expression, expression variation, NAD, microarray, single nucleotide polymorphisms, SNPs, polymorphism
Introduction
CD38 is a multi-functional transmembrane protein that is a lymphocyte receptor and a clinical marker for survival of patients with B-cell chronic lymphocytic leukemia (CLL) [1-5]. It is also a ubiquitously expressed mammalian ecto-enzyme with activities that include NAD hydrolysis and the related NAD-dependent synthesis of cyclic ADP-ribose (cADPR), a potent regulator of cytoplasmic Ca2+ mobilization [6]. CD38 is expressed in many immune cell types, including bone marrow progenitors, natural killer cells, monocytes, and activated T- and B- lymphocytes [6]. Because of its important role in NAD homeostasis [1,7-15] and because of the relationship between its expression and CLL prognosis, we set out to define the nature and extent of individual variation in CD38 mRNA expression in a human cell line model system, followed by a determination of the possible contribution of variation in CD38 gene sequence to individual differences in expression.
The present study utilized 288 “Human Variation Panel” lymphoblastoid cell lines (LCLs) derived from healthy members of three ethnic groups. These anonymized cell lines from healthy subjects were created and deposited by the National Institutes of Health (NIH) as a resource for the biomedical research community in which gene sequence variation, expression data and a variety of phenotypes could be studied. As a result, even though they are not tumor-derived and are EBV transformed, LCLs have been studied intensively with respect to molecular mechanisms involved in the regulation of expression [16-18]; they have proved to be extremely useful for the generation and testing of novel pharmacogenomic hypotheses [19,20]; and there are no panels of tumor-derived cell lines that can provide similar information with regard to individual variation in the regulation in expression. For example, the NCI-60 cell lines, highly useful as they are, were created for a different purpose [21].
In the present study, we observed large individual variation in CD38 mRNA expression in these lymphoblastoid cell lines and that variation in basal CD38 mRNA expression was significantly correlated with variation in levels of CD38 protein and NADase activity. We then “resequenced” the CD38 gene using DNA from the same 288 cell lines to determine whether polymorphisms in the gene might contribute to individual variation in mRNA expression. CD38 resequencing revealed 53 single nucleotide polymorphisms (SNPs) – 39 of which were novel – including a polymorphism in the 3′-untranslated region (3′-UTR) of the gene that was associated with decreased expression. Finally, since this same panel of cell lines had been used to study individual variation in sensitivity to the antineoplastic cytidine analogs gemcitabine and cytosine arabinoside (AraC), we were also able to determine that CD38 expression was significantly associated with cytidine analog-induced cytotoxicity.
Materials and Methods
DNA samples and cell lines
DNA samples and LCLs from 96 European-American (EA), 96 African-American (AA), and 96 Han Chinese-American (HCA) subjects (HD100 CAU, HD100AA, and HD100CHI) were obtained from the Coriell Institute (Camden, NJ). These same LCLs were used to perform the microarray, CD38 protein and NADase enzyme assays described subsequently. The blood samples that had been used to generate these cell lines had been collected and anonymized by the National Institute of General Medical Sciences to create a resource available to the entire biomedical research community. All subjects had provided written informed consent for the use of their DNA and cell lines for research purposes, and the present studies were reviewed and approved by the Mayo Clinic Institutional Review Board.
mRNA microarray expression analysis
Total RNA was extracted from the LCLs using the RNeasy kit (Qiagen, Valencia, CA). RNA quality assessment was performed using the Agilent 2100 bioanalyzer. All RNA samples had an RNA integrity number of >9.0. The RNA was then reverse-transcribed and biotin labeled for hybridization with Affymetrix U133 Plus 2.0 GeneChips (Affymetrix, Santa Clara, CA). The microarray images were analyzed using quality control techniques established in the Mayo Clinic Microarray Core Facility, and the data were normalized using GCRMA [22-25].
Gemcitabine and AraC cell proliferation assays
Cell proliferation assays for gemcitabine and AraC were performed in triplicate with multiple drug concentrations using the CellTiter 96 Aqueous Cell Proliferation Assay (Promega, Madison, WI), as described in detail elsewhere [19].
Quantitative RT-PCR
Quantitative RT-PCR was performed with the one-step, Brilliant SYBR Green QRT-PCR kit (Stratagene, La Jolla, CA) using CD38-specific primers purchased from Qiagen (Valencia, CA). All experiments were performed in triplicate using the Stratagene Mx3005p instrument (Stratagene, LaJolla, CA), with β-actin as an internal control.
CD38 gene resequencing
The CD38 consensus sequence used in these studies was that in the chromosome 4 draft sequence, contig NT_006316.15, corresponding to human chromosome region p15.32. Specifically, we resequenced all exons and exon-intron splice junctions as well as 5′ and 3′-UTRs and approximately 1000 bp of the 5′-flanking region (5′-FR). The “A” in the translation initiation codon was designated position (+1). cDNA nucleotides located 5′ to that position were assigned negative numbers, whereas those located 3′ were assigned positive numbers. Positions within introns were numbered based on their distance to splice junctions, with distances to 3′-splice junctions assigned positive, and distances to 5′-splice junctions assigned negative numbers.
To perform the resequencing studies, polymerase chain reaction (PCR) amplifications were performed with each of the 288 DNA samples as template, using primers that flanked CD38 exons as well as approximately 1000 bp of the 5′-FR (PCR primer sequences and amplification conditions are listed in Supplementary Table I). All amplicons were sequenced on both strands in the Mayo Clinic Molecular Biology Core Facility, and the DNA sequence data were analyzed as described previously [26,27]. Specifically, sequence chromatograms from the gene resequencing studies were analyzed using Mutation Surveyor (Softgenetics, State College, PA). Samples with ambiguous chromatograms, or those with SNPs that were observed in only a single DNA sample, were subjected to independent amplification, followed by sequencing to exclude PCR-related artifacts.
Enzyme activity assays
NADase activity was determined using nicotinamide 1, N6-etheno-adenine dinucleotide (1-etheno-NAD) as substrate, as described previously [1]. Enzyme preparations were incubated at 37°C in a medium that contained 0.2 mM 1-etheno-NAD, 0.25 M sucrose, and 40 mM Tris–HCl, pH 7.2. Activity was determined by measuring change in fluorescence, with 300 and 410 nm as excitation and emission wavelengths, respectively. The cell lysates were adjusted to a final concentration of 0.5 mg protein per ml. After baseline fluorescence was recorded, 80 μM of 1-etheno-NAD was added to start the reaction, and fluorescence was followed for 200 s. NADase activity was calculated as the slope of the linear portion of the fluorescence-time curve, corrected for the quantity of protein.
Electromobility Shift Assays (EMSAs)
Biotin-labeled double-stranded oligonucleotides corresponding to WT and variant sequences, together with their corresponding unlabeled oligonucleotides, were used to perform these assays. Binding incubations were performed, followed by electrophoresis on a 4% nondenaturing gel and transfer to a nylon membrane, with detection using the LightShift Chemiluminescent EMSA kit (Pierce, Rockford, IL). Nuclear extracts were prepared from a pool of lymphoblastoid cell lines. Specifically, 15 million cells were pelleted at 524 × g for 3 min. The cells were washed with 1 mL of cold phosphate buffered saline and were repelleted. The pellet was resuspended in 200 μL of ice-cold lysis buffer consisting of 10 mmol/L HEPES, pH 7.9, 10 mmol/L KCl, 0.1 mmol/L EDTA, 0.1 mmol/L EGTA, 0.4% NP40, 1 mmol/L DTT and 0.5 mmol/L phenylmethylsulfonyl fluoride (PMSF). After incubation on ice for 15 min, the lysate was centrifuged at 14,000 × g for 30 s. After washing, the pellet was resuspended in buffer containing 20 mmol/L HEPES (pH 7.9), 400 mmol/L NaCl, 1 mmol/L EDTA, 1 mmol/L EGTA, 1 mmol/L DTT, 0.5 mmol/L PMSF and was vortexed for 15 s at 4°C.
Western blot analysis
Cell lysates (100 μg protein) were subjected to SDS-PAGE on 10% (w/v) gels, and the proteins were electroblotted onto a nitrocellulose membrane. After being blocked with 5% (w/v) non-fat milk, the membrane was probed with goat polyclonal anti-CD38 antibody (Santa Cruz, Santa Cruz, CA). The immunoreactive bands were detected by using horseradish peroxidase-conjugated anti-(goat IgG) secondary antibody and an enhanced chemiluminescence detection system (ECL®; Amersham Biosciences, Arlington Heights, IL). The CD38 Western blots were visualized with x-ray film. The bands observed on the film were then scanned using a Hewlett-Packard laser scanner, and bands were quantitated using the ImageJ software program (from NIH Image).
Statistical analysis
Values for π, θ and Tajima's D were determined as described by Tajima [28]. Genotype-phenotype associations for CD38 SNPs were evaluated by ethic group for all samples. Specifically, a linear model was used to assess the association of each SNP with the quantitative phenotype of CD38 expression. For these analyses, SNP genotypes were evaluated with a 1-degree-of-freedom test, with SNP genotypes coded as 0, 1, or 2 on the basis of the number of rare variants present. CD38 expression values for the genotype-phenotype association studies were log2 transformed and adjusted for gender, ethnic group, and storage time. Average values for recombinant allozyme activity and immunoreactive protein levels were compared with values for the WT allozyme by the use of Student's t test. Results of the cell proliferation assays were expressed as “area of the curve” (AUC) values over the range of drug concentrations studied.
Results
Basal CD38 mRNA expression
Basal CD38 mRNA expression for each of the 288 LCLs studied was determined using Affymetrix U133 Plus 2.0 GeneChip microarray data. Those results are depicted graphically in Figure 1A. The figure illustrates the wide variation of CD38 expression in these cells, with some cell lines having virtually no basal CD38 mRNA, while others showed relatively high expression. Self-described ethnicity was known for each of the 288 individuals who donated the blood samples used to generate the LCLs, so we could determine whether CD38 mRNA expression varied among ethnic groups (Figure 1B). Han Chinese-American (HCA) subjects had significantly higher basal CD38 mRNA expression than did the African-American (AA) or European-American (EA) subjects. A one-way statistical model showed that, while mRNA expression did not differ significantly between AA and EA subjects, basal CD38 mRNA expression in both of these ethnic groups was significantly lower than in the HCA subjects (P < 0.0001) (Figure 1B). Average expression values for HCA, AA and EA subjects were 868 ± 44, 456 ± 53 and 390 ± 36 (mean ± SEM), respectively. Therefore, the mean values for AA and EA subjects were only 53% and 45% of the mean value for the HCA subjects. We will return to the topic of ethnic variation in basal CD38 expression subsequently.
Figure 1.
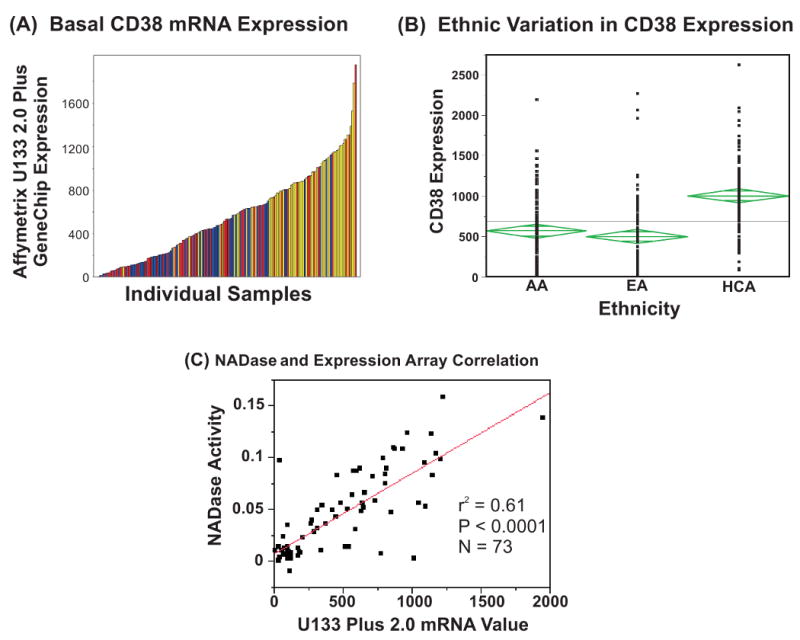
(A) Basal CD38 mRNA expression in 288 lymphoblastoid cell lines. Each bar represents an individual sample, and the height of the bar represents mRNA expression level as measured by Affymetrix U133 2.0 Plus GeneChip Analysis. Data are color-coded by ethnic group, red=African-American, dark blue=European-American, yellow=Han Chinese-American. (B) One way analysis of basal CD38 mRNA expression values determined by U133 2.0 Plus expression array by ethnicity. (C) Correlation of U133 2.0 Plus Array mRNA data and lymphoblastoid cell NADase activity. R2 = 0.61, and P <0.0001.
Correlations of CD38 expression, NADase activity, RT-PCR and protein levels
The basal CD38 mRNA expression data shown graphically in Figure 1 were correlated with NADase activity measured with a fluorescence assay. Seventy-three randomly selected cell lines from all three ethnic groups were used to perform these studies, “blind” to the microarray results. When CD38 microarray mRNA expression was correlated with NADase activity, there was a significant correlation (r2 = 0.61, P = <0.0001) (Figure 1C).
We next confirmed the expression array data with qRT-PCR using a subset of the 73 samples in which we had assayed NADase activity. This randomly selected group of 37 samples displayed a significant correlation between RT-PCR and expression array data (Figure 2A). NADase activity also correlated significantly with the RT-PCR results (Figure 2B). Finally, we determined CD38 protein levels using quantitative Western blot analysis. These assays were performed with the same group of 37 randomly selected cell lines used for the NADase activity assays. A representative Western blot that illustrates the variation in level of protein expression among individual samples is shown in Figure 2C. The quantitative Western blot data also correlated significantly with NADase activity (r2 = 0.45, P <0.0001) (Figure 2D).
Figure 2.
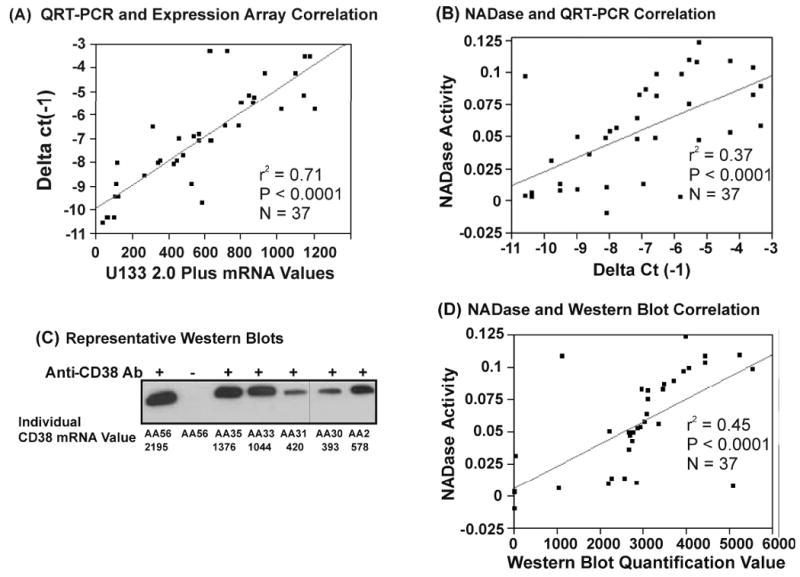
(A) Correlation of U133 2.0 Plus mRNA expression data and RT-PCR delta cT values. R2 = 0.71, N = 37, P is <0.0001. (B) Correlation of RT-PCR delta cT data and lymphoblastoid cell NADase activity. R2=0.37, N = 37, and P <0.0001. (C) Representative CD38 Western blots performed using lymphoblastoid cell lysate. (D) Correlation of quantitative Western blot data and lymphoblastoid cell NADase activity. R2 = 0.45, N = 37, and P <0.0001.
CD38 resequencing
The next step in our analysis was to determine the possible association of CD38 gene sequence variation with the variation in mRNA expression that we had observed in these cell lines. To make that possible, we resequenced the CD38 gene using DNA from the same 288 LCLs used to perform the expression array assays shown graphically in Figure 1A. Specifically, we resequenced all exons, splice junctions, and ∼1000 bp of the 5′-FR of CD38 using DNA from these cell lines. A total of 53 SNPs and one indel were observed, including three nonsynonymous cSNPs (Figure 3 and Table I). As anticipated, there were large variations in SNP frequencies among the three ethnic groups, with 24 SNPs in the EA, 15 in the HCA, and 35 in DNA from AA subjects. Nine of the SNPs had minor allele frequencies >10% in one or more of the ethnic groups studied. Although databases populated with genetic polymorphisms are becoming increasingly complete, there continues to be a need for systematic in-depth gene resequencing studies. In this case, when compared with the SNPs in dbSNP and the HapMap, 39 of the 53 SNPs that we observed were novel. Our gene resequencing data have been deposited, as required by the NIH, in the NIH-supported PGRN database PharmGKB (Accession ID PA26214).
Figure 3.

Human CD38 genetic polymorphisms. Black rectangles represent coding exons and open rectangles are UTR sequence. Arrows indicate the locations of polymorphisms, with frequencies indicated by the color of the arrow. Polymorphisms altering encoded amino acid sequence are indicated.
Table I.
Human CD38 polymorphisms. Polymorphism locations, alterations in nucleotide and amino acid sequences, as well as minor allele frequencies (MAFs) for all three ethnic groups are listed. Numbering of SNPs in exons and the 5′-FR is based on their locations relative to the “A” in the translation initiation codon (ATG), which is designated +1. Polymorphisms 5′ to that nucleotide are assigned negative numbers, while those 3′ are assigned positive numbers. Polymorphisms in introns are numbered based on their locations relative to the nearest exon-intron splice junctions, using negative and positive numbers for splice donor and acceptor sites, respectively. SNPs in exons are “boxed”. IVS = intron.
| MAF | |||||||
|---|---|---|---|---|---|---|---|
| Location | Nucleotide | Sequence Change | Amino Acid Change | African-American | European-American | Han Chinese-American | rs number |
| 5′FR | -1004 | A→G | 0.156 | 0.016 | 0.000 | ||
| 5′FR | -898 | deletion of T | 0.156 | 0.016 | 0.000 | ||
| 5′FR | -881 | T→C | 0.005 | 0.000 | 0.000 | ||
| 5′FR | -716 | A→G | 0.000 | 0.005 | 0.000 | ||
| 5′FR | -617 | A→G | 0.000 | 0.005 | 0.021 | rs16892411 | |
| 5′FR | -577 | A→G | 0.005 | 0.000 | 0.000 | ||
| 5′FR | -417 | A→G | 0.000 | 0.005 | 0.000 | ||
| 5′FR | -408 | T→C | 0.000 | 0.005 | 0.000 | ||
| 5′FR | -382 | C→T | 0.000 | 0.000 | 0.005 | ||
| 5′FR | -352 | A→G | 0.000 | 0.000 | 0.005 | ||
| 5′FR | -326 | T→C | 0.005 | 0.005 | 0.000 | rs6449181 | |
| Exon 1 | 23 | C→T | Pro(8)Leu | 0.000 | 0.005 | 0.000 | |
| Exon 1 | 145 | C→G | Gln(49)Glu | 0.005 | 0.000 | 0.000 | |
| Exon 1 | 210 | C→T | 0.005 | 0.005 | 0.000 | ||
| IVS 1 | 77 | C→A | 0.010 | 0.000 | 0.000 | ||
| IVS 1 | 88 | G→A | 0.052 | 0.047 | 0.016 | rs11574921 | |
| IVS 1 | -129 | G→A | 0.010 | 0.000 | 0.000 | ||
| IVS 2 | 79 | A→G | 0.005 | 0.000 | 0.000 | ||
| IVS 2 | 103 | A→C | 0.005 | 0.000 | 0.000 | ||
| IVS 2 | 128 | G→A | 0.063 | 0.172 | 0.109 | rs3796868 | |
| IVS 3 | 1 | G→T | 0.005 | 0.000 | 0.000 | ||
| IVS 3 | -134 | G→A | 0.026 | 0.000 | 0.000 | ||
| Exon 4 | 504 | A→C | 0.109 | 0.021 | 0.200 | rs1800051 | |
| Exon 4 | 572 | C→T | Thr(191)Met | 0.000 | 0.000 | 0.005 | |
| IVS 4 | 58 | C→T | 0.109 | 0.021 | 0.200 | rs2286553 | |
| IVS 4 | 58 | C→T | 0.109 | 0.021 | 0.200 | rs2286553 | |
| IVS 4 | 106 | G→T | 0.005 | 0.000 | 0.000 | ||
| IVS 5 | 5 | A→G | 0.031 | 0.000 | 0.000 | rs950566 | |
| IVS 5 | 32 | T→C | 0.000 | 0.026 | 0.000 | rs11574926 | |
| IVS 5 | 33 | A→G | 0.005 | 0.000 | 0.000 | ||
| IVS 5 | -57 | G→T | 0.000 | 0.005 | 0.000 | ||
| IVS 6 | 46 | C→T | 0.031 | 0.000 | 0.000 | ||
| IVS 6 | 69 | A→G | 0.005 | 0.026 | 0.000 | rs11574929 | |
| IVS 6 | 106 | C→G | 0.031 | 0.000 | 0.000 | ||
| IVS 6 | 134 | C→T | 0.000 | 0.005 | 0.000 | ||
| IVS 6 | 142 | C→A | 0.005 | 0.000 | 0.000 | ||
| IVS 6 | 150 | C→A | 0.193 | 0.010 | 0.000 | rs11574930 | |
| IVS 6 | -83 | C→G | 0.000 | 0.000 | 0.010 | ||
| IVS 7 | 52 | T→A | 0.005 | 0.000 | 0.000 | ||
| IVS 7 | -52 | G→A | 0.146 | 0.010 | 0.000 | rs10516293 | |
| IVS 7 | -37 | C→T | 0.005 | 0.000 | 0.000 | ||
| IVS 7 | -28 | G→A | 0.000 | 0.000 | 0.016 | ||
| 3′UTR | 972 | A→T | 0.000 | 0.005 | 0.000 | ||
| 3′UTR | 1007 | C→T | 0.005 | 0.000 | 0.000 | ||
| 3′UTR | 1008 | T→G | 0.104 | 0.021 | 0.000 | rs1803404 | |
| 3′UTR | 1033 | C→T | 0.016 | 0.000 | 0.000 | ||
| 3′UTR | 1060 | A→G | 0.000 | 0.000 | 0.016 | ||
| 3′UTR | 1077 | G→A | 0.005 | 0.000 | 0.000 | ||
| 3′UTR | 1091 | T→C | 0.005 | 0.000 | 0.000 | ||
| 3′UTR | 1237 | C→G | 0.026 | 0.000 | 0.000 | rs16892463 | |
| 3′UTR | 1256 | C→T | 0.000 | 0.000 | 0.005 | ||
| 3′UTR | 1341 | C→T | 0.000 | 0.000 | 0.005 | ||
| 3′UTR | 1361 | A→G | 0.000 | 0.005 | 0.000 | ||
| 3′UTR | 1363 | T→C | 0.490 | 0.594 | 0.766 | rs1130169 | |
At least three CD38 SNPs have been reported previously and used to perform genotype-phenotype correlation studies [29,30]; rs6449182, a common SNP in intron 1 which was not included in our amplicons for that intron; a relatively uncommon nonsynonymous SNP, rs1800561, in exon 3 that results in an Arg140Trp change in encoded amino acid that we did not observe in our samples; and rs180051, a synonymous SNP in exon 4 within a codon encoding isoleucine that had MAFs of 20% in the HCA, 2.1% in the EA and 10.9% in the AA subjects whom we studied.
We also calculated CD38 nucleotide diversity, a measure of genetic variation adjusted for the number of alleles studied. Two standard measures of nucleotide diversity are π, average heterozygosity per site, and θ, a population mutation measure that is theoretically equal to the neutral mutation variable [28]. Values for Tajima's D, a test for the neutral mutation hypothesis [22,24], were also calculated. All of these values are listed in Table II. Under conditions of neutrality, Tajima's D should equal 0 [28]. π and θ differed significantly among the three ethnic groups studied, with higher values for the AA samples, as anticipated.
Table II.
Estimates of π, θ, and Tajima's D-values for CD38 in the three ethnic groups studied. Values are parameter estimates ± SEM. P values refer to Tajima's D.
| Population | π × 10-4 | θ × 10-4 | Tajima D | P value |
|---|---|---|---|---|
| AA | 7.29 ± 1.71 | 14.9 ± 1.62 | -1.473 | 0.140 |
| EA | 3.24 ± 0.91 | 9.79 ± 1.16 | -1.837 | 0.061 |
| HCA | 3.51 ± 0.96 | 5.96 ± 0.81 | -1.037 | 0.309 |
CD38 SNPs and mRNA expression
Variation in gene sequence can influence transcription, and those SNPs can be located 5′ of a gene, within the gene, or 3′ of the gene [31]. Therefore, to determine whether polymorphisms observed during our gene resequencing studies might be associated with basal CD38 mRNA expression, a SNP-association analysis was performed. That analysis revealed that a SNP in the 3′-UTR of the gene [SNP 3′-UTR (1363), rs1130169, dbSNP build 130] was significantly associated with increased basal CD38 mRNA expression, even after correction for multiple comparisons (Table III). Our convention is to label the “minor allele” as that with the lower frequency in the ancestral, AA, population. Therefore, even though the minor allele nucleotide, C, is more frequent than T in the EA and HCA subjects, we still will refer to C as the “minor allele”. The relationship of rs1130169 genotypes to expression is shown in Figure 4. This 3′-UTR SNP was present in all three ethnic groups, with “C allele” frequencies that varied from 49% in AA subjects to 77% in HCA subjects (see Table I). These observations brought us back to our observations with regard to ethnic variation in CD38 expression that are shown graphically in Figure 1B. The allele frequency for the variant nucleotide with decreased expression is higher in AA and EA than in HCA subjects – a possible explanation, in part, for the higher expression of CD38 in HCA subjects shown in Figure 1B. This one SNP, 3′-UTR (1363), accounted for approximately 7% and 12% of the difference between HCA subjects and EA or AA subjects, respectively. When rVISTA was used to determine whether this 3′-UTR SNP might fall within a transcription factor binding motif, a conserved area was found in the 3′-UTR that was predicted to bind transcription factors. This cluster extended approximately from chromosome 4 nucleotide 1545828 to 15460173. The rs1130169 3′-UTR (1363) SNP was located within this area at nucleotide 15459783. Therefore, EMSA was performed using oligonucleotides corresponding to both WT and variant sequences. A “shift” was observed with both WT and variant sequences when lymphoblastoid cell nuclear extract was used, but there was no apparent difference in binding between the WT and variant sequences (Figure 5).
Table III.
Association of CD38 SNPs with CD38 mRNA expression. SNPs discovered during CD38 resequencing were associated with basal CD38 mRNA expression assayed by expression array analysis.
| SNP | rs number |
P values (unadjusted) |
P values (Bonferroni corrected) |
MAF | ||
|---|---|---|---|---|---|---|
| AA | EA | HCA | ||||
| 5′-FR (-1004) | ----- | 0.039 | 0.671 | 0.016 | 0.016 | 0 |
| 5′-FR (-898) | ----- | 0.039 | 0.671 | 0.016 | 0.016 | 0 |
| I6(69) | ----- | 0.044 | 0.756 | 0.005 | 0.026 | 0 |
| 3′-UTR (1363) | rs1130169 | 0.002 | 0.037 | 0.49 | 0.59 | 0.77 |
Figure 4.
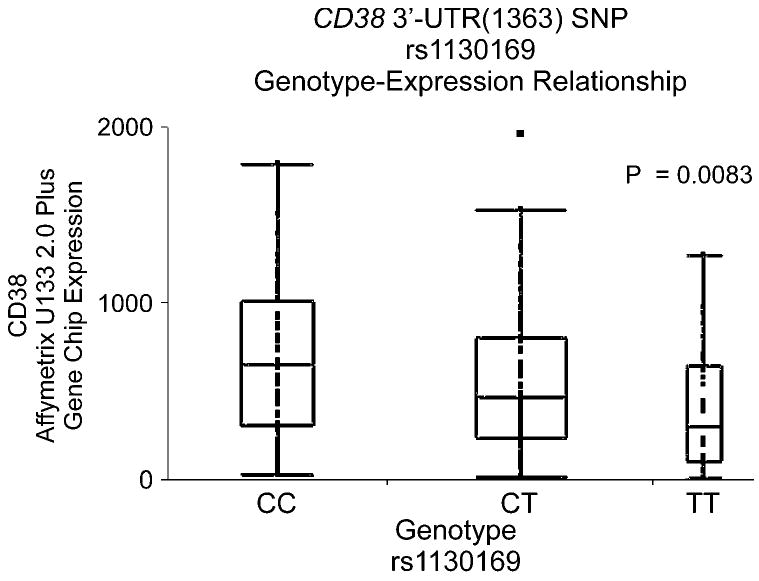
3′-UTR(1363) SNP genotype-CD38 expression association data.
Figure 5.
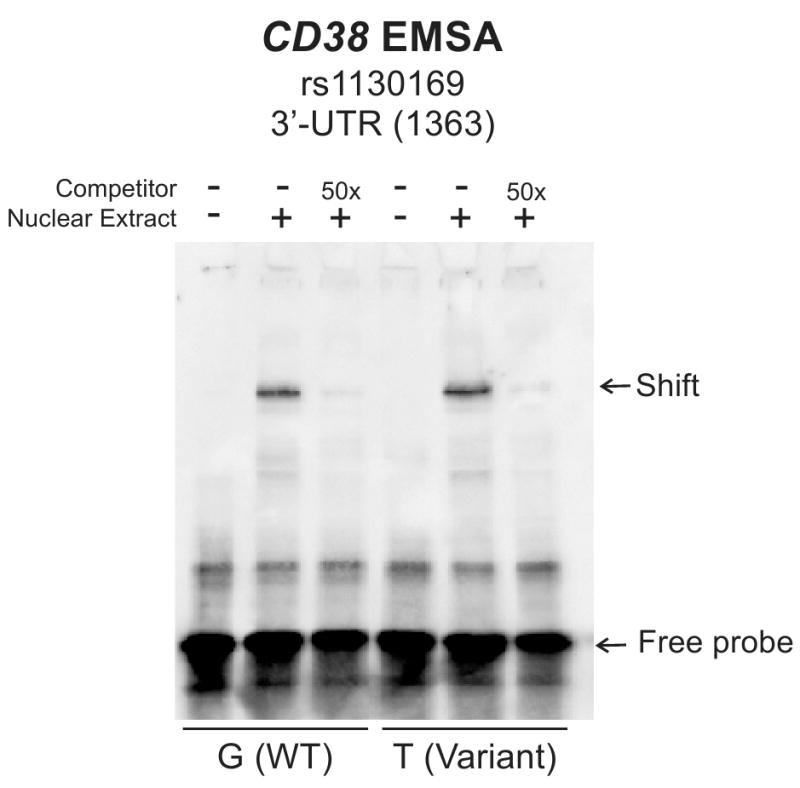
Electromobility Shift Assay (EMSA) for the CD38 3′-UTR(1363) SNP. EMSA was performed using biotin labeled 25 nucleotide oligonucleotides containing either the 3′-UTR(1363) variant or WT nucleotide.
Cytotoxicity studies
Because 172 of these same “Human Variation Panel” cell lines had been used in a previous study to perform cytotoxicity experiments with cytidine analog antimetabolites [19], we were able to determine whether basal CD38 expression in these cells might be related to sensitivity to gemcitabine and/or AraC, the antineoplastic agents used in those studies [19]. CD38 expression was significantly associated with cytotoxicity as reflected by AUC values for both gemcitabine (r = -0.32, P = 1.2 × 10⁻⁵) (Figure 6) and AraC (r = -0.17, P = 0.025). These observations, for antineoplastic agents that are not used in the treatment of CLL, raise the possibility that CD38 expression might be associated with anticancer drug sensitivity, at least for gemcitabine and AraC. Since both correlations were negative, the higher the CD38 expression, the lower the AUC, so cell lines with higher CD38 expression were more sensitive to these two drugs than were those with lower expression.
Figure 6.

CD38 expression correlation with gemcitabine cytotoxicity (AUC) [19]. Values for both CD38 expression and gemcitabine cytotoxicity (AUC) are displayed as “relative standard deviates” – with “0” representing the mean value.
Discussion
CD38 is a multi-functional transmembrane protein that was originally identified as a cell surface receptor and marker of lymphocyte differentiation and maturity [1,2]. CD38 is also a major cellular NADase that can catalyze the synthesis of a series of second messengers, including cyclic ADPribose (cADPR) and nicotinic acid adenine dinucleotide phosphate (NAADP) [6,32]. In part because increased CD38 expression has been associated with a worse prognosis in CLL patients, we set out to characterize the nature and extent of individual variation in the expression of CD38 in immortalized LCLs – cell lines derived from B cells – with the full understanding that these Epstein Barr virus transformed cells do not totally reflect the situation in B cells and that these cell lines were, by design, created from samples obtained from healthy subjects. However, there is no comparable set of tumor cell lines that can be used to access individual variation in expression in a very large number of cell lines, and LCL panels have already been studied extensively for that purpose [16-18].
As a first step in this series of experiments, we obtained mRNA expression array data, and there was wide variation in basal CD38 mRNA expression in 288 “Human Variation Panel” LCLs (Figure 1A). Regulation of expression is clearly tissue and cell type-specific, but our experiments demonstrated that large individual variation in CD38 expression existed in these LCLs and that variation in expression was significantly correlated with variation in CD38 protein levels and NADase activity (Figure 2). CD38 expression at the time of the diagnosis of CLL is related to prognosis [1-5] and, as a result, we need to better understand factors regulating basal levels of CD38 expression.
We next attempted to determine the possible contribution of DNA sequence variation in the CD38 gene to individual variation in CD38 mRNA expression by resequencing CD38 in all of the LCLs for which mRNA expression had been determined. Although previous limited CD38 gene sequencing efforts have been performed [29,30], only a very small number of SNPs have been identified and used in genotype-phenotype correlation analyses, and no comprehensive study of both CD38 gene sequence variation and expression variation has been reported previously. We observed 53 SNPs and one indel within the area of the CD38 gene resequenced, and 39 of those polymorphisms were novel. However, only one common polymorphism in the 3′-UTR was significantly associated with variation in CD38 mRNA expression. That SNP was present in all three ethnic groups. Furthermore, this SNP mapped to an area predicted to contain motifs for transcription factor binding. An EMSA performed with nuclear extract from the same lymphoblastoid cells used to perform the expression array studies showed nuclear protein binding to oligomers that contained the SNP, but without an apparent difference between WT and variant sequences (Figure 5). Finally, we took advantage of a previous study of variation in the sensitivity of these cell lines to gemcitabine and AraC to demonstrate that CD38 expression was significantly correlated with sensitivity to both of these cytidine analog antineoplastic agents.
In conclusion, we have used a cell line-based model system, “Human Variation Panel” LCLs derived from B cells, to determine that CD38 expression and function in these cells vary widely among individuals. Obviously, these cell lines have limitations, but they also have significant strengths [16-20]. Basal CD38 mRNA levels, determined by either Affymetrix U133 2.0 Plus GeneChips or by quantitative RT-PCR, were significantly correlated with CD38 function in these cell lines as determined by the assay of NADase activity (Figures 1 and 2). Resequencing of the CD38 gene from the same 288 cell lines used to determine CD38 expression revealed a large number of novel SNPs, and one SNP within the 3′-UTR, rs1130169, was significantly associated with basal mRNA expression. Finally, we obtained preliminary data indicating that CD38 expression can be correlated with variation in sensitivity to chemotherapy – at least in the LCLs that were used in our experiments. These results, taken together, represent a step toward better understanding of the regulation and function of this important prognostic marker for CLL.
Supplementary Material
Acknowledgments
This work was supported, in part, by NIH Clinical Pharmacology Training Grant T32 GM08685 (W.R.H.), a Mayo Scholar Award (W.R.H.), the Big Award from the American Federation of Aging Research (AFAR) (E.N.C.), the Mayo Clinic CR20 Program (E.N.C.) and by NIH grants U01 GM61388 (The Pharmacogenetics Research Network) (L.L.P., I.M., K.K., M.L., R.M.W.), R01 GM28157 (R.M.W.), R01 CA132780 (R.M.W.), and a PhRMA Foundation “Center of Excellence in Clinical Pharmacology” Award (R.M.W.).
Footnotes
Declaration of Interest
The authors report no conflict of interest.
References
- 1.Aksoy P, White TA, Thompson M, Chini EN. Regulation of intracellular levels of NAD: a novel role for CD38. Biochem Biophys Res Commun. 2006;345:1386–1392. doi: 10.1016/j.bbrc.2006.05.042. [DOI] [PubMed] [Google Scholar]
- 2.Shubinsky G, Schlesinger M. The CD38 lymphocyte differentiation marker: new insight into its ectoenzymatic activity and its role as a signal transducer. Immunity. 1997;7:315–324. doi: 10.1016/s1074-7613(00)80353-2. [DOI] [PubMed] [Google Scholar]
- 3.Hamblin TJ, Orchard JA, Ibbotson RE, et al. CD38 expression and immunoglobulin variable region mutations are independent prognostic variables in chronic lymphocytic leukemia, but CD38 expression may vary during the course of the disease. Blood. 2002;99:1023–1029. doi: 10.1182/blood.v99.3.1023. [DOI] [PubMed] [Google Scholar]
- 4.Morabito F, Mangiola M, Oliva B, et al. Peripheral blood CD38 expression predicts survival in B-cell chronic lymphocytic leukemia. Leuk Res. 2001;25:927–932. doi: 10.1016/s0145-2126(01)00049-2. [DOI] [PubMed] [Google Scholar]
- 5.Pittner BT, Jelinek DF, Kay NE. CLL B cells with a bimodal CD38 expression pattern: persistence of bimodal populations despite effective therapy for B-CLL. Leukemia. 2004;18:180–182. doi: 10.1038/sj.leu.2403151. [DOI] [PubMed] [Google Scholar]
- 6.Malavasi F, Deaglio S, Funaro A, et al. Evolution and function of the ADP ribosyl cyclase/CD38 gene family in physiology and pathology. Physiol Rev. 2008;88:841–886. doi: 10.1152/physrev.00035.2007. [DOI] [PubMed] [Google Scholar]
- 7.Aarhus R, Graeff RM, Dickey DM, Walseth TF, Lee HC. ADP-ribosyl cyclase and CD38 catalyze the synthesis of a calcium-mobilizing metabolite from NADP. J Biol Chem. 1995;270:30327–30333. doi: 10.1074/jbc.270.51.30327. [DOI] [PubMed] [Google Scholar]
- 8.Chini EN, Thompson MA, Dousa TP. Enzymatic synthesis of NAADP and ADP-ribosyl cyclases. FASEB J. 1996;10:A143. [Google Scholar]
- 9.Dousa TP, Chini EN, Beers KW. Adenine nucleotide diphosphates: emerging second messengers acting via intracellular Ca2+ release. Am J Physiol. 1996;271:C1007–1024. doi: 10.1152/ajpcell.1996.271.4.C1007. [DOI] [PubMed] [Google Scholar]
- 10.Galione A, Patel S, Churchill GC. NAADP-induced calcium release in sea urchin eggs. Biol Cell. 2000;92:197–204. doi: 10.1016/s0248-4900(00)01070-4. [DOI] [PubMed] [Google Scholar]
- 11.Gu W, Luo J, Brooks CL, Nikolaev AY, Li M. Dynamics of the p53 acetylation pathway. Novartis Foundation Symposium. 2004:197–205. discussion 205-7, 223-5. [PubMed] [Google Scholar]
- 12.Lee HC. A unified mechanism of enzymatic synthesis of two calcium messengers: cyclic ADP-ribose and NAADP. Biol Chem. 1999;380:785–793. doi: 10.1515/BC.1999.098. [DOI] [PubMed] [Google Scholar]
- 13.Pillai JB, Isbatan A, Imai S, Gupta MP. Poly(ADP-ribose) polymerase-1-dependent cardiac myocyte cell death during heart failure is mediated by NAD+ depletion and reduced Sir2alpha deacetylase activity. J Biol Chem. 2005;280:43121–43130. doi: 10.1074/jbc.M506162200. [DOI] [PubMed] [Google Scholar]
- 14.Rongvaux A, Andris F, Van Gool F, Leo O. Reconstructing eukaryotic NAD metabolism. Bioessays. 2003;25:683–690. doi: 10.1002/bies.10297. [DOI] [PubMed] [Google Scholar]
- 15.Ziegler M, Niere M. NAD+ surfaces again. Biochem J. 2004;382(Pt3):e5–6. doi: 10.1042/BJ20041217. [DOI] [PMC free article] [PubMed] [Google Scholar]
- 16.Cheung VG, Conlin LK, Weber TM, et al. Natural variation in human gene expression assessed in lymphoblastoid cells. Nat Genet. 2003;33:422–425. doi: 10.1038/ng1094. [DOI] [PubMed] [Google Scholar]
- 17.Cheung VG, Spielman RS. Genetics of human gene expression: mapping DNA variants that influence gene expression. Nat Rev Genet. 2009;10:595–604. doi: 10.1038/nrg2630. [DOI] [PMC free article] [PubMed] [Google Scholar]
- 18.Morley M, Molony CM, Weber TM, et al. Genetic analysis of genome-wide variation in human gene expression. Nature. 2004;430:743–747. doi: 10.1038/nature02797. [DOI] [PMC free article] [PubMed] [Google Scholar]
- 19.Li L, Fridley B, Kalari K, et al. Gemcitabine and cytosine arabinoside cytotoxicity: association with lymphoblastoid cell expression. Cancer Res. 2008;68:7050–7058. doi: 10.1158/0008-5472.CAN-08-0405. [DOI] [PMC free article] [PubMed] [Google Scholar]
- 20.Pei H, Li L, Fridley BL, et al. FKBP51 affects cancer cell response to chemotherapy by negatively regulating Akt. Cancer Cell. 2009;16:259–266. doi: 10.1016/j.ccr.2009.07.016. [DOI] [PMC free article] [PubMed] [Google Scholar]
- 21.Scherf U, Ross DT, Waltham M, et al. A gene expression database for the molecular pharmacology of cancer. Nat Genet. 2000;24:236–244. doi: 10.1038/73439. [DOI] [PubMed] [Google Scholar]
- 22.Speed T. University of California Berkeley; 2006. Background models and GCRMA Lecture 10, Statistics 246. http://www.stat.berkeley.edu/users/terry/Classes/s246.2006/Week10/Week10L1.pdf; [Google Scholar]
- 23.Wu Z, Irizarry RA. Stochastic models inspired by hybridization theory for short oligonucleotide arrays. Proceedings of RECOMB 2004. J Comput Biol. 2005;12:882–893. doi: 10.1089/cmb.2005.12.882. [DOI] [PubMed] [Google Scholar]
- 24.Wu Z, Irizarry RA. A statistical framework for the analysis of microarray probe-level data Biostatistics Working Papers 73. Johns Hopkins University; 2005. [Google Scholar]
- 25.Wu Z, Irizarry RA, Gentleman R, Murillo FM, Spencer F. A model based background adjustment for oligonucleotide expression arrays. J Am Stat Assn. 2004;99:909–917. [Google Scholar]
- 26.Ji Y, Olson J, Zhang J, et al. Breast cancer risk reduction and membrane-bound catechol O-methyltransferase genetic polymorphisms. Cancer Res. 2008;68:5997–6005. doi: 10.1158/0008-5472.CAN-08-0043. [DOI] [PMC free article] [PubMed] [Google Scholar]
- 27.Moyer AM, Salavaggione OE, Wu TY, et al. Glutathione S-transferase p1: gene sequence variation and functional genomic studies. Cancer Res. 2008;68:4791–801. doi: 10.1158/0008-5472.CAN-07-6724. [DOI] [PMC free article] [PubMed] [Google Scholar]
- 28.Tajima F. Statistical method for testing the neutral mutation hypothesis by DNA polymorphism. Genetics. 1989;123:585–595. doi: 10.1093/genetics/123.3.585. [DOI] [PMC free article] [PubMed] [Google Scholar]
- 29.Ferrero E, Saccucci F, Malavasi F. The human CD38 gene: polymorphism, CpG island, and linkage to the CD157 (BST-1) gene. Immunogenetics. 1999;49:597–604. doi: 10.1007/s002510050654. [DOI] [PubMed] [Google Scholar]
- 30.Yagui K, Shimada F, Mimura M, et al. A missense mutation in the CD38 gene, a novel factor for insulin secretion: association with Type II diabetes mellitus in Japanese subjects and evidence of abnormal function when expressed in vitro. Diabetologia. 1998;41:1024–1028. doi: 10.1007/s001250051026. [DOI] [PubMed] [Google Scholar]
- 31.Cheung VG, Spielman RS, Ewens KG, Weber TM, Morley M, Burdick JT. Mapping determinants of human gene expression by regional and genome-wide association. Nature. 2005;437:1365–1369. doi: 10.1038/nature04244. [DOI] [PMC free article] [PubMed] [Google Scholar]
- 32.Soares S, Thompson M, White T, et al. NAADP as a second messenger: neither CD38 nor base-exchange reaction are necessary for in vivo generation of NAADP in myometrial cells. Am J Physiol Cell Physiol. 2007;292:C227–239. doi: 10.1152/ajpcell.00638.2005. [DOI] [PubMed] [Google Scholar]
Associated Data
This section collects any data citations, data availability statements, or supplementary materials included in this article.