Abstract
Epithelial to mesenchymal transition (EMT) occurs normally in development. In pathology, EMT drives cancer and fibrosis. Medication with phenytoin, nifedipine, and cyclosporine-A often causes gingival overgrowth. Based partly on the histopathology of gingival overgrowth, the present study investigates the hypothesis that EMT could contribute to its development. We found that phenytoin-induced human gingival overgrowth tissues, the most fibrotic drug-induced variety, contain diminished epithelial E-cadherin expression, whereas fibroblast-specific protein-1 (FSP-1) and αvβ6 integrin levels are up-regulated. In connective tissue stroma, fibronectin and alternatively spliced fibronectin extra type III domain A (FN-ED-A) levels are increased in overgrowth lesions. Transforming growth factor (TGF)-β1 treatment of primary human gingival epithelial cells cultured in transwell plates resulted in inhibited barrier function as determined by reduced electrical resistance, paracellular permeability assays, and cell surface E-cadherin expression. Moreover, TGF-β1 altered the expression of other markers of EMT determined at the mRNA and protein levels: E-cadherin decreased, whereas SLUG, fibronectin, matrix metalloproteinase (MMP)2, MMP9, and MMP13 increased. Nifedipine- and cyclosporine A–induced gingival overgrowth tissues similarly contain diminished E-cadherin and elevated levels of FSP-1 and fibronectin, but normal levels of αvβ6 integrin. In summary, data in vitro support that human gingival epithelial cells undergo functional and gene expression changes consistent with EMT in response to TGF-β1, and in vivo studies show that important EMT markers occur in clinical gingival overgrowth tissues. These findings support the hypothesis that EMT likely occurs in drug-induced gingival overgrowth.
Increased accumulation of fibroblasts, collagen, and other extracellular matrix components characterize fibrosis.1 Drug-induced gingival overgrowth and fibrosis occurs as a side effect of systemic medications, including the antiseizure drug phenytoin, the immunosuppressant cyclosporin A, and calcium channel blockers including nifedipine. The clinical appearance of these gingival overgrowth lesions is similar, but they contain differing degrees of inflammation and fibrosis.2 Histological characteristics of drug-induced gingival overgrowth include hyperplasia in the junctional epithelium and hypertrophy in keratinized epithelium.2 Patients who suffer from gingival overgrowth do not have fibrosis elsewhere, indicating that this condition is tissue specific, some features of which are due to unique signal transduction pathways in gingival fibroblasts.3,4 It is interesting that a classic feature of gingival overgrowth is that epithelial rete pegs extend deep into the connective tissue compared with normal tissues, and all forms of gingival overgrowth lesions contain fibrotic or expanded connective tissues with characteristic levels of inflammation.5 Moreover, we have observed elevated expressions of CCN2/CTGF in both epithelial and connective tissue cells in phenytoin-induced gingival overgrowth tissues.6 CCN2/CTGF is considered to be a marker of fibroblastic mesenchymal cells and is increased in cells undergoing epithelial to mesenchymal transition (EMT) in development, and in fibrosis.7,8,9 The observation of elevated CCN2/CTGF levels in the epithelium of phenytoin gingival overgrowth lesions combined with the histopathology of all gingival overgrowth lesions has led us to test the hypothesis that EMT can contribute to human gingival overgrowth and fibrosis.
EMT is a process in which epithelial cell–cell and cell–extracellular matrix interactions are weakened as epithelial cells trans-differentiate into fibrogenic fibroblast-like cells.10 Normally nonmotile epithelial cells acquire migratory characteristics.11 Although a normal process in development, EMT underlies pathological processes in mature tissues including progression of tumors of epithelial origin,10 and heart, lung, liver, and kidney fibrosis.1,12 Molecular matrix remodeling programs are initiated in epithelial cells that enable these now motile and transitioning cells to invade through basement membranes and migrate into connective tissue stroma where they contribute to new extracellular matrix production.13
A consistent feature of EMT is reduction in epithelial E-cadherin expression14 that is accompanied by loss of cell to cell contacts and compromised barrier integrity and function.15 E-cadherin is a calcium-binding transmembrane protein that helps to maintain the integrity of epithelial cell contacts critical for epithelial tissue barrier function.16,17 Loss of E-cadherin expression occurs in malignancies and is associated with poor prognosis in cancer.18 Increased expression of fibroblast markers including fibronectin, and an alternatively spliced form of fibronectin (ED-A isoform),19 and fibroblast-specific protein-1 (FSP-1) occur in EMT. FSP-1 in particular has been considered to be a highly specific marker for fibroblasts.20,21
Transforming growth factor (TGF)-β1 is a potent inducer of EMT in epithelial cells from a variety of tissues, and treated cells show common phenotypic changes including down-regulation of E-cadherin, disassembly of cell junctions,22 and increased synthesis of matrix metalloproteinases including MMP-9 and MMP-2.13 The consequent degradation of type IV collagen and the basement membrane13 permits migration and abnormal interactions between the connective tissue stroma and epithelium.23,24
Integrins mediate cell-to-cell and cell-to-extracellular matrix interactions and can promote EMT. Integrin αvβ6 expression is normally limited to a few epithelial tissues in adults25,26 but is expressed during development and at elevated levels in inflamed tissues and in wound healing.27 It is a marker for EMT in colon carcinoma models,28 and a major function of αvβ6 integrin is to activate latent TGF-β1, a key inducer of EMT.13,29 TGF-β1 in turn can induce the expression of alternatively spliced fibronectin extra type III domain A (FN-ED-A) and other extracellular matrix proteins.19 Under mechanical stress, FN-ED-A and TGF-β1 induce an extracellular matrix synthetic phenotype.30
In this study, we investigated the hypothesis that EMT contributes to gingival overgrowth by assessing for loss of epithelial cell markers and gain of fibroblastic markers in the epithelium and the gain of markers of fibrosis in the connective tissue stroma in human tissue samples in vivo. Moreover, we investigated the ability of TGF-β1, a factor that drives gingival overgrowth,2,6,31 to stimulate EMT in primary gingival epithelial cells in vitro. Taken together, these data support our hypothesis that EMT contributes to the pathology of gingival overgrowth.
Materials and Methods
Reagents
Dulbecco’s phosphate buffer solution (PBS), penicillin/streptomycin (10,000 IU/ml), keratinocyte serum-free medium, bovine pituitary extract were purchased from Gibco (Carlsbad, CA); soybean trypsin inhibitor, Amphotericin B, insulin, transferrin, β-mercaptoethanol, 2-ethanolamine, sodium selenite, and type IV collagen from human placenta were purchased from Sigma (St. Louis, MO). Mouse monoclonal anti–E-cadherin IgG (sc-8426); goat polyclonal anti-fibronectin IgG (sc-6953); goat anti-mouse IgG horseradish peroxidase (HRP); donkey anti-goat IgG HRP; goat anti-rabbit IgG HRP were purchased from Santa Cruz (Santa Cruz, CA). Mouse monoclonal fibronectin ED-A IgG (OBT0082) was purchased from AbD Serotech (Raleigh, NC) and mouse monoclonal anti-αvβ6 antibody (MAB2074Z) was from Millipore (Billerica, MA). Mouse monoclonal anti-actin IgM was obtained from EMD-Calbiochem (Gibbstown, NJ). ECL Western blotting detection reagents were from Amersham Biosciences (Piscataway, NJ), and Restore Western blot stripping buffer was purchased from Pierce (Rockford, IL). RNeasy Mini Kit for RNA isolation was from Qiagen (Valencia, CA), real-time PCR TaqMan probes were purchased from Applied Biosystems (Foster City, CA): E-cadherin (Hs00170423_ml); fibronectin (Hs00365052_ml); SLUG (Hs00161004_m1); MMP-9 (Hs00234579_m1); MMP-2 (Hs01548727_m1); MMP-13 (Hs00233992_m1); γ-catenin (Hs00158408_m1); human GAPDH (4352666-0405001). For immunofluorescence microscopy, E-cadherin anti-mouse antibody (BD Biosciences 61081, Franklin Lakes, NJ), Alexa Fluor 488 goat anti-mouse IgG (A11001, Molecular Probes Inc., Eugene, OR), DAPI (D3571 Invitrogen, Carlsbad, CA) 1% Triton X-100 (Invitrogen HFH-10, Carlsbad, CA), and Vectorshield mounting medium (Vector Laboratories H-1000, Burlingame, CA) were used. Fluorescein isothiocyanate-dextran was purchased from Sigma (FD70).
Gingival Tissues
Gingival tissue samples were obtained from subjects undergoing periodontal surgery in the Department of Periodontology and Oral Biology and the Clinical Research Center of Boston University at the Goldman School of Dental Medicine and the Franciscan Children’s Hospital and Rehabilitation Center. Samples from 33 donors were included in this study: phenytoin-induced gingival overgrowth, n = 7; cyclosporine-A–induced, n = 8; nifedipine-induced, n = 7; and control tissues from systemically healthy donors without gingival overgrowth, n = 11. Written consent from all donors was obtained with the approval of the Institutional Review Board of Boston University Medical Center. All participants in this study were 20 years of age or older. Age, gender, and clinical inflammation (gingival index and bleeding on probing) were recorded for each individual immediately before surgical procedures. Gingivectomy and other periodontal surgical procedures were performed after initial periodontal treatment, including professional elimination of supra and subgingival plaque and maintenance of proper oral hygiene. On excision, tissues were fixed in 4% paraformaldehyde in PBS at 4°C for 4 hours and then incubated in 30% sucrose overnight. Tissues were then stored in 2-methylbutane at −80 degrees C. At least twenty, 5-μm serial sections were made on a cryostat and stored at −80°C.
Immunohistochemistry
Immunoperoxidase-based immunohistochemistry of human gingival tissue samples was performed using a temperature controlled staining system to standardize the staining conditions as described previously using Elite Vecta Stain kits (Vector Laboratories) for visualizations.2 Working concentrations for primary antibodies were 8 μg/ml for E-cadherin and FSP-1, 30 μg/ml for αvβ6, 15 μg/ml for FN-EDA, and 10 μg/ml for fibronectin. Serial sections were stained with nonimmune IgG and served as negative controls.
Evaluation
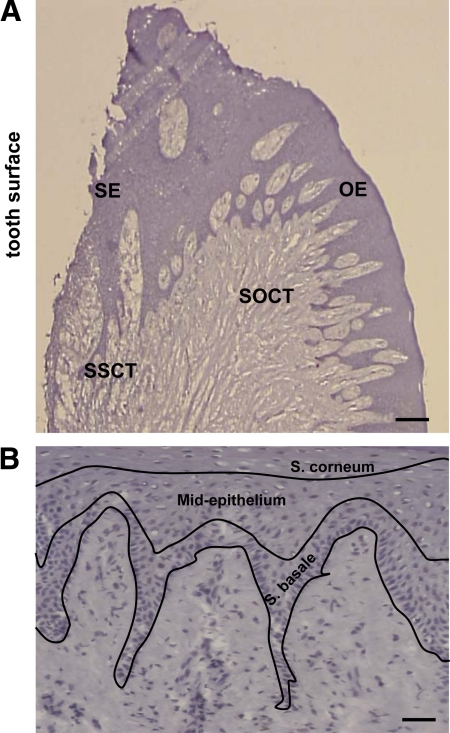
The orientation of each sample and identification of tissue sites were determined at ×100 and ×200 magnification, respectively. Four sites with corresponding areas of 0.09 mm2 were defined and used for quantitative analysis of immunohistochemical staining in all tissue samples. Quantitation was done by computer-assisted image analysis (Image-Pro Plus 4.0, Media Cybernetics, Bethesda, MD). The tissue sites are shown schematically in Figure 1A: SE, sulcular epithelium; OE, oral epithelium; SSCT, subsulcular connective tissue; SOCT, suboral connective tissue. Histological layers of gingival epithelia were also evaluated in three different parts: Stratum basale; mid-epithelium (Stratum granulosum and Stratum spinosum); Stratum corneum shown in Figure 1B. Analysis of immunostaining for intracellular E-cadherin, FSP-1, fibronectin, FN-ED-A, and αvβ6 was done by counting the total number of positively stained cells in a given area and normalizing to the total number of cells, and results expressed as the percent positive stained cells. Corresponding nonimmune stained slides from serial sections were used as controls to determine background staining that was low or negligible. Results were expressed as mean ± SE for each evaluated site. Analysis of variance with Bonferroni correction for multiple tests was used for determining statistical significance.
Figure 1.
Sites in human gingival tissues evaluated for immunohistochemistry staining. A: SE, sulcular epithelium; OE, oral epithelium; SSCT, subsulcular connective tissue; SOCT, suboral connective tissue; Scale bar = 0.14 mm, at ×25 magnification. B: Regions of epithelium; Scale bar = 50 μm, at magnification ×200 magnification.
Primary Gingival Epithelial Cell Culture
Gingival tissues were collected as previously described.6 The tissue samples were collected in Dulbecco’s PBS supplemented with 10% penicillin/streptomycin. They were rinsed in 70% ethanol for 1 to 2 seconds and then washed again 3× in PBS with penicillin/streptomycin. Excess connective tissue and free epithelial layers were trimmed and the tissue samples were cut into ∼2 mm cubes, placed in a 60-mm petri dish with 0.5× trypsin-EDTA (1×, 500 BAEE units porcine trypsin and 180 μg EDTA) overnight at 4°C, with the connective tissue portions submerged in the EDTA, and not the epithelial layer. The epithelial layer was then stripped from the tissues in a dish containing soybean trypsin inhibitor (Sigma) and PBS. Epithelial cells and tissue debris were collected after washing the plate with PBS and centrifuged for 10 minutes at 120g at room temperature. The pellet was suspended in keratinocyte serum-free medium containing bovine pituitary extract (50 μg/ml), penicillin/streptomycin (10,000 IU/ml), amphotericin B (50 μ/ml), insulin (10 μg/ml), transferrin (5 μg/ml), 2-ethanolamine (10 μmol/L), and sodium selenite (10 nmol/L) and plated in two 100-mm culture dishes precoated with type IV collagen from human placenta and maintained at 37°C, 5% CO2. The medium was changed every alternate day, and cells in the logarithmic growth phase were passaged at a ratio of 1:3, stored in liquid nitrogen after second passage, and were used in either the third or the fourth passage. At about 80% confluence, cells were cultured in the presence or absence of 5 ng/ml TGF-β1.
Immunofluorescence Microscopy
Epithelial cells (7 × 10⁴ per well) were seeded in 24-well plates containing Transwell Clear membranes (0.4 μm pore size; Corning Costar, Lowell, MA) that were precoated with type IV collagen and grown for five days. Cells were then treated with 5 ng/ml TGF-β1 or vehicle and fixed and stained after an additional five days of culture. Membranes were fixed with 4% paraformaldehyde for 15 minutes at room temperature. Membranes were washed with PBS, and then cells were made permeable with 0.2% Triton X for 20 minutes. Cells were next incubated for 20 minutes with 1% BSA/PBS followed by 60 minutes incubation with E-cadherin primary antibody (5 μg/ml) or normal nonimmune IgG (5 μg/ml) as a control. Samples were washed for 5 minutes with PBS, incubated for 60 minutes with Alexa Fluor 488 goat anti-mouse IgG (A11001, Molecular Probes Inc.) diluted 1:200 in 1% BSA/PBS, washed for 5 minutes with PBS. DAPI (1 μg/ml) was then applied to samples for 10 minutes to stain nuclei. Processed membranes were mounted with Vectorshield mounting medium and visualized by fluorescence microscopy for green and blue fluorescence for E-cadherin, and nuclei, respectively. The same fields were photographed for both green and blue fluorescence under UV light with a Zeiss Axiovert 200 microscope and fluorescein isothiocyanate (FITC) and DAPI filters, respectively.
Measurement of Transepithelial Resistance
Epithelial cells (7 × 10⁴ per well) were seeded in 24-well plates containing Transwell Clear membranes (0.4 μm pore size, Corning Costar) that were precoated with type IV collagen. Cells were cultured using 200-μl volumes of media in the apical compartments and 500 μl in the basal compartments. Media were changed every 2 days. Transepithelial electrical resistance (TEER) was measured at intervals under specified experimental conditions using a Millipore Minicell ERS meter.32 TEER (Ω.cm2) was calculated by multiplying the measurements of resistance by the area of the transwell membranes. Background resistance caused by the membrane alone was subtracted from the experimental values.
Permeability Measurements
Primary human gingival epithelial cells were cultured in transwell plates on membranes as described above, with a standard schedule of refeeding. After reaching stable resistance, cells were treated with 5 ng/ml TGF-β1 or vehicle control and continuously cultured in the presence or absence of TGF-β1 with media changes every second day. Based on electrical resistance data, permeability measurements were performed after five days of treatment. FITC-labeled dextran was used to study the paracellular flux as described.32 Labeled dextran (50 μg) was added to the apical compartment and equilibrated at 37°C for 30 minutes. The apical transwell chambers were then transferred to a new 24-well plate containing 0.7 ml media in each well and incubated for an additional 1 hour. FITC fluorescence of basal medium samples was then measured in a Multiwell plate reader (Berthold Tristar LB 941) equipped with a 485 nm excitation filter and a 535 nm emission filter.
Western Blotting and qPCR
Primary human gingival epithelial cells from three independent subjects without gingival overgrowth were respectively cultured and treated as described in each experiment, and cultures were analyzed for protein expression changes by Western blotting and for mRNA changes by qPCR. For Western blots, cell layers were extracted into sample buffer (0.5 M Tris pH 6.8, glycerol 10% SDS, 5% β-mercaptoethanol), boiled for 5 minutes, and stored at −20°C. Protein concentrations were determined using the Nano-Orange Protein Quantitation Kit (Molecular Probes, Invitrogen). Samples containing equal amounts of protein were subjected to SDS-PAGE and then transferred to PVDF membranes.33 Membranes were blocked with 5% milk-TBST for 2 hours at room temperature. Membranes were then incubated, respectively, with different primary antibodies in 5% milk-TBST overnight at 4°C. The membranes were then washed with TBS-T; incubated with appropriate secondary antibodies conjugated to HRP at a dilution of either 1:5000 or 1:2000 in 5% milk-TBS-T for 1 hour at room temperature; and visualized with ECL Western Blotting Detection Reagents (Amersham Biosciences). After stripping with Restore Western blot stripping buffer for 30 minute at room temperature, membranes were processed with mouse monoclonal anti–β-actin as a loading control. The films were analyzed by densitometry with a VersaDoc Imaging System; Model 3000 (BioRad) using Quantity One software. Experiments were performed with cells from three independent subjects without gingival overgrowth for Western blot experiments to control for the possibility of nonrepresentative findings obtained from a particular subject’s cells. Analysis of variance with Bonferroni correction for multiple tests was used to determine significance.
RNA was isolated using the RNeasy Mini Kit (Qiagen). The concentration of RNA for each sample was measured using NanoDrop, ND-1000 Spectrophotometer and ND-1000 V3.1.2 software. The quality of RNA was determined by 1% agarose gel electrophoresis and ethidium bromide staining to assess for the presence of intact 18S and 28S rRNA. One-microgram samples of intact RNA were subjected to reverse transcription in 30-μl reactions (Applied Biosystems). Conditions for reverse transcription were 25°C for 10 minutes, 37°C for 60 minutes, and 95°C for 5 minutes, using Gene Amp PCR System 9700 (Applied Biosystems). cDNA was stored at −20°C. Four microliters of each reverse transcription reaction was used for 50-μl real-time PCR reactions using a standard 96-well format and TaqMan probes. Real-time PCR reactions were run on an Applied Biosystems GeneAmp Prism 7700 System, and data were analyzed using the 2−ΔΔct method.34 Results were calculated in comparison with corresponding control samples run at the same time, each normalized to human GAPDH mRNA levels determined on the same plate. Analysis of variance with Bonferroni correction for multiple tests was used for determining statistical significance of fold changes.
Results
E-Cadherin and FSP-1 Expression in Gingival Epithelium
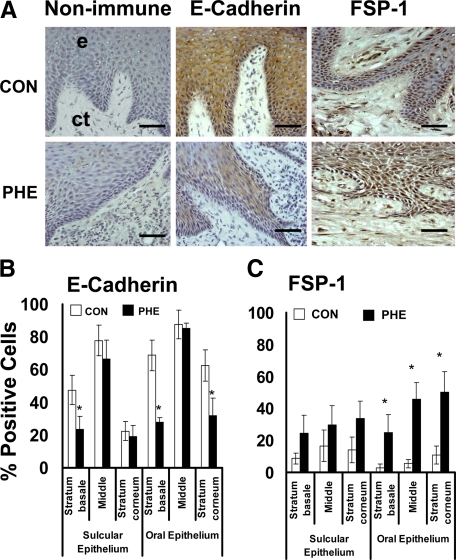
Human phenytoin-induced gingival overgrowth tissues are fibrotic2 and were first analyzed due to the more likely occurrence of EMT in fibrotic tissue. E-cadherin and FSP-1 levels were measured by immunohistochemistry and quantitative histomorphometry as described in Materials and Methods. E-cadherin expression was found to be limited to the gingival epithelium, as expected (Figure 2A). E-cadherin levels are reduced in all areas of epithelia in phenytoin-induced gingival overgrowth specimens compared with nonovergrowth control tissues (Figure 2B). Expression in phenytoin overgrowth samples exhibit clearly lower levels in Stratum basale and Stratum corneum of oral epithelium compared with controls. In parallel to the decreased E-cadherin expression in gingival epithelia, elevated FSP-1 levels occur in phenytoin-induced overgrowth in all layers of both oral and sulcular gingival epithelia compared with nonovergrowth sections (Figure 2, A and C). Moreover, overgrowth tissues contain a higher proportion of FSP-1–positive fibroblasts in the subsulcular connective tissue compared with control samples, whereas little FSP-1 staining was seen in oral epithelial samples.
Figure 2.
E-cadherin and FSP-1 expression in phenytoin-induced gingival overgrowth and no overgrowth control tissues. A: Representative sections from oral epithelium (e) and suboral connective tissue (ct) of immunohistochemistry staining of phenytoin induced gingival overgrowth (PHE) and no overgrowth control (CON) tissues; Scale bar = 35 μm, at ×400 magnification. B: Histomorphometric and quantitative analyses of E-cadherin immunostaining in phenytoin induced gingival overgrowth (PHE) in different areas of gingival epithelium (0.09 mm2) compared with no overgrowth control tissues (CON). C: Histomorphometric and quantitative analyses of FSP-1 immunostaining in phenytoin induced gingival overgrowth tissues (PHE) in different areas of gingival epithelium compared with no overgrowth control (CON) tissues; n = 11 in control, n = 7 in phenytoin. Data are means ± SE; *P < 0.05 compared with control by analysis of variance with Bonferroni correction for multiple tests.
Fibronectin and Fibronectin ED-A Expression in Gingival Overgrowth Tissues
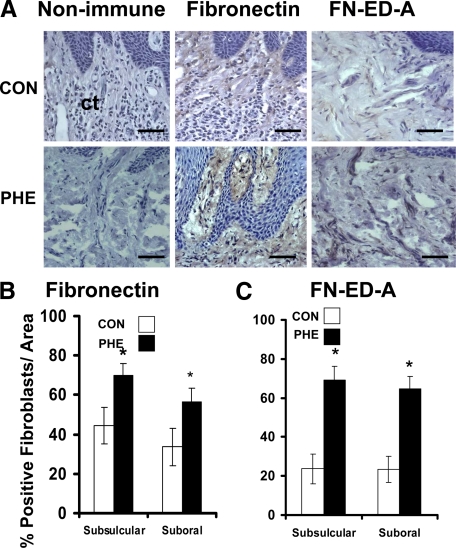
Fibronectin expression in gingival tissues from control and phenytoin-induced overgrowth groups was found associated with connective tissue fibroblasts and not in the epithelium (Figure 3A). Phenytoin-induced overgrowth tissues contain higher levels of fibronectin in connective tissue fibroblasts in both subsulcular and suboral regions underlying the epithelium (Figure 3B). The alternatively spliced form of fibronectin (FN-ED-A), often elevated in fibrotic tissues,35 is present at significantly higher levels in phenytoin samples (Figure 3, A and C), consistent with fibrotic enlargements in gingiva. Extracellular staining for both fibronectin and FN-ED-A is clearly also visible in overgrowth sections, and was increased in parallel with cellular staining in all sections (Figure 3).
Figure 3.
Fibronectin and fibronectin FN-ED-A expression in phenytoin-induced gingival overgrowth and no overgrowth control tissues. A: Representative immunohistochemistry-stained sections from suboral connective tissue (ct) of phenytoin-induced gingival overgrowth (PHE) and control (CON) tissues. Scale bar = 35 μm at ×400 magnification. B: Histomorphometric and quantitative analyses of fibronectin immunostaining in phenytoin-induced gingival overgrowth (PHE) in subsulcular and suboral connective tissues compared with no overgrowth control (CON) tissues. C: Histomorphometric and quantitative analyses of FN-ED-A immunostaining in phenytoin (PHE)-induced gingival overgrowth in subsulcular and suboral connective tissues compared with control (CON) tissues. For fibronectin analyses: n = 9 in no overgrowth control; n = 5 for phenytoin overgrowth. For FN-ED-A analyses: n = 6 for no overgrowth control; n = 5, phenytoin. Data are means ± SE; *P < 0.05 compared with control by analysis of variance with Bonferroni correction for multiple tests.
αvβ6 Expression in Gingival Epithelium
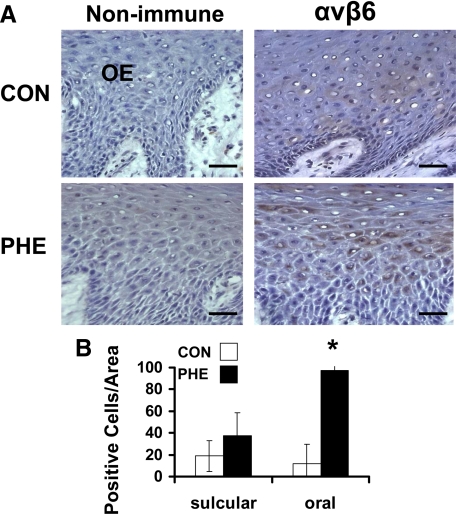
Integrin αvβ6 expression is associated with EMT.28 As an activator of TGF-β, αvβ6 is of mechanistic interest because TGF-β1 and one of its effectors, CCN2/CTGF, have been implicated in the development of phenytoin-induced gingival overgrowth.2,3,6 Integrin αvβ6 was detected only in gingival epithelia, and no expression occurs in the connective tissue stroma (Figure 4A). Interestingly, the levels of expression of αvβ6 in normal tissues are minimal while expression was found to be significantly higher in overgrowth tissues at oral epithelial locations (Figure 4B).
Figure 4.
αvβ6 Integrin expression in phenytoin-induced gingival overgrowth and no overgrowth control tissues. A: Representative immunohistochemistry sections from oral epithelium (OE) of phenytoin (PHE)-induced gingival overgrowth and control (CON) tissues. Scale bar = 35 μm at ×400 magnification. B: Histomorphometric and quantitative analyses of αvβ6 integrin immunostaining in phenytoin-induced gingival overgrowth (PHE) in sulcular and oral epithelium compared with no overgrowth control (CON) tissues (0.09 mm2). Data are means ± SE; n = 5 for both control and phenytoin groups; *P < 0.05 compared with control by analysis of variance with Bonferroni correction for multiple tests.
TGF-β1 Disrupts the Barrier Integrity of Cultured Human Primary Gingival Epithelial Cells
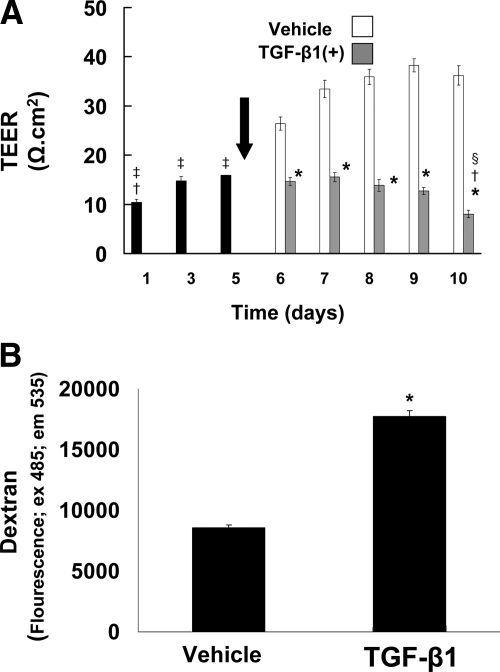
Loss of epithelial cell junctions and loss of barrier function of epithelial cell layers are functionally important characteristics of EMT. To determine whether TGF-β1 could perturb intercellular adhesion and the barrier function of cultured human gingival epithelial cells, electrical resistance of cells cultured on Transwell membranes was first measured as a function of treatment with 5 ng/ml TGF-β1. Cells reached stable resistance on day 5, and TGF-β1 or vehicle treatment was then initiated. After two days of treatment (day 7), vehicle-treated cultures exhibit increasing resistance (Figure 5A). By contrast, electrical resistance failed to increase, and actually decreased (P < 0.05), in TGF-β1–treated cells, indicating loss of epithelial integrity. The epithelial resistance in TGF-β1–treated cultures continued to decrease during the 5-day treatment period (through experimental day 10) at which time the epithelial resistance was lowest (Figure 5A).
Figure 5.
TGF-β1 disrupts cell layer integrity and paracellular permeability in primary cultured human gingival epithelial cells. A: Cells were cultured on Transwell membranes. TEER was monitored for 10 days. After reaching stable resistance on day five, TGF-β1 (5 ng/ml) or vehicle treatment was begun (arrow). TEER was recorded every day for five days after the start of treatment. Values are means ± SE of triplicate determinations; *P < 0.001 compared with vehicle treatment; †P < 0.001 compared with day three and day five; ‡P < 0.001 compared with vehicle treatment day six through day ten; §P < 0.05 compared with TGF-β1 treatment day six and day seven by analysis of variance with Bonferroni correction for multiple tests. B: Cells cultured on Transwell membranes were treated with TGF-β1 (5 ng/ml) or vehicle for five days. On day five, FITC-labeled dextran was added to the cells for one hour as described in Materials and Methods. Values are means ± SE of triplicate determinations; *P < 0.001 compared with vehicle treatment by analysis of variance.
TGF-β1 Increases Paracellular Permeability of Cultured Primary Human Gingival Epithelial Cells
To confirm that the TGF-β1–related decrease in TEER was functionally significant, we evaluated the paracellular flux of FITC-labeled dextran (mol wt 77,000) of primary human gingival epithelial cells cultured on Clear Transwell membranes, and then treated with vehicle or TGF-β1 as above. Data show that TGF-β1 treatment results in a two-fold increase in paracellular permeability on treatment day 5, thereby confirming the loss of barrier functionality of human gingival epithelial cells by TGF-β1 (Figure 5B).
TGF-β1 Induces Loss of Cell Surface E-Cadherin in Primary Cultured Human Gingival Epithelial Cells
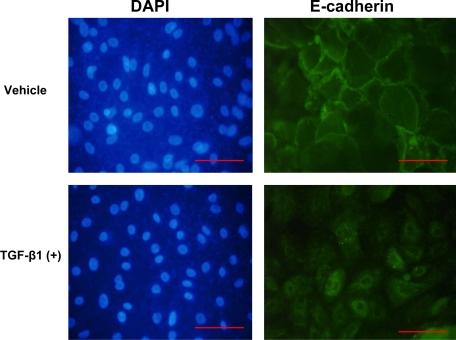
To further investigate characteristics of EMT in primary human gingival epithelial cells treated with TGF-β1, we evaluated TGF-β1– and vehicle-treated cells again grown on Clear Transwell filters as above, for cell surface E-cadherin expression by immunofluorescence assays. Primary human gingival epithelial vehicle-treated cells exhibit cell surface E-cadherin expression and close contact between cells, typical of epithelial cells (Figure 6). By contrast, E-cadherin expression was lower and not associated with the cell surface of TGF-β1–treated cells. DAPI staining confirmed that cell density was comparable in vehicle and TGF-β1–treated cultures (Figure 6).
Figure 6.
TGF-β1 inhibits cell surface E-cadherin expression in primary cultured human gingival epithelial cells. Gingival epithelial cells from a healthy donor were cultured until 80% confluent followed by treatment with TGF-β1 (5 ng/ml) or vehicle for five days. Cells were stained for E-cadherin and FITC-labeled secondary antibody for immunofluorescence on day five (right) and with DAPI to stain nuclei (left). The same fields are shown for each chromophore. Data show representative images from multiple stainings of cells at ×400 magnification; Scale bar = 0.02 mm.
TGF-β1 Inhibits E-Cadherin and Increases Fibronectin Expression in Cultured Primary Gingival Epithelial Cells
We next determined whether TGF-β1 can induce molecular expression changes characteristic of EMT in primary human gingival epithelial cells in vitro. This is necessary, as gingival overgrowth is a tissue-specific phenomenon.5 Unexpected TGF-β1 signaling relationships in human gingival fibroblasts have been shown, and these contribute to tissue specific CCN2/CTGF expression and tissue specificity of gingival overgrowth.3,4 No such studies have been performed with primary human gingival epithelial cells to our knowledge. Thus, primary human epithelial cells were cultured and treated with or without 5 ng/ml TGF-β1, and cell lysates were assayed at intervals for changes in protein and mRNA levels of specific EMT markers. E-cadherin levels were seen to increase in vehicle-treated control samples, whereas TGF-β1 inhibits E-cadherin levels (Figure 7A). E-cadherin mRNA levels are similarly inhibited by TGF-β1 treatment (Figure 7B), whereas profound increases of fibronectin expression occur at both at the protein (Figure 7C) and mRNA levels (Figure 7D).
Figure 7.
TGF-β1 regulation of E-cadherin and fibronectin protein (A and C) and mRNA (B and D) expression in primary cultured human gingival epithelial cells. E-cadherin (A) and fibronectin (C) Western blots of cell layer extracts of primary human gingival epithelial cells. Cells were cultured and treated with TGF-β1 or no treatment control for five days. β-actin antibody was for normalization as described in Materials and Methods. Blots are representative results obtained from cells from three different subjects with consistent results. Quantitative data were obtained by pooling data obtained from three different subjects (n = 3). Fibronectin protein was not detected in control cultures. Real-time PCR analyses of E-cadherin and fibronectin expression of primary human gingival epithelial cells for E-cadherin (B) and fibronectin (D). Cells were cultured and treated with or without TGF-β1 for five days. Total cellular RNA was extracted on each day, and real-time qPCR was conducted using GAPDH as control. Data are represented as fold changes compared with untreated cells on day one. Data are means ± SE from triplicate real-time PCR assays each of cells isolated from three different subjects (n = 3; *P < 0.05; **P < 0.001, Student t test, compared with no treatment control cultures).
TGF-β1 Upregulates the Expression of SLUG
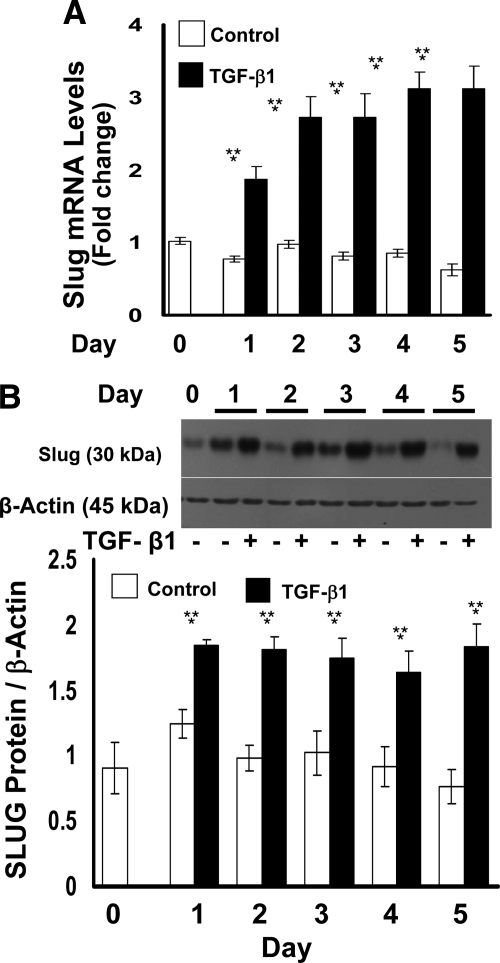
SLUG is a transcriptional repressor of E-cadherin, and its up-regulation occurs in EMT. Total RNA and cell lysates isolated from TGF-β1–treated primary gingival epithelial cells were subjected to qPCR analysis and Western blotting. SLUG mRNA and protein levels are significantly up-regulated by TGF-β1 in primary human gingival epithelial cells (Figure 8, A and B).
Figure 8.
TGF-β1 regulation of SLUG mRNA (A) and protein (B) expression in primary cultured human gingival epithelial cells. Cells were cultured and treated with or without TGF-β1 for five days. A: Total cellular RNA was extracted on each day and real-time qPCR was conducted using GAPDH as control. Data are represented as fold change compared with untreated control cultures. Data are from triplicate real-time PCR assays of all samples. **P < 0.001 compared with day 0; *P < 0.001 compared with no treatment control. B: Western blots of cell layer extracts for SLUG of primary human gingival epithelial cells. β-actin antibody was used to verify equal loading of gels. The Western blot shown is representative of three experiments with consistent results. Quantitative data are from experiments performed in triplicate each with cells from three different subjects. Data shown are means ± SE; *P < 0.05 compared with no treatment controls; #P < 0.05 compared with day 0 by analysis of variance with Bonferroni correction for multiple tests.
TGF-β1 Upregulates the Expression of Matrix Metalloproteinases in Gingival Epithelial Cells
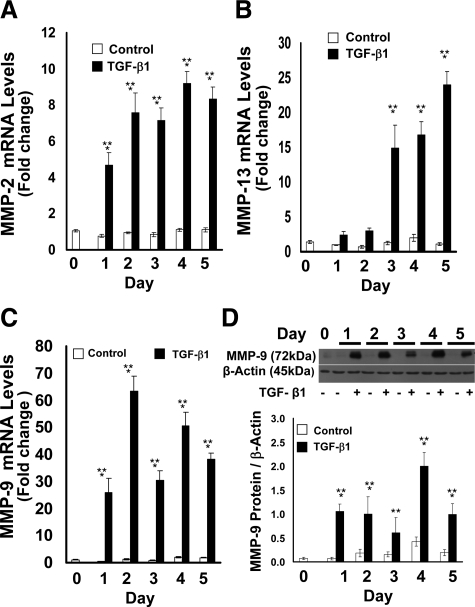
MMPs are expressed in epithelia undergoing EMT and contribute to remodeling of the extracellular matrix thereby promoting cell migration.36 We investigated whether MMP expressions could be increased by TGF-β1 in primary human gingival epithelial cell cultures. TGF-β1–treated gingival epithelial cells showed significant and substantial up-regulation at mRNA levels of MMP-2 and MMP-13 (Figure 9, A and B). MMP-9 was similarly up-regulated by TGF-β1 both at mRNA (Figure 9C) and protein (Figure 9D) levels.
Figure 9.
TGF-β1 regulation of MMP-2, MMP-13, and MMP-9 mRNA (A–C) and MMP-9 protein (D) expression in primary cultured human gingival epithelial cells. Real-time PCR analyses of (A) MMP-2, (B) MMP-13, and (C) MMP-9 expression of primary human gingival epithelial cells. Cells were cultured and treated with or without TGF-β1 for 5 days. Total RNA was extracted on each day for real-time qPCR. Data are fold changes compared with untreated cells normalized to GAPDH levels and are from triplicate real-time qPCR assays of samples derived from three subjects, all with similar outcomes. D: MMP-9 Western blots of cell layer extracts of primary human gingival epithelial cells. Cells were cultured and treated as described in the Materials and Methods section with TGF-β1 or no treatment control for five days. β-actin antibody was used to verify equal loading of gels. The blot is from one representative experiment done with cells derived from three different subjects (n = 3); quantitative data are pooled (n = 3); and data are means ± SE; **P < 0.001 compared with control day 0; *P < 0.001 compared with no treatment control by analysis of variance with Bonferroni correction for multiple tests.
E-Cadherin, FSP-1, and Fibronectin ED-A Expression in Cyclosporin-A and Nifedipine-Induced Gingival Overgrowth Tissues
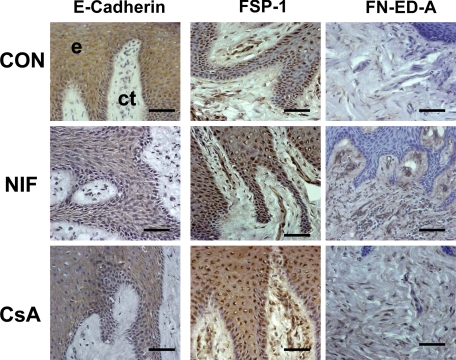
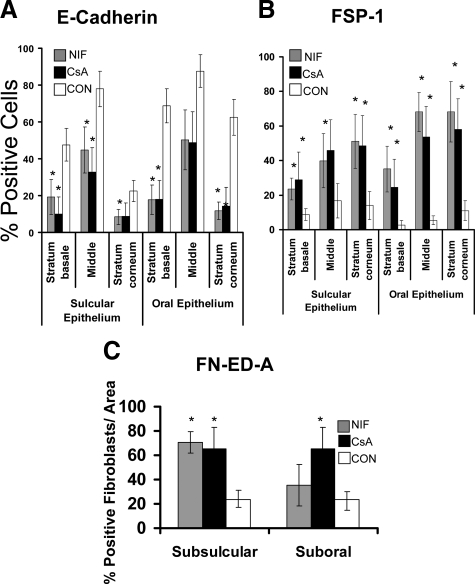
The histopathology of nifedipine- and cyclosporine A–induced gingival overgrowth is characterized by rete pegs extending deep into the connective tissue stroma and could suggest that EMT may also occur in these less fibrotic forms of gingival overgrowth.6 E-cadherin, FSP-1, and FN ED-A expressions were, therefore, evaluated (Figures 10 and 11, A–C). Cyclosporin A– and nifedipine-induced gingival overgrowth tissues show significant reduction of E-cadherin levels in the gingival epithelium compared with nonovergrowth control tissues (Figures 10 and 11). Elevated FSP-1 levels occur in oral and sulcular gingival epithelia compared with nonovergrowth sections (Figures 10 and 11). Cyclosporine A– and nifedipine-induced gingival overgrowth tissues have elevated levels of cell associated and extracellular FN ED-A in gingival connective tissues (Figures 10 and 11). It is interesting to note that αvβ6 integrin is not consistently up-regulated in nifedipine or cyclosporine A–induced gingival overgrowth (data not shown). Taken together, data show that EMT appears to be a common feature of gingival overgrowth and that major features of EMT are not restricted to the most fibrotic form (i.e., phenytoin-) of drug-induced gingival overgrowth.
Figure 10.
E-cadherin, FSP-1, and Fibronectin ED-A expression in cyclosporine A–, nifedipine-induced gingival overgrowth, and control tissues. Representative sections from oral epithelium (e) and suboral connective tissue (ct) for the immunohistochemical staining of E-cadherin, FSP-1, and FN-ED-A expression in nifedipine (NIF), cyclosporin A (CSA), and control (CON) tissues. Each bar represents 35 μm at a magnification of ×400.
Figure 11.
Histomorphometric and quantitative analyses in nifedipine and cyclosporine A human gingival overgrowth tissues. A: E-cadherin immunostaining in nifedipine- (NIF) and cyclosporin A– (CSA) induced gingival overgrowth compared with control (CON) in different areas of gingival epithelium (0.09 mm2); n = 7 for nifedipine and cyclosporin A; n = 11 for control. B: Histomorphometric and quantitative analyses of FSP-1 immunostaining in nifedipine- (NIF) and cyclosporin A– (CSA) induced gingival overgrowth tissues compared with control (CON) in different areas of gingival epithelium n = 6 for cyclosporin A; n = 5 for nifedipine; and n = 11 for control. C: Histomorphometric and quantitative analyses of FN-ED-A immunostaining in nifedipine- (NIF) and cyclosporin A– (CSA) induced gingival overgrowth compared with control (CON) in subsulcular and suboral connective tissues; n = 5 for cyclosporin A; n = 5 for nifedipine; and n = 6 for control. Data are means ± SE. Each bar represents 25 μm at a magnification of ×400. *P < 0.05 compared with control by analysis of variance with Bonferroni correction for multiple tests.
Discussion
EMT is now a well-defined concept in embryonic development, cancer progression, and epithelial stress/injury. During EMT, epithelial cells lose their polarity and cell–cell and cell–matrix adhesion and are remodeled and rearranged as they acquire characteristics of mesenchymal cells.13 EMT is characterized by the loss of proteins associated with the epithelial phenotype and by increased expression of proteins associated with a mesenchymal and migratory cell phenotype. In the present study, we report that in gingival overgrowth the epithelium expresses decreased levels of E-cadherin, whereas FSP-1 levels increase. The most prominent change in E-cadherin expression is seen in basal layers of the epithelium, adjacent to the basement membrane suggesting that transitions to the mesenchymal phenotype occur in epithelial cells at or near the basement membrane. In addition to changes at the basal layer, gingival epithelial expression of FSP-1 in overgrowth samples suggests that the entire epithelium may be participating in the EMT process even if some epithelial cells persist in expressing E-cadherin. It will be interesting to develop an in vivo model of gingival overgrowth to establish temporal relationships for changes of expression of EMT markers as overgrowth develops to gain insights into possible functional relationships.
In addition to in vivo findings from specimens collected from patients, we have shown that TGF-β1 is a strong inducer of EMT in primary cultured gingival epithelial cells. Data demonstrate that TGF-β1 can cause a change of phenotype in human primary gingival epithelial cells primary culture, in the context of expression patterns seen in gingival overgrowth. TGF-β1 has functional effects on these cells. TGF-β1–treated human primary gingival epithelial cells lose their cellular integrity. This was shown as decreases in TEER and increases in paracellular flux. These functional observations support both the protein and the gene level experiments in which primary human gingival epithelia cells were treated with TGF-β1. We have focused on effects of TGF-β because it is a potent inducer of EMT, and also because of the highly elevated levels of CCN2/CTGF seen in phenytoin-induced gingival overgrowth.2,6 CCN2/CTGF is a well known downstream target of TGF-β signaling. Additional growth factors can stimulate EMT, however, including PDGF.37,38
In colon cancer models, αvβ6 integrin is expressed in tumor cells undergoing EMT. Integrin αvβ6 enables cells to interact with interstitial matrix and to sustain the activation of TGF-β1.28 In the present study, αvβ6 was found to be highly expressed in the epithelia of phenytoin-induced but not cyclosporin A– or nifedipine-induced gingival overgrowth specimens. In light of the higher expression of CCN2/CTGF in phenytoin-induced gingival overgrowth, these results suggest that αvβ6 integrin may function to maintain a level of activation of TGF-β in this form of gingival overgrowth. By contrast, we speculate that EMT in nifedipine- and cyclosporine A–induced gingival overgrowth may be driven by elevated levels of growth factors other than TGF-β (such as PDGF) that have been reported to be elevated in gingival overgrowth.39
TGF-β1 increases SLUG levels in EMT directly through SMAD-3 signaling.13 SLUG (also known as SNAIL2) is a zinc finger transcription factor in the Snail superfamily.40 SLUG regulates disruption of desmosomes at the onset of cytokine-induced EMT and inhibits the desmoplakin and desmoglein expression to facilitate progression of EMT.41 Most important, SLUG represses E-cadherin gene expression,42 resulting in diminished adherens tight junctions and desmosomal junction components and disrupting intercellular adhesion between cells.13,42 TGF-β1–induced SLUG expression may be of significant functional importance in driving EMT in gingival epithelial cells, based on the high response of cultured primary gingival epithelial cell SLUG expression to TGF-β1 treatment reported here. Efforts to visualize SMAD and SLUG expression by immunohistochemistry in human clinical samples were, however, not successful. We suggest that SMAD and SLUG expression may be early events in lesion development in vivo. Clinical human tissue samples obtained in the present study were taken at therapeutic gingivectomy surgery, and were all advanced chronic lesions, at which time TGF-β signaling is unlikely to be at its maximum, as previously discussed.2,5 An animal model will be required to directly determine whether a predicted time-dependent and transient peak of TGF-β expression and signaling occurs in the development of gingival overgrowth.
Remodeling of the basement membrane is an essential aspect of EMT and permits cell invasion into underlying connective tissue. TGF-β1 activates some matrix metalloproteinases to digest the basal lamina specifically collagen type IV.23,24 MMP-2, MMP-9, and MMP-13 were evaluated as TGF-β1 targets in primary gingival epithelial cells and were found to be potently induced. MMP-13 has a unique role in connective tissue homeostasis in gingival tissue.43 It has a highly restricted tissue distribution44 and is expressed in fetal skin not in adult skin but is also expressed in adult gingiva.43 These data suggest that MMP-13 and the highly induced MMP-2 and MMP-9 enzymes could participate in gingival tissue remodeling and development of gingival fibrosis. Studies in animal models of drug-induced gingival overgrowth have been initiated to directly establish temporal and mechanistic relationships in the development of gingival overgrowth.
Taken together, results from data presented here suggest that EMT is a biological process that contributes to drug induced gingival overgrowth. Our working model for phenytoin-induced gingival overgrowth is that an abnormal cytokine profile develops as a result of phenytoin-induced alterations of innate and acquired immune responses leading to cytokine-induced expression of epithelial cell αvβ6 integrin, which may be partially responsible for sustaining a sufficient level of activation of TGF-β. TGF-β1 is elevated in human gingival overgrowth tissues,45 and it is realized that TGF-β1 activation can occur independent of αvβ6 and that peak levels of active TGF-β may occur in a time-dependent manner. TGF-β then induces a variety of effects in epithelial cells including increased SLUG, decreased E-cadherin, increased paracellular permeability, and elevated levels of MMPs including MMP-2, MMP-9, and MMP-13 resulting in degradation of the basement membrane. Epithelial cells gain the ability to migrate in the absence of normal cell to cell junctions and a damaged basement membrane. The compromised basement membrane then permits abnormal communication between the epithelium and the underlying stroma, resulting in TGF-β1 stimulation of levels of fibronectin, FN-ED-A, and CCN2/CTGF and lysyl oxidase enzyme activity31 that contribute to connective tissue fibrosis. For nifedipine- and cyclosporine A–induced gingival overgrowth, we speculate that TGF-β–driven pathways are somewhat less prominent, as seen by less robust expression of αvβ6, and that growth factors other than TGF-β1 may be more important in driving down levels of epithelial markers and stimulating mesenchymal markers that we report here in Figures 10 and 11. We anticipate that greater insights into these relationships will be obtained in the study of animal models of gingival overgrowth that will permit analysis of gingival overgrowth lesions as they develop in vivo. As summarized in an earlier review,5 previous studies have investigated direct effects of cyclosporine A, nifedipine, and phenytoin on extracellular matrix production by primary human gingival fibroblasts with few consistent outcomes, while it is understood that cytokine and growth factor imbalances are common in human gingival overgrowth tissues. These findings have led to the current understanding that the pathology of gingival overgrowth is likely to be driven primarily by indirect effects of these drugs that in some way modulate innate and acquired immune responses and cytokine imbalances. These imbalances combined with tissue specific responses of gingival cells3,4 are suggested to drive EMT and result in the observed tissue abnormalities.
Footnotes
Address reprint requests to Philip C. Trackman, Ph.D., Boston University, Henry M. Goldman School of Dental Medicine, 700 Albany Street W-201, Boston, MA 02118. E-mail: trackman@bu.edu.
Supported by National Institutes of Health grants R01DE11004 and UL1 RR025771.
References
- Kalluri R, Neilson EG. Epithelial-mesenchymal transition and its implications for fibrosis. J Clin Invest. 2003;112:1776–1784. doi: 10.1172/JCI20530. [DOI] [PMC free article] [PubMed] [Google Scholar]
- Uzel MI, Kantarci A, Hong HH, Uygur C, Sheff MC, Firatli E, Trackman PC. Connective tissue growth factor in drug-induced gingival overgrowth. J Periodontol. 2001;72:921–931. doi: 10.1902/jop.2001.72.7.921. [DOI] [PubMed] [Google Scholar]
- Black SA, Jr, Palamakumbura AH, Stan M, Trackman PC. Tissue-specific mechanisms for CCN2/CTGF persistence in fibrotic gingiva: interactions between cAMP and MAPK signaling pathways, and prostaglandin E2-EP3 receptor mediated activation of the c-JUN N-terminal kinase. J Biol Chem. 2007;282:15416–15429. doi: 10.1074/jbc.M610432200. [DOI] [PMC free article] [PubMed] [Google Scholar]
- Black SA, Jr, Trackman PC. Transforming growth factor-β1 (TGFβ1) stimulates connective tissue growth factor (CCN2/CTGF) expression in human gingival fibroblasts through a RhoA-independent. Rac1/Cdc42-dependent mechanism: statins with forskolin block TGFβ1-induced CCN2/CTGF expression. J Biol Chem. 2008;283:10835–10847. doi: 10.1074/jbc.M710363200. [DOI] [PMC free article] [PubMed] [Google Scholar]
- Trackman PC, Kantarci A. Connective tissue metabolism and gingival overgrowth. Crit Rev Oral Biol Med. 2004;15:165–175. doi: 10.1177/154411130401500305. [DOI] [PubMed] [Google Scholar]
- Kantarci A, Black SA, Xydas CE, Murawel P, Uchida Y, Yucekal-Tuncer B, Atilla G, Emingil G, Uzel MI, Lee A, Firatli E, Sheff M, Hasturk H, Van Dyke TE, Trackman PC. Epithelial and connective tissue cell CTGF/CCN2 expression in gingival fibrosis. J Pathol. 2006;210:59–66. doi: 10.1002/path.2000. [DOI] [PMC free article] [PubMed] [Google Scholar]
- McMorrow T, Gaffney MM, Slattery C, Campbell E, Ryan MP. Cyclosporine A induced epithelial-mesenchymal transition in human renal proximal tubular epithelial cells. Nephrol Dial Transplant. 2005;20:2215–2225. doi: 10.1093/ndt/gfh967. [DOI] [PubMed] [Google Scholar]
- Pan LH, Yamauchi K, Uzuki M, Nakanishi T, Takigawa M, Inoue H, Sawai T. Type II alveolar epithelial cells and interstitial fibroblasts express connective tissue growth factor in IPF. Eur Respir J. 2001;17:1220–1227. doi: 10.1183/09031936.01.00074101. [DOI] [PubMed] [Google Scholar]
- Shimo T, Wu C, Billings PC, Piddington R, Rosenbloom J, Pacifici M, Koyama E. Expression, gene regulation, and roles of Fisp12/CTGF in developing tooth germs. Dev Dyn. 2002;224:267–278. doi: 10.1002/dvdy.10109. [DOI] [PubMed] [Google Scholar]
- Radisky DC. Epithelial-mesenchymal transition. J Cell Sci. 2005;118:4325–4326. doi: 10.1242/jcs.02552. [DOI] [PubMed] [Google Scholar]
- Boyer B, Valles AM, Edme N. Induction and regulation of epithelial-mesenchymal transitions. Biochem Pharmacol. 2000;60:1091–1099. doi: 10.1016/s0006-2952(00)00427-5. [DOI] [PubMed] [Google Scholar]
- Lee JM, Dedhar S, Kalluri R, Thompson EW. The epithelial-mesenchymal transition: new insights in signaling, development, and disease. J Cell Biol. 2006;172:973–981. doi: 10.1083/jcb.200601018. [DOI] [PMC free article] [PubMed] [Google Scholar]
- Zavadil J, Bottinger EP. TGF-β and epithelial-to-mesenchymal transitions. Oncogene. 2005;24:5764–5774. doi: 10.1038/sj.onc.1208927. [DOI] [PubMed] [Google Scholar]
- Gumbiner BM. Regulation of cadherin-mediated adhesion in morphogenesis. Nat Rev Mol Cell Biol. 2005;6:622–634. doi: 10.1038/nrm1699. [DOI] [PubMed] [Google Scholar]
- Reichert M, Muller T, Hunziker W. The PDZ domains of zonula occludens-1 induce an epithelial to mesenchymal transition of Madin-Darby canine kidney I cells. Evidence for a role of β-catenin/Tcf/Lef signaling, J Biol Chem. 2000;275:9492–9500. doi: 10.1074/jbc.275.13.9492. [DOI] [PubMed] [Google Scholar]
- Vleminckx K, Kemler R. Cadherins and tissue formation: integrating adhesion and signaling. Bioessays. 1999;21:211–220. doi: 10.1002/(SICI)1521-1878(199903)21:3<211::AID-BIES5>3.0.CO;2-P. [DOI] [PubMed] [Google Scholar]
- Kasai H, Allen JT, Mason RM, Kamimura T, Zhang Z. TGF-β1 induces human alveolar epithelial to mesenchymal cell transition (EMT). Respir Res. 2005;6:56. doi: 10.1186/1465-9921-6-56. [DOI] [PMC free article] [PubMed] [Google Scholar]
- Lacher MD, Tiirikainen MI, Saunier EF, Christian C, Anders M, Oft M, Balmain A, Akhurst RJ, Korn WM. Transforming growth factor-β receptor inhibition enhances adenoviral infectability of carcinoma cells via up-regulation of Coxsackie and Adenovirus Receptor in conjunction with reversal of epithelial-mesenchymal transition. Cancer Res. 2006;66:1648–1657. doi: 10.1158/0008-5472.CAN-05-2328. [DOI] [PubMed] [Google Scholar]
- Oyama F, Murata Y, Suganuma N, Kimura T, Titani K, Sekiguchi K. Patterns of alternative splicing of fibronectin pre-mRNA in human adult and fetal tissues. Biochemistry. 1989;28:1428–1434. doi: 10.1021/bi00429a072. [DOI] [PubMed] [Google Scholar]
- Iwano M, Plieth D, Danoff TM, Xue C, Okada H, Neilson EG. Evidence that fibroblasts derive from epithelium during tissue fibrosis. J Clin Invest. 2002;110:341–350. doi: 10.1172/JCI15518. [DOI] [PMC free article] [PubMed] [Google Scholar]
- Strutz F, Okada H, Lo CW, Danoff T, Carone RL, Tomaszewski JE, Neilson EG. Identification and characterization of a fibroblast marker: fSP1. J Cell Biol. 1995;130:393–405. doi: 10.1083/jcb.130.2.393. [DOI] [PMC free article] [PubMed] [Google Scholar]
- Zavadil J, Bitzer M, Liang D, Yang YC, Massimi A, Kneitz S, Piek E, Bottinger EP. Genetic programs of epithelial cell plasticity directed by transforming growth factor-β. Proc Natl Acad Sci U S A. 2001;98:6686–6691. doi: 10.1073/pnas.111614398. [DOI] [PMC free article] [PubMed] [Google Scholar]
- Strutz F, Zeisberg M, Ziyadeh FN, Yang CQ, Kalluri R, Muller GA, Neilson EG. Role of basic fibroblast growth factor-2 in epithelial-mesenchymal transformation. Kidney Int. 2002;61:1714–1728. doi: 10.1046/j.1523-1755.2002.00333.x. [DOI] [PubMed] [Google Scholar]
- Li Y, Yang J, Dai C, Wu C, Liu Y. Role for integrin-linked kinase in mediating tubular epithelial to mesenchymal transition and renal interstitial fibrogenesis. J Clin Invest. 2003;112:503–516. doi: 10.1172/JCI17913. [DOI] [PMC free article] [PubMed] [Google Scholar]
- Breuss JM, Gallo J, DeLisser HM, Klimanskaya IV, Folkesson HG, Pittet JF, Nishimura SL, Aldape K, Landers DV, Carpenter W, Gillett N, Sheppard D, Matthay MA, Albelda SM, Kramer RH, Pytela R. Expression of the β6 integrin subunit in development, neoplasia and tissue repair suggests a role in epithelial remodeling. J Cell Sci. 1995;108:2241–2251. doi: 10.1242/jcs.108.6.2241. [DOI] [PubMed] [Google Scholar]
- Vartio T, Laitinen L, Narvanen O, Cutolo M, Thornell LE, Zardi L, Virtanen I. Differential expression of the ED sequence-containing form of cellular fibronectin in embryonic and adult human tissues. J Cell Sci. 1987;88:419–430. doi: 10.1242/jcs.88.4.419. [DOI] [PubMed] [Google Scholar]
- Pilewski JM, Latoche JD, Arcasoy SM, Albelda SM. Expression of integrin cell adhesion receptors during human airway epithelial repair in vivo. Am J Physiol. 1997;273:L256–L263. doi: 10.1152/ajplung.1997.273.1.L256. [DOI] [PubMed] [Google Scholar]
- Bates RC. The αVβ6 integrin as a novel molecular target for colorectal cancer. Future Oncol. 2005;1:821–828. doi: 10.2217/14796694.1.6.821. [DOI] [PubMed] [Google Scholar]
- Munger JS, Huang X, Kawakatsu H, Griffiths MJ, Dalton SL, Wu J, Pittet JF, Kaminski N, Garat C, Matthay MA, Rifkin DB, Sheppard D. The integrin αv β6 binds and activates latent TGF β1: a mechanism for regulating pulmonary inflammation and fibrosis. Cell. 1999;96:319–328. doi: 10.1016/s0092-8674(00)80545-0. [DOI] [PubMed] [Google Scholar]
- Desmouliere A, Geinoz A, Gabbiani F, Gabbiani G. Transforming growth factor-β1 induces α-smooth muscle actin expression in granulation tissue myofibroblasts and in quiescent and growing cultured fibroblasts. J Cell Biol. 1993;122:103–111. doi: 10.1083/jcb.122.1.103. [DOI] [PMC free article] [PubMed] [Google Scholar]
- Hong HH, Uzel MI, Duan C, Sheff MC, Trackman PC. Regulation of lysyl oxidase, collagen, and connective tissue growth factor by TGF-β1 and detection in human gingiva. Lab Invest. 1999;79:1655–1667. [PubMed] [Google Scholar]
- Man Y, Hart VJ, Ring CJ, Sanjar S, West MR. Loss of epithelial integrity resulting from E-cadherin dysfunction predisposes airway epithelial cells to adenoviral infection. Am J Respir Cell Mol Biol. 2000;23:610–617. doi: 10.1165/ajrcmb.23.5.4046. [DOI] [PubMed] [Google Scholar]
- Towbin H, Staehelin T, Gordon J. Electrophoretic transfer of proteins from polyacrylamide gels to nitrocellulose sheets: procedure and some applications. Proc Natl Acad Sci USA. 1979;76:4350–4354. doi: 10.1073/pnas.76.9.4350. [DOI] [PMC free article] [PubMed] [Google Scholar]
- Huggett J, Dheda K, Bustin S, Zumla A. Real-time RT-PCR normalisation; strategies and considerations. Genes Immun. 2005;6:279–284. doi: 10.1038/sj.gene.6364190. [DOI] [PubMed] [Google Scholar]
- Tuori A, Virtanen I, Aine E, Uusitalo H. The expression of tenascin and fibronectin in keratoconus, scarred and normal human cornea. Graefes Arch Clin Exp Ophthalmol. 1997;235:222–229. doi: 10.1007/BF00941763. [DOI] [PubMed] [Google Scholar]
- Min C, Eddy SF, Sherr DH, Sonenshein GE. NF-kappaB and epithelial to mesenchymal transition of cancer. J Cell Biochem. 2008;104:733–744. doi: 10.1002/jcb.21695. [DOI] [PubMed] [Google Scholar]
- Moustakas A, Heldin CH. Signaling networks guiding epithelial-mesenchymal transitions during embryogenesis and cancer progression. Cancer Sci. 2007;98:1512–1520. doi: 10.1111/j.1349-7006.2007.00550.x. [DOI] [PMC free article] [PubMed] [Google Scholar]
- Wynn TA. Cellular and molecular mechanisms of fibrosis. J Pathol. 2008;214:199–210. doi: 10.1002/path.2277. [DOI] [PMC free article] [PubMed] [Google Scholar]
- Iacopino AM, Doxey D, Cutler CW, Nares S, Stoever K, Fojt J, Gonzales A, Dill RE. Phenytoin and cyclosporine A specifically regulate macrophage phenotype and expression of platelet-derived growth factor and interleukin-1 in vitro and in vivo: possible molecular mechanism of drug-induced gingival hyperplasia. J Periodontol. 1997;68:73–83. doi: 10.1902/jop.1997.68.1.73. [DOI] [PubMed] [Google Scholar]
- Barrallo-Gimeno A, Nieto MA. The Snail genes as inducers of cell movement and survival: implications in development and cancer. Development. 2005;132:3151–3161. doi: 10.1242/dev.01907. [DOI] [PubMed] [Google Scholar]
- Savagner P, Yamada KM, Thiery JP. The zinc-finger protein slug causes desmosome dissociation, an initial and necessary step for growth factor-induced epithelial-mesenchymal transition. J Cell Biol. 1997;137:1403–1419. doi: 10.1083/jcb.137.6.1403. [DOI] [PMC free article] [PubMed] [Google Scholar]
- Bolos V, Peinado H, Perez-Moreno MA, Fraga MF, Esteller M, Cano A. The transcription factor Slug represses E-cadherin expression and induces epithelial to mesenchymal transitions: a comparison with Snail and E47 repressors. J Cell Sci. 2003;116:499–511. doi: 10.1242/jcs.00224. [DOI] [PubMed] [Google Scholar]
- Ravanti L, Hakkinen L, Larjava H, Saarialho-Kere U, Foschi M, Han J, Kahari VM. Transforming growth factor-β induces collagenase-3 expression by human gingival fibroblasts via p38 mitogen-activated protein kinase. J Biol Chem. 1999;274:37292–37300. doi: 10.1074/jbc.274.52.37292. [DOI] [PubMed] [Google Scholar]
- Ala-aho R, Johansson N, Grenman R, Fusenig NE, Lopez-Otin C, Kahari VM. Inhibition of collagenase-3 (MMP-13) expression in transformed human keratinocytes by interferon-gamma is associated with activation of extracellular signal-regulated kinase-1,2 and STAT1. Oncogene. 2000;19:248–257. doi: 10.1038/sj.onc.1203306. [DOI] [PubMed] [Google Scholar]
- Saito K, Mori S, Iwakura M, Sakamoto S. Immunohistochemical localization of transforming growth factor β, basic fibroblast growth factor and heparan sulphate glycosaminoglycan in gingival hyperplasia induced by nifedipine and phenytoin. J Periodontal Res. 1996;31:545–555. doi: 10.1111/j.1600-0765.1996.tb00519.x. [DOI] [PubMed] [Google Scholar]


