Abstract
Protein homodimerization is the simplest form of oligomerization that is frequently utilized for the construction of functional biological assemblies and regulation of cellular pathways. Despite its simplicity, dimerization still poses an enormous challenge for protein engineering and chemical maniupulation, owing to the large molecular surfaces involved in this process. We report here the construction of a hybrid coordination motif – consisting of a natural (His) and a non-natural ligand (quinolate) – on the α-helical surface of cytochrome cb562, which a) simultaneously binds divalent metals with high affinity, b) leads to a metal-induced increase in global protein stability, and importantly, c) enables the formation of a discrete protein dimer, whose shape is dictated by the inner-sphere metal coordination geometry. The crystallographically-determined arrangement of metal cross-linked α-helices closely approximate that of the DNA-binding domains of bZIP family transcription factors.
Introduction
Protein dimerization is an omnipresent process utilized for the construction of numerous functional biological assemblies and regulation of cellular pathways.1 Given its broad biological significance, protein dimerization - and oligomerization in general - has been a subject of great fundamental interest,2 and represents a major target for protein engineering3, 4 and chemical manipulation.5, 6 In our laboratory, we have adopted an inorganic chemical approach (Metal-Directed Protein Self Assembly, MDPSA) that exploits the simultaneous strength, directionality and reversibility of metal-ligand coordination to direct protein oligomerization,7 thereby obviating the need to design and engineer extensive protein surfaces. In this report, we show that protein dimerization can be tightly controlled through a new class of surface coordination motifs with very high metal binding affinities, which yield discrete and biologically relevant architectures dictated by metal binding, and simultaneously lead to the stabilization of the helical domains that they are installed on. An important challenge in protein design is the engineering of protein interaction specificity, that is, the population of a single interaction geometry over other possible conformers, which often lie very close in energy. Our work shows that protein interaction specificity can be readily controlled through metal coordination without requiring time- and labor-intensive computational methods.
Recently, we have expanded MDPSA to include non-natural ligands,8 which offer a far wider chemical spectrum than what is naturally available to control protein self-assembly through metal coordination.7 A cytochrome cb562 construct (MBP-Phen1) featuring a bidentate 1,10′-phenanthroline (Phen) functionality with a single-point surface attachment was observed to form a unique Ni2+-induced triangular architecture.8 This particular supramolecular arrangement was ultimately enabled by the flexibility of the linker between Phen and the MBP-Phen1 backbone, which allowed the Phen group to tuck into a hydrophobic pocket on the protein surface and share Ni coordination with only one other protomer. While this example demonstrated that protein surface features can in principle be exploited - in analogy to synthetic ligand platforms - as steric bulk, this strategy is not readily generalizable. We thus envisioned that non-natural chelates may be combined with natural ligands incorporated elsewhere on the surface to form hybrid coordination motifs (HCMs), which would not only provide more rigid, high-denticity platforms for tighter metal binding and improved control of protein dimerization, but also be implemented more generally.
Because the α-helix is the most common secondary structure motif, it represents a particularly attractive platform for the incorporation of HCMs. Indeed, nature itself utilizes residues placed in i/i+3 and i/i+4 patterns quite regularly to construct stable metal binding sites.9 In this study, we decided to employ an i/i+7 pattern - corresponding to a two-helix-turn separation - to install a tridentate HCM on cyt cb562 with the idea that it would enforce protein dimerization upon binding a metal ion that prefers octahedral coordination (Scheme 1).
Scheme 1.
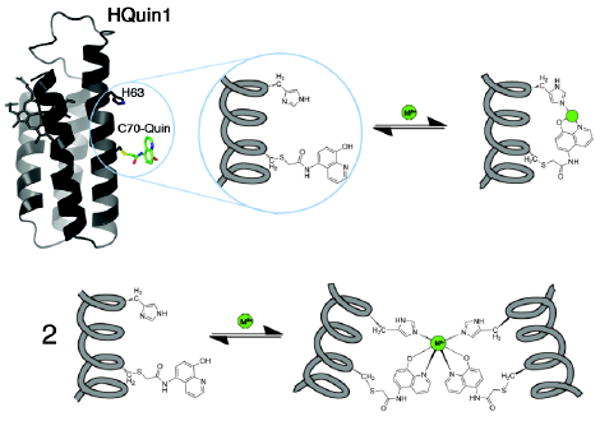
Proposed metal coordination and dimerization modes for HQuin1.
A cyt cb562 variant (HQuin1) was thus constructed that features an HCM composed of His63 and an iodoacetamide-functionalized 5-amino-8-hydroxyquinoline (Quin) group covalently attached to Cys70. The Quin functionality was particularly chosen because it is (often) a monoanionic ligand with a high affinity for many metal ions,10 and importantly, its lack of internal symmetry (in contrast, for example, to Phen) can in principle be exploited to impose preferential dimerization geometries through metal coordination.
Results and Discussion
Metal binding properties of HQuin1
We first investigated the binding of HQuin1 to various divalent late-first-row transition metal ions (Co2+, Ni2+, Cu2+ and Zn2+), taking advantage of the π-π* transition of Quin (λmax = 244 nm) that undergoes a ∼20-nm red-shift upon metal coordination (Figure 1). Initial studies suggested that the affinity of HQuin1 for all of tested metal ions is too high (nanomolar or lower) to be reliably assessed by direct titrations; hence, EGTA was used as a competing ligand to determine dissociation constants (Kd) (Figure 2 and Figure S1.1). As listed in Table 1, HQuin1 exhibits low Kd's that range from low nanomolar for Co2+ and Zn2+ to 85 fM for Cu2+ and follows the trend Kd-Co > Kd-Ni ≪ Kd-Cu ≫ Kd-Zn, roughly in line with the Irving-Williams series.11 While the fact that the HQuin1 metal-binding affinities are several orders of magnitude higher than those for free Quin (Table 1) strongly suggests tridentate coordination, we prepared the H63A variant of HQuin1 (AQuin1) to ascertain the involvement of H63 in metal binding. The metal affinities for AQuin1 were found to be significantly lower than HQuin1 and now in the range of those for free Quin, indicating that HQuin1 coordinates the tested metals in a tridentate fashion as planned. Evidently, the His-Quin HCM possesses sufficient internal flexibility to accommodate the various stereochemical preferences of Co2+, Ni2+, Cu2+ and Zn2+ coordination.
Figure 1.
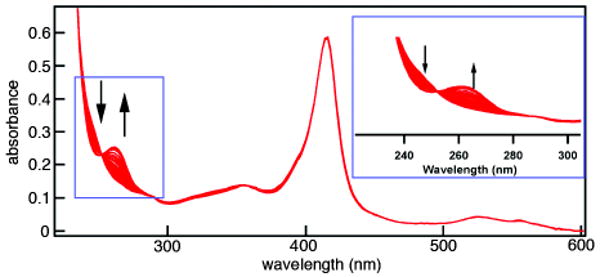
Representative changes in the absorption spectrum of HQuin1 upon M2+ binding. Shown here are the series of absorption spectra for Zn titration. (Inset) Observed changes in absorbance of Quin upon metal binding.
Figure 2.
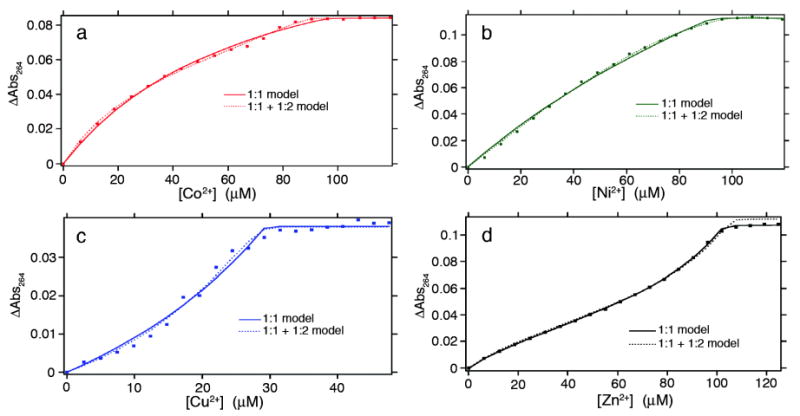
Metal binding titration data and fits for HQuin1 (3 – 5 μM) in the presence of EGTA (25-100 μM) as a competing ligand and various concentrations of (a) Co2+, (b) Ni2+, (c) Cu2+, (d) Zn2+ as monitored by UV-vis spectroscopy. Regression analysis was performed using both a simple 1:1 (solid line) metal:protein binding model and a combined 1:1 and 1:2 (dotted line) model, the latter of which accounts for metal-induced protein dimerization. A minimum of two titrations under identical conditions were performed for each metal and their results averaged. Metal dissociation constants (Kdmetal) determined through these titrations are listed in Tables 1, S2.1 and S2.2. DynaFit expressions used for data fitting are given in the Supporting Information.
Table 1.
Metal dissociation constants for HQuin1, AQuin1 and free 8-hydroxyquinoline (Quin).
| Metal | HQuin1a (M) | AQuin1b (M) | Free Quinc (M) |
|---|---|---|---|
| Co2+ | 4.0 (2) × 10-9 | 3.0 (1) × 10-7 | 6.48 × 10⁻⁷ |
| Ni2+ | 4.0 (2) × 10-10 | 3 (1) × 10-8 | 1.55 × 10⁻⁷ |
| Cu2+ | 8.5 (9) × 10-14 | 5.4 (5) × 10-9 | 2.29 × 10⁻¹⁰ |
| Zn2+ | 7.1 (3) × 10-9 | 9 (1) × 10-7 | 8.74 × 10⁻⁷ |
See Experimental Section for a detailed discussion on binding models. Additional figures and tables can be found in Supporting Information.
pH-adjusted dissociation constants reported in reference 9.
Metal-Induced Stabilization
We then asked if tight metal binding by the i/i+7 His-Quin HCM would translate into increased protein stability through the cross-linking of a two-turn helical portion of the protein. The stabilization of α-helical proteins/peptides through metallic or non-metallic crosslinking of i/i+4, i/i+7 and i/i+11 positions has been extensively documented.12 Helical peptides stabilized through covalent hydrocarbon-stapling, in particular, have garnered recent attention due to their efficacy in inhibiting protein-protein interactions that are important pharmaceutical targets.13 Guanidine hydrochloride (GuHCl) and thermal denaturation experiments show that HQuin1 is indeed stabilized by metal binding, with Ni producing the largest and Cu the smallest effect (Ni > Zn ≈ Co > Cu) (Figures 3 and S1.2). In the case of Ni, the stabilization amounts to a ∼1-M [GuHCl] or 12-K increase in the unfolding midpoint. We suggest that the discrepancy between the trends in metal binding affinity (vide supra) and metal-induced stabilization is due to the differential interactions of Co, Ni, Cu and Zn with unfolded or partially folded conformations of HQuin1. Evidence for such metal cross-linked unfolded or partially folded states comes from the shallow unfolding transition of HQuin1 in the presence of metals (Figures 3 and S1.2), which can be attributed to deviations from two-state unfolding behavior.14
Figure 3.
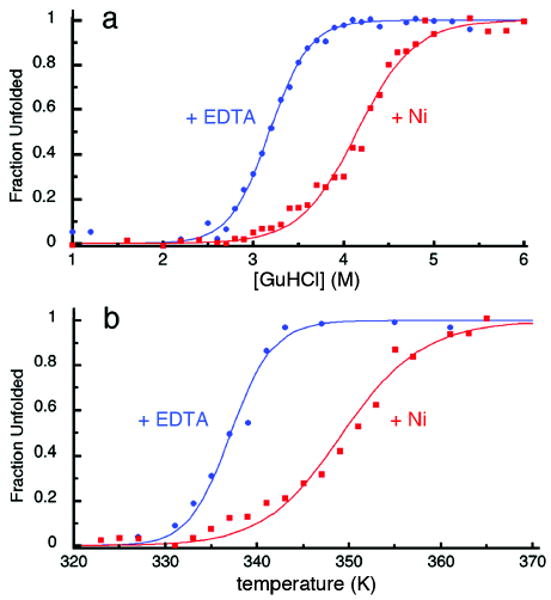
(a) Chemical and (b) thermal denaturation curves for HQuin1 in the absence (blue dots and lines) and presence of Ni2+ (red dots and lines) (see Figure S1.2 for other metals). Although both sets of data were fit usin a two-state unfolding model (see Experimental Section), the unfolding transitions in the presence of metals are shallower, suggesting metal cross-linked intermediate species.
In the absence of the Quin moiety (i.e., for the non-functionalized protein) or the coordinating H63 residue (i.e., for AQuin1) any enhancement in protein stability is eliminated (Figures S1.3a and S1.3b). Likewise, lowering the pH to 5.5, which is below the pKa of His (∼6.5) but above that that of the Quin imine group, drastically diminishes the observed stabilization (Figure S1.3c). Taken together, the metal binding and protein unfolding titrations confirm that HQuin1 coordinates metal ions by engaging both H63 and Quin(C70).
Metal-Induced Self-Assembly of HQuin1
With the tridentate coordination mode established, we examined self-assembly properties of HQuin1 in response to metal coordination using sedimentation velocity (SV) experiments. Under conditions where the metal:protein concentration ratio is greater than unity to ensure the full loading of the i/i+7 His-Quin HCM, the only HQuin1 species present in solution is monomeric (Smax = 1.8) (Figure S1.5). In contrast, at a metal:protein ratio of 1:2, Co, Ni, Cu and Zn all induce the formation of dimeric species. Nevertheless, the dimers appear to have different shapes based on the varying sedimentation coefficients obtained with each metal (Smax = 2.4 for Cu, 2.5 for Zn, 2.6 for Co and Ni) (Figure S1.6).
Given the octahedral coordination preference of Ni2+, we expected it to fully coordinate two tridentate His-Quin HCM's, thereby giving rise to a compact and rigid protein dimer (Scheme 1). To determine an apparent dissociation constant for Ni-induced protein dimerization (KdNi-dimer), a series of SV measurements were performed at varying HQuin1 concentrations while maintaining a 1:2 Ni:HQuin1 molar ratio. The SV distributions reveal a clear monomer-dimer transition as the HQuin1 concentration is increased from 5 μM to 25 μM (Figure 4), placing KdNi-dimer roughly at 10 μM. This dissociation constant is in reasonable agreement with that obtained from sedimentation equilibrium (SE) measurements (KdNi-dimer = 42 μM) run under similar conditions as the SV experiments (Figure S1.7).
Figure 4.
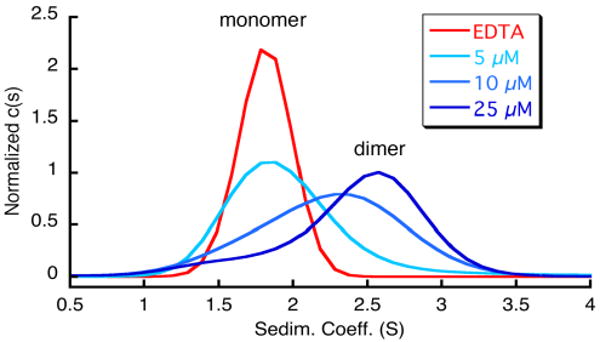
Sedimentation coefficient distributions for various concentrations of HQuin1 in the absence of metals (red trace) and in the presence of a half molar equivalent of Ni2+ (blue traces).
To elucidate the exact mode of Ni binding to His-Quin HCM and Ni-induced dimerization, the crystal structure of the Ni:HQuin12 complex was determined at 2.3 Å resolution (PDB ID: 3L1M). The asymmetric unit of the P21212 crystals contains a single HQuin1 protomer coordinated to a half-occupied Ni2+ lying on a crystallographic two-fold symmetry axis. This two-fold symmetry produces a V-shaped dimer with a parallel arrangement of two HQuin1 protomers (Figure 5a). The acute angle (∼50°) between the protomers results in minimal contact (∼300 Å2 buried surface) between their surfaces and is entirely enforced by Ni coordination to His-Quin HCM's in a distorted octahedral geometry. The Ni coordination sphere consists of a nearly ideal equatorial square plane formed by four nitrogens from two H63's and Quin's, and two axial phenolate oxygens that form a nonlinear O-Ni-O angle of 165° due in part to the small Quin bite angle of 80° (Figure 5b). The observed bond metrics closely approximate those of Ni2+ complexes with free quinolate and amine-type ligands.15 This suggests that Ni coordination in the Ni:HQuin12 complex is free from steric constraints that may be imposed by the covalent attachment of the His-Quin HCM to the protein surface. The conformational plasticity of the Cys70-Quin linker region – owing to four freely rotatable bonds – is evident in the electron density maps (Figure 5b): to accommodate octahedral Ni coordination, the linker adopts a somewhat strained conformation, whereby the S(Cys)-C1(linker) thioether and the C2(linker)-N(linker) amide bonds are found in a near-eclipsed configuration.
Figure 5.
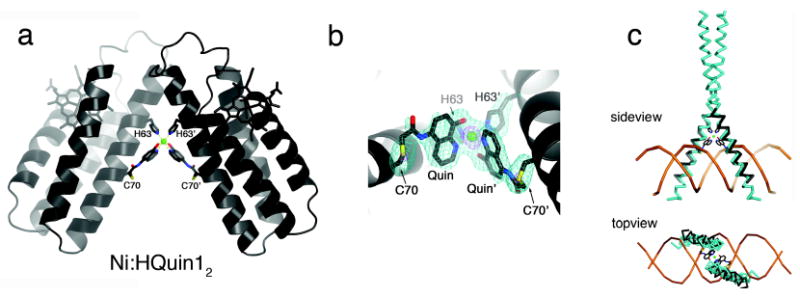
(a) Crystal strucure of the Ni:HQuin12 dimer. (b) Closeup view of the Ni coordination environment and the corresponding Fo – Fc omit difference map (cyan – 3 σ, purple – 9 σ). (c) Backbone superposition of the Helix3 domains of Ni:HQuin12 (black) onto the basic domain of Jun bZip homodimer (cyan) complexed with cAMP responsive element (CRE) (brown) (PDB ID: 1JNM).
Stereochemical considerations suggest that there is one other possible isomer for His-Quin/Ni coordination that could lead to the formation of an alternative HQuin1 dimer in an antiparallel arrangement, again with little protein-protein contact (Figure 6). This alternative isomer would pose the Quin groups in a trans arrangement, whereby the equatorial plane would be formed by the Quin donor atoms and the axial positions would be occupied by the His ligands. In order to determine if there is a thermodynamic basis for the exclusive population of the observed “cis-Quin” isomer, we carried out Density Functional Theory (DFT) calculations (ADF 2007.01, ZORA/TZ2P basis set). Using BP86 and OLYP functionals in parallel, we calculated the optimized coordination geometries and corresponding energies for the cis-Quin and the trans-Quin isomers (Section S4). These calculations bore out two important results: 1) The crystallographically-determined bond distances and angles closely approximate those of the calculated cis-Quin species (Tables S4.3 and S4.4), confirming our previous conclusion that Ni coordination is not strained by covalent linkages to the protein backbone. 2) The cis-Quin isomer is on average ∼6 kcal/mol more stable than trans-Quin (Table S2.8), due likely to the trans-directing effect of the imine ligands which would render a mutual trans orientation of the weaker-field phenolate ligands the least destabilized configuration. This significant energy difference should lead to the cis-Quin isomer being exclusively formed in solution, and ultimately to the formation of a single, discrete protein dimer. The engineering of a preferred dimeric protein conformation over others often requires implementation of negative design strategies (destabilization of undesired conformations that often lie close in energy) alongside the optimization of the desired target. While remarkable success has been achieved in some cases,4, 17-19 such design efforts are time- and labor-intensive and not readily generalizable. In our approach, dimerization specificity can be achieved through the consideration of only a few metal-ligand bonds, which eliminates the need to design large molecular surfaces and renders it readily applicable for other helical proteins.
Figure 6.
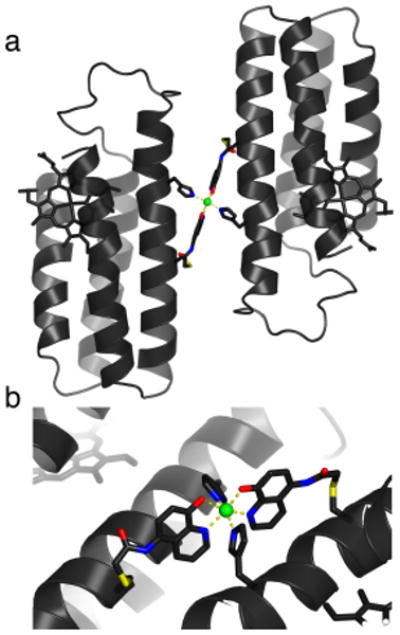
(a) Model for the alternative dimeric arrangement of Ni:HQuin12. (b) Closeup view of the corresponding octahedral Ni coordination environment. The modeling was done manually in XFIT,16 whereby a copy of the crystallographically determined HQuin1 protomer with the tridentate coordination motif was taken as a rigid unit and possible dimeric arrangements were explored where the octahedral coordination preference of Ni2+ would be fulfilled. The model illustrated here was found to be the only stereochemically allowed alternative arrangement.
A major objective of MDPSA is to access biologically functional geometries in a completely metal dependent fashion. This goal, in theory, would allow for the construction of biologically active structures with novel or expanded functionalities. Therefore, it was exciting to discover that structurally the V-shaped architecture of Ni:HQuin12 is closely reminiscent of the DNA-binding domains of the bZIP-family transcription factors. The bZIP proteins consist of a flexible, “proto-helical” basic domain that interacts with the DNA major groove and a helical leucine-zipper domain whose dimerization is necessary for the preorganization of the basic domain for stable DNA binding. Starting with the works of Kim20 and Schepartz,21 it has been shown in many instances that DNA recognition by bZIP proteins is sensitively dependent on the dimeric orientation of the basic domains. A structural superposition of the Helix3 regions (M58-N80) of the Ni:HQuin12 dimer with the DNA-bound basic domain of a representative bZIP protein reveals a very close match, with a root-mean-square-deviation of 1.6 Å over 46 Cα's (Figure 6c). This example demonstrates the potential utility of surface HCM's in directing the formation of rigid protein/peptide structures that are poised to recognize biological targets without the need for engineering extensive protein surfaces or peripheral oligomerization domains.
Conclusion
In summary, our proof-of-principle studies show that helical protein surfaces provide an ideal scaffold for the construction of multidentate coordination motifs that consist of natural and non-natural metal ligands. HCMs simultaneously combine the advantages of high metal binding affinity, helix stabilization with the ability to precisely control protein oligomerization, based solely on the inner-sphere coordination of the metal center. The functional versatility of HCMs, combined with their implicitly modular nature and ease of construction, should render them useful in many applications, ranging from selective protein labeling with metal reporters and protein purification to construction of superprotein architectures and probing protein-protein and protein-DNA interactions. Such efforts are currently being pursued in our laboratory.
Experimental Section
Site Directed Mutagenesis and Protein Expression/Purification/Characterization
Site directed mutagenesis was performed on the pETc-b562 plasmid (denoted as wild-type)22 using the QuikChange kit (Stratagene) and employing primers obtained from Integrated DNA Technologies. The mutant plasmids were transformed into XL-1 Blue E. coli cells and purified using the QIAprep Spin Miniprep kit (Qiagen). Point mutations were executed to obtain the following cyt cb562 variants: G70C-cyt cb562 and G70C/H63A-cyt cb562. Sequencing of all mutant plasmids was carried out by Retrogen Inc. (San Diego, CA).
The mutant plasmids isolated from XL-1 blue cells was transformed into BL21(DE3) E. coli cells along with the ccm heme maturation gene cassette plasmid, pEC86.23 Cells were plated on LB agar, containing 100 μg/ml ampicillin and 34 μg/mL chloramphenicol, and grown overnight. LB medium was then inoculated from these colonies and allowed to incubate for 16 hours at 37° C, with rotary shaking at 250 rpm. No induction was necessary. Mutant-expressing cells were sonicated, brought to pH 5 with the addition of HCl, and centrifuged at 16,000 g, 4° C, for 1 hr. The protein was then purified by ion-exchange chromatography on a CM-Sepharose matrix (Amersham Biosciences) using a NaCl gradient in sodium acetate buffer (pH 5). After exchange into sodium phosphate buffer (pH 8) the protein was further purified using an Uno-Q (BioRad) anion exchange column on a DuoFlow chromatography workstation (BioRad) using a NaCl gradient. Protein purity was determined by SDS-PAGE gel electrophoresis. Verification of mutations was made through MALDI mass spectrometry (MW (G70C-cyt cb562) = 12386 amu, MW (G70C/H63A-cyt cb562) = 12320 amu).
Synthesis of Iodoacetamido-8-hydroxyquinoline (IA-Quin)
As a precursor, iodoacetic acid anhydride was freshly prepared by adding 660 mg (3.20 mmol) of dicyclohexylcarbodiimide (DCC) (Sigma) to a stirred solution of 1.19 g (6.43 mmol) iodoacetic acid (Sigma) in 25 mL of ethyl acetate. Dicyclohexylurea precipitates immediately, but the mixture was allowed to stir for 2 hrs in the dark. The dicyclohexylurea was removed by filtration and the resulting solution was evaporated to dryness. 500 mg (2.14 mmol) of 5-amino-8-hydroxyquinoline dihydrochloride (Sigma) was dissolved in 10 ml of acetonitrile by refluxing overnight with 975 μL (7 mmol) of triethylamine. The solution was filtered and the iodoacetic acid anhydride, dissolved in 5 ml of acetonitrile, was added. The mixture was allowed to react in the dark overnight. The product evaporated to dryness and washed extensively with cold 5% sodium bicarbonate and water and dried in vacuo (Yield: 75%). Synthesis of IA-Quin was verified by mass spectrometry (ESI-MS, positive mode). Measured mass = 329.05 amu (expected mass = 328.9) (M + H+)
Functionalization of G70C-cyt cb562 and G70C/H63A-cyt cb562 with IA-Quin and iodoacetic acid to obtain HQuin1, AQuin1 and carboxymethylated (CM)-G70C-cyt cb562
A solution of 0.3 mM G70C-cyt cb562 or G70C/H63A-cyt cb562 in degassed 0.1 M Tris buffer (pH 7.75) was treated with a 10-fold excess of dithiothreitol (DTT) (Sigma). The protein was allowed to reduce for a period of 30 min. The protein was then dialyzed against 2 × 1 L of degassed 0.1 M Tris buffer (pH 7.75) under an inert atmosphere to remove the DTT. A 10-fold excess of IA-Quin or iodoacetic acid was dissolved in 2 mL of degassed dimethylformamide (DMF) and added dropwise to the protein solution over the course of 1 min. The mixture was allowed to react in the dark at 25° C overnight. The reaction mixture was then dialyzed again against 2 × 1 L of 10 mM sodium acetate (pH 5) and 1 mM ethylenediaminetetraacetic (EDTA). The crude labeled protein was subsequently purified on an Uno-S cation-exchange column (BioRad) using an NaCl gradient. The purity of the functionalized protein was determined by MALDI mass spectrometry and SDS-PAGE electrophoresis (Labeling yield: 60-95%). MW(HQuin1) = 12590 amu (exp. = 12589 amu); MW(AQuin1) = 12522 amu (exp. = 12523 amu); MW(CM-G70C-cyt cb562) = 12447 amu (exp. = 12446 amu).
Chemical Denaturation
5 mL of an unfolded protein (CM-G70C-cyt cb562, HQuin1 or AQuin1) solution containing 5 μM of protein and 1 mM of M2+ or EDTA was freshly prepared in ∼ 8 M guanidine HCl (GuHCl) in the appropriate buffer (either 0.1 M Tris buffer (pH 7.5) or 0.1 M sodium acetate (pH 5.5)). In parallel, 3 mL of a folded protein solution containing 5 μM protein in the appropriate buffer (either 0.1 M Tris buffer (pH 7.5) or 0.1 M sodium acetate (pH 5.5)) and 1 mM M2+ or EDTA was prepared. The unfolded protein stock was titrated into the folded protein stock at 25°C using an autotitrator (Microlab 500 Series), keeping the sample volume constant at 2 mL; protein unfolding/folding was monitored by CD spectroscopy (222 nm) on an Aviv 215 spectrometer. For every titration point, the solution was allowed to stir for 30 seconds in order to reach equilibrium. This procedure was repeated for a minimum of 20 points covering a GuHCl range of 0.1-6.5 M. GuHCl concentrations were calculated using the refractive indices of the folded and unfolded protein stock solutions.24 Unfolding data were fit using Kaleidagraph (Synergy Software) with an expression that assumes a two-state folding/unfolding equilibrium as described by Pace (eq. 1):25
| (1) |
Where m1 represents the slope of the unfolding transition and is defined as (∂ΔGH2O/∂[GuHCl]) and m2 represents the midpoint GuHCl concentration where 50% of the protein is unfolded. It is confirmed through sedimentation velocity experiments that all proteins, including HQuin1, remained in their monomeric form at under the conditions (5 μM of protein and 1 mM M2+) used in chemical denaturation experiments (Figure S1.5). Fitting parameters for each titration is given in Table S2.5.
Thermal Unfolding
A 3 mL solution of HQuin1 containing 5 μM protein in 0.1 M Tris buffer (pH 7.5) and 1.5 M GuHCl was prepared. Addition of 1.5 M GuHCl was necessary to ensure that HQuin1 fully unfolds below 100°C. To the protein solutions either 1 mM Ni2+ or EDTA was added. The unfolding reaction was monitored by CD spectroscopy (222 nm). At each temperature, the solution was allowed to stir for 30 sec in order to reach equilibrium. This procedure was repeated for a minimum of 20 points covering a temperature range of 300-376 K. Although the thermal unfolding of HQuin1 is not completely reversible (i.e., the 222 nm CD signal does not return to pre-melting conditions), the curve was fit to a two-state model as described by John and Weeks (equation 2),26 to obtain an apparent ΔTmmetal. Unfolding data were fit using Kaleidagraph (Synergy Software) to the following equation:
| (2) |
where ΔHvH is the change in the van't Hoff transition enthalpy, Tm is melting point, T is the temperature in Kelvin and R is the universal gas constant. Table of thermal unfolding parameters is given in Table S2.6.
Metal Binding Titrations
General
Unless otherwise stated, all metal (M2+) binding titrations were prepared by diluting a concentrated protein stock solution (HQuin1 or AQuin1) to a final volume of 2 mL with a final protein concentration ranging from 2 to 10 μM. All titrations were performed in 50 mM MOPS buffer (pH 7) previously treated with Chelex resin (Bio-Rad) to ensure a metal free environment. All pipette tips were rinsed 3× in an analytical grade 5% HNO3 (Fluka) solution before use. All further procedures followed to ensure a metal-free environment have been previously outline by Linse.27 Titration data were fit using non-linear regression on Dynafit 3 (BioKin). All absorption spectra were obtained on an HP 8452A spectrophotometer. HQuin1 and AQuin1 concentrations were determined based on the Soret absorption maximum for cyt cb562 at 415 nm (ε = 0.148 μM-1 cm-1).22 All data were baseline-corrected and adjusted for dilution. Change in absorbance at 264 nm, (ΔA264 nm), which displays the largest increase upon M2+ binding, was plotted as a function of M2+ concentration. The change in extinction coefficient at 264 nm due to metal binding (Δε264 nm) was calculated based on titration data and held fixed during fitting. UV-vis absorbance profile for a representative titration (Zn binding) is shown in Figure 1. Due to the nature of the HQuin1 and AQuin1 system to self-associate, data were fit to a combined 1:1 and a 1:1/1:2 model. The latter model (1:2) was incorporated to account for both metal-induced protein dimerization. In all cases, the data were fit using both models. Titration curves for each metal for HQuin1 and AQuin1 can be found in Figures 2 and S2.1 respectively. The determined dissociation constants for HQuin1 and AQuin1 can be found in tables 1 and S2.1 – S2.4 respectively.
HQuin1 titrations
To a 2 ml solution of HQuin1, containing a known amount of EGTA (25-100 μM), successive aliquots of an appropriate M2+ stock (100 μM-2.5 mM) in 50 mM MOPS (pH 7) were added. The total amount of M2+ added never exceeded 100 μL (5% of the total volume). M2+ dissociation constants for EGTA were calculated using MaxChelator (http://maxchelator.stanford.edu) and fixed during data fitting. Despite the fact that the HQuin1 concentrations are sufficiently low to prevent a significant extent of dimer formation, the titration data were separately fit to two models, which do or do not take metal-induced protein dimerization into account (Tables S2.1 and S2.2). Changes in the extinction coefficient at 264 nm (Δε264) were calculated separately for each measurement and held fixed during final regression analysis. The Δε264 values used for different metals were 21560, 28920, 28970, 24090 M-1 cm-1 for Co2+, Ni2+, Cu2+ and Zn2+, respectively.
AQuin1 Titrations
Due the lower affinity of AQuin1 (compared to HQuin1) for M2+, inclusion of EGTA as a competing ligand was not necessary. The sole exception was Cu2+, whose high affinity for AQuin1 required the addition of 25 μM EGTA. Titration data were handled in a similar manner to those of HQuin1. Once again, changes in extinction coefficient at 264 nm due to metal binding (Δε264 nm) were calculated for each titration and held fixed during the regression analysis. Titration data for AQuin1 were fit to both 1:1 and 1:1/1:2 models. Despite the fact that AQuin1 concentrations are sufficiently low to prevent a significant extent of dimer formation, in all cases data were notably better described by a model that included metal-induced dimerization (1:1/1:2). We attribute the heightened ability of AQuin1 to dimerize to the added flexibility the Quin moiety without the coordinating H63 residue. Regardless, dissociation constants (KDmetal) for AQuin1 calculated unsing 1:1 and 1:1/1:2 models are listed in Tables S2.3 and S2.4.
Sedimentation Velocity
Sedimentation velocity (SV) experiments were performed in order to determine the solution-state oligomerization behavior of HQuin1. All SV samples were prepared in 20 mM Tris buffer (pH 7). Measurements were made on a Beckman XL-I Analytical Ultracentrifuge (Beckman-Coulter Instruments) using an An-60 Ti rotor at 41,000 rpm for a total of 250 scans per sample. The following wavelengths were used for detection: 418 nm (5 μM protein), 425 nm (10 μM protein), 524 nm (25 μM protein) and 580 nm (200 μM protein).
All data were processed using SEDFIT.28 Buffer viscosity, buffer density, and protein partial specific volume values were calculated at 25° C with SEDNTERP (http://www.jphilo.mailway.com). Partial specific volume (Vbar) for HQuin1 mutant was calculated to be 0.7347 mg/ml, assuming a partial specific volume of heme of 0.82 mg/ml and 0.75 mg/ml for the 8-hydroxyquinoline.29 All data were processed using fixed values for buffer density (ρ) (0.99764 g/ml) and buffer viscosity (0.0089485 poise).
X-ray Crystallography
All crystals were obtained by sitting drop vapor diffusion. HQuin1 was crystallized at 25° C using a precipitant solution of 0.1 M Tris (pH 8.5), 25% PEG 1500, and 2.1 mM NiSO4. The drop consisted of 2 μL protein (2.1 mM in 20 mM Tris, pH 7) and 1 μL precipitation solution. Crystals appeared within one month, reaching a maximum size of ∼ 500 μm × 500 μm × 700 μm. The crystals to be used for diffraction experiments were exchanged into a solution containing 20% glycerol as a cryoprotectant and frozen in liquid nitrogen or directly in the cryostream.
X-ray diffraction data were collected at 100 K using an Bruker Apex II CCD detector and monochromatized Cu-Kα radiation (1.54 Å) produced by a Siemens sealed source. The data were processed using SAINT and Bruker SADABS. The structure of HQuin1:Ni was determined at 2.3 Å (P21212 spacegroup), by molecular replacement with PHASER,30 using the monomeric cyt cb562 structure (PDB ID: 2BC5)22 as the search model. The search model did not contain the heme or Quin prosthetic groups; the observation of strong positive Fo-Fc density at expected positions for these groups confirmed the correct placement of the protein monomer in the initial molecular replacement solutions. The topology and parameter files for the 5-acetamido-8-hydroxyquinoline group were obtained using the Dundee ProDrg Server (http://davapc1.bioch.dundee.ac.uk/prodrg/index.html). Rigid-body, positional and thermal refinement with CNS,31 along with manual rebuilding and water placement with XFIT,16 produced the final models. The Ramachandran plots were calculated with PROCHECK.32 All figures were produced with PYMOL.33
The final R and Rfree values of 26.6 and 31.1% are somewhat higher than those for an average 2.3-Å resolution structure. An analysis of the diffraction data reveals no evidence for possible twinning, and molecular replacement and refinement of the data against other spacegroups either do not yield a solution or do not lead to better statistics. We conclude that the high R-factors are likely due to the high solvent content (56%) and the lack of non-crystallographic symmetry within the asymmetric unit.
DFT Calculations
Density Functional Theory calculations were performed with the Amsterdam Density Functional (ADF) program suite,34, 35 version 2007.01.36 Crystallographic atomic coordinates were used as input where appropriate. Optimized geometries and molecular orbitals were visualized with the ADFView graphical routine of the ADF-GUI37 and the Gaussview 3 program. For all atoms, the triple-ζ Slater-type orbital TZ2P ADF basis set was utilized without frozen cores. Relativistic effects were included by use of the zero-order regular approximation (ZORA).38 To ensure consistency over a range of exchange/correlation profiles, the molecular geometries and energies were evaluated with both the BP86 and OLYP functionals. For BP86, the local density approximation (LDA) of Vosko et al.39 (VWN) was coupled with the generalized gradient approximation (GGA) corrections described by Becke40 and Perdew41, 42 for electron exchange and correlation, respectively. For OLYP, the parameterized (X = 0.67) exchange-only LDA was coupled with the GGA corrections described by Handy and Cohen (OTPX)43 and Lee, Yang and Parr (LYP)44 for electron exchange and correlation, respectively. All DFT calculations were performed on a home-built 72-CPU (1 × 8 master, 8 × 8 slave) Rocks 4.3 Linux cluster featuring Intel Xeon E5335 Quad-Core 2.00GHz processors. Job control was implemented with the Sun Grid Engine v. 5.3.
Supplementary Material
Acknowledgments
This work was supported by NSF (CHE-0908115), and Beckman Young Investigator and Hellman Faculty Scholar awards (F.A.T.). R.J.R. is supported by an NIH Heme and Blood Training Grant (T32DK007233). We acknowledge Prof. Arnie Rheingold for his help with crystallographic data collection and NSF (CHE-0634989) for the support of the Small-Molecule Crystallography Facility at UCSD.
Footnotes
Protein homodimerization is the simplest form of oligomerization that is frequently utilized for the construction of functional biological assemblies and regulation of cellular pathways. Despite its simplicity, dimerization still poses an enormous challenge for protein engineering and chemical manipulation, owing to the large molecular surfaces involved in this process. We report here the construction of a hybrid coordination motif – consisting of a natural (His) and a non-natural ligand (quinolate) – on the α-helical surface of cytochrome cb562, which a) simultaneously binds divalent metals with high affinity, b) leads to a metal-induced increase in global protein stability, and importantly, c) enables the formation of a discrete protein dimer, whose shape is strictly dictated by the inner-sphere metal coordination geometry. The crystallographically-determined arrangement of metal-crosslinked α-helices closely approximate that of the DNA-binding domains of bZIP family transcription factors.
Supporting Information Available: Additional experimental details, figures, and tables. This material is available free of charge via the Internet at http://pubs.acs.org.
References
- 1.Marianayagam NJ, Sunde M, Matthews JM. Trends Biochem Sci. 2004;29:618–625. doi: 10.1016/j.tibs.2004.09.006. [DOI] [PubMed] [Google Scholar]
- 2.Jones S, Thornton JM. Prog Biophys Mol Biol. 1995;63:31–59. doi: 10.1016/0079-6107(94)00008-w. [DOI] [PubMed] [Google Scholar]
- 3.Kuhlman B, O'Neill JW, Kim DE, Zhang KYJ, Baker D. Proc Natl Acad Sci USA. 2001;98:10687–10691. doi: 10.1073/pnas.181354398. [DOI] [PMC free article] [PubMed] [Google Scholar]
- 4.Bolon DN, Grant RA, Baker TA, Sauer RT. Proc Natl Acad Sci USA. 2005;102:12724–12729. doi: 10.1073/pnas.0506124102. [DOI] [PMC free article] [PubMed] [Google Scholar]
- 5.Gendreizig S, Kindermann M, Johnsson K. J Am Chem Soc. 2003;125:14970–14971. doi: 10.1021/ja037883p. [DOI] [PubMed] [Google Scholar]
- 6.Shahian T, Lee GM, Lazic A, Arnold LA, Velusamy P, Roels CM, Guy RK, Craik CS. Nat Chem Biol. 2009;5:640–646. doi: 10.1038/nchembio.192. [DOI] [PMC free article] [PubMed] [Google Scholar]
- 7.(a) Salgado EN, Faraone-Mennella J, Tezcan FA. J Am Chem Soc. 2007;29:13374–13375. doi: 10.1021/ja075261o. [DOI] [PMC free article] [PubMed] [Google Scholar]; (b) Salgado EN, Lewis RA, Faraone-Mennella J, Tezcan FA. J Am Chem Soc. 2008;130:6082–6084. doi: 10.1021/ja8012177. [DOI] [PMC free article] [PubMed] [Google Scholar]; (c) Salgado EN, Lewis RA, Mossin S, Rheingold AL, Tezcan FA. Inorg Chem. 2009;48:2726–2728. doi: 10.1021/ic9001237. [DOI] [PMC free article] [PubMed] [Google Scholar]
- 8.Radford RJ, Tezcan FA. J Am Chem Soc. 2009;131:9136–9137. doi: 10.1021/ja9000695. [DOI] [PMC free article] [PubMed] [Google Scholar]
- 9.Lombardi A, Summa CM, Geremia S, Randaccio L, Pavone V, DeGrado WF. Proc Natl Acad Sci USA. 2000;97:6298–6305. doi: 10.1073/pnas.97.12.6298. [DOI] [PMC free article] [PubMed] [Google Scholar]
- 10.Martell AE, Smith RM. Critical Stability Constants. Plenum Press; New York: 1974-1989. [Google Scholar]
- 11.Irving H, Williams RJP. Nature. 1948;162:746–747. [Google Scholar]
- 12.Fletcher S, Hamilton AD. J R Soc Interface. 2006;3:215–233. doi: 10.1098/rsif.2006.0115. [DOI] [PMC free article] [PubMed] [Google Scholar]
- 13.Moellering RE, Cornejo M, Davis TN, Bianco CD, Aster JC, Blacklow SC, Kung AL, Gilliland DG, Verdine GL, Bradner JE. Nature. 2009;462:182–188. doi: 10.1038/nature08543. [DOI] [PMC free article] [PubMed] [Google Scholar]
- 14.Regan L, Rockwell A, Wasserman Z, DeGrado W. Prot Sci. 1994;3:2419–2427. doi: 10.1002/pro.5560031225. [DOI] [PMC free article] [PubMed] [Google Scholar]
- 15.Crispini A, Puccis D, Sessa S, Cataldi A, Napoli A, Valentini A, Ghedini M. New J Chem. 2003;27:1497–1503. [Google Scholar]
- 16.McRee DE. J Mol Graphics. 1992;10:44–46. [Google Scholar]
- 17.Havranek JJ, Harbury PB. Nat Struct Biol. 2003;10:45–52. doi: 10.1038/nsb877. [DOI] [PubMed] [Google Scholar]
- 18.Kortemme T, Joachimiak LA, Bullock AN, Schuler AD, Stoddard BL, Baker D. Nat Str Mol Biol. 2004;11:371–379. doi: 10.1038/nsmb749. [DOI] [PubMed] [Google Scholar]
- 19.Grigoryan G, Reinke AW, Keating AE. Nature. 2009;458:859–864. doi: 10.1038/nature07885. [DOI] [PMC free article] [PubMed] [Google Scholar]
- 20.Talanian RV, McKnight CJ, Kim PS. Science. 1990;249:769–771. doi: 10.1126/science.2389142. [DOI] [PubMed] [Google Scholar]
- 21.Cuenoud B, Schepartz A. Science. 1993;259:510–513. doi: 10.1126/science.8424173. [DOI] [PubMed] [Google Scholar]
- 22.Faraone-Mennella J, Tezcan FA, Gray HB, Winkler JR. Biochemistry. 2006;45:10504–10511. doi: 10.1021/bi060242x. [DOI] [PubMed] [Google Scholar]
- 23.Braun M, Thony-Meyer L. Proc Natl Acad Sci USA. 2004;101:12830–12835. doi: 10.1073/pnas.0402435101. [DOI] [PMC free article] [PubMed] [Google Scholar]
- 24.Nozaki Y. Methods Enzymol. 1972;26:43–50. doi: 10.1016/s0076-6879(72)26005-0. [DOI] [PubMed] [Google Scholar]
- 25.Pace NC, Shirley BA, Thomson JA. In: Protein Structure: A Practical Approach. Creighton TF, editor. IRL Press; Oxford: 1990. pp. 311–330. [Google Scholar]
- 26.John DM, Weeks KM. Prot Sci. 2000;9:1416–1419. doi: 10.1110/ps.9.7.1416. [DOI] [PMC free article] [PubMed] [Google Scholar]
- 27.Linse S. Calcium-Binding Protein Protocols, Vol. 2. In: Vogel HJ, editor. Methods and Techniques. Vol. 2. Totowa: Humana Press; 2002. [Google Scholar]
- 28.Schuck P. Biophys Chem. 2004;108:187–200. doi: 10.1016/j.bpc.2003.10.016. [DOI] [PubMed] [Google Scholar]
- 29.Calculated using Advanced Chemistry Development (ACD/Labs) Software V8.14 for Solaris (© 1994-2009 ACD/Labs).
- 30.Collaborative Computational Project, Number 4. The CCP4 Suite: Programs for Protein Crystallography. Acta Cryst. 1994;D50:760–763. doi: 10.1107/S0907444994003112. [DOI] [PubMed] [Google Scholar]
- 31.Brünger AT, Adams PD, Clore GM, DeLano WL, Gros P, Grosse-Kunstleve RW, Jiang JS, Kuszewski J, Nilges M, Pannu NS, Read RJ, Rice LM, Simonson T, Warren GL. Acta Crystallogr D. 1998;54:905–921. doi: 10.1107/s0907444998003254. [DOI] [PubMed] [Google Scholar]
- 32.Laskowski RA, Macarthur MW, Moss DS, Thornton JM. J Appl Crystallogr. 1993;26:283–291. [Google Scholar]
- 33.DeLano WL. The PYMOL Molecular Graphics System. 2003 http://www.pymol.org.
- 34.Te Velde G, Bickelhaupt FM, Baerends EJ, Fonseca Guerra C, van Gisbergen SJA, Snijders JG, Ziegler T. J Comput Chem. 2001;22:931–67. [Google Scholar]
- 35.Guerra CF, Snijders JG, te Velde G, Baerends EJ. J Theor Chem Acc. 1998;99:391–403. [Google Scholar]
- 36.ADF2007.01, SCM. Theoretical Chemistry. Vrije Universiteit, Amsterdam; The Netherlands: www.scm.com. [Google Scholar]
- 37.ADF-GUI 2007.01, SCM. Amsterdam, The Netherlands: www.scm.com Access date, February, 2008. [Google Scholar]
- 38.van Lenthe E, Baerends EJ, Snijders JG. J Chem Phys. 1993;99:4597–4610. [Google Scholar]
- 39.Vosko SH, Wilk L, Nusair M. Can J Phys. 1980;58:1200–1211. [Google Scholar]
- 40.Becke AD. Phys Rev A. 1988;38:3098–3100. doi: 10.1103/physreva.38.3098. [DOI] [PubMed] [Google Scholar]
- 41.Perdew JP, Yue W. Phys Rev B. 1986;33:8800–8802. doi: 10.1103/physrevb.33.8800. [DOI] [PubMed] [Google Scholar]
- 42.Perdew JP. Phys Rev B. 1986;34:7406–7406. [PubMed] [Google Scholar]
- 43.Handy NC, Cohen AJ. Mol Phys. 2001;99:403–412. [Google Scholar]
- 44.Lee CT, Yang WT, Parr RG. Phys Rev B. 1988;37:785–789. doi: 10.1103/physrevb.37.785. [DOI] [PubMed] [Google Scholar]
Associated Data
This section collects any data citations, data availability statements, or supplementary materials included in this article.


