


Abstract
We provide a novel web service, called rQuant.web, allowing convenient access to tools for quantitative analysis of RNA sequencing data. The underlying quantitation technique rQuant is based on quadratic programming and estimates different biases induced by library preparation, sequencing and read mapping. It can tackle multiple transcripts per gene locus and is therefore particularly well suited to quantify alternative transcripts. rQuant.web is available as a tool in a Galaxy installation at http://galaxy.fml.mpg.de. Using rQuant.web is free of charge, it is open to all users, and there is no login requirement.
INTRODUCTION
The current revolution in sequencing technologies allows us to obtain a much more detailed picture of transcriptomes via RNA-Sequencing (RNA-Seq) (1–3). Studying them under different conditions or in mutants will lead to a considerably improved understanding of the underlying mechanisms of gene expression and processing. An important prerequisite is to be able to accurately determine the full complement of RNA transcripts and to infer their abundance in the cell. Due to the various limitations and biases in next-generation sequencing (NGS) technologies, such analyses are less straightforward than one might naïvely expect. In particular, for accurate quantitation of RNA transcripts it appears essential to take the contribution of such biases and other technical limitations into account. rQuant implements this idea by simultaneously estimating the effect of biases as well as the abundance of RNA transcripts (4,5).
For the study of transcriptomes, currently available techniques rely on converting the RNA molecules in the sample into cDNA fragments prior to sequencing. A large portion of the observed distortions arise during cDNA library preparation, dependending on the used protocol (crucial factors are, for instance, priming, fragmentation and size selection) (3 and references therein). As a result, the reads are non-uniformly distributed along the transcript, influenced by the length of the transcript and the distance to the transcript boundaries (cf. Figure 1a). Moreover, we find that the read coverage also heavily depends on the sequence context of the fragments (6,7). We have observed that mono-nucleotides as well as di-nucleotides do not appear at the same frequency along the read, in particular at the 5′-end of the read (5). This is consistent with similar observations for small RNA expression profiling (8).
Figure 1.

Transcript profiles: (a) Normalized read coverage with respect to the relative transcript position is shown grouped by five different transcript length bins for the C. elegans SRX001872 data set (16); (b) The key component of rQuant is to infer the underlying read coverage of all transcripts at one gene locus (two transcripts in this illustration on the right: transcript 1 is shown in orange and transcript 2 in green), such that the differences between the observed (grey) and expected (blue) read coverage is minimized. The expected read coverage is inferred from the transcript abundances w1 and w2 and the transcript profiles (shown in the graphs on the right), which are inferred simultaneously for several loci.
Biases are also induced by data processing, for instance, when mapping the sequence reads to a reference genome. Depending on how well the mapping method can align spliced reads, the read coverage in proximity of splice junctions typically drops compared to other exonic regions.
Most of these biases can be estimated relatively easily when exactly one transcript per locus is expressed. If, however, one considers highly complex transcriptomes, such as the one in humans, the inference is considerably more difficult (5) and methods like rQuant are needed to simultaneously estimate biases and transcript abundances.
There exist a few other quantitation techniques for RNA-Seq experiments (9–12). Most of these approaches do not take the biases into account and also differ in their approach estimating abundances. Moreover, to the best of our knowledge, rQuant.web is currently the only web service that allows the estimation of transcript abundances from RNA-Seq experiments. This service is embedded into a suite of tools for aligning reads using a combination of PALMapper (13, 14, G. Jean et al., submitted for publication), infering new transcripts via mTiM and mGene (15), and also for testing significance between samples (currently under development).
METHODS: rQuant
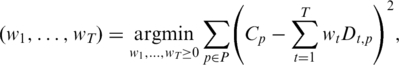
To infer the abundance of given transcripts from RNA-Seq data, we previously developed a technique, called rQuant, which is based on solving quadratic programming problems (4,5). Given an annotation of (alternative) transcripts and a set of reads that have been aligned to the reference genome, rQuant infers the abundance of each annotated transcript by minimizing the deviation of the observed from the expected read coverage at each covered nucleotide (cf. Figure 1b). Formally, rQuant solves the following optimization problem:
 |
(1) |
where T is the number of transcripts, w1, … , wT are the transcript abundance estimates, P is the set of genomic positions considered (corresponding to one genic locus), Cp is the observed read coverage (i.e. the number of reads covering a position) and Dt,p is the (estimated) read density of transcript t at position p. When using rQuant without bias estimation, Dt,p = 1, if transcript t is exonic at position p, and 0 otherwise. In an extended model described in Ref. (5), the coverage of introns with spliced reads appears as an additional term in the above optimization problem.
Due to the experimental biases mentioned above, the observed read coverage is typically non-uniform over the transcript (cf. Figure 1a). Then, Dt,p may depend on the relative position in the transcript, the distance to exon boundaries and the sequence context. While the first estimation step is solved for each genic locus independently, the optimization with respect to the biases considers many loci simultaneously and builds a predictive model for the expected read density Dt,p(θ) parameterized by θ. The basic idea is to find parameters θ such that the resulting read densities fit well to the observed read coverages. rQuant solves the following optimization problem:
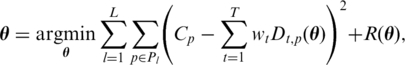 |
where L is the number of loci, Pl is the set of positions considered for each locus, Dt,p(θ) is the θ-parametrized read density for transcript t at position p and R(θ) is an appropriately chosen regularization term to avoid model overfitting. The details of this estimation step and of the density model Dt,p(θ) are given in Ref. (5).
In Ref. (4), we have tested the accuracy of rQuant using artificially generated reads. In the absence of unbiased and precise quantitation techniques to compare against, the generation of artificial reads from transcripts of known abundance appears to be the only viable option. Only in this case we indeed know the ground truth such that we can evaluate how well the method performs. To obtain artificial reads, we used the ‘FluxSimulator’ (17), a software for transcriptome and read generation that simulates the biochemical processes underlying the library preparation. We generated reads from 563 transcripts of 244 alternatively spliced genes in Caenorhabditis elegans. Subsequently, we applied several variants of rQuant to quantify the transcripts from the simulated reads. In particular, we considered quantifying without profiles [as in Ref. (9) and/or by averaging read coverages over segments as in Ref. (12)]. The results of this comparison are shown in Table 1. We observe that rQuant achieves the highest accuracy when estimating density biases and considering the read coverages at each nucleotide independently. A more detailed comparison to other methods is given in Ref. (5).
Table 1.
Evaluation of rQuant
| Approach | Pearson's correlation |
|
|---|---|---|
| Across genes | Within genes | |
| Position-based with profiles | 0.882 | 0.622 |
| Segment-based with profiles | 0.818 | 0.451 |
| Position-based without profiles | 0.857 | 0.511 |
| Segment-based without profiles | 0.800 | 0.402 |
We compared the full version of rQuant to versions that use averages of read coverages in exon segments instead of considering each position separately and/or do not estimate density biases. We used a set of simulated reads from alternative transcripts with known expression level [for details cf. (4)]. The Pearson's correlation between true and inferred abundance was calculated across all transcripts, as well as the average of Pearson's correlation within alternative transcripts of each gene.
WEB SERVER
We provide rQuant.web within the Galaxy framework (18,19), facilitating an easy interaction between integrated tools, storing the queries and results in user histories, and conveniently using workflows for re-occurring tasks. The concept of Galaxy is to split bigger analysis tasks into smaller steps that may be reused in combination with other tools. In Ref. (20), we described a web-based genome annotation system, called mGene.web, which provides a set of tools for genome-based analyses. For rQuant.web, we partially reuse the established data structures, such as genome and annotation objects [see Ref. (20) for a detailed description of these modules]. Moreover, rQuant.web makes use of an as yet unpublished Galaxy-based NGS analysis toolbox for NGS data (available at http://getgalaxy.org).
Modules
rQuant.web currently consists of three main components: data preparation, quantitation and bias estimation.
Data preparation
As a first step when using rQuant.web, one starts with uploading the reference genome in FASTA format, a set of transcripts in GFF3 format and the alignments of reads from an RNA-Seq experiment in BAM format (21). Data can be uploaded using Get Data → Upload File. For the upload, either the Browse button can be used or the URL to a file stored on e.g. a FTP server can be pasted (particularly suitable for larger files).
The tools GenomeTool and GFF2Anno convert the reference genome sequence and the annotation, respectively, into internal data structures for efficient processing [cf. (20)]. Read alignments can also be uploaded in uncompressed alignment format (SAM) and then be converted to BAM format employing the tool SAM-to-BAM in section NGS: SAM Tools; this uses the SAM toolbox (21). Taking the aligned read data in the commonly used SAM/BAM format, our toolbox is applicable to read data from different NGS platforms, e.g. Illumina GA or SOLiD. The bias model estimation is motivated by the observations based on Illumina read data and cDNA library preparation protocols used for this platform. However, similar observations have been made for other platforms when using similar library preparation protocols. Alternatively, raw reads can be uploaded in FASTQ format and can then be aligned to the reference genome by applying tools also provided within the Galaxy framework [cf. sections NGS: Mapping, based on an as yet unpublished NGS Toolbox, and NGS: QPALMA Tools (13, G. Jean et al., submitted for publication)].
Before performing the actual quantitation, the user has the option to check for the consistency of the uploaded alignments and annotation with the tool ReadStats. It generates statistics about the input files, e.g. displays the number of reads identified in the given annotation, the median read coverage per gene, the number of spliced reads and the number of spliced reads overlapping annotated introns.
Quantitation
With the three prepared inputs, the core rQuant component determines the abundance of each transcript in the given annotation. When not using read density estimates, this tool does not have any parameters that need to be specified. The output is a GTF file which contains the annotation with abundance estimates given for each annotated transcript. rQuant computes two abundance estimates: one is based on the estimated average read coverage (ARC) for each transcript and one is the number of reads per thousand bases per million mapped reads (RPKM) (3). The ARC value is the result of the optimization problem (1), i.e. corresponding to variables w1, … , wT, and the RPKM value is computed based on the ARC value, the transcript length and the total number of aligned reads.
Read density estimation
To improve the accuracy of the abundance estimation, rQuant can also be used to infer a read density model to predict the read density for considered transcripts. This is done by selecting Learn Profiles and choosing a number of iterations for estimation. Then rQuant iteratively estimates the transcript abundances as well as the read density biases over several transcripts. Typically, not more than five iterations are needed to reach convergence. The output are the abundance estimates as before and a file that contains the parameters for the read density model. This parameter file can be used later for quantitations without the need to reoptimize these parameters (select Load profiles).
Examples and instructions
A description of rQuant.web with examples is available at http://fml.mpg.de/raetsch/suppl/rquant/web and at http://galaxy.fml.tuebingen.mpg.de/ (in section NGS: Quantitation Tools → Examples and Instructions).
rQuant.web histories and workflows
A history containing the result of the steps for the provided example can be imported here. In addition, we prepared a workflow covering all steps of the example that can be imported here (this requires an account that can be obtained in the User menu at no charge).
The quantifications, estimated profiles and other objects can be easily shared with other users via Galaxy's share history functionality. Moreover, Galaxy's Data Libraries contain items such as genome sequences and parsed annotations for several organisms for convenience.
Computing time
The median run time per gene locus is a few seconds. We tested rQuant using reads from the SRX001872 RNA-Seq experiment for C. elegans with 1893 annotated genes. The quantitation took about 45 min without coverage bias density. When enabling the coverage bias estimation, the whole process took roughly 1.5 h (one iteration).
DISCUSSION AND OUTLOOK
To the best of our knowledge, rQuant.web is the first and currently the only online tool to quantitatively analyse RNA-Seq data. Our web service is an important contribution to publicly available online NGS tools, enabling RNA-Seq quantitation for any user. It facilitates the analysis of NGS data by being embedded in our Galaxy installation and is very well suited to accurately infer the abundance of alternative transcripts along with a simultaneously learned bias model.
In a next step, we are planning to incorporate several additional features into the current rQuant.web version. A straightforward extension is to allow and exploit paired-end reads. Moreover, we will have an option to estimate the bias induced by the read content (5).
FUNDING
Funding for open access charge: Friedrich Miescher Laboratory of the Max Planck Society.
Conflict of interest statement. None declared.
ACKNOWLEDGEMENTS
rQuant.web uses MOSEK, a commercial interior point algorithm for the solution of mathematical optimization problems (22). We thank the distributors of MOSEK for providing licences to offer this service to the public.
REFERENCES
- 1.Wang Z, Gerstein M, Snyder M. RNA-Seq: a revolutionary tool for transcriptomics. Nat. Rev. Genet. 2009;10:57–63. doi: 10.1038/nrg2484. [DOI] [PMC free article] [PubMed] [Google Scholar]
- 2.Mortazavi A, Williams BA, McCue K, Schaeffer L, Wold B. Mapping and quantifying mammalian transcriptomes by RNA-Seq. Nat. Methods. 2008;5:621–628. doi: 10.1038/nmeth.1226. [DOI] [PubMed] [Google Scholar]
- 3.Pepke S, Wold B, Mortazavi A. Computation for ChIP-seq and RNA-seq studies. Nat. Methods. 2009;6:S22–S32. doi: 10.1038/nmeth.1371. [DOI] [PMC free article] [PubMed] [Google Scholar]
- 4.Bohnert R, Behr J, Rätsch G. Transcript quantification with RNA-Seq data. BMC Bioinformatics. 2009;10(Suppl. 13):P5. [Google Scholar]
- 5.Bohnert R, Rätsch G. Modelling biases for accurate RNA-Seq-based transcript quantitation. 2010 doi: 10.1093/nar/gkq448. Forthcoming, 2010. http://www.fml.mpg.de/raetsch/suppl/rquant (1 June 2010, date last accessed) [DOI] [PMC free article] [PubMed] [Google Scholar]
- 6.Dohm JC, Lottaz C, Borodina T, Himmelbauer H. Substantial biases in ultra-short read data sets from high-throughput DNA sequencing. Nucleic Acids Res. 2008;36:e105. doi: 10.1093/nar/gkn425. [DOI] [PMC free article] [PubMed] [Google Scholar]
- 7.Hansen KD, Brenner SE, Dudoit S. Biases in Illumina transcriptome sequencing caused by random hexamer priming. Nucleic Acids Res. 2010 doi: 10.1093/nar/gkq224. doi:10.1093/nar/gkq224 [14 April 2010, Epub ahead of print] [DOI] [PMC free article] [PubMed] [Google Scholar]
- 8.Linsen SEV, de Wit E, Janssens G, Heater S, Chapman L, Parkin RK, Fritz B, Wyman SK, de Bruijn E, Voest EE, et al. Limitations and possibilities of small RNA digital gene expression profiling. Nat. Methods. 2009;6:474–476. doi: 10.1038/nmeth0709-474. [DOI] [PubMed] [Google Scholar]
- 9.Jiang H, Wong WH. Statistical inferences for isoform expression in RNA-Seq. Bioinformatics. 2009;25:1026–1032. doi: 10.1093/bioinformatics/btp113. [DOI] [PMC free article] [PubMed] [Google Scholar]
- 10.Richard H, Schulz MH, Sultan M, Nurnberger A, Schrinner S, Balzereit D, Dagand E, Rasche A, Lehrach H, Vingron M, et al. Prediction of alternative isoforms from exon expression levels in RNA-Seq experiments. Nucleic Acids Res. 2010 doi: 10.1093/nar/gkq041. doi:10.1093/nar/gkq041 [11 February 2010, Epub ahead of print] [DOI] [PMC free article] [PubMed] [Google Scholar]
- 11.Li B, Ruotti V, Stewart RM, Thomson JA, Dewey CN. RNA-Seq gene expression estimation with read mapping uncertainty. Bioinformatics. 2010;26:493–500. doi: 10.1093/bioinformatics/btp692. [DOI] [PMC free article] [PubMed] [Google Scholar]
- 12.Sammeth M. The Flux Capacitor. 2010 http://flux.sammeth.net/capacitor.html (1 June 2010, date last accessed) [Google Scholar]
- 13.De Bona F, Ossowski S, Schneeberger K, Rätsch G. Optimal spliced alignments of short sequence reads. Bioinformatics. 2008;24:i174–i180. doi: 10.1093/bioinformatics/btn300. [DOI] [PubMed] [Google Scholar]
- 14.Schneeberger K, Hagmann J, Ossowski S, Warthmann N, Gesing S, Kohlbacher O, Weigel D. Simultaneous alignment of short reads against multiple genomes. Genome Biol. 2009;10:R98. doi: 10.1186/gb-2009-10-9-r98. [DOI] [PMC free article] [PubMed] [Google Scholar]
- 15.Schweikert G, Zien A, Zeller G, Behr J, Dieterich C, Ong CS, Philips P, de Bona F, Hartmann L, Bohlen A, et al. mGene: accurate SVM-based gene finding with an application to nematode genomes. Genome Res. 2009;19:2133–2143. doi: 10.1101/gr.090597.108. [DOI] [PMC free article] [PubMed] [Google Scholar]
- 16.Hillier LW, Reinke V, Green P, Hirst M, Marra MA, Waterston RH. Massively parallel sequencing of the polyadenylated transcriptome of C. elegans. Genome Res. 2009;19:657–666. doi: 10.1101/gr.088112.108. [DOI] [PMC free article] [PubMed] [Google Scholar]
- 17.Sammeth M. The Flux Simulator. 2010 http://flux.sammeth.net/simulator.html (1 June 2010, date last accessed) [Google Scholar]
- 18.Giardine B, Riemer C, Hardison RC, Burhans R, Elnitski L, Shah P, Zhang Y, Blankenberg D, Albert I, Taylor J, et al. Galaxy: a platform for interactive large-scale genome analysis. Genome Res. 2005;15:1451–1455. doi: 10.1101/gr.4086505. [DOI] [PMC free article] [PubMed] [Google Scholar]
- 19.Blankenberg D, Von Kuster G, Coraor N, Ananda G, Lazarus R, Mangan M, Nekrutenko A, Taylor J. Galaxy: a web-based genome analysis tool for experimentalists. Curr. Protoc. Mol. Biol. 2010;10:1–21. doi: 10.1002/0471142727.mb1910s89. Chapter 19:Unit 19.10.1–21. [DOI] [PMC free article] [PubMed] [Google Scholar]
- 20.Schweikert G, Behr J, Zien A, Zeller G, Ong CS, Sonnenburg S, Rätsch G. mGene.web: a web service for accurate computational gene finding. Nucleic Acids Res. 2009;37(Suppl. 2):W312–W316. doi: 10.1093/nar/gkp479. [DOI] [PMC free article] [PubMed] [Google Scholar]
- 21.Li H, Handsaker B, Wysoker A, Fennell T, Ruan J, Homer N, Marth G, Abecasis G, Durbin R. 1000 Genome Project Data Processing Sub group. The sequence Alignment/Map format and SAMtools. Bioinformatics. 2009;25:2078–2079. doi: 10.1093/bioinformatics/btp352. [DOI] [PMC free article] [PubMed] [Google Scholar]
- 22.Andersen ED, Jensen B, Jensen J, Sandvik R, Worsoe U. Technical Report TR-2009-3. MOSEK ApS; 2009. Mosek version 6. [Google Scholar]