Abstract
It is shown that Methyl Red can be used as an indicator dye that changes color in E. coli culture as a result of time- and cell density-dependent bleaching by azoreductase produced by the bacteria. For cell cultures that are being used to express a recombinant protein this phenomenon can be exploited to provide a simple visual cue that cell cultures have reached an appropriate growth phase for addition of an agent to induce protein expression, such as isopropylthiogalactoside.
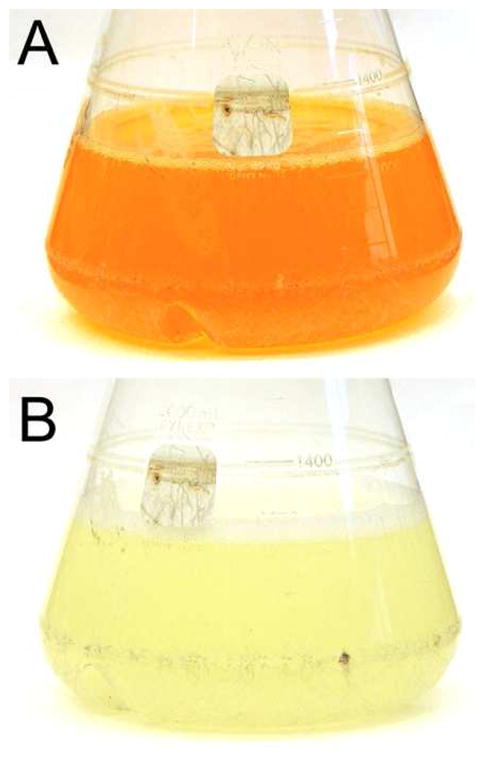
Since the advent of the modern era of preparative molecular biology in the 1980s cultures of E. coli have been widely used to overexpress recombinant proteins. The most commonly used methods involve the growth of liquid cultures to mid-logarithmic phase followed by addition of a gene transcription-inducing agent, typically IPTG. The most commonly used method for determining when mid-log phase has been reached is to monitor light scattering of cultures by determining the apparent absorption of light at 600 nm. This can be a time-consuming and odious task, requiring repeated measurements for each culture flask until an appropriate OD600 is reached (usually when OD600 is between 0.5 and 1.0). To see if a visual colorimetric method could be devised to determine when mid-log phase is reached, E. coli cultures were grown of in the presence of a variety of dyes/indicators (Table S1) at concentrations that confer a visually obvious color to the medium. For these tests we used BL21(DE3) E. coli harboring a pET21b vector encoding the 99 residue C-terminal domain of the amyloid precursor protein (C99(1)). When pH 7.0-buffered M9 cultures were then incubated with rotary shaking at 37°C no change in culture color was observed for most dyes. However, in the case of 100 ml and 1 L cultures grown in the presence of 20 mg/L Methyl Red, it was observed that when the OD600 reached 0.67 ± 0.1 or 0.75 ± 0.1, respectively, the cultures completed a change in color from orange to nearly a pale yellow (Figure 1 and Supporting Figure S1). Similar results were obtained for BL21(DE3) cells harboring an empty pET21b plasmid. Tests of 20 mg/ml Methyl Red in 1 L cultures of a very different strain of E. coli (WH1061) harboring a different recombinant plasmid (pSD0005 encoding diacylglycerol kinase(2)) completed the same orange-to-colorless change at OD600 = 0.87± 0.25, although some calibration of culture conditions was required to assure that the color change occurs when OD600 reaches the 0.5–1.0 range (see Supporting Information). For each strain/vector it is especially to optimize the volume of the starter culture used to inoculate the fresh dye-containing M9 medium.
Figure 1.

1L M9 minimal media BL21(DE3) cell culture expressing C99 in the presence of 20 mg/L Methyl Red. (A) Culture immediately after inoculating with a 25mL overnight LB culture. (B) After growth of the culture at 37°C to OD600 = 0.69.
1 L M9 cultures of BL21(DE3)/C100 and WH1061/DAGK were grown in the presence or absence of Methyl Red and protein expression was IPTG-induced when Methyl Red-containing cultures went colorless or when the OD600 of dye-free cultures reached 0.6–1.0. In either case expression was allowed to proceed for several hours followed by harvesting of the cells and purification of the recombinant proteins according to published methods(1;3). For both C99 and DAGK it was found that the expression levels were comparable to expression levels in cells grown and induced using identical methods but without Methyl Red.
Direct measurement of the kinetics of cell culture growth for BL21(DE3)/C99 grown in the presence and absence of Methyl Red revealed that cells grow a little slower and to a lower final density when cultured in the presence of Methyl Red (Supporting Figure 2), suggesting that the presence of the dye stresses the host cells. This was supported by observation that cells would not grow in the presence of 30 mg/L dye as opposed to the usual 20 mg/L. We also carried out an experiment in which cells were grown in the presence of 10 mg/L Methyl Red, in which case the color change was observed to occur only at much higher OD600—1.6 for WH1061/DAGK. This suggests that the rate of dye bleaching is not directly proportional to E. coli biomass. Rather, it appears that the process responsible for bleaching the dye is induced in response to dye-induced stress and at levels that are proportional to the concentration of the dye.
Additional tests indicated that this method can, following re-optimization of conditions, be applied to M9 media at different pH values (e.g., pH 6.25 and pH 7.7), strain/protein combinations (e.g. RosettaBlue/pAH13 expressing human peripheral myelin protein 22(4)), and culture temperatures (e.g., 20°C). We found that this method can be also be employed using Luria Broth media.
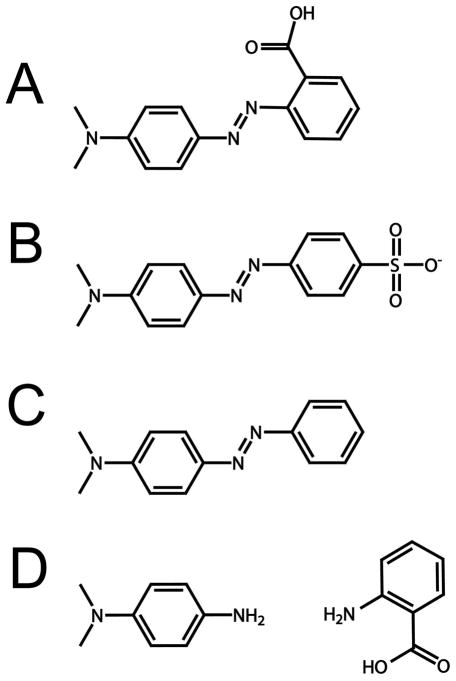
It has previously been shown that Methyl Red can be cleaved and decolorized by a stress-induced azoreductase found in E. coli and other microorganisms(5–7). This flavoenzyme converts Methyl Red into N-N′-dimethyl-p-phenylenediamine (DMPD) and 2-aminobenzoic acid (ABA, see Figure 2). Using thin layer chromatography (TLC) we confirmed that the disappearance of Methyl Red in E. coli cultures was accompanied by the appearance of compounds that exhibit the same Rf on 2-D thin layer chromatography (Figure 3) and the same response to ultraviolet light as ABA and DMPC standards (ABA fluoresces, DMPD initially absorbs but then turns brown). We found that E. coli did not bleach Methyl Orange or Methyl Yellow (Figure 2), at least not at a rate sufficient to generate a color change during the time course of growing a culture to the post-log phase.
Figure 2.
(A) Methyl Red. (B) Methyl Orange (C) Methyl Yellow (D) Left: N,N′-dimethyl-p-phenylenediamine (DMPD) Right: 2-aminobenzoic acid(ABA). DMPD and ABA are products of cleavage of Methyl Red by azoreductase.
Figure 3.

2-Dimensional thin layer chromatography under 302 nm ultraviolet light. Glass-backed silica gel plates were eluted in two directions: first horizontally with ethyl acetate, then vertically with 96% chloroform, 4% methanol. (A) N,N′-dimethyl-p-phenylenediamine (DMPD) standard. Rf,1 = 0.45, Rf,2 = 0.2 (B) 2-aminobenzoic acid (ABA) standard. Rf,1 = 0.68, Rf,2 = 0.12 (C) Chloroform extract of the supernatant from M9 minimal media E. coli culture after color change. Red and yellow arrows indicate locations predicted for spots from DMPD and ABA respectively. The white arrow indicates where Methyl Red would appear on the plate if it were present. A spot corresponding to ABA is evident. However, the DMPD spot is difficult to detect under UV light. Nonetheless, when plates A and C were allowed to sit at room temperature it was seen (not shown) that the DMPD spot of plate A turned brown and that a brown spot also appeared on plate C at the expected location for DMPD (red arrow).
To conclude, it appears that Methyl Red can be used as a colorimetric indicator to provide a visual cue that E. coli cultures harboring a recombinant expression plasmid have reached an optimal phase of growth for induction of protein expression. For each strain and recombinant protein, significant calibration is required to find exact conditions for obtaining useful and reproducible results. Given that re-optimization of the method is required for any new strain, recombinant plasmid/protein, and/or culture conditions we suggest that this approach will be most useful for investigators who are routinely and repetitively expressing the same protein, as is often the case when a protein is being subjected to long term biochemical or structural biological studies, or to biotechnological exploitation.
Supplementary Material
Acknowledgments
We thank Wade van Horn, and Masayoshi Sakakura for technical assistance.
Abbreviations
- ABA
2-aminbenzoic acid
- C99
99-residues C-terminal domain of the human amyloid precursor protein
- DAGK
E. coli diacylglycerol kinase
- DMPD
N-N′-dimethyl-p-phenylenediamine
- TLC
thin layer chromatography
Footnotes
SUPPORTING INFORMATION PARAGRAPH
Full methodological details, Table S1 and Figure S1. This material is available free of charge via the Internet at http://pubs.acs.org.
This work was supported by RO1 GM47485, PO1 GM080513, and RO1 NS058815.
References
- 1.Beel AJ, Sakakura M, Barrett PJ, Sanders CR. Direct binding of cholesterol to the amyloid precursor protein: An important interaction in lipid-Alzheimer’s disease relationships? Biochim Biophys Acta. 2010 doi: 10.1016/j.bbalip.2010.03.008. [DOI] [PMC free article] [PubMed] [Google Scholar]
- 2.Zhou Y, Bowie JU. Building a thermostable membrane protein. J Biol Chem. 2000;275:6975–6979. doi: 10.1074/jbc.275.10.6975. [DOI] [PubMed] [Google Scholar]
- 3.Gorzelle BM, Nagy JK, Oxenoid K, Lonzer WL, Cafiso DS, Sanders CR. Reconstitutive refolding of diacylglycerol kinase, an integral membrane protein. Biochemistry. 1999;38:16373–16382. doi: 10.1021/bi991292n. [DOI] [PubMed] [Google Scholar]
- 4.Mobley CK, Myers JK, Hadziselimovic A, Ellis CD, Sanders CR. Purification and initiation of structural characterization of human peripheral myelin protein 22, an integral membrane protein linked to peripheral neuropathies. Biochemistry. 2007;46:11185–11195. doi: 10.1021/bi700855j. [DOI] [PubMed] [Google Scholar]
- 5.Chung KT, Stevens SE, Jr, Cerniglia CE. The reduction of azo dyes by the intestinal microflora. Crit Rev Microbiol. 1992;18:175–190. doi: 10.3109/10408419209114557. [DOI] [PubMed] [Google Scholar]
- 6.Ito K, Nakanishi M, Lee WC, Zhi Y, Sasaki H, Zenno S, Saigo K, Kitade Y, Tanokura M. Expansion of substrate specificity and catalytic mechanism of azoreductase by X-ray crystallography and site-directed mutagenesis. J Biol Chem. 2008;283:13889–13896. doi: 10.1074/jbc.M710070200. [DOI] [PubMed] [Google Scholar]
- 7.Liu G, Zhou J, Fu QS, Wang J. The Escherichia coli azoreductase AzoR Is involved in resistance to thiol-specific stress caused by electrophilic quinones. J Bacteriol. 2009;191:6394–6400. doi: 10.1128/JB.00552-09. [DOI] [PMC free article] [PubMed] [Google Scholar]
Associated Data
This section collects any data citations, data availability statements, or supplementary materials included in this article.


