Adding quantitative diffusion-weighted imaging to the conventional MR imaging protocol resulted in significant diagnostic improvement.
Abstract
Purpose:
To evaluate the incremental value of diffusion-weighted (DW) imaging and apparent diffusion coefficient (ADC) mapping in relation to conventional breast magnetic resonance (MR) imaging in the characterization of benign versus malignant breast lesions at 3.0 T.
Materials and Methods:
This retrospective HIPAA-compliant study was approved by the institutional review board, with the requirement for informed patient consent waived. Of 550 consecutive patients who underwent bilateral breast MR imaging over a 10-month period, 93 women with 101 lesions met the following study inclusion criteria: They had undergone three-dimensional (3D) high-spatial-resolution T1-weighted contrast material–enhanced MR imaging, dynamic contrast-enhanced MR imaging, and DW imaging examinations at 3.0 T and either had received a pathologic analysis–proven diagnosis (96 lesions) or had lesion stability confirmed at more than 2 years of follow-up (five lesions). DW images were acquired with b values of 0 and 600 sec/mm2. Regions of interest were drawn on ADC maps of breast lesions and normal glandular tissue. Morphologic features (margin, enhancement pattern), dynamic contrast-enhanced MR results (semiquantitative kinetic curve data), absolute ADCs, and glandular tissue–normalized ADCs were included in multivariate models to predict a diagnosis of benign versus malignant lesion.
Results:
Forty-one (44%) of the 93 patients were premenopausal, and 52 (56%) were postmenopausal. Thirty-three (32.7%) of the 101 lesions were benign, and 68 (67.3%) were malignant. Normalized ADCs were significantly different between the benign (mean ADC, 1.1 × 10⁻³ mm2/sec ± 0.4 [standard deviation]) and malignant (mean ADC, 0.55 × 10⁻³ mm2/sec ± 0.16) lesions (P < .001). Adding normalized ADCs to the 3D T1-weighted and dynamic contrast-enhanced MR data improved the diagnostic performance of MR imaging: The area under the receiver operating characteristic curve improved from 0.89 to 0.98, and the false-positive rate decreased from 36% (nine of 25 lesions) to 24% (six of 25 lesions).
Conclusion:
DW imaging with glandular tissue–normalized ADC assessment improves the characterization of breast lesions beyond the characterization achieved with conventional 3D T1-weighted and dynamic contrast-enhanced MR imaging at 3.0 T.
© RSNA, 2010
Introduction
Magnetic resonance (MR) imaging of the breast is known for its inherently high sensitivity but only moderate specificity for the characterization of breast lesions (1–5). Thus, efforts have been directed toward developing new pulse sequences and evaluation methods that improve lesion characterization. Dynamic contrast material–enhanced MR imaging (2,3,5–11) is an example of these technologies: The wash-in and washout rates of gadolinium-based contrast agents have shown potential for use in characterizing focal lesions as benign or malignant.
Use of diffusion-weighted (DW) imaging is another approach that may improve MR imaging lesion characterization. DW imaging has the potential to yield physiologic information about the functional environment and movement of water in normal versus abnormal tissue. DW imaging is sensitive to changes in the microdiffusion of water in the intracellular and extracellular spaces (12). Differences in the apparent diffusion coefficients (ADCs) of benign and malignant breast lesions have been reported (13–18). The ADCs of malignant breast lesions are usually lower than those of benign lesions, indicating restricted water diffusion and increased cellularity. The ADCs of benign lesions are higher, reflecting normal cellularity and no restriction of water movement. To date, the results of DW imaging and ADC mapping in breast MR imaging performed with 1.5-T MR units have been reported (15–18). MR imaging at 3.0 T may yield improved signal-to-noise ratios for both conventional and DW breast MR imaging examinations. The aim of this study was to evaluate the incremental value of DW imaging and ADC mapping of breast tissue in relation to conventional breast MR imaging in the characterization of benign versus malignant breast lesions at 3.0 T.
Materials and Methods
Patients
This Health Insurance Portability and Accountability Act–compliant study was approved by our institutional review board (Johns Hopkins University School of Medicine), which waived the requirement for informed patient consent. Five hundred fifty consecutive patients presented to the Johns Hopkins Outpatient Center for clinically indicated bilateral breast MR imaging between February and November 2008. Retrospective review of their MR imaging studies was performed. The MR imaging studies of 93 women with 101 breast lesions met the following criteria for inclusion in this study: (a) MR imaging was performed by using a 3.0-T magnet, (b) both dynamic contrast-enhanced MR imaging (hereafter, dynamic imaging) and DW MR imaging sequences were performed, and (c) either the diagnosis was proved at pathologic analysis (96 lesions), or lesion stability was confirmed at more than 2 years of follow-up (five lesions). Of the 550 patients, 280 were excluded for not having a suspicious abnormality on dynamic images, 152 were excluded for having lesions without a sufficient follow-up period, 10 were excluded because they were imaged at 1.5 T rather than 3.0 T, and 15 were excluded for failed fat suppression on DW images.
MR Image Acquisition
In all patients, imaging was performed with a 3.0-T clinical MR imaging system (3T Achieva; Philips Medical Systems, Best, The Netherlands) by using a bilateral, dedicated four-channel phased-array breast coil (InVivo, Orlando, Fla) with the patient in the prone position. DW MR images were acquired in the sagittal or axial planes before the gadolinium-based contrast material injection by using an echo-planar imaging sequence, parallel imaging with sensitivity encoding (acceleration factor of two), fat suppression (in a spectral selective attenuated inversion-recovery sequence), volume shimming, b values of 0 and 600 sec/mm2, 9548/64 (repetition time msec/echo time msec), a 90° flip angle, a 1040.8 Hz/pixel bandwidth, 3-mm section thickness, a 35 × 35-cm (axial images) or 24 × 24-cm (sagittal images) field of view, and a 280 × 277 (axial images) or 192 × 192 (sagittal images) matrix.
We used a hybrid protocol in which high-temporal-resolution and high-spatial-resolution T1-weighted gradient-echo imaging examinations were combined before and after contrast material injection. The high-spatial-resolution images were obtained with fat suppression by using the spectral selective attenuated inversion-recovery sequence and the following parameters: 7.08/3.56, 10° flip angle, 2.5-mm section thickness, 35 × 35-cm field of view, 512 × 512 matrix, and acquisition time of 2 minutes 30 seconds. Dynamic images were then obtained by using no fat suppression, a temporal resolution of 15 seconds per acquisition, and the following parameters: 3.8/1.7, 10° flip angle, 5-mm section thickness, 35 × 35-cm field of view, and 256 × 254 matrix. Gadobenate dimeglumine (MultiHance; Bracco Imaging, Milan, Italy) was intravenously administered at a rate of 2 mL/sec and at a dose of 0.1 mmol per kilogram of body weight by using a power injector (Spectris Solaris MR Injection System; Medrad, Warrendale, Pa). Dynamic MR images were acquired seven times (1-minute 45-second total duration) after an initial 10-second delay from the start of the contrast material injection. These sequences were used to define the wash-in tissue characteristics. Then, high-spatial-resolution T1-weighted images were obtained (as specified above) in a single sequence for more than 2 minutes 30 seconds. To characterize the washout curve, an additional dynamic MR imaging series involving seven additional acquisitions was then performed for more than 1 minute 45 seconds. Subtraction MR images were obtained for high-spatial-resolution and dynamic MR imaging.
MR Imaging Data Analysis
High-spatial-resolution MR imaging analysis.—A single blinded reader (R.H.E.K.) with 3 years experience in breast MR imaging identified the focal masses or suspicious areas of enhancement in sequential fashion and classified them as masses or non-masslike enhancement. Morphologic assessment was performed by using Breast Imaging Reporting and Data System lexicon (19). The margin (smooth, lobulated, irregular, or spiculated) and enhancement pattern (homogeneous, heterogeneous, or rim) of the mass lesions were recorded. For non-masslike enhancement, the distribution (diffuse, regional, ductal, or segmental) and enhancement pattern (homogeneous, heterogeneous, stippled, reticular, or clumped) were evaluated.
Dynamic MR imaging analysis.—With use of computer-aided diagnosis software (iCAD, Nashua, NH), time–signal intensity plots of the dynamic images were generated as the percentage enhancement (y-axis) versus time (x-axis) of a region of interest (ROI) placed in the detected lesion. Percentage enhancement was calculated by using the formula (SIpost − SIpre/SIpre) × 100, where SIpre is the signal intensity on the nonenhanced image and SIpost is the signal intensity on the contrast-enhanced image.
For dynamic MR imaging, the peak percentage enhancement within the first 2 minutes and the kinetic curve type on washout images were assessed (8). Kinetic curve type assessment was performed by using a semiquantitative method that we validated in a different patient data set in a prior study (20): The kinetic curve type is judged to indicate persistent enhancement (type I), plateau (type II), or washout (type III) by using 5% as the cutoff value. A signal intensity change of greater than 5% was considered to indicate persistent enhancement; a change of between −5% and 5%, to indicate a plateau; and a change of less than −5%, to indicate washout.
DW MR imaging analysis.—For quantitative analysis of the data acquired from DW imaging, ADC maps were constructed by using software provided by the MR imaging system manufacturer (Phillips Medical Systems) and the following equation:
where bi is the diffusion gradient value and b = γ2G2δ2 · (Δ − δ/3)—with γ being the gyromagnetic ratio; G, the gradient strength; δ, the diffusion gradient duration; and Δ, the time between diffusion gradient pulses—S0 is the first acquired image (with b = 0), and Si is the ith image.
Suspicious breast lesions were initially identified on the contrast-enhanced high-spatial-resolution images, as described. The same reader then drew multiple ROIs (mean area, 4.3 cm2 ± 4.8; range, 0.5–15 cm2) on the corresponding lesion on the ADC map by using a three-dimensional (3D) workstation (Ultravisual; Emageon, Birmingham, Ala). The same process was repeated for the normal glandular tissue in the same breast (mean ROI area, 4.3 cm2 ± 4.8; range, 0.5–15 cm2). In normal glandular tissue, ROIs were carefully chosen such that they were as far as possible from the lesion in the same breast (at least 2 cm from the index lesion). In two cases, no appreciable normal-appearing glandular tissue in the same breast was identified, so glandular tissue in the opposite breast was evaluated. In both the lesion and the glandular tissue, the mean areas for the multiple ROIs were recorded. For each lesion, the mean absolute ADC for the lesion (ADCl) and the glandular tissue (ADCg) was calculated. The normalized ADC (ADCn) was then calculated as follows: ADCn = ADCl/ADCg.
Statistical Analyses
Logistic regression modeling was used to identify associations between the independent parameters (absolute ADC, normalized ADC) and the final diagnosis (benign versus malignant lesion) for focal breast lesions. Receiver operating characteristic (ROC) curve analysis was performed to assess the diagnostic performance of the absolute ADCs and the glandular tissue–normalized ADCs in the characterization of benign versus malignant lesions. Different ADC cutoff values used to classify lesions as benign or malignant were tested to maximize the area under the ROC curve (AUC). To examine the interaction between menstrual cycle and ADC, we assigned the patients to one of two groups: patients imaged on days 8–21 of the menstrual cycle and patients imaged on days 1–7 and on days 22–30. (Weekly categorization was not possible owing to the very small subgroups that resulted.) The nonpaired t test was used to identify significant differences in ADC between these two groups.
Regression trees were constructed to determine the combination of parameters at 3D high-spatial-resolution MR imaging and dynamic MR imaging that best predicted the diagnosis. These trees were used to guide the model selection in multivariate logistic regression analysis. Model 1 involved “conventional” MR imaging (high-spatial-resolution and dynamic imaging). In model 2, either the absolute ADC or the glandular tissue–normalized ADC was added to the conventional MR imaging data. Deviance between the models was used to determine whether use of the absolute ADC or use of the normalized ADC resulted in better performance of the regression model in the prediction of benign versus malignant diagnosis.
A matched-sample table (21) was constructed to compare the diagnostic predictions derived by using the two fitted logistic regression models (conventional MR imaging protocol with and without ADC analysis added). t Testing was used to compare mean values, and χ2 testing was used to compare percentage values. Finally, ROC curves were evaluated to compare the conventional MR imaging protocol with the conventional MR imaging plus added ADC analysis protocol. P < .05 was considered to indicate statistical significance. All analyses were performed by using STATA, version 9.0, statistical software (Stata, College Station, Tex) and S-PLUS8.0 for Windows (Microsoft, Redmond, Wash).
Results
Clinical Demographics
Ninety-three women with 101 lesions met our inclusion criteria (Table 1). The mean age of these patients was 52 years ± 11(standard deviation) (age range, 24–80 years). Sixty-eight (67.3%) of the 101 lesions were malignant: 23 infiltrating ductal carcinomas, 26 mixed ductal carcinomas in situ and infiltrating ductal carcinomas, nine pure ductal carcinomas in situ, six infiltrating lobular carcinomas, one sarcomatoid cancer, one colloid cancer, and two adenocarcinomas. Thirty-three (32.7%) lesions were benign: nine fibroadenomas, three intraductal papillomas, four fibrocystic changes, four sclerosing adenoses, two atypical ductal hyperplasia lesions, and 11 areas of benign breast tissue. Forty-one (44%) of the 93 patients were premenopausal, and 52 (56%) were postmenopausal.
Table 1.
Characteristics of Patients and Breast Masses
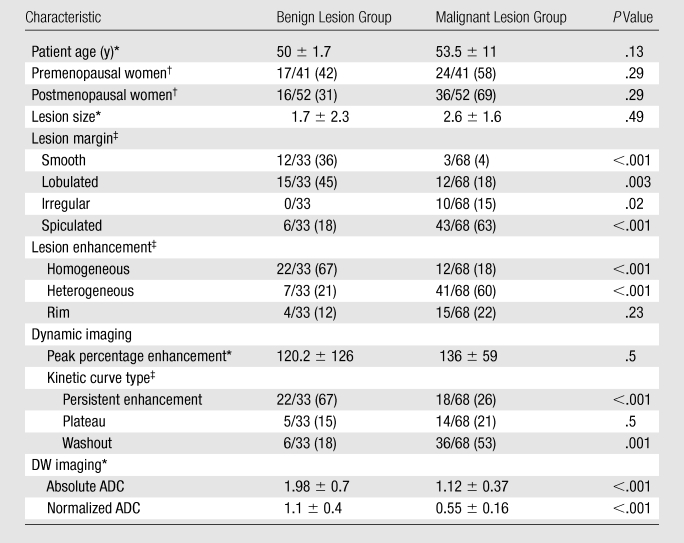
Mean values ± standard deviations. P values were calculated by using t test.
Data are numbers of patients (n = 93), with percentages in parentheses. P values were calculated by using χ2 test.
Data are numbers of lesions (n = 101), with percentages in parentheses. P values were calculated by using χ2 test.
Conventional MR Imaging Parameters
Enhancement patterns, lesion margins, and kinetic curves were significantly different between the benign and malignant lesions (Table 2). The parameters pattern of enhancement and time of peak enhancement yielded the highest odds ratios (4.9 and 4.6, respectively), while lesion margin resulted in the highest AUC (0.83), with enhancement pattern (0.75) and kinetic curve type (0.70) following. The best performing conventional MR imaging diagnostic model included lesion margin, enhancement pattern, peak percentage enhancement, and kinetic curve type (Table 3).
Table 2.
Univariate Logistic Regression Analysis of MR Features in Relation to Diagnosis

OR = odds ratio. Numbers in parentheses are 95% confidence intervals.
Table 3.
Multivariate Logistic Regression Analysis of MR Features in Relation to Diagnosis
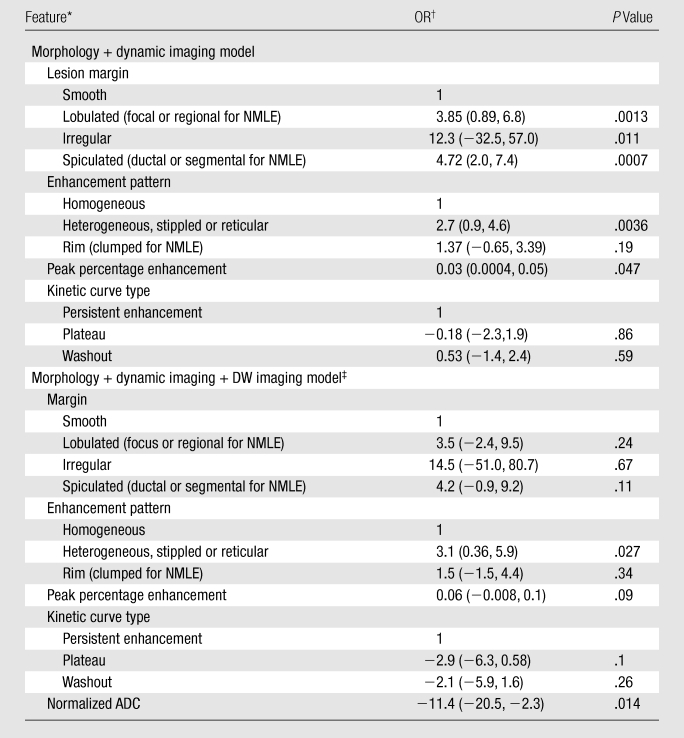
Note.—AUCs were 0.89 for morphology plus dynamic imaging model and 0.985 for morphology plus dynamic imaging plus DW imaging model.
NMLE = non-masslike enhancement.
OR = odds ratio. Numbers in parentheses are 95% confidence intervals.
DW imaging with use of normalized ADC.
Absolute versus Normalized ADC in Relation to Lesion Diagnosis
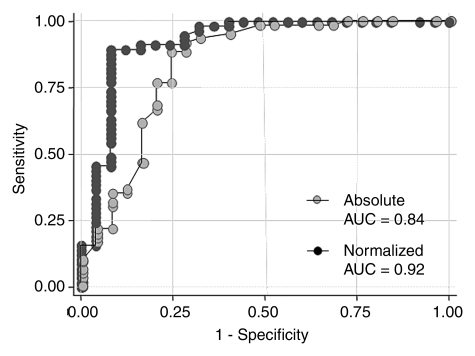
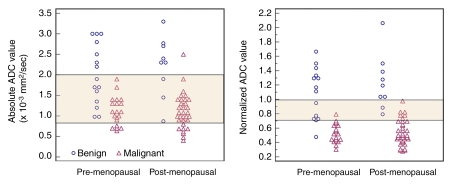
There was a significant association between absolute and normalized ADCs and the final diagnosis of benign or malignant lesion (P < .001). The AUC for the normalized ADC (0.92) was significantly higher than the AUC for the absolute ADC (0.84) (Table 2, Fig 1). Evaluation of the distribution of ADCs revealed that there was less overlap between the benign and malignant breast lesions when normalized ADCs were used (Fig 2). The optimal absolute ADC cutoff value was 1.6 × 10⁻³ mm2/sec, with 91.7% sensitivity, 72% specificity, and an AUC of 0.82. The optimal normalized ADC cutoff was 0.7 × 10⁻³ mm2/sec, with 83.3% sensitivity, 92% specificity, and an AUC of 0.87 (Table 4).
Figure 1:
Graph shows comparison of ROC curves for absolute versus normalized ADC. AUC for normalized ADC was significantly higher than that for absolute ADC (P < .01), indicating significant improvement in diagnostic performance after normalization to glandular tissue.
Figure 2:
Scatterplots of absolute and normalized ADCs of benign and malignant lesions in pre- and postmenopausal women. There was no significant difference in ADCs of benign and malignant lesions between pre- and postmenopausal women. There was wide overlap in absolute ADCs between benign and malignant lesions: Overlapping region included 71% (60 of 85) of lesions. Normalizing ADC to glandular tissue reduced overlap between benign and malignant lesions: Overlapping region included 16% (14 of 85) of lesions. Overlapping area (normalized ADCs, >0.7 and <1.0 × 10⁻³ mm2/sec) indicated indeterminate diagnosis: Values lower than 0.7 × 10⁻³ mm2/sec indicated probably malignant diagnosis, and values greater than 1.0 × 10⁻³ mm2/sec indicated probably benign diagnosis.
Table 4.
Diagnostic Performance of Absolute versus Normalized ADCs

Data are percentages.
Use of the normalized ADCs led to significantly reduced benign lesion–malignant lesion overlap, from 60 (71%) of 85 overlapping lesions with use of the absolute ADCs to only 14 (16%) of 85 overlapping lesions (Fig 2). This enabled the classification of normalized ADCs into three tissue categories: probably benign (ratio ≥ 1.0), intermediate probability (ratio, >0.7 to <1.0), and probably malignant (ratio ≤ 0.7). Use of these three tissue categories resulted in significantly higher diagnostic performance (AUC, 0.94) compared with that achieved by using the single cutoff point method for both absolute and normalized ADCs (P < .05) (Table 4).
There were no significant differences in the absolute or normalized ADCs of benign and malignant lesions between the pre- and postmenopausal women (for absolute ADC: P = .5 for benign lesions, P = .4 for malignant lesions; for normalized ADC: P = .75 for benign lesions, P = .8 for malignant lesions) (Fig 2). There also were no significant differences in the absolute or normalized ADCs of benign and malignant lesions between the patients imaged at weeks 2–3 and those imaged at weeks 1 and 4 of their menstrual cycle (for absolute ADC: P = .29 for benign lesions, P = .4 for malignant lesions; for normalized ADC: P = .8 for benign lesions, P = .9 for malignant lesions).
Addition of ADCs to Conventional Breast MR Imaging Protocol
When conventional MR imaging parameters were used, the best performing multivariate model involving combined dynamic and 3D high-spatial-resolution MR imaging features resulted in an AUC value of 0.89 (Table 3). The model deviance was 11.6 when the absolute ADC was added and 18.8 when the normalized ADC was added.
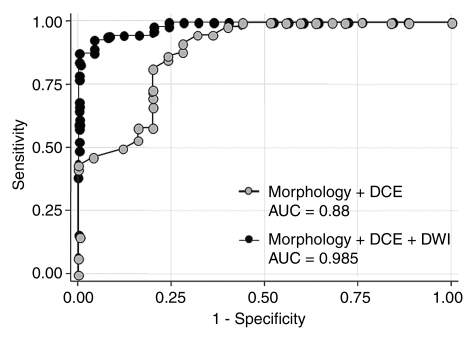
The diagnostic model that included the best performing conventional MR imaging parameters and the normalized ADC performed significantly (P = .014) better than did the conventional model before the normalized ADC was added (Fig 3). The final diagnostic model also yielded a significantly higher AUC value of 0.985 (Table 3).
Figure 3:
Graph shows comparison between ROC curves for conventional MR imaging protocol (morphology plus dynamic contrast-enhanced [DCE] imaging data) and those for conventional MR imaging protocol with quantitative DW imaging (DWI) analysis added (with normalized ADCs). Adding DW imaging to conventional MR imaging protocol resulted in significantly higher AUC, indicating significantly improved diagnostic performance (P < .01).
Data in the matched-sample table (Table 5) indicate that four cases were incorrectly categorized as malignant when the conventional MR imaging protocol (model 1) was used, while they were correctly categorized as benign after the normalized ADC was added. At the same time, one case that was correctly identified as benign with use of the conventional protocol was incorrectly upgraded to a suspicious level with use of the final model (conventional MR imaging plus DW imaging with use of normalized ADCs [model 2]). On the other hand, adding the normalized ADC to the model led to the identification of two malignant lesions that were missed with the conventional protocol but an incorrectly reduced level of suspicion of another three malignant lesions that were correctly identified with the conventional protocol (Table 5). Adding normalized ADCs reduced the false-positive rate from 36% (nine of 25 lesions) to 24% (six of 25 lesions), while it had a minimal negative effect on the false-negative rate—from 5% (three of 60 lesions) to 7% (four of 60 lesions) (Figs 4–6).
Table 5.
Matched-Sample Table Comparing Two Diagnostic Models
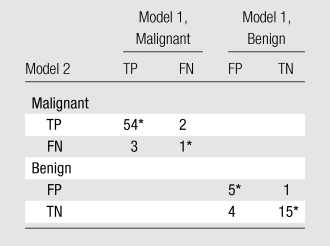
Note.—Data are numbers of lesions. In diagnostic model 1, lesion morphology and dynamic MR imaging data were used to diagnose the breast lesions. In diagnostic model 2, lesion morphology, dynamic MR imaging data, and DW imaging data were used to diagnose the breast lesions. FN = false-negative, FP = false-positive, TN = true-negative, TP = true-positive.
Tied pairs (values on which the two models agree).
Figure 4a:
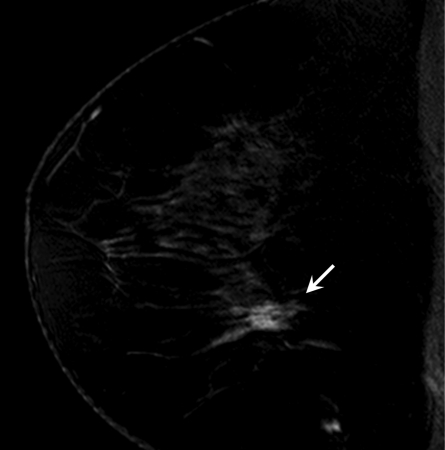
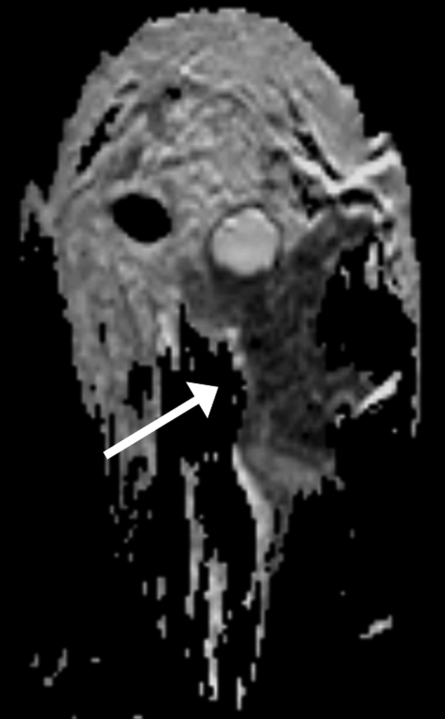
Findings in right breast of 43-year-old woman with recent diagnosis of left-sided breast cancer. (a) Axial contrast-enhanced 3D T1-weighted high-spatial-resolution subtraction MR image (7.08/3.56, 10° flip angle) of right breast shows large (11 × 5 × 5-cm) spiculated enhancing mass lesion (arrow). (b) Kinetic curve for same lesion was categorized as type III (washout). (c) Axial ADC map (b values, 0 and 600 sec/mm2; 9548/64; 90° flip angle) shows same lesion (arrow) with restricted diffusion. Absolute ADC of lesion was 1.3 × 10⁻³ mm2/sec, and glandular tissue–normalized ADC was 0.45 × 10⁻³ mm2/sec. Final histopathologic diagnosis was infiltrating ductal carcinoma with areas of ductal carcinoma in situ.
Figure 6a:
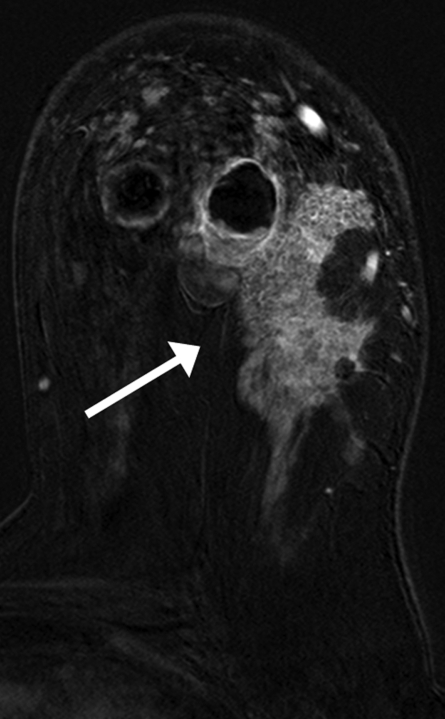
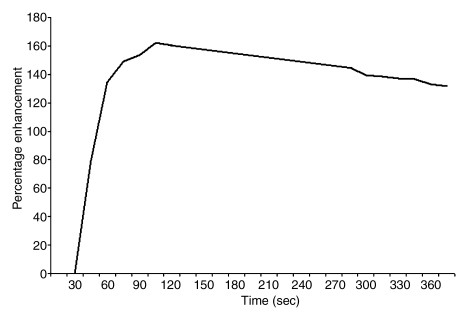
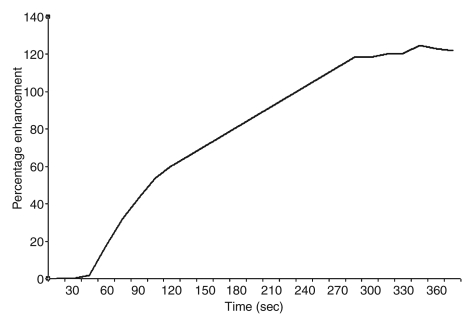
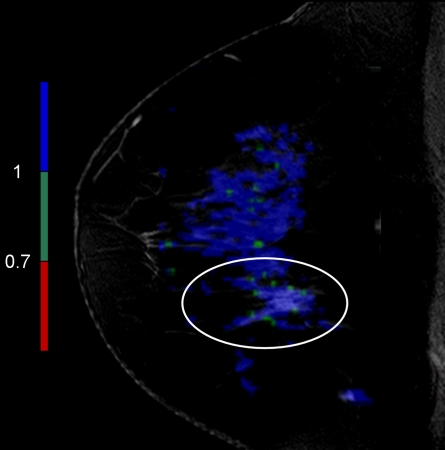
Findings in 42-year-old woman with BRCA1 gene mutation—and thus high risk for breast cancer—and history of ovarian cancer. (a) Sagittal contrast-enhanced 3D T1-weighted high-spatial-resolution MR image (7.08/3.56,10° flip angle) shows spiculated enhancing lesion (arrow, circled region in c) suspicious for malignancy in lower central region of left breast. (b) Kinetic curve for same lesion was categorized as type Ia (persistent enhancement), which suggests benign status. (c) On sagittal color map generated from normalized ADC map (b values, 0 and 600 sec/mm2; 9548/64; 90° flip angle) projected on contrast-enhanced 3D T1-weighted high-spatial-resolution MR image, blue color suggests low suspicion of malignancy; red, high suspicion of malignancy; and green, intermediate probability of malignancy, based on ADC cutoff values of 0.7 and 1.0 × 10⁻³ mm2/sec. Final histopathologic diagnosis of lesion was fibrocystic changes with sclerosing adenosis.
Figure 4b:
Findings in right breast of 43-year-old woman with recent diagnosis of left-sided breast cancer. (a) Axial contrast-enhanced 3D T1-weighted high-spatial-resolution subtraction MR image (7.08/3.56, 10° flip angle) of right breast shows large (11 × 5 × 5-cm) spiculated enhancing mass lesion (arrow). (b) Kinetic curve for same lesion was categorized as type III (washout). (c) Axial ADC map (b values, 0 and 600 sec/mm2; 9548/64; 90° flip angle) shows same lesion (arrow) with restricted diffusion. Absolute ADC of lesion was 1.3 × 10⁻³ mm2/sec, and glandular tissue–normalized ADC was 0.45 × 10⁻³ mm2/sec. Final histopathologic diagnosis was infiltrating ductal carcinoma with areas of ductal carcinoma in situ.
Figure 4c:
Findings in right breast of 43-year-old woman with recent diagnosis of left-sided breast cancer. (a) Axial contrast-enhanced 3D T1-weighted high-spatial-resolution subtraction MR image (7.08/3.56, 10° flip angle) of right breast shows large (11 × 5 × 5-cm) spiculated enhancing mass lesion (arrow). (b) Kinetic curve for same lesion was categorized as type III (washout). (c) Axial ADC map (b values, 0 and 600 sec/mm2; 9548/64; 90° flip angle) shows same lesion (arrow) with restricted diffusion. Absolute ADC of lesion was 1.3 × 10⁻³ mm2/sec, and glandular tissue–normalized ADC was 0.45 × 10⁻³ mm2/sec. Final histopathologic diagnosis was infiltrating ductal carcinoma with areas of ductal carcinoma in situ.
Figure 5a:
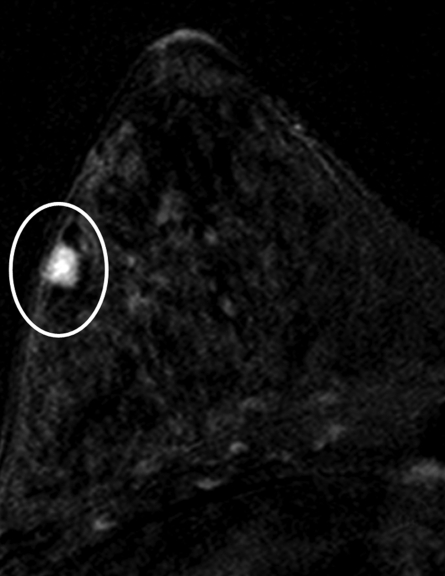
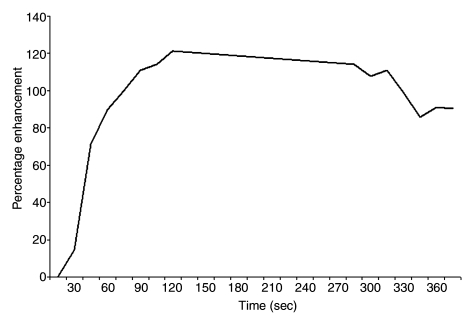
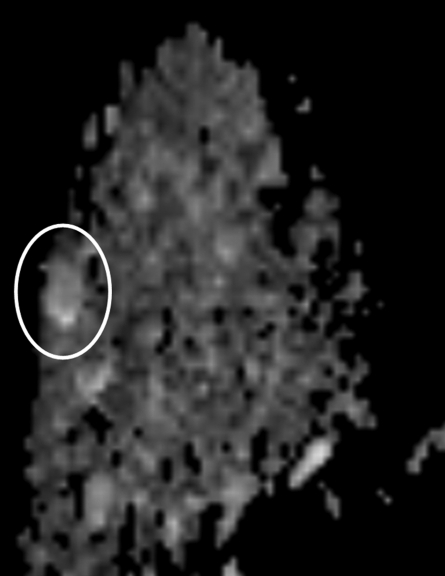
Findings in 49-year-old woman with family history–based high risk of breast cancer. (a) Axial contrast-enhanced 3D T1-weighted high-spatial-resolution subtraction MR image (7.08/3.56, 10° flip angle) of right breast shows lobulated intensely enhancing lesion (circled) 1 cm in diameter at 9 o’clock position. (b) Kinetic curve for same lesion was categorized as type III (washout), which suggests malignancy. (c) Axial ADC map (b values, 0 and 600 sec/mm2; 9548/64; 90° flip angle) shows same lesion (circled) with nonrestricted diffusion. Absolute ADC of lesion was 3 × 10⁻³ mm2/sec, which was considered to indicate benign lesion with 1.3 or 1.6 × 10⁻³ mm2/sec ADC cutoff. Glandular tissue–normalized ADC was 1.5 × 10⁻³ mm2/sec, which was considered to indicate benign lesion with ADC cutoff values determined in current study. Final histopathologic diagnosis of lesion was fibrocystic changes.
Figure 5b:
Findings in 49-year-old woman with family history–based high risk of breast cancer. (a) Axial contrast-enhanced 3D T1-weighted high-spatial-resolution subtraction MR image (7.08/3.56, 10° flip angle) of right breast shows lobulated intensely enhancing lesion (circled) 1 cm in diameter at 9 o’clock position. (b) Kinetic curve for same lesion was categorized as type III (washout), which suggests malignancy. (c) Axial ADC map (b values, 0 and 600 sec/mm2; 9548/64; 90° flip angle) shows same lesion (circled) with nonrestricted diffusion. Absolute ADC of lesion was 3 × 10⁻³ mm2/sec, which was considered to indicate benign lesion with 1.3 or 1.6 × 10⁻³ mm2/sec ADC cutoff. Glandular tissue–normalized ADC was 1.5 × 10⁻³ mm2/sec, which was considered to indicate benign lesion with ADC cutoff values determined in current study. Final histopathologic diagnosis of lesion was fibrocystic changes.
Figure 5c:
Findings in 49-year-old woman with family history–based high risk of breast cancer. (a) Axial contrast-enhanced 3D T1-weighted high-spatial-resolution subtraction MR image (7.08/3.56, 10° flip angle) of right breast shows lobulated intensely enhancing lesion (circled) 1 cm in diameter at 9 o’clock position. (b) Kinetic curve for same lesion was categorized as type III (washout), which suggests malignancy. (c) Axial ADC map (b values, 0 and 600 sec/mm2; 9548/64; 90° flip angle) shows same lesion (circled) with nonrestricted diffusion. Absolute ADC of lesion was 3 × 10⁻³ mm2/sec, which was considered to indicate benign lesion with 1.3 or 1.6 × 10⁻³ mm2/sec ADC cutoff. Glandular tissue–normalized ADC was 1.5 × 10⁻³ mm2/sec, which was considered to indicate benign lesion with ADC cutoff values determined in current study. Final histopathologic diagnosis of lesion was fibrocystic changes.
Figure 6b:
Findings in 42-year-old woman with BRCA1 gene mutation—and thus high risk for breast cancer—and history of ovarian cancer. (a) Sagittal contrast-enhanced 3D T1-weighted high-spatial-resolution MR image (7.08/3.56,10° flip angle) shows spiculated enhancing lesion (arrow, circled region in c) suspicious for malignancy in lower central region of left breast. (b) Kinetic curve for same lesion was categorized as type Ia (persistent enhancement), which suggests benign status. (c) On sagittal color map generated from normalized ADC map (b values, 0 and 600 sec/mm2; 9548/64; 90° flip angle) projected on contrast-enhanced 3D T1-weighted high-spatial-resolution MR image, blue color suggests low suspicion of malignancy; red, high suspicion of malignancy; and green, intermediate probability of malignancy, based on ADC cutoff values of 0.7 and 1.0 × 10⁻³ mm2/sec. Final histopathologic diagnosis of lesion was fibrocystic changes with sclerosing adenosis.
Figure 6c:
Findings in 42-year-old woman with BRCA1 gene mutation—and thus high risk for breast cancer—and history of ovarian cancer. (a) Sagittal contrast-enhanced 3D T1-weighted high-spatial-resolution MR image (7.08/3.56,10° flip angle) shows spiculated enhancing lesion (arrow, circled region in c) suspicious for malignancy in lower central region of left breast. (b) Kinetic curve for same lesion was categorized as type Ia (persistent enhancement), which suggests benign status. (c) On sagittal color map generated from normalized ADC map (b values, 0 and 600 sec/mm2; 9548/64; 90° flip angle) projected on contrast-enhanced 3D T1-weighted high-spatial-resolution MR image, blue color suggests low suspicion of malignancy; red, high suspicion of malignancy; and green, intermediate probability of malignancy, based on ADC cutoff values of 0.7 and 1.0 × 10⁻³ mm2/sec. Final histopathologic diagnosis of lesion was fibrocystic changes with sclerosing adenosis.
Discussion
The findings in this study demonstrate that quantitative analysis of ADCs can be used to distinguish malignant from benign focal breast lesions. Furthermore, ADC normalization performed by using glandular tissue, as compared with using absolute ADCs, significantly improved the diagnostic performance of DW imaging in the characterization of benign versus malignant lesions. Although some overlap in ADC between the benign and malignant lesions remained, the degree of overlap was substantially reduced by normalizing the ADCs to those of remote glandular tissue. We observed improvement in the diagnostic model when normalized ADCs were added to the conventional MR imaging data. These results suggest a potential role of DW imaging in improving the diagnostic performance of breast MR imaging and yielding functional measures of the tumor microenvironment.
Prior study investigators have evaluated the role of DW imaging in breast MR imaging performed with 1.5-T systems and reported that ADCs have the potential to help differentiate benign from malignant lesions (15–18,22,23). Imaging at higher magnetic field strengths has the potential to increase the signal-to-noise ratio and the spatial resolution and shorten the imaging time. However, the nonuniform B0 and B1 magnetic induction fields make 3.0-T breast MR imaging challenging (24–26). We attempted to improve the B1 uniformity by using a spectral selective attenuated inversion-recovery fat suppression sequence, which is less sensitive to B1 field nonuniformity. The better B1 field uniformity is due to the use of adiabatic radiofrequency pulses for spectral saturation, which ensure high uniformity. To reduce the B0 nonuniformity, we used volume shimming (to create more symmetric shimming in the selected volume).
Investigators in a prior study (27) compared the visibility of MR imaging–detected breast lesions and the ADCs at 1.5-T imaging with those at 3.0-T imaging in the same patients (16 lesions in 13 patients) and concluded that there were no significant differences in the ADCs of small (≤10 mm) and large (>10 mm) benign and malignant lesions between 1.5-T and 3.0-T MR imaging. In terms of lesion visibility, they concluded that small lesions were more clearly visible at 3.0 T than at 1.5 T, presumably because of increased spatial resolution.
Many factors can affect ADCs, including factors related to imaging parameters (magnetic susceptibility, spatial resolution, signal-to-noise ratio) and those related to the pathophysiologic features (cellular density, tissue component) of the lesions (16). In the female body, the hormonal status affects the water content and reportedly results in a 5.5% variation in breast ADC throughout the menstrual cycle (28). In this study, we did not detect a significant difference in ADCs between the patients imaged during different portions of the menstrual cycle. This could be owing to the relatively small sample sizes of these two groups. To overcome this variability, we used remote glandular tissue to normalize ADCs for the focal breast lesions. Previous study investigators have proposed the use of two ADC cutoff values to define malignant versus benign breast lesions: 1.3 × 10⁻³ cm2/sec (86% sensitivity, 86% specificity) (22) and 1.6 × 10⁻³ cm2/sec (95% sensitivity, 46% specificity) (16,17). In our study, the optimal absolute ADC cutoff value was 1.6 × 10⁻³ cm2/sec, which had minimally lower sensitivity but markedly higher specificity. With use of normalized ADCs, a cutoff value of 0.7 × 10⁻³ cm2/sec yielded further improvements in specificity—from 72% to 92%.
DW MR imaging is not likely to be used without concurrent interpretation of high-spatial-resolution breast MR image data. In a 2006 multicenter study, Schnall et al (10) reported that the best predictive parameters for malignancy were lesion margin (AUC, 0.76), signal intensity (AUC, 0.70), enhancement pattern (AUC, 0.62), and kinetic curve type (AUC, 0.66). Our results indicate that the same conventional breast MR imaging parameters are the most predictive of malignancy. An important finding was that adding quantitative DW imaging to the conventional MR imaging protocol resulted in significant diagnostic improvement. It also resulted in a reduced false-positive rate, from 36% to 24%. Larger sample sizes will be needed to reproduce these results in a more generalized patient population.
There were several limitations in this study. ROI selection and ADC determination were performed manually by a single blinded reader. With the described technique, however, these processes potentially could be automated for evaluation of the entire breast rather than a focal lesion. Because DW images and ADC maps are inherently noisy, extensive familiarity with DW imaging and ADC mapping is needed to interpret the data. The pathophysiologic features of different breast lesions, similar to the variations previously demonstrated with dynamic MR imaging, are likely to influence the value of DW imaging. Finally, because all of the MR examinations were conducted by using a single MR imaging platform, the results may be specific to certain pulse sequences. However, ADC normalization enables one to perform independent measurements of the status of lesions across institutions. Combining ADCs with other quantitative radiologic parameters improves the tissue characterization of breast lesions. Another study limitation was that the reported ADC cutoff values were derived from this study population; however, they need to be validated in a larger group of patients.
In conclusion, DW imaging with glandular tissue–normalized ADC mapping significantly improves the characterization of breast lesions beyond that achieved with conventional 3D T1-weighted and dynamic MR imaging at 3.0 T. Further study in a larger, more general patient population seems warranted.
Advance in Knowledge.
Diffusion-weighted (DW) imaging with normalization of apparent diffusion coefficients (ADCs) significantly improves the diagnostic performance of conventional breast MR imaging involving the acquisition of morphologic and kinetic curve data, with the area under the receiver operating characteristic curve improving from 0.89 to 0.98 and the false-positive rate decreasing from 36% (nine of 25 lesions) to 24% (six of 25 lesions).
Implications for Patient Care.
Performing DW imaging with quantification of glandular tissue–normalized ADCs reduces the overlap between benign lesion and malignant lesion ADCs.
Adding DW imaging analysis to a conventional breast MR imaging protocol significantly improves the diagnostic performance of 3.0-T breast MR imaging for lesion characterization.
Received July 27, 2009; revision requested September 4; revision received October 15; accepted October 27; final version accepted January 28, 2010.
Funding: This research was supported by the National Institutes of Health (grants R01-100184, P50CA103175) and the intramural research program of the National Institutes of Health/Clinical Center.
Authors stated no financial relationship to disclose.
Abbreviations:
- ADC
- apparent diffusion coefficient
- AUC
- area under ROC curve
- DW
- diffusion weighted
- ROC
- receiver operating characteristic
- ROI
- region of interest
- 3D
- three-dimensional
References
- 1.Flickinger FW, Allison JD, Sherry RM, Wright JC. Differentiation of benign from malignant breast masses by time-intensity evaluation of contrast enhanced MRI. Magn Reson Imaging 1993;11(5):617–620 [DOI] [PubMed] [Google Scholar]
- 2.Huang W, Fisher PR, Dulaimy K, Tudorica LA, O’Hea B, Button TM. Detection of breast malignancy: diagnostic MR protocol for improved specificity. Radiology 2004;232(2):585–591 [DOI] [PubMed] [Google Scholar]
- 3.Kneeshaw PJ, Lowry M, Manton D, Hubbard A, Drew PJ, Turnbull LW. Differentiation of benign from malignant breast disease associated with screening detected microcalcifications using dynamic contrast enhanced magnetic resonance imaging. Breast 2006;15(1):29–38 [DOI] [PubMed] [Google Scholar]
- 4.Macura KJ, Ouwerkerk R, Jacobs MA, Bluemke DA. Patterns of enhancement on breast MR images: interpretation and imaging pitfalls. RadioGraphics 2006;26(6):1719–1734 [DOI] [PMC free article] [PubMed] [Google Scholar]
- 5.Bluemke DA, Gatsonis CA, Chen MH, et al. Magnetic resonance imaging of the breast prior to biopsy. JAMA 2004;292(22):2735–2742 [DOI] [PubMed] [Google Scholar]
- 6.El Khouli RH, Jacobs MA, Bluemke DA. Magnetic resonance imaging of the breast. Semin Roentgenol 2008;43(4):265–281 [DOI] [PubMed] [Google Scholar]
- 7.Kinkel K, Helbich TH, Esserman LJ, et al. Dynamic high-spatial-resolution MR imaging of suspicious breast lesions: diagnostic criteria and interobserver variability. AJR Am J Roentgenol 2000;175(1):35–43 [DOI] [PubMed] [Google Scholar]
- 8.Kuhl CK, Mielcareck P, Klaschik S, et al. Dynamic breast MR imaging: are signal intensity time course data useful for differential diagnosis of enhancing lesions? Radiology 1999;211(1):101–110 [DOI] [PubMed] [Google Scholar]
- 9.Kuhl CK, Schild HH, Morakkabati N. Dynamic bilateral contrast-enhanced MR imaging of the breast: trade-off between spatial and temporal resolution. Radiology 2005;236(3):789–800 [DOI] [PubMed] [Google Scholar]
- 10.Schnall MD, Blume J, Bluemke DA, et al. Diagnostic architectural and dynamic features at breast MR imaging: multicenter study. Radiology 2006;238(1):42–53 [DOI] [PubMed] [Google Scholar]
- 11.Schnall MD, Rosten S, Englander S, Orel SG, Nunes LW. A combined architectural and kinetic interpretation model for breast MR images. Acad Radiol 2001;8(7):591–597 [DOI] [PubMed] [Google Scholar]
- 12.Le Bihan D, Breton E, Lallemand D, Grenier P, Cabanis E, Laval-Jeantet M. MR imaging of intravoxel incoherent motions: application to diffusion and perfusion in neurologic disorders. Radiology 1986;161(2):401–407 [DOI] [PubMed] [Google Scholar]
- 13.Englander SA, Uluğ AM, Brem R, Glickson JD, van Zijl PC. Diffusion imaging of human breast. NMR Biomed 1997;10(7):348–352 [DOI] [PubMed] [Google Scholar]
- 14.Guo Y, Cai YQ, Cai ZL, et al. Differentiation of clinically benign and malignant breast lesions using diffusion-weighted imaging. J Magn Reson Imaging 2002;16(2):172–178 [DOI] [PubMed] [Google Scholar]
- 15.Sinha S, Lucas-Quesada FA, Sinha U, DeBruhl N, Bassett LW. In vivo diffusion-weighted MRI of the breast: potential for lesion characterization. J Magn Reson Imaging 2002;15(6):693–704 [DOI] [PubMed] [Google Scholar]
- 16.Woodhams R, Matsunaga K, Iwabuchi K, et al. Diffusion-weighted imaging of malignant breast tumors: the usefulness of apparent diffusion coefficient (ADC) value and ADC map for the detection of malignant breast tumors and evaluation of cancer extension. J Comput Assist Tomogr 2005;29(5):644–649 [DOI] [PubMed] [Google Scholar]
- 17.Woodhams R, Matsunaga K, Kan S, et al. ADC mapping of benign and malignant breast tumors. Magn Reson Med Sci 2005;4(1):35–42 [DOI] [PubMed] [Google Scholar]
- 18.Park MJ, Cha ES, Kang BJ, Ihn YK, Baik JH. The role of diffusion-weighted imaging and the apparent diffusion coefficient (ADC) values for breast tumors. Korean J Radiol 2007;8(5):390–396 [DOI] [PMC free article] [PubMed] [Google Scholar]
- 19.Ikeda DM, Hylton NM, Kinkel K, et al. Development, standardization, and testing of a lexicon for reporting contrast-enhanced breast magnetic resonance imaging studies. J Magn Reson Imaging 2001;13(6):889–895 [DOI] [PubMed] [Google Scholar]
- 20.EI Khouli RH, Macura KJ, Jacobs MA, et al. Dynamic contrast-enhanced MRI of the breast: quantitative method for kinetic curve type assessment. AJR Am J Roentgenol 2009;193(4):W295–W300 [DOI] [PMC free article] [PubMed] [Google Scholar]
- 21.Hawass NE. Comparing the sensitivities and specificities of two diagnostic procedures performed on the same group of patients. Br J Radiol 1997;70(832):360–366 [DOI] [PubMed] [Google Scholar]
- 22.Rubesova E, Grell AS, De Maertelaer V, Metens T, Chao SL, Lemort M. Quantitative diffusion imaging in breast cancer: a clinical prospective study. J Magn Reson Imaging 2006;24(2):319–324 [DOI] [PubMed] [Google Scholar]
- 23.Wenkel E, Geppert C, Schulz-Wendtland R, et al. Diffusion weighted imaging in breast MRI: comparison of two different pulse sequences. Acad Radiol 2007;14(9):1077–1083 [DOI] [PubMed] [Google Scholar]
- 24.Kuhl CK, Schrading S, Bieling HB, et al. MRI for diagnosis of pure ductal carcinoma in situ: a prospective observational study. Lancet 2007;370(9586):485–492 [DOI] [PubMed] [Google Scholar]
- 25.Schabel MC, Morrell GR. Uncertainty in T(1) mapping using the variable flip angle method with two flip angles. Phys Med Biol 2009;54(1):N1–N8 [DOI] [PubMed] [Google Scholar]
- 26.Kuhl CK, Jost P, Morakkabati N, Zivanovic O, Schild HH, Gieseke J. Contrast-enhanced MR imaging of the breast at 3.0 and 1.5 T in the same patients: initial experience. Radiology 2006;239(3):666–676 [DOI] [PubMed] [Google Scholar]
- 27.Matsuoka A, Minato M, Harada M, et al. Comparison of 3.0- and 1.5-tesla diffusion-weighted imaging in the visibility of breast cancer. Radiat Med 2008;26(1):15–20 [DOI] [PubMed] [Google Scholar]
- 28.Partridge SC, McKinnon GC, Henry RG, Hylton NM. Menstrual cycle variation of apparent diffusion coefficients measured in the normal breast using MRI. J Magn Reson Imaging 2001;14(4):433–438 [DOI] [PubMed] [Google Scholar]


