

Abstract
Disregulation of epidermal growth factor receptor (EGFR) signaling directly promotes bypass of proliferation and survival restraints in a high frequency of epithelia-derived cancer. As such, much effort is currently focused on decoding the molecular architecture supporting EGFR activation and function. Here, we have leveraged high throughput reverse phase protein lysate arrays, with a sensitive fluorescent nanocrystal-based phosphoprotein detection assay, together with large scale siRNA-mediated loss of function to execute a quantitative interrogation of all elements of the human kinome supporting EGF-dependent signaling. This screening platform has captured multiple novel contributions of diverse protein kinases to modulation of EGFR signal generation, signal amplitude, and signal duration. As examples, the prometastatic SNF1/AMPK-related kinase hormonally upregulated Neu kinase was found to support EGFR activation in response to ligand binding, whereas the enigmatic kinase MGC16169 selectively supports coupling of active EGFR to ERK1/2 regulation. Of note, the receptor tyrosine kinase MERTK and the pyrimidine kinase UCK1 were both found to be required for surface accumulation of EGFR and subsequent pathway activation in multiple cancer cell backgrounds and may represent new targets for therapeutic intervention.
Keywords: Breast Cancer, Proteomics, Receptor Tyrosine Kinase, RNA Interference (RNAi), Signal Transduction
Introduction
The capacity of cells to mount discrete responses to complex environmental cues is, at least in part, the consequence of highly integrated networks of signal transduction cascades. Much is understood about the organization of regulatory molecules into signaling pathways, but much remains to be learned about pathway modulators, connectivity among pathways, and the contribution of this connectivity to distinct cellular responses (1–3). Knowledge of how cell regulatory systems are organized to allow the coupling of stimulus to response with appropriate fidelity is central to predicting drug action, understanding pathological regulatory conditions, and identifying effective molecular targets for drug discovery. The recent development of robust technologies for high throughput quantitative measurements of protein concentrations and post-translational modifications (4), together with the advent of effective RNA interference-based human somatic cell genetics (5), affords the exceptional opportunity for the comprehensive unbiased analyses of molecular frameworks supporting cell regulatory systems. Here, we have combined quantitative high density protein lysate microarrays with a large scale synthetic siRNA collection for a systematic interrogation of the epidermal growth factor receptor (EGFR)3 tyrosine kinase-induced mitogenic signaling network. We used direct measurements of the activation states of STAT3 and the ERK1/2 protein kinase cascades, acutely engaged upon EGFR stimulation, to evaluate the consequences of individual gene knockdowns on EGFR network assembly and function. This analysis has revealed 1) novel obligate components of EGFR signaling cascades; 2) pathway-specific signal modulators; and 3) new molecular couplers that specify the dynamics of the EGF signaling infrastructure.
EXPERIMENTAL PROCEDURES
siRNA Delivery
The primary screen was performed with the human kinome siRNA library (Dharmacon and ThermoFisher) in a 96-well microtiterplate format. Each well in this library contains a pool of four synthetic siRNA oligonucleotides targeting one of 672 distinct genes. For high throughput transfection, 5 μl of 2 micromolar siRNA (10 pmol) was transferred from the stock plates using a Biomek FX robotic liquid handler (Beckman Coulter) and mixed with 30 μl of Dharmacon cell culture reagent for each of three assay plates per library stock plate. Following a 5-min incubation at room temperature, 10 μl of DharmaFECT 3 (Dharmacon, ThermoFisher) diluted 1:10 in Dharmacon cell culture reagent was delivered to each well with a TiterTek Multidrop. Following an additional 30-min incubation, all wells were seeded with 8,000 cells/well in a volume of 160 μl from a single-cell suspension of A431 cells in Dulbecco's modified Eagle's medium and 10% fetal bovine serum (no antibiotics).
Plate Processing
We found that EGF responsiveness in A431 cells is equivalent under serum-starved (overnight incubation in serum-free Dulbecco's modified Eagle's medium) or serum-adapted conditions (no media change over the course of 72 h) (see supplemental Fig. 1 and data not shown). Therefore, to minimize artifacts induced by the plate manipulations required for a serum-starvation step, we elected to employ serum-adapted conditions as the no EGF baseline. 72 h post-transfection, 50 μl of a 250 ng/ml EGF (Sigma) stock solution in Dulbecco's modified Eagle's medium was added to each well, with the exception of wells in column 1, for a final concentration of 50 ng/ml and incubated for 5 min at 37 °C. The culture media was then dumped and replaced with 100 μl of 2% SDS lysis buffer (2% SDS, 5% glycerol, 1% β-mercaptoethanol, 68 mm Tris, pH 6.8). To facilitate lysis and eliminate viscosity, plates were then incubated at 80 °C for 45 min and filtered using 96-well 0.7 micron filter plates.
Slide Printing and Hybridization
Lysate printing was performed with a four-pin SpotArray 24 (PerkinElmer) using nitrocellulose-coated FAST slides (Whattman). Slides were printed with ∼1.5 nl of lysate per spot for a fractional cell equivalent of ∼3.5 cells/spot. 9 plates were arrayed per slide, with each plate in a single column and with each well in triplicate for a total of 2592 spots/slide. Slides were dried for 2 h at room temperature or at 4° C overnight prior to incubation in 1× Re-blot Plus Mild (Chemicon) for 7 min, followed by three washes in 1× Tris Buffered Saline Tween-20 (Dako Cytomation). Then, slides were blocked in SEA BLOCK (Pierce) for 2 h at room temperature or at 4° C overnight. The next incubation steps were performed in the following order: 5 min in 0.03% hydrogen peroxide (Dako Cytomation), 10 min in avidin block (Dako Cytomation), 10 min in biotin block (Dako Cytomation), 15 min in protein block (Dako Cytomation), 45 min in primary antibody (p-ERK, Cell Signaling), p-Y705-STAT3 (Cell Signaling), actin (Sigma)) diluted 1:1000 in antibody diluent (Dako Cytomation), 20 min in respective secondary antibody at 1:5000 in antibody diluent (Dako Cytomation), 15 min streptavidin complex (Dako Cytomation, prepared exactly as described in the kit manual), 15 min amplification reagent (Dako Cytomation), and 15 min streptavidin-conjugated 655 nm Quantum-dots (Invitrogen), after which slides were extensively washed in phosphate-buffered saline. Between each step above, slides were washed three times for 5 min each in Tris Buffered Saline Tween-20. Finally, slides were briefly rinsed in milli-Q water and dried by centrifugation.
Imaging and Data Processing
Slides were scanned with a 480 nm laser using a ProScanArray microarray scanner (PerkinElmer). Spot detection and quantitation was performed using ProScanArray Express software (PerkinElmer). Raw values of technical triplicates were averaged and normalized by the mean of the 9 nearest neighbors within a column. Biological triplicates were then averaged for each gene. Those with discordant values across the three replicates were discarded from further analyses.
Network Analysis
The comprehensive network of human genes was constructed by compiling protein-protein interactions in Human Protein Reference Database (6), Entrez Gene (7), Biomolecular Interaction Database (8), and IntAct (9). Signaling interactions were compiled from Biocarta and Kyoto Encyclopedia of Genes and Genomes (KEGG) (10) as well as through manual curation. Transcription factor target interactions were obtained from ORegAnno (11). Functional interactions between genes were constructed based on the significance of overlap of their gene ontology (12) annotations as well as their common assignment to a KEGG metabolic pathway. Cancer mutation data were obtained from COSMIC (13) and from Refs. 14–18. Scoring of network components (nodes and edges) for their relevance to a given data set is done by a random walk-based scoring strategy (19) by using the data values of nodes as transition probabilities. First, each interaction i-j is assigned a probability value (pij) based on the data values of nodes in the neighborhood:
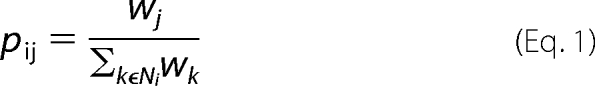 |
where wj is the experimental value for node j, and Ni is the set of immediate downstream neighbors of node i. If there are no downstream nodes of the node i (|Ni| = 0), pij is set to pij = 1/n for all j, where n is the total number of nodes in the network. Also, at each step, we assigned a small probability (q = 0.01) that the random walk would jump to any other node in the network. Final relevance scores of nodes are given by their visitation frequencies by the random walk in the end of infinite iterations (i.e. value at the stationary distribution of the random walk (19)).
RESULTS AND DISCUSSION
We elected to employ the squamous cell carcinoma-derived cell line A431 for large scale functional analysis of gene products supporting acute-phase EGFR signaling. High-abundance EGFR expression in this line affords a large dynamic range for detection of EGF-induced pathway activation, and there has been significant historical investment in the identification of appropriate antibodies for detection of specific antigens within A431 whole-cell lysates spotted on reverse-phase protein lysate arrays (RPPAs) (20, 21). A high throughput compatible siRNA transfection protocol that preserved EGF responsiveness with minimal culture manipulations was derived together with a cell lysate preparation, spotting, and hybridization protocol allowing sensitive and selective quantitative detection of ERK1/2 and STAT3 with active-site phosphorylation specific antibodies and fluorescent quantum dot-coupled secondary antibodies (supplemental Fig. 1). The latter afforded a linear range of detection across two logs of signal intensities with a coefficient of variation between replicate spots of <6% (supplemental Fig. 1).
Cells were transfected in triplicate with 672 synthetic siRNA pools (four independent siRNAs per gene per well) targeting all human protein kinases, small molecule kinases, as well as a number of kinase-related and associated proteins (22, 23) arrayed in 96-well microtiter plates. Each assay plate also contained cytotoxic siRNAs targeting PLK1 to monitor transfection efficiency and negative control siRNAs targeting glyceraldehyde-3-phosphate dehydrogenase (GAPDH), those that do not bind RNA induced silencing complex (RISC) and nontargeting sequences. In addition, column 1 of each assay plate was used to monitor pathway activation in the absence of EGF stimulation (supplemental Fig. 2). 72 h post-transfection, all wells, except for column one, were treated with 50 ng/ml EGF for 5 min. Whole cell lysates were then microspotted in triplicate on nitrocellulose-coated glass slides at a density of ∼2600 spots per array (Fig. 1). Separate arrays were prepared for each of three antibodies detecting p-ERK1/2 (Thr202,Tyr204), p-STAT3 (Tyr705), and actin. Following antibody hybridization and coupling of fluorescent nanocrystals (Qdot 655 nm), antibody-antigen interactions were quantified as a per-spot measure of fluorescence intensity using a 480 nm microarray laser scanner. As shown in the false color image of a representative slide stained with anti-phospho-ERK1/2 (Fig. 1), position-specific variation in signal intensity was corrected by nearest neighbor normalization (see “Experimental Procedures”). Accordingly, normalized value distributions for p-ERK, p-STAT3, and actin were centered at 1 with a relatively narrow overall variance and minimized position-specific artifacts (Fig. 1). Samples that did not reproduce in at least two of three biological replicates, or those with dubious spots were excluded from further analyses. The mean of the resulting biological replicates was used as the relative value for each sample with each antibody.
FIGURE 1.

Kinome screening protocol. For each kinome siRNA library master plate (2 μm siRNA concentration in each well), three assay plates with 8.6 pmol of siRNA per well was generated. Transfections were performed in triplicate for biological replicates. After 72 h of transfection, cells were stimulated with 50 ng/ml EGF for 5 min. Lysates were printed onto nitrocellulose slides at a density of 9 plates per slide. Each well was spotted in triplicate for technical reproducibility. Slides were incubated with antibodies against pERK, pSTAT3, and actin. A representative false color image of a slide immunostained with pERK is shown. Each plate has −EGF and +EGF control wells as indicated in the enlarged panel at bottom left. Qualitative consequences of pERK signal intensity upon MAPK1 depletion are evident in the enlarged panel at the top left panel. Due to position-specific artifacts in slide processing, there is a significant position-specific variation in the spot intensity values across the slide (bottom left panel). Nearest neighbor normalization resulted in a consistent distribution of spot intensities across the slides (bottom right panel).
As expected, cytotoxic PLK1 siRNAs on all slides resulted in significant signal reductions from all three antibodies, while siRNAs targeting MAPK1 (ERK2) selectively reduced the p-ERK signal (Fig. 2A). To select hits that potentially modulate EGF-induced signal propagation, all values were normalized to actin signals as a control for protein abundance and filtered for those displaying at least a 20% change (up or down) in relative p-STAT3 or p-ERK signal intensity (Fig. 2B). A distributive retesting of 17 candidates across this panel by immunoblot analysis of independent transfections showed concordance with the high throughput RPPA-derived observations (Fig. 2C). Analysis by RPPA across a time course of EGF stimulation was carried out to examine the consequence of target depletion on signal amplitude together with signal duration. The tested siRNA pools that blunted ERK1/2 and/or STAT3 responsiveness did so across the full time course, suggesting that the targeted gene products are required for EGF signal propagation (ERK1/2: HUNK, PFKFB1, CSNK2A2, MGC16169; STAT3: CSNK2A2, UCK1, MERTK, TNK1; Fig. 2E). In the case of STAT3 activation, many of the siRNA pools which enhanced EGF responsiveness resulted in continued EGF-dependent accumulation of p-STAT3 over time, suggesting the targeted gene products are involved in signal desensitization or termination (PTPRR, DGKD, NYD-SP25, MGC16169; Fig. 2E). Eight targets, selected as representing novel components of each of the major phenotypic groups (DGKD, MGC16169, MERTK, DAPK3, UCK1, TNK1, PFKFB1, NYD-SP25), were further tested for target-specific knockdown by quantitative PCR and phenotypic reproducibility with multiple independent siRNA oligos. All targets were expressed in A431 cells and significantly depleted by cognate siRNAs (supplemental Fig. 3A). In addition, appropriate phenotypes were recovered with two or more independent siRNA oligonucleonucleotides for seven of eight of the targets (supplemental Fig. 3B) suggesting the majority of the targets represent biologically meaningful relationships.
FIGURE 2.

Candidate modulators of EGF-induced ERK1/2 and STAT3 activation. A, the heat map of normalized mean intensity values for siRNAs targeting EGFR, MAPK1, MAPK3, PLK1, and glyceraldehyde-3-phosphate dehydrogenase (GAPDH) is shown. B, the 52 gene hit list. Those siRNA pools with reproducible consequences on ERK1/2 and/or STAT3 activation are shown. The heat map color scale indicates normalized intensity values for respective antibodies. The gene targets were clustered according to their normalized intensity values (unsupervised hierarchical cluster). C, immunoblot validation of a representative panel of hits. Whole-cell lysates prepared from independent transfections were separated by SDS-PAGE and immunoblotted as indicated. Nontargeting siRNAs were used as controls. D, box plots of MNT1 and H1155 cell lethality z-score values for pERK hits relative to other kinases in the screen. E, Heat maps of RPPA analysis of the time courses of EGF stimulation in response to knockdown of the indicated genes. After a 72-h transfection with respective siRNA oligonucleotides, cells were stimulated with 10 (right panel) or 100 ng/ml EGF and collected after 5, 30, or 60 min. The heat map color scale indicates raw intensity values for respective antibodies. SUR8 is included as a positive control of ERK signal abrogation in response to EGF. The right panel shows pSTAT3 stimulation in response to low EGF concentration.
Given the central contribution of EGF receptor family activation to initiation and progression of neoplastic disease (24, 25), we compared the screen-generated functional data set to recent cancer genome-resequencing efforts (14, 16, 17, 26). Annotation of the 52 candidate EGFR signal modulators revealed 31 that had been identified as somatic mutations in tumor tissues or tumor-derived cell lines (supplemental Table 1). In addition to returning expected relationships with known oncogenes, such as CSF1R (27), in several cases, the direction of impact on EGFR signaling upon target depletion infers novel functional relationships between identified somatic mutations and tumorigenic signaling. For example, EPHA3 is frequently mutated in lung and colorectal cancers (14, 26). Whereas identified mutations are broadly distributed across the gene, some likely alter composition of a predicted “molecular brake” in the kinase domain by analogy with structural studies of other receptor tyrosine kinases (26, 28) and may result in constitutive kinase activity. Consistent with a predicted promitogenic role in cancers, EPHA3 depletion impaired EGF-dependent STAT3 activation. By contrast, EPHA7 expression is frequently suppressed by promoter hypermethylation in cancers (29, 30). The elevated STAT3 activation observed upon EPHA7 depletion (Fig. 2B) is consistent with tumor suppressor activity. Similarly, DAPK3 (aka ZIP kinase) depletion resulted in elevated STAT3 activation. Though only a few mutations have been observed to date, this locus is frequently lost in gastric cancer (31). This, together with the inhibitory consequences of DAPK3 expression on EGFR, predicts that the DAPK3 mutations identified by the cancer genome sequencing project likely impair DAPK3 protein function (supplemental Table 1).
Maintenance of ERK1/2 activation, primarily driven by activating mutations in BRAF or N-Ras, is an obligate component supporting survival of many melanoma cell lines and is thus a high priority therapeutic target (32). We therefore compared the consequences of kinome depletion on EGF-induced ERK1/2 activation with consequences on Mnt-1 melanoma cell survival employing a data set derived from a recent genome-wide siRNA screen (33). A similar analysis was performed with a data set from H1155, a tumor line resistant to ERK1/2 inhibition (34). Remarkably, those targets selectively required for EGF-induced ERK1/2 activation in A431 cells were significantly enriched among single-gene lethals in Mnt-1 cells (Fig. 2D (Wilcoxon rank sum test, p < 0.003) and supplemental Table 1). This suggests a significantly more complex target space may be available for pharmacological abrogation of ERK1/2 activation than previously anticipated.
As is readily evident in the heat map display of screen hits (Fig. 2B), we recovered twice as many targets modulating STAT3 activation as compared with ERK1/2 activation. In addition, ERK1/2 activation appeared relatively resistant to reduction of EGFR concentrations (Fig. 2A). This is unlikely to be an artifact of antibody sensitivity as both p-ERK and p-STAT3 selective antibodies had similar dynamic range (supplemental Fig. 1) and suggests that the ERK activation network may be more robust than STAT3 against perturbation of EGFR signaling dynamics in these cells. In fact, ERK1/2 was maximally active upon exposure to 10 ng/ml EGF, whereas p-STAT3 was first detectable in response to 50 ng/ml EGF and continued to accumulate in response to 400 ng/ml EGF (Fig. 3A). Moreover, there was at least a 100-fold difference in the sensitivity of these two pathways to the small molecule EGFR kinase inhibitor erlotinib (Fig. 3B). Taken together, these observations suggest that minimal numbers of activated EGFRs are required to maximally engage ERK1/2 signaling and that these receptors are far from limiting in A431 cells. In contrast, STAT3 responds in a fashion more concordant with the absolute concentration of activating phosphorylation events on EGFR receptors (Fig. 3A). A similar differential sensitivity of ERK1/2 and STAT3 to EGF receptor-dependent signaling was observed in a nonsmall cell lung cancer derived cell line, H1819, known to have high relative EGFR expression. Surprisingly, unlike ERK1/2, STAT3 activation was undetectable in response to EGF stimulation of nontumorigenic telomerase-immortalized airway epithelial cells with a “normal” complement of EGFR (Fig. 3B).
FIGURE 3.

ERK and STAT3 pathways are differentially sensitive to EGF receptor activity. A, cells were stimulated with increasing concentrations of EGF for 5 min (left panel) or treated with increasing concentrations of Tarceva (erlotinib) before stimulating with 100 ng/ml EGF for 5 min (right panel). Lysates were immunoblotted with indicated antibodies. MEK1 is included as a control for equal protein loading. B, human bronchial epithelial cell line (HBEC) and H1819 (lung adenocarcinoma cell line) cells were stimulated for 5 min with increasing concentrations of EGF and probed for pERK and pSTAT3. An A431 lysate of equivalent total protein concentration from 100 ng/ml EGF stimulation is included for comparison.
To examine activity at the level of the EGF receptor, a panel of EGFR tyrosine phosphorylation site-specific antibodies were used to monitor EGF responsiveness upon target depletion as compared with controls. Whereas TNK1 depletion selectively impaired phosphorylation of Tyr845, a canonical Src family site, the most striking observation was a significant reduction in EGFR protein accumulation upon depletion of UCK1 or MERTK (Fig. 4A). This reduction was not associated with reduced accumulation of EGFR mRNA (Fig. 4B) and was recapitulated in two other tumor-derived cell lines known to overexpress EGFR (35) (Fig. 4C). At least one mechanism contributing to reduced EGFR concentrations in all three cell lines is enhanced EGF-dependent EGFR internalization and degradation (Fig. 4D). The enhanced signal-dependent EGFR turnover was reversible by leupeptin-mediated inhibition of lysosomal hydrolase activity. This relationship suggests that UCK1 and MERTK may actively participate in modulation of EGFR trafficking and/or deflection of EGF-dependent signal desensitization.
FIGURE 4.

UCK1 and MERTK regulate STAT3 signaling by modulating EGFR stability in response to EGF. A, A431 cells transfected with the indicated siRNAs were immunoblotted with the indicated antibodies. Whole-cell lysates from a 5-min incubation in 100 ng/ml EGF were prepared 72 h post-transfection. B, relative mRNA levels of EGFR in response to UCK1 and MERTK knockdown. C, the indicated cell lines were transfected with siRNAs targeting UCK1 or MERTK. 48 h post-transfection, lysates were immunoblotted to detect steady-state EGFR concentrations. D, cells treated as in B were stimulated with EGF 48 h post-transfection for the specified times followed by immunobotting for total EGFR protein accumulation. Immunoblots (top panels) and quantitation of band intensities (bottom panels) are shown from a representative experiment from three repeats. E, A431 cells transfected with siRNAs targeting UCK1 were treated with leupeptin or not 48 h post-transfection, as indicated, followed by a 3-h incubation in 100 ng/ml EGF. Whole-cell lysates were immunoblotted for detection of EGFR protein accumulation.
As a tool to aid extrapolation of this screen data set to other system-level analyses and to help infer potential mechanistic relationships for future testing in appropriate experimental models, we next mapped the siRNA targets modulating EGFR signaling onto the human protein interaction network. We constructed a current “state-of-the-field” network of human protein-protein interactions and functional relations from publicly available databases (see “Experimental Procedures”) containing close to 250,000 interactions among 14,503 unique gene products. To define which sub-networks are over- or underrepresented within each data set, we performed a random walk-based network assembly (NetWalk algorithm)4 using actin, p-STAT3, and p-ERK1/2 abundance values to segregate the highest scoring networks (see supplemental Figs. 4–6). Significant subnetworks unique to each data set are shown in Fig. 5. As examples, the low actin network is enriched for mevalonate pathway components (phospho-mevalonate kinase, mevalonate kinase, and mevalonate decarboxylase) (Fig. 5A), indicating their importance in the cell growth and/or survival of A431 cells. The ERK network is mostly centered around MAPKs (see supplemental Fig. 5) but also contains PRKACA (protein kinase A) and ADRBK1 (β-adrenergic receptor kinase) (Fig. 5B), implicating the PKA signaling in the regulation of EGF-induced MAPK signaling. The STAT3 network returned an additional nucleotide kinase, DGUOK (deoxyguanosine kinase), the depletion of which caused a similar phenotype to that of UCK1 in the primary screen, potentially indicating a role for nucleotide metabolism in the regulation of EGFR signaling.
FIGURE 5.

Representative interactions in the highest scoring networks for actin, ERK, and STAT3 data sets. A, subnetwork showing representative highest scoring interactions in the actin network (see supplemental Fig. 3 for the full network). B, representative interactions that are unique for ERK network (see supplemental Fig. 4 for full ERK network). C, representative interactions unique to the STAT3 network (see supplemental Fig. 5 for the full highest scoring network). Colors of nodes indicate their normalized signal intensity values according to respective color keys in each panel. Edge colors indicate type of interaction as shown (PPI, protein-protein interaction; FI, functional interaction as described under “Experimental Procedures”). Network plots were generated by a custom code based on the g plot function in the sna package for R. PRKACA, protein kinase A; ADRBK1, β-adrenergic receptor kinase; DGUOK, deoxyguanosine kinase.
To query the disease relevance of the identified nucleotide kinase/EGFR signaling relationships, we examined the correlation of UCK1 and DGUOK expression with clinical outcomes in breast cancer patients. ERBB2, a member of the EGFR family, is frequently overexpressed in breast cancers and correlates with poor outcome (36). To assess relevance of UCK1 and DGUOK expression in cancers with potentially increased EGF signaling, we divided patient samples into high and low ERBB2 groups based on their ERBB2 mRNA levels. As shown in Fig. 6, high UCK1 or DGUOK expression correlates with poor outcome in breast cancer patients with high but not low ERBB2 expression in two independent cohorts. Together with the cell-based loss-of-function assays, this observation suggests that nucleotide kinases UCK1 and DGUOK may have important roles in sustaining aberrant EGF signaling in vivo.
FIGURE 6.

Clinical significance of UCK1 and DGUOK expression in ERBB2-expressing breast cancer patients. Kaplan-Meier survival curves for breast cancer patients with high and low ERBB2 expression with respect to UCK1 (A) and DGUOK (B) expression. In the upper panels in A and B, Genome Institute of Singapore patient cohort data (38) were used. For lower panels, Jules Bordet Institute data (39) was used. High and low ERBB2 patients were determined from supplied ERBB2 measurement levels in the IJB clinical data. For the GIS data set, these were determined based on ERBB2 mRNA levels in the microarray dataset. p values were calculated using log-rank test in “survival” package for R. DGUOK, deoxyguanosine kinase.
Focused investigation of the EGFR signaling network in normal and diseased cells and tissues has generated an extensive galaxy of interconnected molecular pathways (37). However, parsing those components that represent appropriately fragile pressure points for intervention requires the following: 1) that functional network mapping is inclusive of most key components supporting signal acquisition and transmission and 2) that these functional networks can be decoded to isolate obligate components within distinct regulatory contexts. Here, we have taken a large scale, unbiased approach toward capture of gene products required for mitogen-induced EGFR activation and function. This has generated a rich data set containing novel molecular relationships specifying both common and discrete EGF-dependent signaling events. Although higher resolution mechanistic elaboration of these relationships is indicated, the diversity of those uncovered suggests application of this discovery platform across the human genome is a practical and effective means of generating accurate and coherent molecular maps of cell autonomous signaling architecture.
Supplementary Material
Acknowledgments
We thank Prem Gurnani and Johanne Pastor for advice during the RPPA analyses and Ju-Seog Lee for providing the clinical data.
This work was supported by the Welch Foundation (I-1414) and the National Cancer Institute (CA71443).

The on-line version of this article (available at http://www.jbc.org) contains supplemental Table 1, methods, and Figs. 1–6.
K. Komurov, M. A. White, and P. T. Ram, manuscript submitted.
- EGFR
- epidermal growth factor receptor
- ERK
- extracellular signal-regulated kinase
- siRNA
- small interfering RNA
- RPPA
- reverse-phase protein lysate array
- MAPK
- mitogen-activated protein kinase
- MERTK
- c-mer proto-oncogene tyrosine kinase.
REFERENCES
- 1.Johnson S. A., Hunter T. (2005) Nat. Methods 2, 17–25 [DOI] [PubMed] [Google Scholar]
- 2.Dhanasekaran D. N., Johnson G. L. (2007) Oncogene 26, 3097–3099 [DOI] [PubMed] [Google Scholar]
- 3.Raman M., Cobb M. H. (2003) Curr. Biol. 13, R886–888 [DOI] [PubMed] [Google Scholar]
- 4.Liotta L. A., Espina V., Mehta A. I., Calvert V., Rosenblatt K., Geho D., Munson P. J., Young L., Wulfkuhle J., Petricoin E. F., 3rd. (2003) Cancer Cell 3, 317–325 [DOI] [PubMed] [Google Scholar]
- 5.Elbashir S. M., Harborth J., Lendeckel W., Yalcin A., Weber K., Tuschl T. (2001) Nature 411, 494–498 [DOI] [PubMed] [Google Scholar]
- 6.Mishra G. R., Suresh M., Kumaran K., Kannabiran N., Suresh S., Bala P., Shivakumar K., Anuradha N., Reddy R., Raghavan T. M., Menon S., Hanumanthu G., Gupta M., Upendran S., Gupta S., Mahesh M., Jacob B., Mathew P., Chatterjee P., Arun K. S., Sharma S., Chandrika K. N., Deshpande N., Palvankar K., Raghavnath R., Krishnakanth R., Karathia H., Rekha B., Nayak R., Vishnupriya G., Kumar H. G., Nagini M., Kumar G. S., Jose R., Deepthi P., Mohan S. S., Gandhi T. K., Harsha H. C., Deshpande K. S., Sarker M., Prasad T. S., Pandey A. (2006) Nucleic Acids Res. 34, D411–414 [DOI] [PMC free article] [PubMed] [Google Scholar]
- 7.Maglott D., Ostell J., Pruitt K. D., Tatusova T. (2007) Nucleic Acids Res. 35, D26–31 [DOI] [PMC free article] [PubMed] [Google Scholar]
- 8.Bader G. D., Donaldson I., Wolting C., Ouellette B. F., Pawson T., Hogue C. W. (2001) Nucleic Acids Res. 29, 242–245 [DOI] [PMC free article] [PubMed] [Google Scholar]
- 9.Kerrien S., Alam-Faruque Y., Aranda B., Bancarz I., Bridge A., Derow C., Dimmer E., Feuermann M., Friedrichsen A., Huntley R., Kohler C., Khadake J., Leroy C., Liban A., Lieftink C., Montecchi-Palazzi L., Orchard S., Risse J., Robbe K., Roechert B., Thorneycroft D., Zhang Y., Apweiler R., Hermjakob H. (2007) Nucleic Acids Res. 35, D561–565 [DOI] [PMC free article] [PubMed] [Google Scholar]
- 10.Kanehisa M., Goto S. (2000) Nucleic Acids Res. 28, 27–30 [DOI] [PMC free article] [PubMed] [Google Scholar]
- 11.Griffith O. L., Montgomery S. B., Bernier B., Chu B., Kasaian K., Aerts S., Mahony S., Sleumer M. C., Bilenky M., Haeussler M., Griffith M., Gallo S. M., Giardine B., Hooghe B., Van Loo P., Blanco E., Ticoll A., Lithwick S., Portales-Casamar E., Donaldson I. J., Robertson G., Wadelius C., De Bleser P., Vlieghe D., Halfon M. S., Wasserman W., Hardison R., Bergman C. M., Jones S. J. (2008) Nucleic Acids Res. 36, D107–113 [DOI] [PMC free article] [PubMed] [Google Scholar]
- 12.Ashburner M., Ball C. A., Blake J. A., Botstein D., Butler H., Cherry J. M., Davis A. P., Dolinski K., Dwight S. S., Eppig J. T., Harris M. A., Hill D. P., Issel-Tarver L., Kasarskis A., Lewis S., Matese J. C., Richardson J. E., Ringwald M., Rubin G. M., Sherlock G. (2000) Nat. Genet. 25, 25–29 [DOI] [PMC free article] [PubMed] [Google Scholar]
- 13.Bamford S., Dawson E., Forbes S., Clements J., Pettett R., Dogan A., Flanagan A., Teague J., Futreal P. A., Stratton M. R., Wooster R. (2004) Br. J. Cancer 91, 355–358 [DOI] [PMC free article] [PubMed] [Google Scholar]
- 14.Sjöblom T., Jones S., Wood L. D., Parsons D. W., Lin J., Barber T. D., Mandelker D., Leary R. J., Ptak J., Silliman N., Szabo S., Buckhaults P., Farrell C., Meeh P., Markowitz S. D., Willis J., Dawson D., Willson J. K., Gazdar A. F., Hartigan J., Wu L., Liu C., Parmigiani G., Park B. H., Bachman K. E., Papadopoulos N., Vogelstein B., Kinzler K. W., Velculescu V. E. (2006) Science 314, 268–274 [DOI] [PubMed] [Google Scholar]
- 15.Weir B. A., Woo M. S., Getz G., Perner S., Ding L., Beroukhim R., Lin W. M., Province M. A., Kraja A., Johnson L. A., Shah K., Sato M., Thomas R. K., Barletta J. A., Borecki I. B., Broderick S., Chang A. C., Chiang D. Y., Chirieac L. R., Cho J., Fujii Y., Gazdar A. F., Giordano T., Greulich H., Hanna M., Johnson B. E., Kris M. G., Lash A., Lin L., Lindeman N., Mardis E. R., McPherson J. D., Minna J. D., Morgan M. B., Nadel M., Orringer M. B., Osborne J. R., Ozenberger B., Ramos A. H., Robinson J., Roth J. A., Rusch V., Sasaki H., Shepherd F., Sougnez C., Spitz M. R., Tsao M. S., Twomey D., Verhaak R. G., Weinstock G. M., Wheeler D. A., Winckler W., Yoshizawa A., Yu S., Zakowski M. F., Zhang Q., Beer D. G., Wistuba, Watson M. A., Garraway L. A., Ladanyi M., Travis W. D., Pao W., Rubin M. A., Gabriel S. B., Gibbs R. A., Varmus H. E., Wilson R. K., Lander E. S., Meyerson M. (2007) Nature 450, 893–898 [DOI] [PMC free article] [PubMed] [Google Scholar]
- 16.Wood L. D., Parsons D. W., Jones S., Lin J., Sjöblom T., Leary R. J., Shen D., Boca S. M., Barber T., Ptak J., Silliman N., Szabo S., Dezso Z., Ustyanksky V., Nikolskaya T., Nikolsky Y., Karchin R., Wilson P. A., Kaminker J. S., Zhang Z., Croshaw R., Willis J., Dawson D., Shipitsin M., Willson J. K., Sukumar S., Polyak K., Park B. H., Pethiyagoda C. L., Pant P. V., Ballinger D. G., Sparks A. B., Hartigan J., Smith D. R., Suh E., Papadopoulos N., Buckhaults P., Markowitz S. D., Parmigiani G., Kinzler K. W., Velculescu V. E., Vogelstein B. (2007) Science 318, 1108–1113 [DOI] [PubMed] [Google Scholar]
- 17.Jones S., Zhang X., Parsons D. W., Lin J. C., Leary R. J., Angenendt P., Mankoo P., Carter H., Kamiyama H., Jimeno A., Hong S. M., Fu B., Lin M. T., Calhoun E. S., Kamiyama M., Walter K., Nikolskaya T., Nikolsky Y., Hartigan J., Smith D. R., Hidalgo M., Leach S. D., Klein A. P., Jaffee E. M., Goggins M., Maitra A., Iacobuzio-Donahue C., Eshleman J. R., Kern S. E., Hruban R. H., Karchin R., Papadopoulos N., Parmigiani G., Vogelstein B., Velculescu V. E., Kinzler K. W. (2008) Science 321, 1801–1806 [DOI] [PMC free article] [PubMed] [Google Scholar]
- 18.Parsons D. W., Jones S., Zhang X., Lin J. C., Leary R. J., Angenendt P., Mankoo P., Carter H., Siu I. M., Gallia G. L., Olivi A., McLendon R., Rasheed B. A., Keir S., Nikolskaya T., Nikolsky Y., Busam D. A., Tekleab H., Diaz L. A., Jr., Hartigan J., Smith D. R., Strausberg R. L., Marie S. K., Shinjo S. M., Yan H., Riggins G. J., Bigner D. D., Karchin R., Papadopoulos N., Parmigiani G., Vogelstein B., Velculescu V. E., Kinzler K. W. (2008) Science 321, 1807–1812 [DOI] [PMC free article] [PubMed] [Google Scholar]
- 19.Lovasz L. (1993) Bolyai Society Mathematical Studies 2, 1–46 [Google Scholar]
- 20.Geho D., Lahar N., Gurnani P., Huebschman M., Herrmann P., Espina V., Shi A., Wulfkuhle J., Garner H., Petricoin E., 3rd, Liotta L. A., Rosenblatt K. P. (2005) Bioconjug. Chem. 16, 559–566 [DOI] [PubMed] [Google Scholar]
- 21.Geho D. H., Killian J. K., Nandi A., Pastor J., Gurnani P., Rosenblatt K. P. (2007) Methods Mol. Biol. 374, 229–237 [DOI] [PubMed] [Google Scholar]
- 22.Kuijl C., Savage N. D., Marsman M., Tuin A. W., Janssen L., Egan D. A., Ketema M., van den Nieuwendijk R., van den Eeden S. J., Geluk A., Poot A., van der Marel G., Beijersbergen R. L., Overkleeft H., Ottenhoff T. H., Neefjes J. (2007) Nature 450, 725–730 [DOI] [PubMed] [Google Scholar]
- 23.Swanton C., Marani M., Pardo O., Warne P. H., Kelly G., Sahai E., Elustondo F., Chang J., Temple J., Ahmed A. A., Brenton J. D., Downward J., Nicke B. (2007) Cancer Cell 11, 498–512 [DOI] [PubMed] [Google Scholar]
- 24.Herbst R. S., Fukuoka M., Baselga J. (2004) Nat. Rev. Cancer 4, 956–965 [DOI] [PubMed] [Google Scholar]
- 25.Sharma S. V., Bell D. W., Settleman J., Haber D. A. (2007) Nat. Rev. Cancer 7, 169–181 [DOI] [PubMed] [Google Scholar]
- 26.Ding L., Getz G., Wheeler D. A., Mardis E. R., McLellan M. D., Cibulskis K., Sougnez C., Greulich H., Muzny D. M., Morgan M. B., Fulton L., Fulton R. S., Zhang Q., Wendl M. C., Lawrence M. S., Larson D. E., Chen K., Dooling D. J., Sabo A., Hawes A. C., Shen H., Jhangiani S. N., Lewis L. R., Hall O., Zhu Y., Mathew T., Ren Y., Yao J., Scherer S. E., Clerc K., Metcalf G. A., Ng B., Milosavljevic A., Gonzalez-Garay M. L., Osborne J. R., Meyer R., Shi X., Tang Y., Koboldt D. C., Lin L., Abbott R., Miner T. L., Pohl C., Fewell G., Haipek C., Schmidt H., Dunford-Shore B. H., Kraja A., Crosby S. D., Sawyer C. S., Vickery T., Sander S., Robinson J., Winckler W., Baldwin J., Chirieac L. R., Dutt A., Fennell T., Hanna M., Johnson B. E., Onofrio R. C., Thomas R. K., Tonon G., Weir B. A., Zhao X., Ziaugra L., Zody M. C., Giordano T., Orringer M. B., Roth J. A., Spitz M. R., Wistuba, Ozenberger B., Good P. J., Chang A. C., Beer D. G., Watson M. A., Ladanyi M., Broderick S., Yoshizawa A., Travis W. D., Pao W., Province M. A., Weinstock G. M., Varmus H. E., Gabriel S. B., Lander E. S., Gibbs R. A., Meyerson M., Wilson R. K. (2008) Nature 455, 1069–1075 [DOI] [PMC free article] [PubMed] [Google Scholar]
- 27.Hiraga T., Ninomiya T., Hosoya A., Takahashi M., Nakamura H. (2009) J. Bone Miner. Metab. 27, 149–157 [DOI] [PubMed] [Google Scholar]
- 28.Chen H., Ma J., Li W., Eliseenkova A. V., Xu C., Neubert T. A., Miller W. T., Mohammadi M. (2007) Mol. Cell 27, 717–730 [DOI] [PMC free article] [PubMed] [Google Scholar]
- 29.Guan M., Xu C., Zhang F., Ye C. (2009) Int. J. Cancer 124, 88–94 [DOI] [PubMed] [Google Scholar]
- 30.Wang J., Kataoka H., Suzuki M., Sato N., Nakamura R., Tao H., Maruyama K., Isogaki J., Kanaoka S., Ihara M., Tanaka M., Kanamori M., Nakamura T., Shinmura K., Sugimura H. (2005) Oncogene 24, 5637–5647 [DOI] [PubMed] [Google Scholar]
- 31.Bi J., Lau S. H., Hu L., Rao H. L., Liu H. B., Zhan W. H., Chen G., Wen J. M., Wang Q., Li B., Guan X. Y. (2009) Int. J. Cancer 124, 1587–1593 [DOI] [PubMed] [Google Scholar]
- 32.Tuveson D. A., Weber B. L., Herlyn M. (2003) Cancer Cell 4, 95–98 [DOI] [PubMed] [Google Scholar]
- 33.Ganesan A. K., Ho H., Bodemann B., Petersen S., Aruri J., Koshy S., Richardson Z., Le L. Q., Krasieva T., Roth M. G., Farmer P., White M. A. (2008) PLoS Genet. 4, e1000298. [DOI] [PMC free article] [PubMed] [Google Scholar]
- 34.Whitehurst A. W., Bodemann B. O., Cardenas J., Ferguson D., Girard L., Peyton M., Minna J. D., Michnoff C., Hao W., Roth M. G., Xie X. J., White M. A. (2007) Nature 446, 815–819 [DOI] [PubMed] [Google Scholar]
- 35.Wu X., Fan Z., Masui H., Rosen N., Mendelsohn J. (1995) J. Clin. Investig. 95, 1897–1905 [DOI] [PMC free article] [PubMed] [Google Scholar]
- 36.Tagliabue E., Balsari A., Campiglio M., Pupa S. M. (2010) Exp. Opin. Biol. Ther. 10, 711–724 [DOI] [PubMed] [Google Scholar]
- 37.Schlessinger J. (2004) Science 306, 1506–1507 [DOI] [PubMed] [Google Scholar]
- 38.Miller L. D., Smeds J., George J., Vega V. B., Vergara L., Ploner A., Pawitan Y., Hall P., Klaar S., Liu E. T., Bergh J. (2005) Proc. Natl. Acad. Sci. U.S.A. 102, 13550–13555 [DOI] [PMC free article] [PubMed] [Google Scholar]
- 39.Loi S., Haibe-Kains B., Desmedt C., Lallemand F., Tutt A. M., Gillet C., Ellis P., Harris A., Bergh J., Foekens J. A., Klijn J. G., Larsimont D., Buyse M., Bontempi G., Delorenzi M., Piccart M. J., Sotiriou C. (2007) J. Clin. Oncol. 25, 1239–1246 [DOI] [PubMed] [Google Scholar]
Associated Data
This section collects any data citations, data availability statements, or supplementary materials included in this article.