Abstract
Mallory-Denk bodies (MDBs) are found in chronic liver diseases. Previous studies showed that Diethyl-1, 4-dihydro-2,4,6,-trimethyl-3,5-pyridinedicarboxylate (DDC) induced formation of MDBs and the up regulation of UbD expression in mouse liver. UbD is a protein over expressed in hepatocellular carcinomas. It is a potential preneoplastic marker in the mouse. It is hypothesized that inflammatory cytokines play a critical role in UbD up regulation and MDB formation. TNFa and IFNg treatment of HCC cell line Hepa 1–6, induced the expression of UbD and the expression of genes coding for the immunoproteasome (LMP2, LMP7, and MECL-1 subunits). TNFa and IFNg induced the activity of the UbD promoter, using a luciferase assay. The co-treatment with TNFa and IFNg induced the activity of the UbD promoter through an Interferon Sequence Responsive Element (ISRE). In addition, long term treatment with TNFa and IFNg induced the formation of MDB-like aggresomes in Hepa 1–6 cells, which emphasizes the role of inflammation in the formation of MDBs leading to the formation of liver tumors, in the mouse. Identifying the mechanism that regulates gene expression of UbD supports the hypothesis that down regulation of UbD and the proinflammatory gene expression would prevent MDBs and HCC formation. Previous studies indicate that S-adenosylmethionine or betaine prevented IFNg induced UbD and MDB formation.
Keywords: MDB: Mallory-Denk Bodies, IFNg: Interferon gamma, TNFa: Tumor Necrosis Factor alpha, ISRE: Interferon stimulated response element, UbD: Di-Ubiquitin (Fat10), Ub: Ubiquitin
INTRODUCTION
Mallory-Denk Bodies (MDBs) are a morphologic feature of alcoholic steatohepatitis (ASH). They also occur in a variety of other liver diseases, such as non-alcoholic steatohepatitis (NASH), which represents a progressive form of non-alcoholic fatty liver disease called NAFLD, as well as intestinal bypass surgery, certain types of drug-induced liver diseases e.g., related to amiodarone, chronic cholestasis (in particular, primary biliary cirrhosis), copper storage related diseases (Wilsons disease, idiopathic copper toxicosis, Indian childhood cirrhosis), alpha-1-antitrypsin deficiency, and in benign and malignant hepatocellular neoplasms and tumor-like lesions e.g., focal nodular hyperplasia (French, 1981a; French, 1981b; Nakanuma and Ohta, 1985; Zatloukal et al., 2007). MDBs are aggresomes of proteins containing p62, cytokeratin (CK8 and 18), Ubb+1 and ubiquitin (Ub) (Bardag-Gorce et al., 2003; Nan et al., 2004; Ohta et al., 1988). Mice fed diethyl-1,4-dihydro-2,4,6-trimethyl-3,5-pyridine decarboxylate (DDC) added to a normal mouse diet for 10 weeks, formed MDBs in clusters of hepatocytes (Yuan et al., 1996). MDBs mostly disappear by 1 month of DDC withdrawal (Oliva et al., 2008). However, following 7 days of DDC refeeding, MDBs form again (Oliva et al., 2008; Yuan et al., 1996). Recent studies have shown that MDB formation is linked with UbD over expression (Bardag-Gorce et al., 2008; Oliva et al., 2008), the switch of proteasome population to immunoproteasome (Oliva et al., 2009a), and the activation of TLR2/4 signaling mechanism of proinflammatory gene expression.
A connection between inflammation and cancer has long been suspected. Epidemiological studies have established that many tumors occur in association with chronic infectious diseases (Schutte et al., 2009). It has also been shown that persistent inflammation in the absence of infections increases the risk of cancer and accelerates its development (Shan and Liu, 2009; Wu and Zhou, 2009). One clear example of inflammation-related cancer is hepatocellular carcinoma (HCC)(Schutte et al., 2009). HCC is a type of tumor that slowly develops on a background of chronic inflammation mainly triggered by exposure to infectious agents (hepatotropic viruses) (Heydtmann and Adams, 2009) or to toxic compounds (ethanol) (Mandrekar and Szabo, 2009). The molecular links that connect inflammation and cancer are not completely understood, but evidence gathered over the past few years are beginning to define the precise mechanisms. However, the evidence has shown the important role played by transcription factors, such as NF-kappa B and STAT3, the role of cytokines such as IL-6 and IL-1 alpha and other inflammatory mediators in cancer development, with special emphasis in the case of HCC (Aggarwal and Gehlot, 2009; Yu et al., 2009). The molecular dissection of the pathways connecting the inflammatory reaction and neoplasia could pave the way to more effective therapies for treating cancers. Studies have shown a link between the inflammatory response and the development of HCC (Berasain et al., 2009). Cytokines and downstream effectors (STAT1, STAT3, and NFkB) are activated during inflammation, which could be the mechanism of activation of genes which leads to tumor formation. STAT1 and STAT3 are downstream signals of TNFa and IFNg cytokine pathway (Adamkova et al., 2007), cytokines known to induce the expression of UbD (Lukasiak et al., 2008; Raasi et al., 1999) and the immunoproteasome protein LMP2 (Lukasiak et al., 2008).
After 8–15 months withdrawal from DDC, tumors formed in the liver of mice (Oliva et al., 2008). These tumors over expressed UbD protein, a preneoplastic marker expressed by liver cells (Oliva et al., 2008). Indeed, during the progression of tumor formation, we observed the formation of clusters of cells that over express UbD (Oliva et al., 2008). In parallel studies, UbD was found to be over expressed in HCC (Lee et al., 2003; Lukasiak et al., 2008). Lukasiak et al. showed a correlation between the over expression of human UbD, also called FAT10 in humans, and the protein LMP2, a specific protein of the immunoproteasome (Lukasiak et al., 2008).
UbD is a member of the ubiquitin-like modifier family of proteins, and is thought to play an important role in the immune system (Canaan et al., 2006), cytokine response (Bates et al., 1997; Raasi et al., 1999), apoptosis (Raasi et al., 2001), and mitosis (Liu et al., 1999). The expression of UbD is regulated by various transcription factors such as p53 (Ji et al., 2009; Zhang et al., 2006) and retinoid nuclear receptors (Dokmanovic et al., 2002). In the present study, we have investigated the regulation of the expression of the UbD gene and immunoproteasome specific genes in response to TNFa and IFNg cytokine treatment. Hepa 1–6 cells were used to study the regulation of the UbD promoter. In addition, an in vitro long term treatment with TNFa and IFNg was done to study the formation of MDBs to mimic sustained drug-induced chronic liver disease where MDBs are formed.
MATERIAL AND METHODS
Cell Culture
Hepa 1–6 (ATTC, Manassas, VA) derived cells were maintained in Dulbecco’s minimum essential medium (DMEM) with phenol red supplemented with 5% Fetal Bovine Serum (FBS medium). To study the RNA and protein expression, 106 Hepa 1–6 cells were seeded in 100mm cell culture dishes, with or without FBS, without antibiotics. They were incubated for 48h. Cells, in the presence or absence of FBS, were treated for 48 h with : PS-341 0.1mM (LC Laboratories, Woburn, MA), TNFa,0.2 U/ml (BD Pharmigen, San Jose, California), IFNg, 0.2 U/ml (Shenandoah Biotechnology, Warwick, PA), NFkB inhibitor, 40 nM (Calbiochem, Gibbstown, NJ), SP600125 10uM (Sigma-Aldrich, St. Louis, MO) or SB202190 20uM (Sigma-Aldrich, St. Louis, MO).
Cloning of the UbD Promoter Region and cDNA of UbD
No putative promoter region in the UbD gene has been characterized so far. Upstream regions of the UbD gene were cloned from -4260 bases, including the 250 first bases in the first exon to test promoter activity after different treatments. The sequence used to design the primers is named: NT_039649.6 in the mouse genome, in the NIH website. The different promoters were cloned in the pGL3Luc+ in the cloning site (Promega, Madison, WI): XhoI and MLUI for the IIL, and SacI for D1, D2, and D3 promoter (New England Biolabs, Ipswich, MA). PCR was performed using mouse genomic DNA from mouse liver and primers (Table 1):
Primers to clone the promoter of UbD
| Name of the Amplified product |
Forward Primers | Reverse Primers |
|---|---|---|
| IIL | CCTCACGCGTGGAGTAGGGGCTCCTGAAG (MLUI) |
CAAG CTCGAG TCCAGTTTAGCAG (Xho I ) |
| D1 | CTCCGAGCTCAGACACACCAGAAGAGGACATCA (SACI) |
CAAG CTCGAG TCCAGTTTAGCAG (Xho I ) |
| D2 | CTCCGAGCTCAAGCAGCATGTCAGCACCAT (SACI) |
CAAG CTCGAG TCCAGTTTAGCAG (Xho I) |
| D3 | CTCCGAGCTCCACATGTCTCTGGCCTCAGG (SACI) |
CAAG CTCGAG TCCAGTTTAGCAG (Xho I) |
PCR was done with Phusion® Flash High-Fidelity PCR (Finnzymes, Woburn, Massachusetts) on 10 ng of mouse genomic DNA or 2 ng of mouse cDNA, with the following conditions for PCR: 98°C for 30 s, and then 40 cycles at 98°C for 15 s, 60°C for 30 s, 72°C 30 s, and finally 5 min at 72°C.
Table 1.
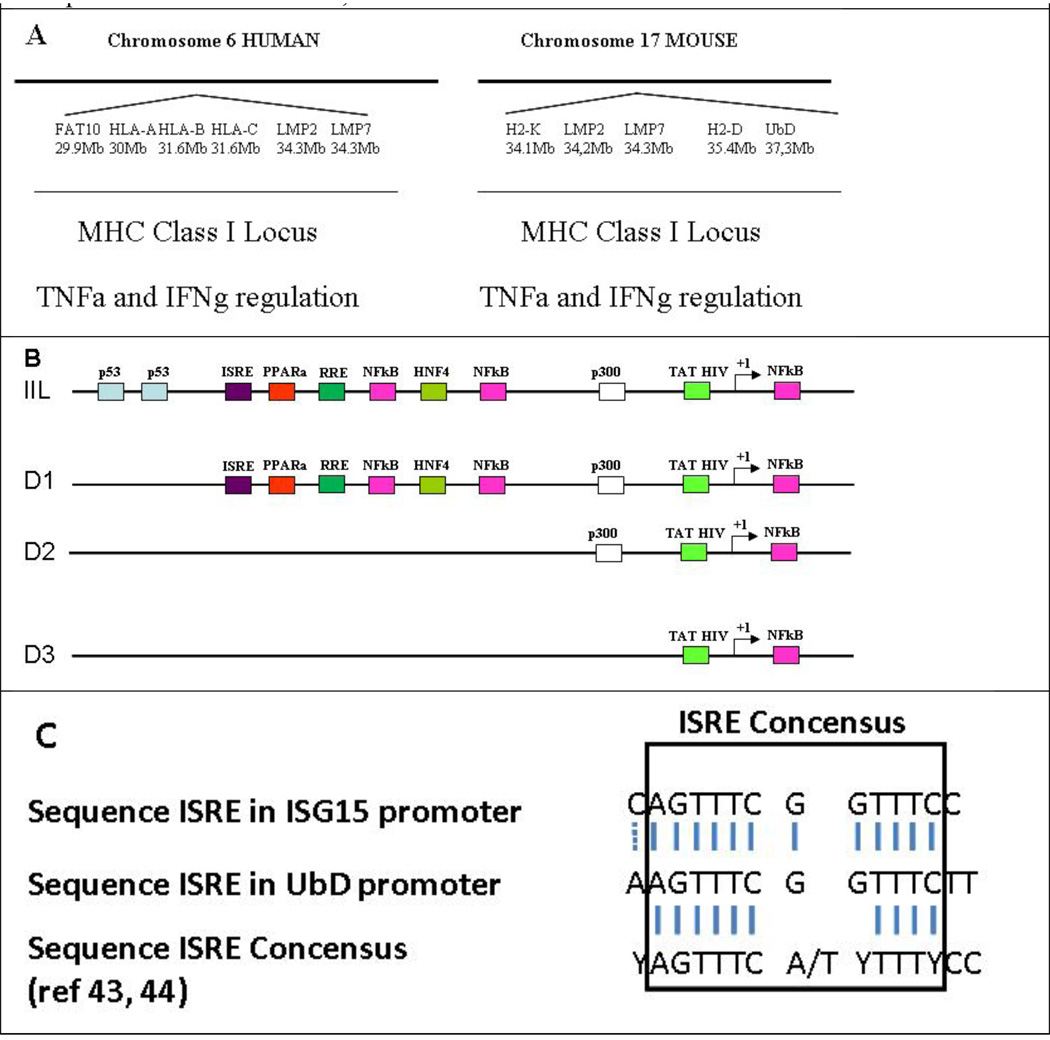
A) Comparison of the histocompatibility MHCI locus between human and mouse. B) Scheme of mouse UbD Promoter. The size of the cloned UbD promoter is 4.2 Kb. Using Tfsitescan software, we identified different consensus sequences involved in the expression of UbD: p53 down regulating UbD expression 28, 29, RRE (Retinoid Responsive Elements) have been found to be involved in this down regulation 30, and TAT HIV sequence has been found to be involved in the up regulation of UbD in the kidney 52. One ISRE consensus sequence was found in the promoter at 3.5 Kb upstream from the starting point. C) Comparison of the UbD ISRE, ISG15 ISRE and the consensus ISRE is shown 43, 44.
 |
The PCR products were purified using the NucleoSpin Extract II kit (Macherey-Nagel, Bethlehem, PA). PCR products were cloned in the pGMET vectors, according to the company’s protocol (Promega, Madison WI) and sequenced. The inserts were digested with the corresponding restriction enzyme for 90 min at 37°C (New England Biolabs, Ipswich, MA). The inserts were purified using the NucleoSpin Extract II kit (Macherey-Nagel, Bethlehem, PA). The purified product was cloned in the pGL3Luc+ vector (Promega, Madison, WI).
Transient Transfection of the Promoter of UbD
Fifty thousand Hepa 1–6 cells were seeded in 24-well plates in the absence of FBS for 48 h. On the third day, the cells were transfected with the vectors using JET PEI, according to the company’s protocol (Polyplus, Illkirch, France). After 48 h. of treatment, in the absence of FBS, the cells were stopped by adding 300 µl of cell lysis buffer (Promega, Madison, WI) to each well. 100 µl was used to measure Beta-galactosidase activity to standardize the luciferase activity (37°C). Beta-galactosidase activity was measured spectrophotometrically at 420 nm (Promega, Madison, WI). 20 µl of cell lysis buffer was used to quantify the luciferase activity of the reporter gene, using the luciferase assay system (Promega, Madison, WI).
Long term treatment of Hepa 1–6 with TNFa and IFNg
5×10⁶ cells were seeded in 100mm cell culture dishes. The cells were treated with the cytokines TNFa and IFNg, in the presence of 1% of FBS for 43 days. Every third day, the media and the cytokines were renewed. At confluence, the cells were trypsinized and split. Some cells were put on slides for immunohistochemistry. Cells were also seeded in 100mm cell culture plates in order to continue the long term experiment.
Quantitative Real-time RT-PCR Assay
Total liver RNAs were extracted with Trizol Plus RNA Purification kit (Invitrogen, Carlsbad, CA). Synthesis of cDNAs was performed with 5 µg total RNA, and 50 ng random hexamer primers using SuperSriptIII RNase H− Reverse Transcriptase (Invitrogen, Carlsbad, CA). PCR primers were designed with the Primer Express software (Applied Biosystems, Foster City, CA). The primers used for UbD, LMP7, LMP2 and MECL-1 were:
| UbD | NM_023137 |
| Forward | GATTGACAAGGAAACCACTATCCA |
| Reverse | ACAAGGGCAGCTCTTCATCAC |
| LMP7 | NM_010724 |
| Forward | GGCTCTCGGGACAGATGTTTT |
| Reverse | ACCACTGTCCATCACCCCATA |
| LMP2 | NM_013585 |
| Forward | TGGAGCTACACGGGTTGGA |
| Reverse | GAGATGTTCTTCACCACGTTTGC |
| MECL-1 | NM_013585 |
| Forward | TTGTGTTCCGAGATGGAGTCAT |
| Reverse | GCCACAACCGAATCGTTAGTG |
Sense and anti-sense
Quantitative PCR was achieved by using the SYBR Green JumpStart™ Tag ReadyMix (Sigma, St. Louis, MO) on an ABI PRISM 7000 Sequence Detector system (Applied Biosystems, Foster City, CA). The thermal cycling consists of an initial step at 50°C for 2 min, followed by a denaturation step at 95°C for 10 min, then 40 cycles at 95°C for 15 s, and 60°C for 1 min. Single PCR product was confirmed with the heat dissociation protocol at the end of the PCR cycles. Quantitative values were obtained from the threshold PCR cycle number (Ct) at which point the increase in the signal associated with an exponential growth for PCR product begins to be detected. The target mRNA abundance in each sample was normalized to its 18S level as ΔCt = Cttarget gene − Ct18S. For each target gene, the highest ΔCt was assigned as ΔCtmax.
Western Blot Analysis
Proteins (50 ug) from liquid nitrogen frozen stored livers were separated by SDS-PAGE gels and transferred to a PVDF membrane (Bio-Rad, Hercules, CA) for 1 h in 25 mM Tris-HCl (pH 8.3), 192 mM glycine and 20% methanol. The membranes were stained using ERK/p42/44 (Cell Signaling, Danvers, MA) STAT1 (Abcam, Cambridge, MA), STAT3 (Abcam, Cambridge, MA) and beta actin (Sigma-Aldrich, Saint louis MO). Appropriate species anti polyclonal and monoclonal HRP-conjugated antibodies were used as the secondary antibodies. The membranes were subjected to chemiluminescence detection using luminal, according to the manufacturer’s instructions (Amersham Pharmacia Biotech, Piscataway, NJ).
Immunohistochemistry
Cells on coverslips and liver biopsy sections were double stained with the primary antibodies rabbit anti UbD (Fat10) (BioMol, Plymouth Meeting, PA), rabbit anti CK8 (Fitzgerald Industries Intl, Concord, MA) and mouse anti ubiquitin (Chemicon, Temecula CA). Secondary antibodies conjugated with FITC or Texas Red (Jackson, West Grove, PA) were used to detect binding of the primary antibodies. Dapi was used as the nuclear stain The slides were examined using a Nikon-400 fluorescent microscope with a triple color band cube to detect simultaneously FITC, Texas Red and DAP1 staining. UbD positive hepatocytes were detected.
Proteasome Chymotrypsin-Like Activity Assay
Nuclei were isolated, and 1 µg of total protein was used (Oliva et al., 2009b). The reaction mixture contained 50 mM Tris–HCl pH 8, 1 mM DTT, and 40 uM Suc-LLVY-AMC substrate for chymotrypsin-like activity. The mixture was incubated for 30 min at 37°C, and then stopped by adding 100 µM monochloroacetate and 30 mM sodium acetate pH 4.3. Fluorescence was determined by measuring the release of AMC (λ excitation: 355 nm, λ emission: 430 nm) using a Perkin Elmer LS 30 spectrofluorometer.
Results and Discussion
Cytokines, such as TNFa, IFNg, and IL-6, are released by Kupffler cells and hepatocytes during inflammation. Activated intracellular pathways stimulate genes involved in antigen presentation (Wang et al., 2007) (Knolle et al., 1997). Bates et al. (1997) identified UbD as one of the genes induced during inflammation from human dendritic cells (Bates et al., 1997). UbD is a small protein of 17 kDa, and its functional role is not well understood, nor is the cellular localization known (Lee et al., 2003). The UbD gene is located on the mouse MHC-I locus (chromosome 17) and on the human MHC-I locus (chromosome 6) (Table 1A). Other relevant genes are present in this locus, i.e., genes involved in the presentation of antigen (HLA), and those coding for the immunoproteasome subunits: LMP2 and LMP7 (Table 1A). Homologous gene localization is found for the human locus. The activation of the inflammatory pathway also activates the other genes present in the MHC-I locus: UbD, LMP2 and LMP7.
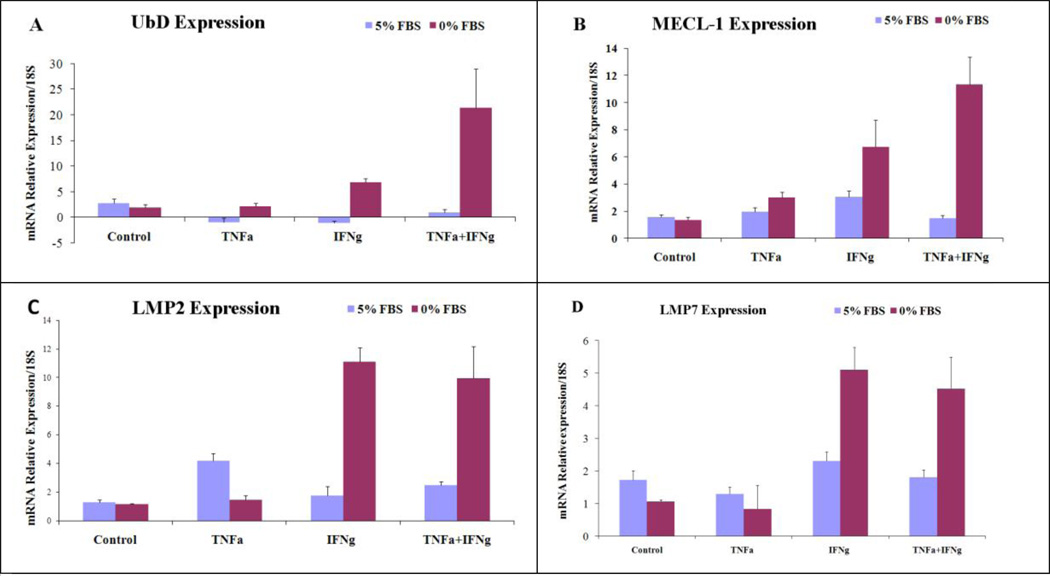
Previous studies have shown that IFNg and TNFa increase the expression of UbD (Lukasiak et al., 2008; Raasi et al., 1999) and LMP2. The latter is a catalytic subunit of the immunoproteasome. However, it is important to notice that the induction by the cytokines was absolutely different depending on the cell line. Even some human cell lines do not show up regulation of UbD by treatment with cytokines. According to Raasi and Lukasiak, the cell culture conditions were not indicated as to whether the cells were cultivated in the presence of serum or starved (Lukasiak et al., 2008; Raasi et al., 1999). We thus decided to study their regulation in the presence of 5% FBS or in the absence of FBS, incubated for 48h and then treated for 48h. We observed a dramatic difference in the regulation of gene expression depending on whether there was serum present or absent. Indeed, in the presence of FBS, the cytokines TNFa and IFNg were not able to induce the expression of UbD, MECl-1, LMP2 and LMP7 (Fig 1 ABCD). Also, in the absence of serum, TNFa was not able to induce their expression (Fig 1 ABCD). However, IFNg was able to induce their expression. This had been shown in different cell lines (Raasi et al., 1999). We observed a synergistic effect with the co treatment of the two cytokines in the absence of serum, including LMP2 and LMP7 (Fig 1). The different treatments did not have an effect on the expression of the control gene beta-Actin (data not shown). Raasi and Lukasiak showed that cytokines directly induced the expression of UbD without de novo synthesis of the protein, and that lactacystin (a proteasome inhibitor) blocked the effect of TNFa and IFNg (Raasi et al., 1999).
Fig 1.
Changes in the expression of UbD and the catalytic subunits of the immunoproteasome were measured by qReal-Time PCR (N=4). Beta-Actin gene was used as the negative control for the effect of TNFa and IFNg cytokine transcriptional regulation. (UbD for 0%: TNFa+IFNg vs. C p<0.001; TNFa+IFNg vs TNFa p<0.001; TNFa+IFNg vs IFNg p=0.002; MECL-1: TNFa+IFNg vs. C p=0.002; TNFa+IFNg vs. IFNg p=0.044; TNFa+IFNg vs. IFNg p=0.004; IFNg vs. C p=0.054).
There was an increase in ERK/p42/44, STAT1 and STAT 3 phosphorylation induced by IFNg and the co treatment of the two cytokines. TNFa alone was only able to induce the phosphorylation of ERK/p42/44 (Fig 3). Gerber et al showed that IFNg increased the phosphorylation of STAT1 (Gerber et al., 2009). TNFa was able to induce the phosphorylation of STAT1, which was the same result that Wesemann and Benveniste (2003) reported, possibly because of the cell line (Fig 3) (Wesemann and Benveniste, 2003).
Fig 3.
Analysis of the phosphorylation levels of ERK/p42/44, STAT1 and STAT3. TNFa was able to induce the phosphorylation of p42/44. IFNg increased the phosphorylation of p42/44, STAT1 and STAT3. The combination of the two cytokines (I+T) had a synergistic effect on the phosphorylation of STAT1 and STAT3. (N=3)
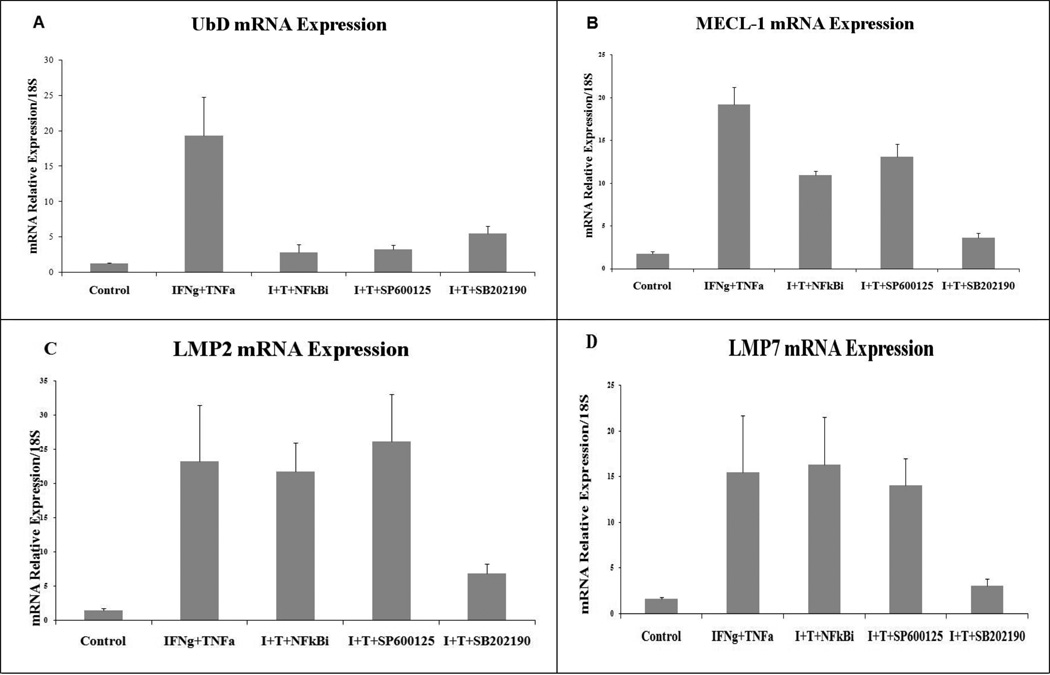
We also used inhibitors of NFkBi, SP600125, SB202190, NFkB, JNK and p38 respectively to determine the pathway which activates UbD and the specific genes of the immunoproteasome. The importance of the NF-kB pathway in IFNg signaling is still emerging. IFNg can induce DNA binding of NF-kB in a STAT1-independent manner (Deb et al., 2001). The inhibitor of IkB kinase (IKK) maintains the NFkB components in an inactive state. In response to stimuli by IFNg, IkB was phosphorylated by IKK leading to IkB degradation, and, thus, the release of active NF-kB components. In our experiment, NFkB inhibitor blocked the induction of UbD expression (Fig2 A). However, the inhibitor did not inhibit the expression of LMP2, LMP7 and only slightly inhibited the expression of MECL-1 (Fig 2 ABCD). No previous studies have shown the promoter regulation of the genes for MECL-1, LMP2 and LMP7 by NFkB, indicating that the IFNg/TNFa treatment induced the expression of these genes by other pathways. Other pathways, such as the MAPK pathway, could be activated by treatment with TNFa and IFNg. IFNg triggers the activation of the MEK1/ERK1/2 pathway in a range of cell lines and primary cell cultures, which could occur through a number of different molecular pathways (Gough et al., 2007). It has also been reported that IFNg does not activate JNK/MAP kinase (Gough et al., 2007). However, it has been shown recently that IFNg can activate JNK in macrophages, where it appears to be required for the expression of genes associated with antigen presentation (Valledor et al., 2008).
Fig 2.
Effects of NFkB, JNK and p38 inhibitors on the expression of UbD and immunoproteasome catalytic subunits induced by TNFa and IFNg. (n=4) (Statistics for UbD: Control vs. I+T p=0.002; I+T vs. I+T+NFkBi p=0.005; I+T vs. I+T+SP600125 p=0.002; I+T vs. IT+SB202190 p=0.002; for MECL-1: I+T vs. Control p<0.001; I+T vs. I+T+SB202190 p<0.001; for LMP2: Control vs. I+T p=0.043; I+T vs. I+T+SB202190 p=0.096; for LMP7: Control vs. I+T p=0.044; I+T vs. I+T+SB202190 p=0.045. (I+T : IFNg + TNFa).
The treatment with both cytokines synergistically increased the expression of UbD (Fig 2 A). SP600125 (a JNK inhibitor) blocked the effect of the IFNg and TNFa co-treatment on the expression of UbD, but not in the expression of the others genes (Fig 2 B, C, D). The activation of p38 MAP kinase by IFNg is somewhat controversial. IFNg-stimulated recruitment of MyD88 to the receptor has been shown to trigger the activation of the MKK6/p38 MAP kinase pathway (Sun and Ding, 2006). Furthermore, c-Src activation at the IFNgR results in the activation of the calcium-dependent kinase Pyk2, leading to the activation of the Mekk4/MKK6/p38 MAP kinase pathway (Halfter et al., 2005). However, other authors have been unable to demonstrate the phosphorylation of p38 MAP kinase in response to IFNg (Gough et al., 2007; Ramsauer et al., 2002). Using SB202190 (inhibitor of p38), we showed that the inhibition of p38 kinase blocks the expression of genes (Fig 2).
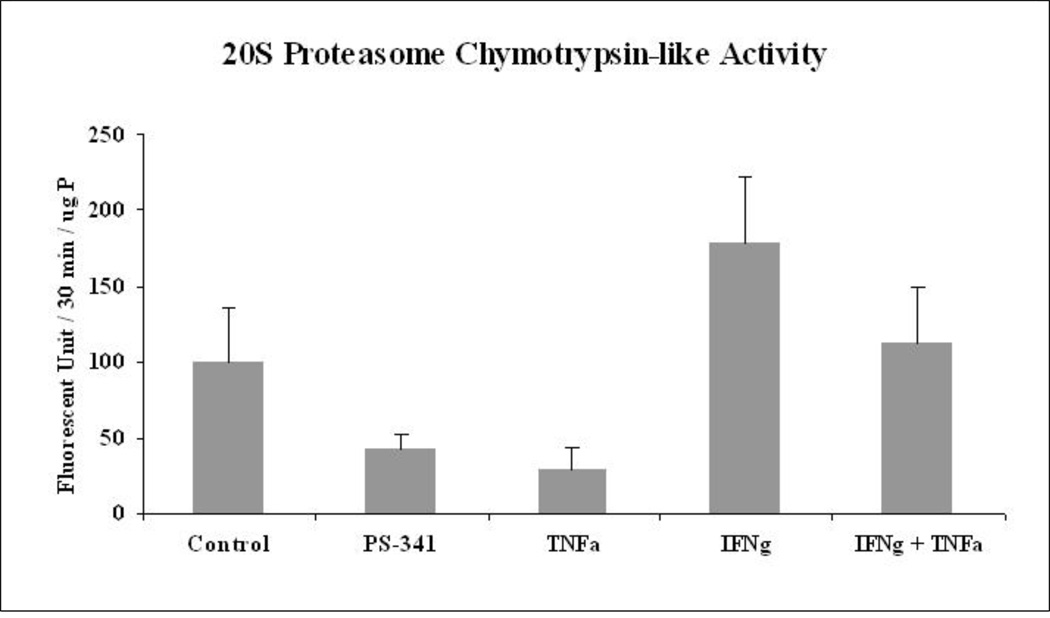
Using the MDB mouse model, we observed a switch of the proteasome to form the immunoproteasome during DDC feeding (Oliva et al., 2009a). The 20S proteasome activity decreased and the immunoproteasome catalytic subunits such as LMP2, LMP7 and MECL-1 were over expressed (Oliva et al., 2009a). In parallel, we found an increase in the expression of TNFa and IFNg receptors in the liver (Oliva et al., 2009a). Here, we hypothesized that a similar mechanism would occur in the Hepa 1–6 cell lines treated with IFNg and TNFa. We used PS-341 as a positive control to show the effect of inhibition of the proteasome activity. IFNg induced the activity of the proteasome catalytic subunits of the immunoproteasome population (Fig 4). Osna et al (2003) also showed the increase in the 20S proteasome activity with IFNg treatment (Osna et al., 2003). However, TNFa, surprisingly, repressed the activity of the 20S proteasome, which has not been reported. However, the combined treatment neutralized the proteasome chymotrypsin-like activity of the 20S proteasome to control levels (Fig 4).
Fig 4.
Proteasome chymotrypsin-like activity was measured in the Hepa 1–6 cells treated with PS-341 (a proteasome inhibitor) TNFa, IFNg and IFNg+TNFa. (SEM, N=3; Differences between all the groups: p= 0.047).
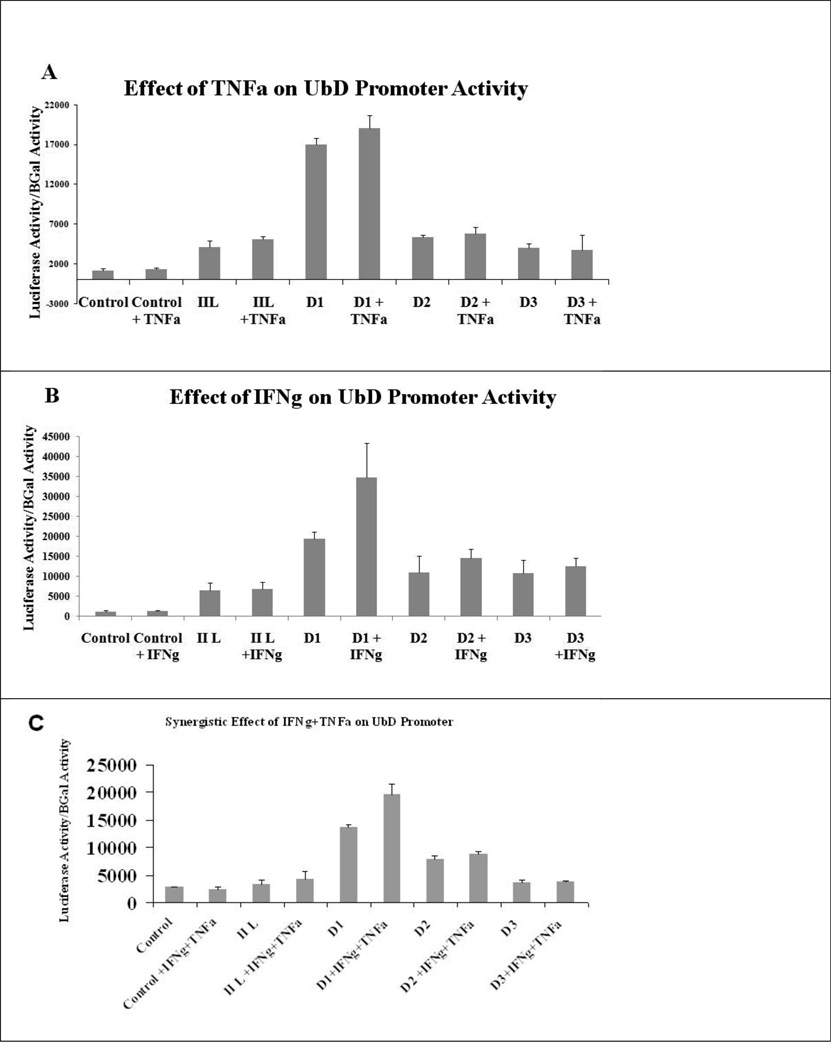
We cloned the hypothetical UbD promoter (4260 bases upstream from the initiation point) to analyze its regulation by TNFa and IFNg. The transfection of the longer promoter, called IIL, was not up regulated by TNFa, IFNg or the co treatment. However, the promoter D1 had higher basal activity than the IIL promoter. We hypothesized that the longer promoter was down regulated by the protein p53, as shown by Zhang et al. (Zhang et al., 2006). The mutant of p53 leads to a gastric tumor and also an over expression of FAT10 (Ji et al., 2009). Indeed, the mouse UbD promoter showed the presence of two potential p53 consensus sequences of the deleted promoter that could explain the increase in the basal activity (Table 1B) (Fig 5). However, TNFa alone was not able to induce the expression of UbD promoter D1 which correlates with the qRT-PCR results (Fig 5a) (Fig 1A). IFNg alone and the co treatment were able to induce the expression of the UbD promoter, exactly as we showed with qRT-PCR (Fig 1A). By comparing the promoter sequences, we found the presence of an ISRE sequence on the D1 promoter (Table 1 B, C). This ISRE has a similar sequence to the ISRE of ISG15, another gene which was induced by the interferon gamma and consensus sequence of ISRE (Levy et al., 1988; Weihua et al., 1997). In the absence of this ISRE sequence, the TNFa+IFNg co-treatment was not able to induce the activity of the UbD promoters D2 and D3 (Fig 5 C).
Fig 5.
The IIL UbD promoter was repressed by p53 protein. IFNg, but not TNFa, was able to induce the activity of the UbD promoter (D1 promoter) when the p53 consensus sequences were absent. However, IFNg is not able to induce the activity of D2 and D3 shorter UbD promoter, indicating the presence of an ISRE sequence in the IIL UbD promoter. (TNFa treatment: D1 vs. IIL p<0.001; IFNg treatment: D1 vs. IIL p=0.151; D1 vs. D1+IFNg p=0.005; TNFa+IFNg treatment: D1 vs. IIL p<0.001; D1 vs. D1+IFNg+TNFa p<0.001)
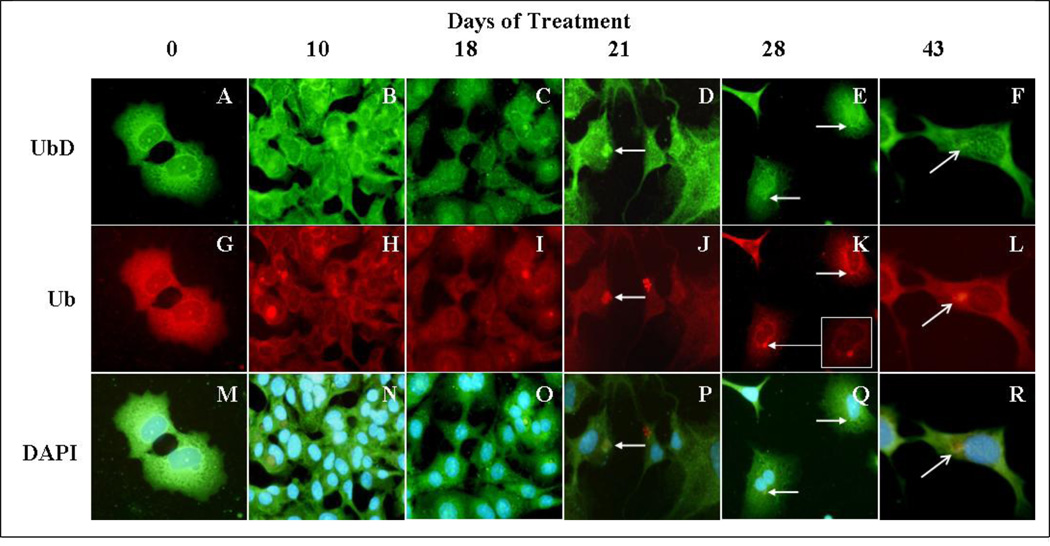
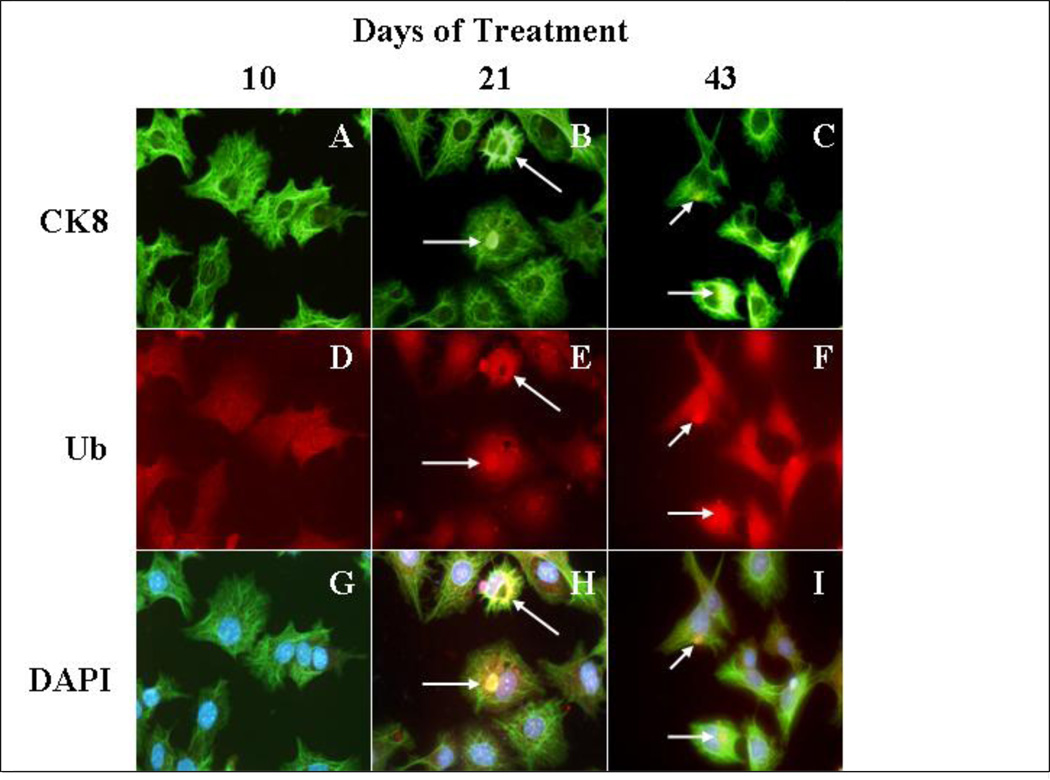
MDB formation in mice is reversible since MDBs become smaller and less numerous after withdrawal of the drug (Yuan et al., 1996). However, both “recovered” humans and animals remain highly predisposed to MDB re-formation (Jensen and Gluud, 1994a; Jensen and Gluud, 1994b),(Yuan et al., 1996). Moreover, the re-formation of MDBs can be induced by a variety of non-specific stress inducing agents when introduced after withdrawal of the drug in the drug primed mouse. (French et al., 2001). The purpose of this study was to maintain long term in vitro treatment of Hepa 1–6 cells, with TNFalpha and IFNgamma to mimic long term proinflammatory conditions in the liver caused by alcohol. The treatment of the cells was stopped at different time intervals. The cells were immunostained for ubiquitin, which is a marker of MDBs (Ohta et al., 1988). After 21 days of treatment, we observed the formation of MDB-like aggresomes in the liver tumor cells (Fig 6 D, J, P). The MDB-like aggresomes were still present after 43 days of continuous treatment, indicating that the proinflammatory cytokines in the liver could induce the formation of MDB-like aggresomes in vitro (Fig 6 F,L,R). The MDB-like aggresomes were shown to be formed by the presence of Ub and CK-8, which colocalizes in the aggresomes (Fig 7).
Fig 6.
Study of the formation of MDBs in Hepa 1–6 cells treated continuously for 43 days with a cotreatment of IFNg and TNFa. UbD localized with aggresomes (white arrows) similar to the MDB-like aggresomes seen after 21 days of cotreatment with cytokines. The immunostaining was done using antibodies against endogenous UbD (green) and ubiquitin (red). Nuclei were stained with DAPI (blue). A to F; cells stained with UbD antibody. G to L; cells stained with Ubiquitin antibody. M to R; cells stained with DAPI (Magnification ×175).
Fig 7.
Study of the formation of MDBs in Hepa 1–6 cells treated continuously for 43 days with a cotreatment of IFNg and TNFa. CK8 localized with aggresomes (white arrows) similar to MDB-like aggresomes, after 21 days of cotreatment with cytokines. The immunostaining is done with antibodies against endogenous CK8 (green), ubiquitin (red). The nuclear stain was DAPI (blue). A to C cells stained with CK8 antibody. D to F cells stained with Ubiquitin antibody. G to I cells stained with DAPI (Magnification ×175).
DDC feeding induced the formation of tumors, after 8–15 months withdrawal from DDC (Nan et al., 2006; Oliva et al., 2008). DDC induced the expression of tumor markers, such as AFP, UbD, and GSTmu2, and continued to over express UbD proteins after months of withdrawal (Nan et al., 2006; Oliva et al., 2008). There was an increase of two hepatocellular carcinoma markers (AFP and Gankyrin) in the tumors formed after nine months of withdrawal. UbD (Fat10) was still over expressed in these tumors (Oliva et al., 2008). The increase of PCNA positive nuclei in UbD positive cells indicates that UbD positive cells had a growth advantage similar to tumor cells (Qin and Tang, 2002; Roomi et al., 2006). UbD over expression reduces the cell cycle time (Nan et al., 2006), and regulates the cell cycle by interacting with MAD2 (Liu et al., 1999). UbD induces apoptosis in renal cells during HIV infection (Ross et al., 2006; Snyder et al., 2009) and induces apoptosis of the lymphocyte population in knock-out mice (Canaan et al., 2006). UbD can also stimulate cell proliferation in HCT116 cells (Lim et al., 2006). The knowledge of the regulation of the expression of UbD could be used to understand the mechanism of the development of HCC and UbD expression could be used as a preneoplastic marker, in the liver based on the observations reported here.
Acknowledgement
The study was supported by NIH/NIAAA grants 8116 and the Alcohol Center Grant on Liver and Pancreas P50-011999, including the morphology core.
Footnotes
Publisher's Disclaimer: This is a PDF file of an unedited manuscript that has been accepted for publication. As a service to our customers we are providing this early version of the manuscript. The manuscript will undergo copyediting, typesetting, and review of the resulting proof before it is published in its final citable form. Please note that during the production process errors may be discovered which could affect the content, and all legal disclaimers that apply to the journal pertain.
REFERENCES
- Adamkova L, et al. Transcription protein STAT1: biology and relation to cancer. Folia Biol (Praha) 2007;53:1–6. doi: 10.14712/fb2007053010001. [DOI] [PubMed] [Google Scholar]
- Aggarwal BB, Gehlot P. Inflammation and cancer: how friendly is the relationship for cancer patients? Curr Opin Pharmacol. 2009;9:351–369. doi: 10.1016/j.coph.2009.06.020. [DOI] [PMC free article] [PubMed] [Google Scholar]
- Bardag-Gorce F, et al. Epigenetic mechanisms regulate Mallory Denk body formation in the livers of drug-primed mice. Exp Mol Pathol. 2008;84:113–121. doi: 10.1016/j.yexmp.2007.12.004. [DOI] [PMC free article] [PubMed] [Google Scholar]
- Bardag-Gorce F, et al. The mechanism of cytokeratin aggresome formation: the role of mutant ubiquitin (UBB+1) Exp Mol Pathol. 2003;74:160–167. doi: 10.1016/s0014-4800(02)00024-2. [DOI] [PubMed] [Google Scholar]
- Bates EE, et al. Identification and analysis of a novel member of the ubiquitin family expressed in dendritic cells and mature B cells. Eur J Immunol. 1997;27:2471–2477. doi: 10.1002/eji.1830271002. [DOI] [PubMed] [Google Scholar]
- Berasain C, et al. Inflammation and liver cancer: new molecular links. Ann N Y Acad Sci. 2009;1155:206–221. doi: 10.1111/j.1749-6632.2009.03704.x. [DOI] [PubMed] [Google Scholar]
- Canaan A, et al. FAT10/diubiquitin-like protein-deficient mice exhibit minimal phenotypic differences. Mol Cell Biol. 2006;26:5180–5189. doi: 10.1128/MCB.00966-05. [DOI] [PMC free article] [PubMed] [Google Scholar]
- Deb A, et al. RNA-dependent protein kinase PKR is required for activation of NF-kappa B by IFN-gamma in a STAT1-independent pathway. J Immunol. 2001;166:6170–6180. doi: 10.4049/jimmunol.166.10.6170. [DOI] [PubMed] [Google Scholar]
- Dokmanovic M, et al. Retinoid-induced growth arrest of breast carcinoma cells involves co-activation of multiple growth-inhibitory genes. Cancer Biol Ther. 2002;1:24–27. doi: 10.4161/cbt.1.1.35. [DOI] [PubMed] [Google Scholar]
- French BA, et al. Aggresome formation in liver cells in response to different toxic mechanisms: role of the ubiquitin-proteasome pathway and the frameshift mutant of ubiquitin. Exp Mol Pathol. 2001;71:241–246. doi: 10.1006/exmp.2001.2401. [DOI] [PubMed] [Google Scholar]
- French SW. The Mallory body: structure, composition, and pathogenesis. Hepatology. 1981a;1:76–83. doi: 10.1002/hep.1840010113. [DOI] [PubMed] [Google Scholar]
- French SW. Nature, pathogenesis and significance of the Mallory body. Semin Liver Dis. 1981b;1:217–231. doi: 10.1055/s-2008-1041749. [DOI] [PubMed] [Google Scholar]
- Gerber SA, et al. Interferon-gamma induces prolyl hydroxylase (PHD)3 through a STAT1-dependent mechanism in human endothelial cells. Arterioscler Thromb Vasc Biol. 2009;29:1363–1369. doi: 10.1161/ATVBAHA.109.192542. [DOI] [PMC free article] [PubMed] [Google Scholar]
- Gough DJ, et al. A novel c-Jun-dependent signal transduction pathway necessary for the transcriptional activation of interferon gamma response genes. J Biol Chem. 2007;282:938–946. doi: 10.1074/jbc.M607674200. [DOI] [PubMed] [Google Scholar]
- Halfter UM, et al. Interferon-gamma-dependent tyrosine phosphorylation of MEKK4 via Pyk2 is regulated by annexin II and SHP2 in keratinocytes. Biochem J. 2005;388:17–28. doi: 10.1042/BJ20041236. [DOI] [PMC free article] [PubMed] [Google Scholar]
- Heydtmann M, Adams DH. Chemokines in the immunopathogenesis of hepatitis C infection. Hepatology. 2009;49:676–688. doi: 10.1002/hep.22763. [DOI] [PMC free article] [PubMed] [Google Scholar]
- Jensen K, Gluud C. The Mallory body: morphological, clinical and experimental studies (Part 1 of a literature survey) Hepatology. 1994a;20:1061–1077. doi: 10.1002/hep.1840200440. [DOI] [PubMed] [Google Scholar]
- Jensen K, Gluud C. The Mallory body: theories on development and pathological significance (Part 2 of a literature survey) Hepatology. 1994b;20:1330–1342. [PubMed] [Google Scholar]
- Ji F, et al. FAT10 level in human gastric cancer and its relation with mutant p53 level, lymph node metastasis and TNM staging. World J Gastroenterol. 2009;15:2228–2233. doi: 10.3748/wjg.15.2228. [DOI] [PMC free article] [PubMed] [Google Scholar]
- Knolle PA, et al. Regulation of endotoxin-induced IL-6 production in liver sinusoidal endothelial cells and Kupffer cells by IL-10. Clin Exp Immunol. 1997;107:555–561. doi: 10.1046/j.1365-2249.1997.d01-959.x. [DOI] [PMC free article] [PubMed] [Google Scholar]
- Lee CG, et al. Expression of the FAT10 gene is highly upregulated in hepatocellular carcinoma and other gastrointestinal and gynecological cancers. Oncogene. 2003;22:2592–2603. doi: 10.1038/sj.onc.1206337. [DOI] [PubMed] [Google Scholar]
- Levy DE, et al. Interferon-induced nuclear factors that bind a shared promoter element correlate with positive and negative transcriptional control. Genes Dev. 1988;2:383–393. doi: 10.1101/gad.2.4.383. [DOI] [PubMed] [Google Scholar]
- Lim CB, et al. FAT10, a gene up-regulated in various cancers, is cell-cycle regulated. Cell Div. 2006;1:20. doi: 10.1186/1747-1028-1-20. [DOI] [PMC free article] [PubMed] [Google Scholar]
- Liu YC, et al. A MHC-encoded ubiquitin-like protein (FAT10) binds noncovalently to the spindle assembly checkpoint protein MAD2. Proc Natl Acad Sci U S A. 1999;96:4313–4318. doi: 10.1073/pnas.96.8.4313. [DOI] [PMC free article] [PubMed] [Google Scholar]
- Lukasiak S, et al. Proinflammatory cytokines cause FAT10 upregulation in cancers of liver and colon. Oncogene. 2008;27:6068–6074. doi: 10.1038/onc.2008.201. [DOI] [PubMed] [Google Scholar]
- Mandrekar P, Szabo G. Signalling pathways in alcohol-induced liver inflammation. J Hepatol. 2009;50:1258–1266. doi: 10.1016/j.jhep.2009.03.007. [DOI] [PMC free article] [PubMed] [Google Scholar]
- Nakanuma Y, Ohta G. Is mallory body formation a preneoplastic change? A study of 181 cases of liver bearing hepatocellular carcinoma and 82 cases of cirrhosis. Cancer. 1985;55:2400–2404. doi: 10.1002/1097-0142(19850515)55:10<2400::aid-cncr2820551017>3.0.co;2-b. [DOI] [PubMed] [Google Scholar]
- Nan L, et al. Mallory body forming cells express the preneoplastic hepatocyte phenotype. Exp Mol Pathol. 2006;80:109–118. doi: 10.1016/j.yexmp.2005.11.001. [DOI] [PubMed] [Google Scholar]
- Nan L, et al. p62 is involved in the mechanism of Mallory body formation. Exp Mol Pathol. 2004;77:168–175. doi: 10.1016/j.yexmp.2004.06.003. [DOI] [PubMed] [Google Scholar]
- Ohta M, et al. Ubiquitin is present on the cytokeratin intermediate filaments and Mallory bodies of hepatocytes. Lab Invest. 1988;59:848–856. [PubMed] [Google Scholar]
- Oliva J, et al. Fat10 is an epigenetic marker for liver preneoplasia in a drug-primed mouse model of tumorigenesis. Exp Mol Pathol. 2008;84:102–112. doi: 10.1016/j.yexmp.2007.12.003. [DOI] [PMC free article] [PubMed] [Google Scholar]
- Oliva J, et al. Mallory Denk Body Formation is Associated with an Increase of the Immunoproteasome and a Loss of the 26S Proteasome Function. FASEB J. 2009a;23 [Google Scholar]
- Oliva J, et al. Epigenetics of proteasome inhibition in the liver of rats fed ethanol chronically. World J Gastroenterol. 2009b;15:705–712. doi: 10.3748/wjg.15.705. [DOI] [PMC free article] [PubMed] [Google Scholar]
- Osna NA, et al. Interferon gamma enhances proteasome activity in recombinant Hep G2 cells that express cytochrome P4502E1: modulation by ethanol. Biochem Pharmacol. 2003;66:697–710. doi: 10.1016/s0006-2952(03)00252-1. [DOI] [PubMed] [Google Scholar]
- Qin LX, Tang ZY. The prognostic molecular markers in hepatocellular carcinoma. World J Gastroenterol. 2002;8:385–392. doi: 10.3748/wjg.v8.i3.385. [DOI] [PMC free article] [PubMed] [Google Scholar]
- Raasi S, et al. A ubiquitin-like protein which is synergistically inducible by interferon-gamma and tumor necrosis factor-alpha. Eur J Immunol. 1999;29:4030–4036. doi: 10.1002/(SICI)1521-4141(199912)29:12<4030::AID-IMMU4030>3.0.CO;2-Y. [DOI] [PubMed] [Google Scholar]
- Raasi S, et al. The ubiquitin-like protein FAT10 forms covalent conjugates and induces apoptosis. J Biol Chem. 2001;276:35334–35343. doi: 10.1074/jbc.M105139200. [DOI] [PubMed] [Google Scholar]
- Ramsauer K, et al. p38 MAPK enhances STAT1-dependent transcription independently of Ser-727 phosphorylation. Proc Natl Acad Sci U S A. 2002;99:12859–12864. doi: 10.1073/pnas.192264999. [DOI] [PMC free article] [PubMed] [Google Scholar]
- Roomi MW, et al. Preneoplastic liver cell foci expansion induced by thioacetamide toxicity in drug-primed mice. Exp Mol Pathol. 2006;81:8–14. doi: 10.1016/j.yexmp.2006.02.006. [DOI] [PubMed] [Google Scholar]
- Ross MJ, et al. Role of ubiquitin-like protein FAT10 in epithelial apoptosis in renal disease. J Am Soc Nephrol. 2006;17:996–1004. doi: 10.1681/ASN.2005070692. [DOI] [PubMed] [Google Scholar]
- Schutte K, et al. Hepatocellular carcinoma--epidemiological trends and risk factors. Dig Dis. 2009;27:80–92. doi: 10.1159/000218339. [DOI] [PubMed] [Google Scholar]
- Shan W, Liu J. Inflammation: a hidden path to breaking the spell of ovarian cancer. Cell Cycle. 2009;8:3107–3111. doi: 10.4161/cc.8.19.9590. [DOI] [PubMed] [Google Scholar]
- Snyder A, et al. FAT10: a novel mediator of Vpr-induced apoptosis in HIV-associated nephropathy. J Virol. 2009 doi: 10.1128/JVI.00034-09. [DOI] [PMC free article] [PubMed] [Google Scholar]
- Sun D, Ding A. MyD88-mediated stabilization of interferon-gamma-induced cytokine and chemokine mRNA. Nat Immunol. 2006;7:375–381. doi: 10.1038/ni1308. [DOI] [PubMed] [Google Scholar]
- Valledor AF, et al. Selective roles of MAPKs during the macrophage response to IFN-gamma. J Immunol. 2008;180:4523–4529. doi: 10.4049/jimmunol.180.7.4523. [DOI] [PubMed] [Google Scholar]
- Wang H, et al. Inflammation activates the interferon signaling pathways in taste bud cells. J Neurosci. 2007;27:10703–10713. doi: 10.1523/JNEUROSCI.3102-07.2007. [DOI] [PMC free article] [PubMed] [Google Scholar]
- Weihua X, et al. Interferon gamma-induced transcription of the murine ISGF3gamma (p48) gene is mediated by novel factors. Proc Natl Acad Sci U S A. 1997;94:103–108. doi: 10.1073/pnas.94.1.103. [DOI] [PMC free article] [PubMed] [Google Scholar]
- Wesemann DR, Benveniste EN. STAT-1 alpha and IFN-gamma as modulators of TNF-alpha signaling in macrophages: regulation and functional implications of the TNF receptor 1:STAT-1 alpha complex. J Immunol. 2003;171:5313–5319. doi: 10.4049/jimmunol.171.10.5313. [DOI] [PubMed] [Google Scholar]
- Wu Y, Zhou BP. Inflammation: a driving force speeds cancer metastasis. Cell Cycle. 2009;8:3267–3273. doi: 10.4161/cc.8.20.9699. [DOI] [PMC free article] [PubMed] [Google Scholar]
- Yu H, et al. STATs in cancer inflammation and immunity: a leading role for STAT3. Nat Rev Cancer. 2009;9:798–809. doi: 10.1038/nrc2734. [DOI] [PMC free article] [PubMed] [Google Scholar]
- Yuan QX, et al. Mallory body induction in drug-primed mouse liver. Hepatology. 1996;24:603–612. doi: 10.1002/hep.510240324. [DOI] [PubMed] [Google Scholar]
- Zatloukal K, et al. From Mallory to Mallory-Denk bodies: what, how and why? Exp Cell Res. 2007;313:2033–2049. doi: 10.1016/j.yexcr.2007.04.024. [DOI] [PubMed] [Google Scholar]
- Zhang DW, et al. p53 negatively regulates the expression of FAT10, a gene upregulated in various cancers. Oncogene. 2006;25:2318–2327. doi: 10.1038/sj.onc.1209220. [DOI] [PubMed] [Google Scholar]


