Abstract
Light scattering phenomena in periodic systems have been investigated for decades in optics and photonics. Their classical description relies on Bragg scattering, which gives rise to constructive interference at specific wavelengths along well defined propagation directions, depending on illumination conditions, structural periodicity, and the refractive index of the surrounding medium. In this paper, by engineering multifrequency colorimetric responses in deterministic aperiodic arrays of nanoparticles, we demonstrate significantly enhanced sensitivity to the presence of a single protein monolayer. These structures, which can be readily fabricated by conventional Electron Beam Lithography, sustain highly complex structural resonances that enable a unique optical sensing approach beyond the traditional Bragg scattering with periodic structures. By combining conventional dark-field scattering micro-spectroscopy and simple image correlation analysis, we experimentally demonstrate that deterministic aperiodic surfaces with engineered structural color are capable of detecting, in the visible spectral range, protein layers with thickness of a few tens of Angstroms.
Keywords: biosensing, colorimetric fingerprint, deterministic aperiodic system, nanophotonics
In current biosensing technology, two-dimensional periodic lattices, (i.e., two-dimensional optical gratings) provide a well established approach for biochemical colorimetric detection, which can yield label-free sensing of various molecular analytes and protein dynamics (1–7). Standard periodic grating biosensors provide a distinct change either in the intensity of diffracted light or in the frequency of optical resonances in response to changes in the refractive index of the surrounding environment (8).
The physical mechanism at the base of these optical signatures is the well known phenomenon of Bragg scattering. While this process provides frequency selective responses that are useful for colorimetric detection, the ability of light waves to interact with adsorbed or chemically bound analytes present on the surface of these sensors is intrinsically limited. In fact, Bragg scattering is a first-order process in surface scattering perturbation theory (9, 10), and scattered photons easily escape from a periodic surface within well defined spectral bands and without prolonged interaction with the sensing layer. In this paper, we present an approach to overcome this fundamental limitation by developing a label-free biosensing approach based on micro-spectroscopy and spatial correlation imaging (11) of structural color patterns obtained by white light scattering from two-dimensional nanoscale deterministic aperiodic structures.
The proposed concept relies on the specific optical properties of deterministic aperiodic photonic surfaces, which lack translational invariance symmetry (they are nonperiodic) and are generated by simple constructive rules (12, 13). Such structures, which can be fabricated using conventional lithographic techniques, are an intermediate regime between periodic and disordered systems, yet are engineered according to mathematical rules amenable to predictive theories. In contrast to traditional photonic gratings or photonic crystals sensors (which efficiently trap light in small-volume defect states), aperiodic scattering sensors sustain distinctive resonances localized over larger surface areas. In particular, nanoscale aperiodic structures possess a dense spectrum of highly complex structural resonances, called critical modes, which result in efficient photon trapping and surface interactions through higher-order multiple scattering processes thereby enhancing the sensitivity to refractive index changes (14, 15). The complex spatial patterns of critical modes in these structures offer the potential to engineer structural color sensing with spatially localized patterns at multiple wavelengths, which we call colorimetric fingerprints.
Here we propose to utilize critical mode patterns as surface sensing elements with sensitivity to protein monolayer morphological changes. The proposed approach is intrinsically more sensitive to local refractive index modifications compared to traditional ones (14) due to the enhancement of small phase variations, which is typical in the multiple light-scattering regime (9, 10). By combining Electron Beam Lithography (EBL), dark-field scattering micro-spectroscopy, and rigorous calculations based on the Generalized Mie Theory (GMT) (16), we explain the origin of structural color localization in aperiodic arrays of Chromium (Cr) nanoparticles on quartz substrates and demonstrate their potential for the detection of protein monolayers. In addition, we show that the complex spatial patterns of critical modes in nanostructured aperiodic surfaces are ideally suited for image correlation analysis in the visible spectral range, providing a transduction mechanism with large dynamic range, sensitivity and multiplexing capabilities where the information encoded in both spectral and spatial distributions of structural colors can be simultaneously utilized. The potential of the proposed approach for rapid, label-free detection of biomolecular analytes performed in the visible spectral range using a commercially available microscope is experimentally demonstrated by showing a distinct variation in the spectral and spatial colorimetric fingerprints in response to monolayer increments of protein layers sequentially deposited on the surface of aperiodic arrays of nanoparticles.
Results and Discussion
Colorimetric Fingerprints of Periodic and Aperiodic Gratings.
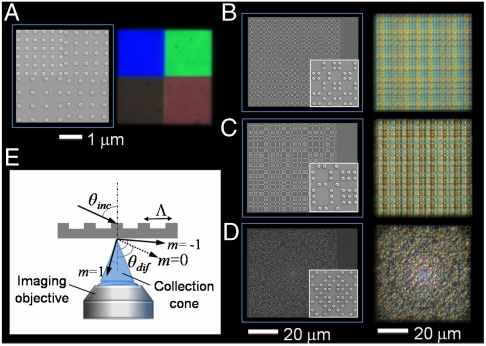
Before discussing light scattering from aperiodic nanopatterned surfaces, we will briefly review the colorimetric response of periodic arrays of Cr nanoparticles deposited on quartz substrates. Two-dimensional periodic gratings of 100 nm-radius and 40 nm-tall Cr nanodisks (shown in Fig. S1) of varying lattice constants were fabricated on quartz substrates using EBL (detailed in Materials and Methods) and the scanning electron micrographs of representative grating structures are shown in Fig. 1A. The arrays are illuminated by an incoherent white light source at a grazing angle incidence (θinc = 75 degrees) to the array surface using the dark-field scattering setup sketched in Fig. 1E, and a microscope objective lens is used to collect the scattered radiation normal to the array plane (detailed in Materials and Methods). Increasing the grating period results in a progressive red-shift of the colorimetric responses (scattered wavelengths), as shown by the experimental data in Fig. 1A. These colorimetric responses of periodic gratings can adequately be described by the classical Bragg formula:
 |
[1] |
where Λ is the lattice constant, λ is the wavelengths of the incident light, θinc and θdif are the incident and the diffracted angles (measured with respect to the normal to the grating surface), m is the order of diffraction and n1 and n2 are the refractive indices of the grating and of the surrounding medium, respectively. The calculated colorimetric responses corresponding to different lattice constants (500 nm–800 nm) vary as a function of the diffraction angle. In addition, the spectral response is determined by the finite angular collection efficiency of the imaging lens as depicted in Fig. 1E by the blue area. The distinctive wavelength shift of the radiation scattered by periodic gratings perturbed by the presence of specific analytes has been traditionally utilized as a transduction signal in colorimetric optical sensing (3–7).
Fig. 1.
Colorimetric fingerprints of periodic and aperiodic gratings. (A–D) SEM images of two-dimensional periodic and aperiodic arrays of 100 nm-radius and 40 nm-high cylindrical Cr nanoparticles on a quartz substrate and the associated dark-field images were illuminated at a grazing incidence with white light. The structural color patterns of the images vary by the N.A. of the imaging objective, in which different diffractive order is included into the collection cone. The periodic arrays in (A) were observed under 10× objective with an 1 mm iris of N.A. reduced to 0.1 and the aperiodic arrays in (B) Thue-Morse lattice (nearest center-to-center separation Λ = 400 nm); (C) Rudin-Shapiro lattice (Λ = 400 nm); (D) Gaussian prime lattice (Λ = 300 nm), were observed under 50× objective with N.A. 0.5. The structural color patterns also vary by increasing the grating period with a progressive red-shift of the scattered wavelengths in (A) (clockwise from top-left) (E) A schematic of the dark-field scattering setup used in the measurements.
Unlike periodic grating structures, the scattering response of aperiodic nanopatterned surfaces features highly complex colorimetric fingerprints, as demonstrated in Fig. 1 B–D. We focus here on three main types of deterministic aperiodic structures with varying degree of structural disorder. Specifically, we focus on Thue-Morse (12–15, 17) (Fig. 1B), Rudin-Shapiro (12–15, 18) (Fig. 1C), and Gaussian prime (19) (Fig. 1D) arrays of Cr nanoparticles with minimum center-to-center separation of 300 nm and 400 nm. The spatial complexity of these aperiodic structures is described by the spectral character of their spatial Fourier spectra, which in contrast to simple periodic structures, densely fills the reciprocal space with distinctive fractal properties (19–22). In particular, Gaussian prime lattices feature nonperiodic Fourier spectra with well defined reciprocal lattice vectors (Bragg-peaks) (19), while the more complex Thue-Morse and Rudin-Shapiro structures display singular continuous and absolutely continuous Fourier spectra (12–15, 17, 18), respectively. All these aperiodic surfaces possess a large number of spatial frequencies, which can assist higher-order in-plane scattering processes and excite the critical resonances of the systems.
When these structures are illuminated by a white light source, they give rise to highly organized structural color patterns as shown in Fig. 1. (Additional patterns obtained from different deterministic aperiodic arrays are shown in Fig. S2). In the next section, the origin of the experimentally observed colorimetric fingerprints is explained using rigorous multiple scattering theory on model structures in three spatial dimensions.
Structural Color Formation in Aperiodic Structures.
It is well known that aperiodic systems possess a dense spectrum of critical modes, featuring unique fractal scaling and spatial localization character with traits intermediate between Anderson and Bloch modes (15, 20, 21). When these modes are excited, photons can be efficiently trapped on the surface of aperiodic systems enabling enhanced surface interactions in comparison to what can be achieved using traditional optical modes (14).
The origin of the experimentally observed colorimetric fingerprints of aperiodic arrays of subwavelength particles was analyzed by performing three dimensional light-scattering simulations on model structures consisting of Cr nanospheres arranged in periodic and aperiodic two-dimensional lattices. These structures are illuminated by a plane wave incident at a grazing angle (θinc = 75 degrees- consistent with our experimental conditions) to the array plane. The far-field scattering characteristics and intensity distribution in the array plane of the scattered electric field have been calculated using the rigorous GMT approach (16, 23) (further details on the GMT method appear in the SI Text).
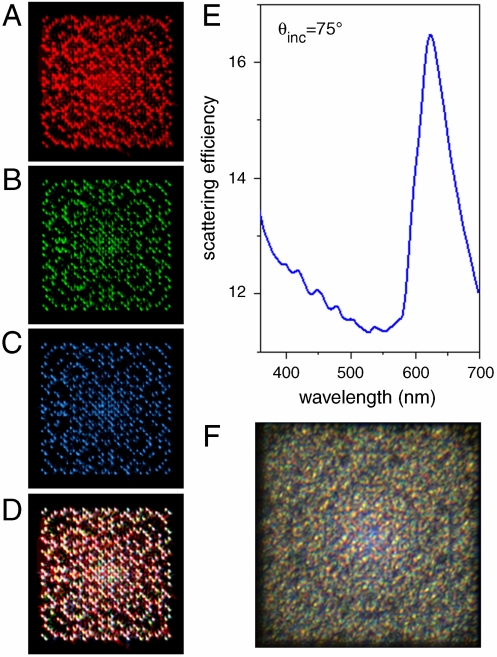
The formation of this distinctive multispectral response is illustrated in Fig. 2 A–D for the case of Gaussian prime arrays. The calculated scattering spectrum of the Gaussian prime array (Fig. 2E) illuminated by a plane wave reveals variations of the array scattering efficiency (the ratio of the scattering cross section to the total volume of the particles (13)) as a function of the wavelength. Furthermore, the calculated scattered intensity pattern in the plane of the array features different spatial distributions of critical modes corresponding to different wavelengths (Fig. 2 A–C). When the colorimetric patterns of the Red-Green-Blue (RGB) principal chromatic components (wavelengths 630 nm, 520 nm, and 470 nm) are mixed together in the array plane (Fig. 2D), a complex structural color pattern (colorimetric fingerprint) is formed in qualitative agreement with the experimentally measured data, shown in Fig. 2F, collected under white light illumination.
Fig. 2.
Colorimetric color formation in aperiodic arrays. Calculated spatial field distributions (top view) of the scattered light in the plane of a Gaussian prime array of 100 nm-radius Cr nanospheres with 300 nm nearest center-to-center separation at (A) Λ = 630 nm (red), (B) Λ = 520 nm (green), (C) Λ = 470 nm (blue), and (D) a combined RGB image (the images are overlapped with weighted amplitudes to properly represent their spectral contributions). (D) Calculated scattering spectrum of the array illuminated by a plane wave at 75 degrees to normal. (F) The corresponding measured image of the Gaussian prime nanoparticle array illuminated at a grazing incidence with white light.
The formation of this complex pattern illustrates the possibility of spatial localization of individual frequency components on the nanostructured surface. Due to the aperiodicity of the structure, the incoming radiation field intensity is redistributed, at each given frequency, into a multitude of spatial directions. The superposition of the scattered fields associated to the modes of individual spectral components gives rise to spatial colorimetric patterns determined by the surface geometry—a multispectral fingerprint.
The formation of multispectral fingerprints with structural color localization in deterministic aperiodic nanostructures provides a unique mechanism to engineer optical devices where both the spectral and the spatial information encoded in the scattered fields can be retrieved for sensitive optical detection beyond Bragg scattering.
Sensitivity of Aperiodic Structures to Protein Monolayers.
The complex, information-rich colorimetric fingerprints of aperiodic nanopatterned surfaces can be used as transduction signals to engineer highly sensitive label-free scattering sensors. To demonstrate the potential of the proposed approach we have experimentally examined the colorimetric fingerprints of aperiodic nanopatterned structures in response to the deposition of protein (silk fibroin) monolayers on the surface of our samples (24). Silk fibroin has garnered much attention recently because of its mechanical, optical, and biocompatible properties (24). We chose silk as a model system for studying monolayers on photonic lattices because of its ability to make highly uniform layers of controllable thicknesses ranging from 2 nm to several microns. Silk fibroin was recently used as a model system in a study detailing ultrasensitive detection of protein monolayers using plasmonic nanoantennae arrays in the near-infrared spectral range (25). (See Methods and Materials for more information on the preparation and characterization of the silk monolayers)
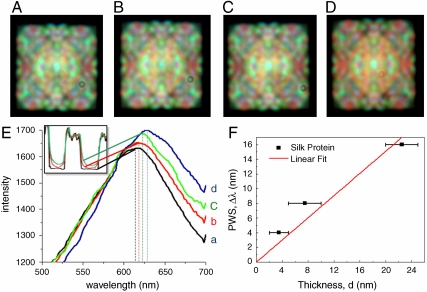
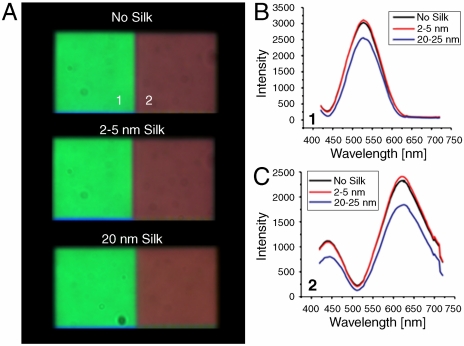
We compared the sensitivity of colorimetric fingerprints formed on various aperiodic nanopatterned surfaces to the variations in the ambient refractive index by using the GMT simulations (see Figs. S3 and S4). Our simulations revealed high sensitivity of the fingerprints of Gaussian prime and Rudin-Shapiro arrays to environmental changes, consistently with the general principles of linear response theory applied to rough surface scattering (see more details in SI Text). In the present paper, we focus our analysis on the Gaussian prime array, which strongly scatters radiation in the visible spectral range (see Fig. S3). Distinctive changes induced by the presence of the protein layers with thicknesses varying in few monolayer increments in both colorimetric fingerprint and scattering spectrum of the Gaussian prime array are experimentally demonstrated in Fig. 3. The shift of the scattering spectrum measured in the presence of protein layers (Fig. 3E) is quantified by estimating the slope of the Peak Wavelength Shift (PWS) plotted versus the thickness of the protein layer. A linear fit of the experimental data shown in Fig. 3F demonstrates device sensitivity of approximately 1.5 nm per protein monolayer (∼20 Angstroms). This value is comparable to that presently reported for photonic crystal structures and surface plasmon biosensors (5, 25, 26). The smallest detection volume of silk protein is estimated as A(t)(D/M), where A is the total surface area of the Gaussian prime nanopatterned array (48.2 × 48.2 μm2), t is the film thickness (2 nm), D is the density of the protein (1.4 g/cm3) (27), and M is the molecular mass of the protein (375 kDa) (28). About 17 atto-mole of protein molecules is estimated in our experiment contributing to the distinctive shift of the spectral peak and the colorimetric pattern change. We note that this detection limit can be improved by minimizing the size of the nanopatterned surface. It is important to note that no protein detection can be observed in the 2–5 nm thickness range when using periodic gratings with Bragg scattering efficiency optimized in the same spectral region as the Gaussian prime arrays. As shown in Fig. 4, periodic grating sensors excited in the same experimental geometry do not reveal any spectral shift in response to the deposition of 2–5 nm thick protein layers on the surface of the samples. A small colorimetric response is detected when 20 nm thick layers are deposited on the periodic gratings, corresponding to a small shift in the peak of their scattering spectra (Fig. 4C). Enhanced sensitivities using periodic gratings can only be achieved by measuring enhanced backscattering intensities or by introducing structural defects to form photonic crystal cavities at specific wavelengths (3, 5).
Fig. 3.
Colorimetric response as a function of monolayer deposition. Multispectral dark-field images of Gaussian prime lattice (Λ = 300 nm) coated with different thicknesses of silk protein monolayers (A) 0 nm (no) silk, (B) 2 nm silk, (C) 5 nm silk, and (D) 20 nm silk under white light illumination. (E) Coating of different thicknesses of silk protein monolayers were characterized by AFM (insert) and the colorimetric responses of the associated arrays were measured spectrally. (F) The sensitivity of the arrays is quantified by the spectral shift of the scattered radiation peaks PWS per thickness variation of the protein layer.
Fig. 4.
Colorimetric response of periodic gratings as a function of monolayer deposition. (A) shows the dark-field images of periodic gratings with no silk, 2 nm of silk, and 20 nm of silk (from top to bottom). (B, C) show the scattering spectral responses of the gratings, with lattice constant of (1) 600 nm, and (2) 700 nm correspondingly, coated with different thicknesses of silk protein monolayers. No protein detection can be observed in the 2–5 nm thickness range, while a small shift in the spectral peak is observed when 20 nm thick layers are deposited on the 700 nm grating (C).
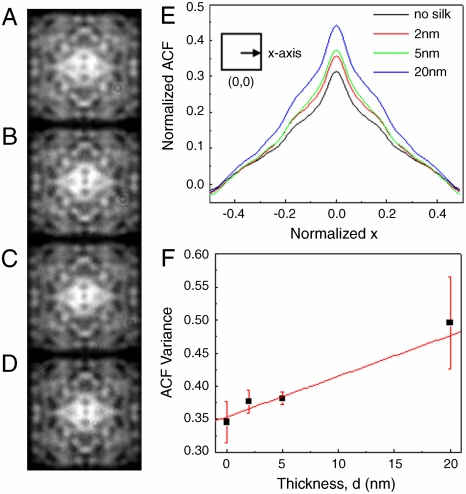
On the other hand, aperiodic surfaces with engineered colorimetric fingerprints additionally offer the possibility to detect protein monolayers by observing, with conventional dark-field microscopy, distinctive structural modifications of the spatial distribution of the individual spectral components of the scattered radiation field, as demonstrated in Fig. 5 A–D in the case of silk nanolayers. This detection mechanism takes advantage of the fingerprinting structural resonances perturbed by the presence of nanoscale protein layers. Therefore, in the case of aperiodic structures, both the peak wavelength shift of the scattered radiation as well as the spatial structure of their distinctive colorimetric fingerprints can be utilized in order to detect the presence of nanoscale protein layers. The spatial modifications of the structural color fingerprints of aperiodic surfaces can be readily quantified by image autocorrelation analysis performed on the radiation intensity scattered by the bare surface and by the silk coated surface (29, 30). The two-dimensional image autocorrelation function (ACF) of a colorimetric fingerprint G(ξ,η) can be obtained directly from the scattering data by proper normalization as (detailed in the SI Text):
 |
[2] |
where s(x,y) is the fluctuating spatial signal and the angle brackets 〈〉, indicate averaging (integration) over the spatial domain. Once the normalized ACF of the structural color fingerprints of the aperiodic surfaces obtained from the bare and the silk coated surfaces has been calculated, the spatial modification of the fingerprints can be quantified by comparing their variances, which can be readily obtained by evaluating the normalization of the ACF in the limit of zero lateral displacements (29, 30):
 |
[3] |
It is important to note that this analysis, which is performed on the principal RGB spectral components of the scattered radiation, can unveil significant structural color modifications associated to the refractive index perturbation of aperiodic systems. In this work, we have demonstrated this effect by performing the autocorrelation analysis at the peak wavelength (622 nm) of the scattered spectrum of a Gaussian prime surface. The data shown in Fig. 5 E, F summarize our findings. In Fig. 5E we plot the one-dimensional ACF profiles extracted from the two-dimensional intensity autocorrelation functions for different thicknesses of the protein layer. The initial decay in the ACF reflects local short-range correlations in the aperiodic structure, while long-range correlations in the intensity pattern give rise to periodic oscillations in the ACF (30). The change in the structural color patterns (at any given wavelength of interest) induced by the presence of thin protein layers can be made quantitative by computing the variance of the scattered field intensity fluctuations. The experimental results in Fig. 5 indicate a substantial change in both the normalized ACF variance of perturbed colorimetric fingerprints and its complex spatial structure encoded in the ACF oscillatory behavior (which reflects the long-range oscillations). These data fully demonstrate the possibility of protein monolayer detection, in the visible spectral range, using conventional dark-field microscopy of aperiodic arrays of nanoparticles.
Fig. 5.
Autocorrelation analysis of structural pattern changes. Dark-field images corresponding to one spectral color (622 nm) of Gaussian prime lattice (Λ = 300 nm) with different thicknesses of silk protein monolayers of (A) 0 nm (no) silk, (B) 2 nm silk, (C) 5 nm silk, and (D) 20 nm silk under white light illumination were analyzed through (E) one-dimensional ACF profiles extracted from two-dimensional normalized autocorrelation function along the x-axis of the middle of the images. (F) The changes of patterns due to different thicknesses of silk protein monolayers are quantified by the normalized ACF variances.
Conclusions
In summary, by using frequency-resolved spatial analysis of colorimetric fingerprints in nanopatterned surfaces with deterministic aperiodic order we have demonstrated the ability to discriminate spectrally and spatially, in the visible spectral range, nanoscale surface variations down to the single (20 Angstrom) protein monolayer. The sensitivity levels are comparable to photonic crystals and surface plasmon biosensors making this a compelling alternative to these methods. Furthermore, the proposed detection scheme does not require dedicated setups and makes use of the conventional dark-field microscopy and standard image correlation analysis. The approach presented here introduces the general concept of multiplexed, label-free detection based on engineered colorimetric fingerprints in deterministic aperiodic structures.
These results, which can also be consistently obtained using other types of aperiodic surfaces, pave the way to the inexpensive, real-time sensing of protein monolayers in the visible spectral range using conventional microscopy techniques.
Materials and Methods
Gratings Fabrication.
Periodic and aperiodic nanoparticle arrays were fabricated using EBL on quartz substrates. The fabrication process flow is as follows: 180 nm of PMMA 950 (Poly Methyl Meth Acrylate) were spin-coated on top of quartz substrates, and the substrates were soft-baked on a hot plate at 180 °C for 90 sec. 10 nm-thin continuous gold film was then sputtered on top of the resist to facilitate electron conduction for EBL writing. The nanopatterns were defined using a Zeiss SUPRA 40 VP SEM equipped with Raith beam blanker and Nanometer Pattern Generation System (NPGS) for nanopatterning. The resist was subsequently developed and a 40nm Cr thin film was deposited by e-beam evaporation. After lifting-off using acetone solution, the arrays with Cr nanoparticles were obtained. The resulting features of nanopatterned arrays are shown in Fig. S1 and are approximately 40 nm in height with radii of 100 nm, as measured by atomic force microscopy (AFM).
Dark-Field Scattering Setup and Image Acquisition.
Fig. 1 B–D and Fig. 2F were collected in dark field under white light illumination using a backscattering microscope setup with a 50× objective (N.A. = 0.5) and a CCD digital camera (Media Cybernetics Evolution VF). The incident angle of the illumination was approximately 15° to the array plane, as shown in the Fig. 1E. Dark-field images and wavelength spectra were also measured in a transmission configuration using a dark-field condenser with N.A. 0.8–0.92. The transmitted light was collected with a 10× objective through a 1 mm iris (decreasing the N.A. ∼ 0.1) and spectral images were obtained using a hyperspectreal CCD (CRi Nuance FX) camera coupled to an Olympus IX71 microscope (Fig. 3, Fig. 4, Fig. 5).
Silk Solution Preparation and Thin Film Deposition.
The silk solution was obtained by boiling Bombyx mori cocoons for 30 min in an aqueous solution of 0.02 M Na2CO3, then rinsed thoroughly with water to extract the glue-like sericin proteins, using methods we have previously reported. The solution was then dissolved in 9.3 M LiBr solution at room temperature, yielding a 20 wt % solution. This solution was dialyzed in water using a dialysis cassette with a molecular cutoff weight of 3,500 Da for 48 h. The silk fibroin solutions were poured onto nanopatterned quartz substrates and set to air dry in a laminar flow hood. The films were then left to dry for 24 or 48 h until all the solvent had evaporated to give solid fibroin protein silk films.
Supplementary Material
Acknowledgments.
The authors thank Prof. Daniel W. Mackowski for making his Fortran codes publicly available. This material is based upon work supported in part by the U.S. Army Research Laboratory and the U.S. Army Research Office under Contract number W911 NF-07-1-0618 and by the Defense Advanced Research Planning Agency-Defense Sciences Office (DARPA-DSO), the Air Force program Deterministic Aperiodic Structures for on-chip nanophotonic and nanoplasmonic device applications under the Award FA9550-10-1-0019.
Footnotes
The authors declare no conflict of interest.
This article is a PNAS Direct Submission.
This article contains supporting information online at www.pnas.org/lookup/suppl/doi:10.1073/pnas.1002849107/-/DCSupplemental.
References
- 1.Groisman A, et al. Optofluidic 1 × 4 switch. Opt Express. 2008;16:13499–13508. doi: 10.1364/oe.16.013499. [DOI] [PubMed] [Google Scholar]
- 2.Peng S, Morris GM. Experimental demonstration of resonant anomalies in diffraction from two-dimensional gratings. Opt Lett. 1996;21:549–511. doi: 10.1364/ol.21.000549. [DOI] [PubMed] [Google Scholar]
- 3.Cunningham B, Li P, Lin B, Pepper J. Colorimetric resonant reflection as a direct biochemical assay technique. Sensors Actuat B-Chem. 2002;81:316–328. [Google Scholar]
- 4.Lin B, et al. A label-free optical technique for detecting small molecule interactions. Biosens Bioelectron. 2002;17:827–834. doi: 10.1016/s0956-5663(02)00077-5. [DOI] [PubMed] [Google Scholar]
- 5.Lee MR, Fauchet PM. Two-dimensional silicon photonic crystal based biosensing platform for protein detection. Opt Express. 2007;15:4530–4535. doi: 10.1364/oe.15.004530. [DOI] [PubMed] [Google Scholar]
- 6.Xiao S, Mortensen NA. Highly dispersive photonic band-gap-edge optofluidic biosensors. J Euro Opt Soc. 2006;1:06026. [Google Scholar]
- 7.Morhard F, et al. Optical diffraction-a new concept for rapid online detection of chemical and biochemical analytes. Proc Electrochem Soc. 1997;97–19:1058–1065. [Google Scholar]
- 8.Amsden J, et al. Spectral analysis of induced color change on periodically nanopatterned silk films. Opt Express. 2009;17:21271–21279. doi: 10.1364/OE.17.021271. [DOI] [PubMed] [Google Scholar]
- 9.Tsang L, Kong JA, Ding K. Scattering of electromagnetic waves. 1–3. New York: John Wiley & Sons Inc; 2000. [Google Scholar]
- 10.Maradudin AA. Light scattering and nanoscale surface roughness. New York: Springer; 2007. [Google Scholar]
- 11.Petersen NO, Höddelius PL, Wiseman PW, Seger O, Magnusson KE. Quantification of membrane receptor distributions by image correlation spectroscopy: concept and application. Biophys J. 1993;65:1135–1146. doi: 10.1016/S0006-3495(93)81173-1. [DOI] [PMC free article] [PubMed] [Google Scholar]
- 12.Dal Negro L, Feng NN, Gopinath A. Electromagnetic coupling and plasmon localization in deterministic aperiodic arrays. J Opt A: Pure Appl Opt. 2008;10:064013. [Google Scholar]
- 13.Gopinath A, Boriskina SV, Feng NN, Reinhard BM, Dal Negro L. Photonic-plasmonic scattering resonances in deterministic aperiodic structures. Nano Lett. 2008;8:2423–2431. doi: 10.1021/nl8013692. [DOI] [PubMed] [Google Scholar]
- 14.Boriskina SV, Dal Negro L. Sensitive label-free biosensing using critical modes in aperiodic photonic structures. Opt Express. 2008;16:12511–12522. doi: 10.1364/oe.16.012511. [DOI] [PubMed] [Google Scholar]
- 15.Boriskina SV, Gopinath A, Dal Negro L. Optical gap formation and localization properties of optical modes in deterministic aperiodic photonic structures. Opt Express. 2008;16:18813–18826. doi: 10.1364/oe.16.018813. [DOI] [PubMed] [Google Scholar]
- 16.Mackowski DW. Calculation of total cross sections of multiple-sphere clusters. J Opt Soc Am A. 1994;11:2851–2861. [Google Scholar]
- 17.Moretti L, Mocella V. Two-dimensional photonic aperiodic crystals based on Thue-Morse sequence. Opt Express. 2007;15:15314–15323. doi: 10.1364/oe.15.015314. [DOI] [PubMed] [Google Scholar]
- 18.Dulea M, Johansson M, Riklund R. Localization of electrons and electromagnetic waves in a deterministic aperiodic system. Phys Rev B. 1992;45:105–114. doi: 10.1103/physrevb.45.105. [DOI] [PubMed] [Google Scholar]
- 19.Schroeder MR. Number theory in science and communication. New York: Springer-Verlag; 1985. [Google Scholar]
- 20.Janot C. Quasicrystals: a Primer. New York: Oxford University Press; 1997. [Google Scholar]
- 21.Ryu CS, Oh GY, Lee MH. Extended and critical wave functions in a Thue-Morse chain. Phys Rev B. 1992;46:5162–5168. doi: 10.1103/physrevb.46.5162. [DOI] [PubMed] [Google Scholar]
- 22.Macia E. Physical nature of critical modes in Fibonacci quasicrystals. Phys Rev B. 1999;60:10032–10036. [Google Scholar]
- 23.Palik ED. Handbook of optical constants of solids. London: Academic Press; 1998. [Google Scholar]
- 24.Omenetto FG, Kaplan DL. A new route for silk. Nat Photonics. 2008;2:641–643. [Google Scholar]
- 25.Adato R, et al. Ultra-sensitive vibrational spectroscopy of protein monolayers with plasmonic nanoantenna arrays. Proc Natl Acad Sci USA. 2009;106:19227–19232. doi: 10.1073/pnas.0907459106. [DOI] [PMC free article] [PubMed] [Google Scholar]
- 26.Willets KA, Van Duyne RP. Localized surface plasmon resonance spectroscopy and sensing. Annu Rev Phys Chem. 2007;58:267–297. doi: 10.1146/annurev.physchem.58.032806.104607. [DOI] [PubMed] [Google Scholar]
- 27.Warwicker JO. The crystal structure of silk fibroin. Acta Crystallogr. 1954;7:565–571. [Google Scholar]
- 28.Sashina ES, Bocheck AM, Novoselov NP, Kirichenko DA. Russ J Appl Chem+ 2006;79:869–876. [Google Scholar]
- 29.Wiseman PW, Petersen NO. Image correlation spectroscopy II. optimization for ultrasensitive detection of preexisting platelet-derived growth factor-beta receptor oligomers on intact cells. Biophys J. 1999;76:963–977. doi: 10.1016/S0006-3495(99)77260-7. [DOI] [PMC free article] [PubMed] [Google Scholar]
- 30.Bliznyuk VN, Burlakov VM, Assender HE, Briggs GAD, Tsukahara Y. Surface structure of amorphous PMMA from SPM: auto-correlation function and fractal analysis. Macromolecular Symposia. 2001;167:89–100. [Google Scholar]
Associated Data
This section collects any data citations, data availability statements, or supplementary materials included in this article.


