

Abstract
The sensitivity of receptor cells places a fundamental limit upon the sensitivity of sensory systems. For example, the signal-to-noise ratio of sensory receptors has been suggested to limit absolute thresholds in the visual and auditory systems. However, the necessity of optimally processing sensory receptor signals for behaviour to approach this limit has received less attention. We investigated the behavioural consequences of increasing the signal-to-noise ratio of the rod photoreceptor single-photon response in a transgenic mouse, the GCAPs−/− knockout. The loss of fast Ca2+ feedback to cGMP synthesis in phototransduction for GCAPs−/− mice increases the magnitude of the rod single-photon response and dark noise, with the increase in size of the single-photon response outweighing the increase in noise. Surprisingly, despite the increased rod signal-to-noise ratio, behavioural performance for GCAPs−/− mice was diminished near absolute visual threshold. We demonstrate in electrophysiological recordings that the diminished performance compared to wild-type mice is explained by poorly tuned postsynaptic processing of the rod single-photon response at the rod bipolar cell. In particular, the level of postsynaptic saturation in GCAPs−/− rod bipolar cells is not sufficient to eliminate rod noise, and degrades the single-photon response signal-to-noise ratio. Thus, it is critical for retinal processing to be optimally tuned near absolute threshold; otherwise the visual system fails to utilize fully the signals present in the rods.
Introduction
The signal and noise of sensory receptors set a fundamental limit to sensation, but subsequent neural circuits must optimally process these signals for sensory systems to reach this limit. The exquisite sensitivity of sensory receptors has often been highlighted (Hudspeth & Corey, 1977; Baylor et al. 1979; Bhandawat et al. 2005) and has been proposed as limiting behavioural performance (Barlow, 1956; see also Bialek, 1987). However, the necessity of precisely tuning post-receptor processing within a neural circuit to match the signal-to-noise ratio (SNR) of the sensory receptors, and the behavioural consequences of failing to do so, has received substantially less attention. Furthermore, it remains unclear whether the biophysical mechanisms that underlie the circuit processing of sensory receptor signals can be tuned to alterations in the SNR of the receptors, and what impact this may have on behavioural detection thresholds.
Near the absolute threshold of vision, humans are capable of identifying a few photon absorptions among thousands of rod photoreceptors (Hecht et al. 1942; van der Velden, 1946; Teich et al. 1982). Thus, the detection of light involves discriminating single-photon responses in a handful of rods from a substantial amount of noise generated by the vast majority of rods which are not absorbing photons (reviewed by Field et al. 2005). Non-linear summation of rod signals has been proposed to be necessary for eliminating the noise produced by rods not absorbing photons, thereby improving the SNR of the single-photon response in downstream cells compared to linear summation (Baylor et al. 1984; van Rossum & Smith, 1998; Field & Rieke, 2002b). Indeed, an optimally positioned non-linear threshold is present at the rod-to-rod bipolar cell synapse (Field & Rieke, 2002b) and it is produced by postsynaptic saturation in the mGluR6 signalling cascade in the rod bipolar cell (Sampath & Rieke, 2004). However, outstanding questions remain about how this optimal processing is tuned and its implications for behavioural detection: (1) can the position of the non-linear threshold, or extent of postsynaptic saturation, adjust to separate optimally the rod signal and noise as their distributions change; and (2) what are the behavioural consequences if the downstream processing of rod signals are not set optimally to the single-photon response SNR?
Here we show that increasing the SNR of single-photon responses in rod photoreceptors does not necessarily result in improved behavioural performance. Rather that downstream processing of the rod responses must also be altered to process efficiently the rod signals and reject rod noise. We studied the properties of the single-photon response and noise in rods and rod bipolar cells of GCAPs−/− mice (generated from the targeted deletion of guanylyl cyclase activating proteins 1 and 2), which display a higher SNR of the rod single-photon response than WT mice. Despite this higher SNR, we found that behavioural performance in GCAPs−/− mice deteriorated. Correspondingly, the rod bipolar cells of GCAPs−/− mice exhibited a lower SNR than those of wild-type (WT) mice despite the higher rod photoreceptor SNR. A poorly positioned non-linear threshold at the synapse between rods and rod bipolar cells could explain the diminished rod bipolar cell SNR and elevated behavioural threshold in the GCAPs−/− mice. Therefore, the extent of postsynaptic saturation did not adjust to the altered distributions of signal and noise in GCAPs−/− rods, and resulted in a diminished SNR in the neural circuitry processing rod single-photon responses. Futhermore, these results demonstrate that optimal processing of sensory signals is critical to capture fully the signals present in the sensory receptor cells near absolute threshold.
Methods
GCAPs−/− mice
GCAPs−/− mice, generated from the targeted deletion of guanylyl cyclase activating proteins (GCAPs) 1 and 2, have previously been used to study the properties of Ca2+ feedback on the synthesis of cGMP in the vertebrate rod phototransduction cascade, and their photocurrents have been characterized extensively (Mendez et al. 2001; Burns et al. 2002). Briefly, GCAPs are expressed only in the rod and cone photoreceptors of the retina, and their targeted deletion has little effect on the expression of other genes or retinal morphology (Mendez et al. 2001). The lack of feedback on cGMP synthesis resulted in larger and slower single-photon responses than wild-type (WT), and also resulted in an increase in rod continuous noise. Despite these alterations in response properties, the mean dark current of GCAPs−/− rods was statistically indistinguishable from WT (Mendez et al. 2001), which is consistent with recordings presented here. The dark current in WT rods was 14.2 ± 0.4 pA (n= 22), and in GCAPs−/− rods was 15.3 ± 0.4 pA (n= 23; means ±s.e.m., P= 0.07). Furthermore, measurements of the resting membrane potential were made in current clamp from WT and GCAPs−/− rods in dark-adapted retinal slices (Okawa et al. 2008); the membrane potential of WT rods was −42.0 ± 1.8 mV (n= 9), and in GCAPs−/− rods was –43.8 ± 2.0 mV (n= 8, means ±s.e.m., P= 0.5). Thus the targeted deletion of GCAPs alters the properties of the light response without changing the rod photoreceptor dark current or resting membrane potential, which controls glutamate release at the rod spherule (Trifonov, 1968). To minimize the strain differences in the physiological or behavioural experiments, we used mice bred for more than five generations into a C57Bl/6 background (WT).
Preparation
Procedures used for the handling of retinal tissue, and electrophysiological recordings from rod photoreceptors and rod bipolar cells were similar to previous work (Sampath et al. 2005). Mice were dark-adapted overnight and killed by rapid cervical dislocation according to protocols in compliance with Drummond (2009) and approved by the Institutional Animal Care and Use Committee of the University of Southern California (Protocol 10890). Briefly, eyes were enucleated under infrared illumination, the lens and cornea removed, and the resulting eyecups were stored at 32°C in Ames’ medium equilibrated with 5% CO2–95% O2. All subsequent manipulations of the retinal tissue were done under infrared illumination (>950 nm) using infrared image converting goggles. For electrophysiological recordings the retinas were prepared as described below and superfused with Ames’ medium heated to 35–37°C.
Electrophysiological recording and analysis
Light-evoked currents from rod photoreceptors were measured with suction electrodes from finely chopped pieces of retinal tissue. Clusters of cells with the outer segments protruding were targeted and individual rod outer segments were drawn gently into a suction electrode containing Ames’ medium buffered with 10 mm Hepes to pH 7.4. Light-evoked currents were measured following 10 ms flashes from an LED (λmax∼ 470 nm, FWHM ∼ 30 nm) or 30 ms flashes from a tungsten-halogen source passed through an interference filter (λmax∼ 500 nm, FWHM ∼15 nm), low-pass filtered at 20 Hz with an 8-pole Bessel filter, and digitized at 1 kHz.
Light-evoked currents from rod bipolar cells were recorded with patch electrodes. Whole-cell and perforated-patch recordings were made from rod bipolar cells in dark-adapted retinal slices as described previously (Armstrong-Gold & Rieke, 2003; Sampath et al. 2005). The internal solution for these experiments consisted of (in mm): 125 potassium aspartate, 10 KCl, 10 Hepes, 5 N-methyl-D-glucamine (NMG)-HEDTA, 0.5 CaCl2, 1 ATP-Mg, 0.2 GTP-Mg; pH was adjusted to 7.2 with NMG-OH. Flash families were measured in response to a 10 ms flash from a blue LED (λmax∼ 470 nm, FWHM ∼ 30 nm) whose strength varied from generating a just-measurable response and increased by factors of 2. Membrane currents were low-pass filtered at 300 Hz by an 8-pole Bessel filter, and digitized at 1 kHz.
The signal-to-noise ratio (SNR) in both rods and rod bipolar cells was calculated from amplitude histograms generated from light-evoked responses to a repeated dim flash. For each rod photoreceptor response amplitudes of individual trials were determined by the correlation of those trials with the average of all trials. The amplitude histogram of the rod was fitted by the equation:
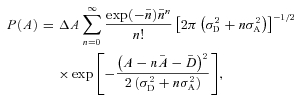 |
where P(A) is the probability of obtaining responses in amplitude between A−ΔA/2 and A+ΔA/2, σD is the standard deviation of dark noise, σA is the standard deviation of single-photon response amplitude with  as its mean, and n is the number of photoisomerizations produced by a flash with
  is its average (see Field & Rieke, 2002b).
  is the mean amplitude of dark noise and was introduced only for GCAPs−/− rods whose noise peaks in the histograms skewed slightly from zero (by less than 10% of the single-photon response amplitude). This equation assumes that photon absorptions by rods obey Poisson statistics and that dark noise and variations in single-photon responses are independent and additive. For rod bipolar cells, whose dim flash responses demonstrate a supralinear dependence on flash strength (Field & Rieke, 2002b), Gaussian distributions were fitted to the dark noise and single-photon response amplitudes. These Gaussian distributions were then summed to provide the overall fit to the histogram.
The signal-to-noise ratio (SNR) for both rods and rod bipolar cells was defined as distance between noise and single-photon response peaks divided by the square root of the sum of their variances, which for rods becomes  , and for rod bipolar cells becomes
  (see Dunn et al. 2006). The bins of histograms were chosen for each rod in a way that maximizes the SNR based on the number of trials, noting that histograms for rod bipolar cells always contained fewer trials due to the limited stability of the perforated-patch recordings (and GCAPs−/− rod bipolar cells had the fewest trials given the slower response kinetics).
Statistical significance in all experiments was ascertained using Student's two-tailed t test, for which P values are provided.
Mouse behavioural assay
To determine how alterations in the rod photoresponse and noise influence behavioural threshold for vision, WT and GCAPs−/− mice were trained to find a black wall in a white water maze (Sampath et al. 2005). Mice were trained in bright light to escape from the maze at the black wall by crawling out of the cool (17–18°C) water onto a platform. A closed-circuit infrared-sensitive camera recorded individual trials and the time required to find the platform was determined post hoc from the video. Mice were placed into the maze three to five times per day, and the position of the target was randomized for each trial. To randomize further the time between trials, we tested the mice from first to last, last to first, etc. For safety, mice were removed from the maze if the time to escape exceeded 30 s, and those trials were recorded as 30 s. Once the average time to find the platform remained constant for three consecutive days at a given light intensity, the light intensity was lowered by 1 log unit, and by 0.3 log unit as the light intensity came closer to absolute threshold. This process was repeated until the average time to find the platform was the same as in darkness (∼20 s). In some trials we found the mice learned more quickly if trials were spaced with shorter intervals. Under those circumstances we divided the mice into smaller groups and three to five trials were given consecutively to each group.
The maze was illuminated by a dissecting microscope light source (Thorlabs, Newton, NJ, USA), from which a liquid light guide illuminated a lens tube containing an interference filter (λmax∼ 500 nm, FWHM ∼40 nm), and absorptive neutral density filters (Thorlabs). A trifurcating fibre (Newport) originating on the opposite end of the lens tube was placed at 120 deg around the maze, and were positioned to project off a photographic reflector above the maze to yield uniform illumination. The uniformity of the illuminating light was tested daily, and was always within 10% of the mean light level. Photon flux was measured using a calibrated photometer (United Detector Technologies, San Diego, CA, USA), and the resulting flux was calculated in equivalent photons at the rod photoreceptor peak spectral sensitivity (∼501 nm).
To determine how robust changes in behavioural threshold were between WT and GCAPs−/− mice, we used bootstrapping (Efron, 1982) to test the hypothesis that the GCAPs−/− data could be explained by the WT data. WT data at each light level were resampled with replacement to simulate a new set of behavioural data. This procedure was replicated 100 times to produce 100 behavioural curves that were each fitted with Hill equations (the Hill exponent was held fixed at 2, but this analysis remained robust for values ranging from 0.5 to 4). The resulting distribution of I1/2 values were plotted in a histogram (Fig. 2C), and compared with I1/2 value from the best fit through the GCAPs−/− behavioural data. The I1/2 value for GCAPs−/− mice fell 3.4 s.d. above the WT mean (Fig. 2C), reflecting P < 0.01 that it could be explained by the WT data. A similar analysis (data not shown), but excluding the light level where the difference between WT and GCAPs−/− behavioural data is the largest (i.e. 0.0073 ϕμm−2 s−1, Fig. 2), indicated that the I1/2 value for GCAPs−/− mice fell 2.5 s.d. above the WT mean, reflecting P < 0.05 that the GCAPs−/− data could be explained by the WT data.
Figure 2. Behavioural estimate of absolute visual threshold in WT and GCAPs−/− mice.

A, escape time from the maze plotted versus light intensity in equivalent photons at the peak absorption wavelength of mouse rhodopsin (501 nm; see Methods), with total darkness plotted at an intensity of 0 ϕμm−2 s−1. Mean ±s.e.m. at each intensity are plotted for WT mice (n= 8; black symbols) and GCAPs−/− mice (n= 8; grey symbols). The mean and the standard error are collectively best fit with a Hill equation where the parameters were allowed to vary. In WT mice the Hill parameters were I1/2= 0.0085 ϕμm−2 s−1 and n= 2.2, and in GCAPs−/− mice were I1/2= 0.013 ϕμm−2 s−1 and n= 2.9. B, differences in escape behaviour were more pronounced near behavioural threshold which occurs in the transition from high light levels where mice can see the target and escape quickly, to low light levels where mice cannot see the target and search randomly. To facilitate the comparison of escape times at these light levels the normalized time to escape on a mouse-by-mouse basis is plotted at 0.00073 (low), 0.0073 (transition) and 1.45 (high) photons μm−2 s−1, as indicated by the boxes in A. At the transition background light level of 0.0073 photons μm−2 s−1 the difference in escape times was statistically significant between WT and GCAPs−/− mice, P= 0.001 *Student t test P < 0.01. C, the probability that the behavioural data collected from GCAPs−/− mice could be explained by the WT data was estimated by bootstrapping (see Methods). A histogram plotting I1/2 values from 100 sets of WT behavioural curves generated by sampling with replacement is shown. The histogram was fitted with a Gaussian distribution that has a mean of 0.0086 photons μm−2 s−1 and a standard deviation of 0.0013 photons μm−2 s−1. The best-fit I1/2 for the GCAPs−/− behavioural data has a value of 0.013 photons μm−2 s−1, 3.4 standard deviations above the WT data mean. This reflects a probability that the GCAPs−/− behavioural data could be explained by the WT data of P < 0.005.
Calibration of light intensity
Light intensities were calculated for recordings from rod photoreceptors and rod bipolar cells, as well as behavioural experiments, as an effective photon flux at the peak wavelength of spectral sensitivity for mouse rhodopsin (λmax∼ 501 nm) to facilitate comparison. In each instance the effective number of activated rhodopsins per rod (Rh*/rod) was determined by convolving the power-scaled output of the light source with the normalized spectral sensitivity curve for mouse rhodopsin, correcting for added neutral density in the light path. The Rh*/rod can then be calculated based on the effective collecting area in each set-up. In rod recordings light was focused on the preparation by a 10 × 0.25 NA water-immersion condenser objective (Nikon), and the collecting area was estimated based on the scaling between the time-dependant variance and mean response to a dim flash as 0.5 μm2 (Field & Rieke, 2002a). In rod bipolar cell recordings light was focused on the slice preparation by a 20 × 0.75 NA condenser objective (Nikon) and the collecting area based on the scaling of the time-dependent variance to the mean response to a dim flash was estimated to be 0.18 μm2 (Cao et al. 2008). Light delivery in the behavioural set-up is described above and an effective collecting area for rods at the level of the cornea was 0.2 μm2 (Lyubarsky & Pugh, 1996).
Results
Higher signal-to-noise ratio in GCAPs−/− rods
We measured the changes in photocurrent in response to light flashes from WT and GCAPs−/− rods with suction electrodes to characterize their response properties (see Methods). Consistent with previous studies, flashes of increasing strength produced responses that were larger in amplitude and longer in duration in GCAPs−/− compared to WT mice (Fig. 1A). The derived single-photon response (Fig. 1B) was ∼3.4-fold larger in GCAPs−/− rods compared to WT, consistent with previous studies (Mendez et al. 2001; Burns et al. 2002).
Figure 1. Light-evoked responses of WT and GCAPs−/− rod photoreceptors.

A, response families to 30 ms flashes (arrow) WT and GCAPs−/− rods. Flash strengths for the WT rod yielded 0.43, 1.4, 4.1, 19, 58 and 180 Rh*, and for the GCAPs−/− rod yielded 0.34, 0.76, 1.9, 4.0, 8.3 and 15 Rh*. B, derived single-photon responses from WT and GCAPs−/− rods plotted as a fractional suppression of the dark current versus time. The WT response was derived from 2137 trials across 9 cells. The GCAPs−/− response was derived from 4280 trials across 23 cells. The effective number of cells was estimated from the total number of trials divided by the number of trials on the cell with the most, and thus can be non-integer. The time-to-peak of the single-photon response was 208 ± 11 ms (n= 4.1) in WT rods and 503 ± 39 ms (n= 18.4) in GCAPs−/− rods (mean ±s.e.m.). The integration time of the averaged response was 540 ms for WT rods and 900 ms for GCAPs−/− rods. C, individual trials to flashes of fixed strength in WT and GCAPs−/− rods. In each epoch a flash was delivered (up triangle) at 0.2 s and on average generated 0.9 Rh* in WT rods, and 1.7 Rh* in GCAPs−/− rods. The average single-photon response was shown as the right-most epoch (grey) for comparison. D, the SNRs for WT and GCAPs−/− rods were determined from the fits of histograms to the data in C (see Methods for details). Note the difference in the abscissa for WT and GCAPs−/− rods.
The SNR of the single-photon responses of GCAPs−/− rods was higher than that of WT rods. To estimate the SNR of the rod single-photon response, response amplitude histograms were generated from dim flash responses in which trial-to-trial Poisson fluctuations in the number of absorbed photons were observed (Fig. 1C). The response amplitudes were estimated by calculating the inner product between each individual trial and the average single-photon response (Fig. 1B). This method provides an unbiased estimate of the response amplitude that accounts for the shape and temporal extent of the response and highlights noise that cannot be eliminated by optimal linear filtering. These amplitude histograms were fitted with a Poisson weighted sum of Gaussians distributions (Fig. 1D) to extract the mean and variance of the single-photon responses and of the continuous dark noise (see Methods).
In WT rods, single-photon responses were difficult to distinguish from fluctuations in the continuous dark noise (Fig. 1C, top). This qualitative impression is confirmed by observing the response amplitude histogram (Fig. 1D, top) and associated fit, which displays substantial overlap between the distribution of continuous noise fluctuations (centred ∼0 pA) and the distribution of single-photon responses (centred ∼1 pA). The SNR in WT rods was 1.69 ± 0.15 (mean ±s.e.m., n= 4; see Fig. 8), consistent with previous studies (Field & Rieke, 2002b). In contrast, the single-photon responses of GCAPs−/− rods were easily distinguishable from fluctuations in the continuous noise (Fig. 1C, bottom). The response amplitude histogram (Fig. 1D, bottom) and associated fit displays relatively little overlap between the distribution of continuous noise fluctuations (centred ∼0 pA) and the distribution of single-photon responses (centred ∼3.4 pA). The SNR of GCAPs−/− rods was 2.51 ± 0.08 (mean ±s.e.m., n= 6, see Fig. 8), or ∼1.5-fold higher than for WT rods. This increase in SNR is consistent with previous work that demonstrated that noise events produced by the thermal activation of rhodopsin could be counted in GCAPs−/− rods, but not WT rods (Burns et al. 2002). It should be noted that the higher SNR comes with an increase in dark noise that is reflected in the wider noise distribution in the GCAPs−/− rods (note difference in scale for Fig. 1D, bottom). We estimated from these recordings that the noise variance in the dark current of GCAPs−/− rods was >5-fold larger than WT rods.
Figure 8. Comparison of SNRs of rods and rod bipolar cells.

SNRs as determined for rods and rod bipolar cells (see Methods). Individual cells are plotted as open symbols, with the mean and s.e.m. included as filled symbols. As shown in Fig. 1 the SNR for WT rods was 1.69 ± 0.15 (mean ±s.e.m.; n= 4) compared to GCAPs−/− rods where the SNR was 2.51 ± 0.08 (mean ±s.e.m.; n= 6), P= 0.0054. As shown in Fig. 4 the SNR for WT rod bipolar cells was 2.91 ± 0.11 (mean ±s.e.m.; n= 5) compared to GCAPs−/− rod bipolar cells where the SNR fell to 2.49 ± 0.06 (mean ±s.e.m.; n= 16), P= 0.015. In GCAPs−/− rod bipolar cells treated with 0.2 μm APB the SNR increased to 2.94 ± 0.17 (mean ±s.e.m.; n= 7), P= 0.041 compared to GCAPs−/− (Fig. 7). Variability in the SNR may result from variability in individual cells, or from retinal slice to retinal slice. For GCAPs−/− rod bipolar recordings with and without APB that were done in the same slice, we compared the SNR by plotting a line between the mean values for both conditions. When more than one cell from each condition were derived from the same retinal slice, the line extended to the average value from those cells. Note the upward trend of every line to indicate an improvement in rod bipolar cell SNR in the presence of APB. *P < 0.01, **P < 0.05.
Elevated behavioural threshold in GCAPs−/− mice
The higher single-photon response SNR of GCAPs−/− rods compared to WT suggests these mice should exhibit a lower behavioural threshold for light detection. To ascertain the influence of the higher SNR of GCAPs−/− rods on behavioural threshold, we measured the ability of WT and GCAPs−/− mice to escape from a water maze (Sampath et al. 2005). Figure 2A plots the time to escape from the maze as a function of the background light intensity (see Methods).
At bright light levels, both WT and GCAPs−/− mice were able to identify the target and escaped quickly. At very dim light levels, both WT and GCAPs−/− mice were unable to identify the target and thus searched randomly for the escape. Under these circumstances their escape times matched those acquired in complete darkness (Fig. 2A). An intermediate range of light levels defined a transition zone between seeing and not seeing the escape target for both WT and GCAPs−/− mice. Surprisingly, the GCAPs−/− mice exhibited systematically longer escape times than WT mice across this transition zone (cf. Fig. 2B), indicating diminished sensitivity to light despite a higher rod photoreceptor SNR.
We estimated behavioural threshold as the inflection point in a Hill curve fit that characterized the shape of the psychometric function in the water maze task. In WT mice the threshold background light level was ∼0.0085 ϕμm−2 s−1 and in GCAPs−/− mice the threshold background light level was ∼0.013 ϕμm−2 s−1, an ∼1.5-fold difference. At these light levels and assuming a 0.2 μm2 collecting area per rod at the level of the mouse cornea (Lyubarsky & Pugh, 1996), it should be noted that behaviour is determined by the ability of the retinal cells to distinguish the single-photon response in a few rods from the underlying dark noise in the vast majority of rods.
The higher behavioural threshold for GCAPs−/− mice shown in Fig. 2 is relatively subtle. Given the large range of escape times on a trial-by-trial basis at background light levels near the transition from seeing to not seeing, the statistical significance of this observation required further validation. Thus, we used a bootstrapping procedure to estimate whether the difference in behavioural thresholds was statistically significant (Efron, 1982; see Methods). This method provided an estimate of the probability of obtaining the GCAPs−/− psychometric function from the WT data. The behavioural threshold estimated by the Hill equation fitted to the GCAPs−/− data was an outlier to the distribution of fits generated by the bootstrapping procedure applied to the WT data (Fig. 2C), and exhibited a z-score of 3.4. Thus, the possibility that the GCAPs−/− psychometric function arose from the WT data can be rejected (P < 0.01).
Altered response properties of GCAPs−/− rod bipolar cells
The elevated behavioural threshold of GCAPs−/− mice, despite the higher SNR of the rod photoresponse, indicates that SNR is degraded at some point downstream of the rod photoresponse. Rod signals near absolute visual threshold are passed to rod bipolar cells, the first stage in a specialized low-light level circuit in the mammalian retina called the rod bipolar pathway (Dacheux & Raviola, 1986; Smith et al. 1986). Previous studies in WT mice have indicated that near absolute visual threshold this synapse optimally separates signal from noise by non-linearly filtering rod signals prior to pooling them in rod bipolar cells (Field & Rieke, 2002b; Berntson et al. 2004). Single-photon response SNR is improved as this non-linear threshold rejects smaller single-photon responses more likely to have arisen from the distribution of noise. The inappropriate positioning of this non-linear threshold relative to the distributions of noise and single-photon responses would degrade visual performance by either (1) setting the threshold too low, allowing too much noise to be pooled with photon responses, or (2) setting the threshold too high, rejecting photon responses that should have been discriminated from noise. Thus, synaptic processing between rods and rod bipolar cells is a candidate location for inefficient signal transmission in GCAPs−/− mice.
Signal transmission between rods and rod bipolar cells was assayed by measuring the dependence of average response amplitude on flash strength (Fig. 3A). This relationship was fitted by a Hill equation (Field & Rieke, 2002b; Sampath & Rieke, 2004) whose exponent quantifies the degree of (non)linearity in signal transmission (Fig. 3B). The value of the Hill exponent is a measure of position of the non-linear threshold with respect to the amplitude distributions of signal and noise, with an exponent of 1 describing the linear dependence expected if all single-photon responses in the receptive field are summed (i.e. no single-photon responses or noise fluctuations are eliminated).
Figure 3. Flash response families in WT and GCAPs−/− rod bipolar cells.

A, light-evoked responses to 10 ms flashes (arrow) for voltage-clamped (Vm=−60 mV) rod bipolar cells. For the WT rod bipolar cell flash strengths were 0.084, 0.25, 0.59, 1.3, 2.6, 5.3 and 11 Rh*/rod, and for the GCAPs−/− rod bipolar cell flash strengths were 0.084, 0.25, 0.59, 1.3, 2.6, 5.3 Rh*/rod. A vertical dashed line demonstrates the initial time to peak of the rod bipolar responses are similar between WT (145 ± 7.7 ms, n= 8.2) and GCAPs−/− (169 ± 19 ms, n= 5.8) rod bipolar cells (mean ±s.e.m.) despite the slowed response of GCAPs−/− rods (see Fig. 1). B, average response–intensity relationship across all WT (n= 22) and GCAPs−/− (n= 10) rod bipolar cells. Data were fitted will a Hill equation with n= 1.55 and I1/2= 1.8 Rh*/rod for WT rod bipolar cells, and n= 1.25 and I1/2= 1.3 Rh*/rod for GCAPs−/− rod bipolar cells.
The rod bipolar cells of GCAPs−/− mice exhibited a more linear dependence of response amplitude on flash strength than WT mice (Hill exponent ∼1.25 compared to ∼1.55, respectively, Fig. 3B), indicating that signal transmission between rods and rod bipolar cells was more linear in GCAPs−/− than in WT mice. There are two possible explanations for this difference: (1) the greatly increased amplitudes of both signals and noise in the GCAPs−/− rods more often exceeds the non-linear threshold, resulting in a more linear dependence of average response amplitude on flash strength, or (2) the non-linear threshold in GCAPs−/− mice has shifted to a position that efficiently separates rod signals from noise given the higher SNR of the single-photon response in GCAPs−/− rods. These two possibilities can be distinguished by measuring single-photon response SNR in GCAPs−/− rod bipolar cells. In the first case, the single-photon responses should have a lower SNR than WT due to greater rod noise exceeding the non-linear threshold, while in the second case, the responses should have a higher SNR than WT due to more efficient processing of a signal with a higher initial SNR (see Fig. 1D).
Reduced single-photon response SNR in GCAPs−/− rod bipolar cells
We measured the SNR of the single-photon response in WT and GCAPs−/− rod bipolar cells, just as for the rods, by generating histograms of response amplitudes to repeated dim flashes of light (see Methods). Given the convergence of rods to rod bipolar cells in mouse (∼20; Tsukamoto et al. 2001), the delivered flash was expected to generate either 0 or 1 single-photon response in the receptive field of the rod bipolar cell. WT rod bipolar cells exhibited either large discrete responses or small noise fluctuations from trial-to-trial (Fig. 4A and B). Consistent with previous results (Field & Rieke, 2002b), the non-linear processing at the rod-to-rod bipolar cell synapse in WT mice improved the SNR of the single-photon response by ∼1.7-fold (Fig. 1D, top and Fig. 4B, top). GCAPs−/− rod bipolar cells, on the other hand, exhibited substantially more noise than WT rod bipolar cells, and responses were difficult to distinguish from the noise (Fig. 4A and B, bottom). In GCAPs−/− mice the SNR of the single-photon response in rod bipolar cells (2.49 ± 0.06, mean ±s.e.m., n= 16) was not improved compared to their rods, and was ∼1.2-fold lower than that observed in WT rod bipolar cells (Fig. 8). This result indicates that the increased amplitude of the noise and of the single-photon response in the GCAPs−/− rods allowed substantially more noise and signal to exceed the non-linear threshold at the rod-to-rod bipolar synapse, such that it no longer effectively separated rod signals from noise.
Figure 4. Estimation of SNR in WT and GCAPs−/− rod bipolar cells.

A, perforated-patch voltage-clamp (Vm=−60 mV) recordings from WT and GCAPs−/− rod bipolar cells. Each epoch represents an individual trial where a 10 ms flash (inverted triangle) was delivered at 0.2 s, and the grey records reflect the shape of the average dim flash response and are scaled for comparison with individual trials. Flashes for the WT and GCAPs−/− rod bipolar cell on average generated 0.064 Rh*/rod. B, SNRs were determined from the fits of histograms generated from the data in A (see Methods). For ease of comparison amplitudes have been normalized to the mean single-photon response.
Increased noise in GCAPs−/− rod bipolar cells
The increased noise in GCAPs−/− rod bipolar cells (Fig. 4A, bottom) contributed substantially to the decreased SNR of the single-photon response. We quantified the cellular noise in GCAPs−/− and WT rod bipolar cells by measuring the noise variance under whole-cell recordings (Vm=−60 mV) immediately upon break-in (Fig. 5A). The recording electrode contained 25 μm GTP-γ-S, which slowly dialysed into the cell. GTP-γ-S activates strongly the Go G-protein, resulting in the closure of transduction channels (Sampath & Rieke, 2004) and revealing the underlying instrumental noise. In GCAPs−/− rod bipolar cells, GTP-γ-S incorporation produced a larger change in holding current at −60 mV (Fig. 5A), indicating that ∼1.5-fold more transduction channels are open in darkness, which in turn will report more cellular noise. Comparing the noise variance immediately upon break-in and after dialysis of GTP-γ-S revealed recordings of both GCAP−/− and WT rod bipolar cells were cellular noise limited, and that GCAPs−/− rod bipolar cells exhibited ∼4.5-fold more noise variance than WT rod bipolar cells (Fig. 5B).
Figure 5. Dark noise in WT and GCAPs−/− rod bipolar cells.

A, noise variance was measured in voltage-clamped rod bipolar cells immediately after whole-cell break-in (black) and after the dialysis of the cell with 25 μm GTP-γ-S (grey). The average change in holding current following GTP-γ-S dialysis for WT mice was 10.2 ± 0.7 pA (mean ±s.e.m.; n= 10) and in GCAPs−/− mice was 15.2 ± 2.2 pA (mean ±s.e.m.; n= 11), P= 0.045. B, power spectra of dark noise fluctuations for WT (filled symbols) and GCAPs−/− (open symbols) rod bipolar cells. Power spectra after the dialysis of GTP-γ-S (grey filled and open symbols) was similar indicating that higher noise in GCAPs−/− rod bipolar cells was not due to differences in the quality of the recordings.
Non-linear threshold is poorly positioned in GCAPs−/− rod bipolar cells
Previous studies have shown that the non-linear threshold at the rod-to-rod bipolar cell synapse in WT mice is positioned to separate optimally rod signals from noise near the absolute threshold of vision (Field & Rieke, 2002b). Figure 6A illustrates the relative position of the non-linear threshold to the distribution of rod continuous noise (centred at 0 pA) and to the distribution of the single-photon response (centred at 1 pA) in WT mice. Note the non-linear threshold (represented by the vertical line and positioned at 1.3 pA) lies near the crossing point between the two distributions. Responses and noise to the left of the non-linear threshold are suppressed, while responses and noise to the right are passed onto the rod bipolar cells. This processing strategy will result in greater separation between the signal and noise distributions (increased SNR) in the rod bipolar cell (Fig. 6C). Given this model for processing single-photon responses in WT mice, we considered how the altered distributions of single-photon response amplitudes and noise in GCAPs−/− rods impacts SNR in rod bipolar cells.
Figure 6. Model for the non-linear threshold at the rod-to-rod bipolar synapse.

A, the probability density of dark noise and single-photon (light) response amplitude in WT is plotted for conditions near absolute visual threshold (∼0.0005 Rh*). Standard deviations for Gaussian distributions were averaged and have been normalized to the mean single-photon response amplitude for WT rods ( ,
,  ). The dashed vertical lines indicate the position of the non-linear threshold, plotted at 1.3 for WT (Field & Rieke, 2002b). B, the probability density for GCAPs−/− rods near absolute visual threshold, as for WT rods. Gaussian distributions were averaged and have been normalized to the mean single-photon response amplitude (
 ,
,  ) that were multiplied by 3.4-fold difference in the mean single-photon response amplitude compared to WT rods (see Fig. 1). Non-linear thresholds were plotted at 1.3 (same as WT), 1.6 and 2.7 pA. C and D, rod bipolar response distributions were simulated assuming the convergence of 20 rods per rod bipolar cell and flash strengths of 0.1 Rh*/rod and 0.04 Rh*/rod for WT and GCAPs−/− distributions, respectively. We assumed a sharp threshold, where responses exceeding the threshold were transmitted and those below the threshold were scaled by 0.15, to reproduce the observed variance in dark noise of the rod bipolar cells in Fig. 4. Simulated histograms resulting from 10,000 repeated flashes were fitted as the sum of Gaussian distributions centred at the absorption of 0, 1, 2 … photons (see Methods), and the response amplitude axis was normalized to the mean single-photon response amplitude.
GCAPs−/− rods exhibited a wider distribution (larger fluctuations) of dark noise, and larger range of single-photon response amplitudes (see Fig. 1D). If a fixed position of the non-linearity at 1.3 pA across both WT and GCAPs−/− mice is considered (Fig. 6A and B), a greater fraction of both single-photon responses and continuous noise will be passed onto the GCAPs−/− rod bipolar cell. This results in a diminished separation between the signal and noise distributions (lower SNR) in the rod bipolar cell (Fig. 6D, left), consistent with the recordings shown in Fig. 4B. It should be appreciated that raising the absolute position of the non-linear threshold in GCAPs−/− mice would progressively increase the rod bipolar cell SNR (Fig. 6D). Thus moving the non-linear threshold to an absolute position of ∼2.7 pA would then optimally separate rod signals from noise in the GCAPs−/− rod bipolar cells and significantly improve the SNR (Fig. 6D, right), even compared to WT rod bipolar cells. Note that under these circumstances for GCAPs−/− mice, compared to WT, the effective position of the non-linear threshold is lower with respect to the mean rod single-photon response amplitude (i.e. 0.8 in GCAPs−/−vs. 1.3 in WT), as expected for the optimal separation of signals and noise from rods with a higher SNR (Field & Rieke, 2002b).
Increased postsynaptic saturation increases SNR in GCAPs−/− rod bipolar cells
The position of the non-linear threshold is akin to the level of postsynaptic saturation at the rod-to-rod bipolar cell synapse (Sampath & Rieke, 2004). To test the influence of raising the relative position of the non-linear threshold on rod bipolar cell SNR in GCAPs−/− mice, we treated these cells with the Group III metabotropic glutamate receptor agonist, l-2-aminophosphonobutyric acid (APB; Slaughter & Miller, 1981). Treatment with a low concentration (0.2 μm) of APB lightly activates the mGluR6 cascade resulting in the closure of some transduction channels (Nawy & Jahr, 1991), and increasing synaptic saturation (Sampath & Rieke, 2004).
Figure 7A demonstrates recordings from a GCAPs−/− rod bipolar cell treated with APB. The activation of the mGluR6 cascade by APB reduces the width of the noise distribution in the GCAPs−/− histogram (Fig. 7B; compare to Fig. 4B, bottom), making the distribution of single-photon responses and noise more discrete. The SNR in the presence of APB increased to 2.94 ± 0.17 (n= 7; Fig. 8), an ∼1.2-fold improvement over GCAPs−/− rod bipolar cells in the absence of APB. Thus it appears that in GCAPs−/− mice the rod bipolar cell is not effective at eliminating rod noise, and a subtle increase in postsynaptic saturation (or the position of the non-linear threshold) can improve the SNR of the single-photon response. In WT mice postsynaptic saturation at the rod-to-rod bipolar synapse (Sampath & Rieke, 2004) appears well tuned for eliminating synaptic noise and separating it from the single-photon response, and thus in lowering behavioural threshold.
Figure 7. APB improves SNR in GCAPs−/− rod bipolar cells.

A, perforated-patch voltage-clamp (Vm=−60 mV) recordings from GCAPs−/− rod bipolar cells in the presence of 0.2 μm APB. Each epoch represents an individual trial where a 10 ms flash (inverted triangle) was delivered at 0.2 s, and the grey records at the right are scaled to the average single-photon response amplitude for comparison. Flashes for these rod bipolar cells on average generated 0.033 Rh*/rod. We assume the APB-dependent increase in synaptic saturation at the rod bipolar cell to be predominantly a postsynaptic action, as the activation of presynaptic metabotropic glutamate receptors at the rod spherule would reduce glutamate release and relieve saturation, the opposite of the effect observed (see also Sampath & Rieke, 2004). B, SNRs were determined from the fits of histograms generated from the data in A (see Methods). For ease of comparison with Fig. 4 amplitudes have been normalized to the mean single-photon response.
Discussion
The study of absolute visual threshold in humans has a rich history that has highlighted the ability of our sensory systems to detect stimuli that approach the physical limit (reviewed by Field et al. 2005). Early psychophysical work has shown that the visual system is capable of detecting few photon absorptions among hundreds or thousands of rods (Hecht et al. 1942; van der Velden, 1946), but the unambiguous identification of biophysical mechanisms that control our perception remain elusive. The general strategy in these experiments was to use targeted genetics to alter the properties of the phototransduction cascade in mammalian rods and study the full range of how retinal signal processing impacts behavioural threshold. The use of knockout mice provides additional leverage in understanding how absolute visual threshold is set in humans, as the cells and circuits involved are largely conserved (Dacheux & Raviola, 1986; Smith et al. 1986; Bloomfield & Dacheux, 2001; Tsukamoto et al. 2001). In particular GCAPs−/− mice allow us to consider the impact of dark noise (Baylor et al. 1979; Rieke & Baylor, 1996; Chichilnisky & Rieke, 2005), and thus the signal-to-noise ratio (SNR), in the processing of the single-photon response in rods and rod bipolar cells, and how it impacts behavioural threshold.
Influence of rod and rod bipolar SNR on behaviour
Figure 8 shows how the SNR of the single-photon response evolves as it passes from rods to rod bipolar cells. In WT mice we observe an increase in the SNR of the single-photon response as it passes from the rod outer segment to the rod bipolar cell. This increase is attributable to the non-linear threshold at the rod-to-rod bipolar synapse, which is designed to eliminate continuous noise from the array of rod photoreceptors under conditions where rods are rarely absorbing a photon (Baylor et al. 1984; van Rossum & Smith, 1998; Field & Rieke, 2002b; Berntson et al. 2004). In GCAPs−/− rods the elimination of Ca2+ feedback on cGMP synthesis increases significantly the discriminability of the single-photon response. One may expect that the greater separation of the single-photon response from the underlying noise should decrease detection threshold in these animals, but we found to the contrary that behavioural threshold was elevated. While differences in temporal integration should also be considered, this elevation in behavioural threshold for GCAPs−/− mice appears more qualitatively consistent with the reduction of the SNR of the single-photon response in the rod bipolar cells, rather than the improvement seen for rods. This observation goes against the hypothesis that the SNR of sensory receptors solely can explain the limits of behaviour.
The role of GCAPs in the control of light-driven signals in the retina has largely been relegated to phototransduction, where it speeds the temporal properties of the light response and extends the operating range of the rod by preventing response saturation (Mendez et al. 2001). The fast and powerful Ca2+ feedback onto cGMP synthesis also minimizes fluctuations in cGMP that create the ‘continuous’ noise (Rieke & Baylor, 1996; Burns et al. 2002). While these experiments do not identify the limiting source of noise for behaviour threshold in WT mice, it appears the poor tuning of the non-linear threshold to the statistics of the continuous noise relative to the single-photon response in rod bipolar cell dendrites leads to an elevation in behavioural threshold for GCAPs−/− mice. Thus under normal circumstances GCAPs places the continuous noise into a range where it can be eliminated effectively by the non-linear threshold (Fig. 6; van Rossum & Smith, 1998; Field & Rieke, 2002b). This elimination of noise at the level of rod bipolar cells appears well tuned to the rod SNR (cf. Fig. 4A, top), and thus appears to be critical in setting behavioural sensitivity.
Can the non-linear threshold adapt to accommodate changing SNR?
A common feature of sensory systems is their ability to alter their properties based on the stimulus history. Such adaptation is critical for maintaining sensitivity over a wide range of stimulus strengths, thus maximizing the information captured. Near visual threshold, given the sparse density of photons in the array of rod photoreceptors, the retina must be maximally sensitive to absorbed photons (reviewed by Field et al. 2005). A consequence of this arrangement is that the system is also maximally sensitive to the intrinsic noise. The non-linear threshold imposed by the mGluR6 signalling cascade in the rod bipolar cell dendrites is critical for improving the SNR of the rod photoresponse near visual threshold, but it must balance the elimination of noise in phototransduction and signal transmission with the loss of some single-photon responses (van Rossum & Smith, 1998; Field & Rieke, 2002b; Berntson et al. 2004). Thus near visual threshold the precise positioning of the non-linear threshold with respect to the rod signal and noise is critical. This raises the question of whether near visual threshold the position of the non-linear threshold can adjust dynamically to the distributions of rod signal and noise.
Evidence exists that the extent of non-linearity in rod-to-rod bipolar cell signal transfer can be modulated. Application of APB, LY341495 and background light changes the extent of postsynaptic saturation and thus non-linearity measured in flash families, and in the presence of LY341495 or background light the system can be linearized (Sampath & Rieke, 2004). However, these experiments don't necessarily address the adaptive properties of the non-linear threshold, but may instead reflect the movement of the mGluR6 transduction current with respect to a fixed threshold. For weak background light previous work has suggested the optimal positioning of the non-linear threshold could provide some improvement of rod SNR (Field & Rieke, 2002b). But, near visual threshold how far can the position of the non-linear threshold itself adapt?
The present work suggests the lack of an adaptive mechanism that would optimize the position of the non-linear threshold between rods and rod bipolar cells, since the position of the non-linear threshold appears relatively stationary between WT and GCAPs−/− rod bipolar cells (Fig. 6C and D). Experiments with a low concentration of APB show that even the subtle activation of the mGluR6 cascade can improve the SNR of the single-photon response (Fig. 4B, bottom). This would suggest that the ability to manipulate the position of the non-linear threshold might be valuable in optimizing the output of the system. A requirement for such a mechanism would be the ability to sense the distributions of rod signal and noise near visual threshold, and provide feedback to the mGluR6 signalling cascade. For instance, the degree of saturation within the signalling cascade may be manipulated postsynaptically by altering the stoichiometry of the limiting mGluR6 signalling component. If such a mechanism were positioned optimally in GCAPs−/− mice the prediction would be that they would have a higher sensitivity for rod vision, as the non-linear threshold would be acting on rods that already have a higher SNR compared to WT. Thus it appears the extent of saturation within the rod bipolar signalling cascade isn't controlled dynamically, but instead may be evolutionarily ‘hardwired’.
Acknowledgments
We thank Jeannie Chen for providing GCAPs−/− mice, Lindsey Jones for help with behavioural experiments, and Jeannie Chen, Pat Levitt, Johan Pahlberg and Fred Rieke for critical review of the manuscript. This work was supported by NIH Grant EY17606 (A.P.S.), EY06641 (J.B.H.), the Karl Kirchgessner Foundation (A.P.S.), and an NSF Graduate Fellowship (K.J.M.).
Glossary
Abbreviations
- APB
l-2-aminophosphonobutyric acid
- GCAPs
guanylyl cyclase activating protein 1 and 2
- SNR
signal-to-noise ratio
Author contributions
All experiments were performed at the University of Southern California. H.O., J.B.H. and A.P.S. conceived and designed experiments. H.O., K.J.M. and A.C.A. performed experiments. H.O., G.D.F. and A.P.S. analysed the data and wrote the manuscript. All authors revised the manuscript.
References
- Armstrong-Gold CE, Rieke F. Bandpass filtering at the rod to second-order cell synapse in salamander (Ambystoma tigrinum) retina. J Neurosci. 2003;23:3796–3806. doi: 10.1523/JNEUROSCI.23-09-03796.2003. [DOI] [PMC free article] [PubMed] [Google Scholar]
- Barlow HB. Retinal noise and absolute threshold. J Opt Soc Am. 1956;46:634–639. doi: 10.1364/josa.46.000634. [DOI] [PubMed] [Google Scholar]
- Baylor DA, Lamb TD, Yau KW. Responses of retinal rods to single-photons. J Physiol. 1979;288:613–634. [PMC free article] [PubMed] [Google Scholar]
- Baylor DA, Nunn BJ, Schnapf JL. The photocurrent, noise and spectral sensitivity of rods of the monkey Macaca fascicularis. J Physiol. 1984;357:575–607. doi: 10.1113/jphysiol.1984.sp015518. [DOI] [PMC free article] [PubMed] [Google Scholar]
- Berntson A, Smith RG, Taylor WR. Transmission of single-photon signals through a binary synapse in the mammalian retina. Vis Neurosci. 2004;21:693–702. doi: 10.1017/S0952523804215048. [DOI] [PubMed] [Google Scholar]
- Bhandawat V, Reisert J, Yau KW. Elementary response of olfactory receptor neurons to odorants. Science. 2005;308:1931–1934. doi: 10.1126/science.1109886. [DOI] [PMC free article] [PubMed] [Google Scholar]
- Bialek W. Physical limits to sensation and perception. Annu Rev Biophys Biophys Chem. 1987;16:455–478. doi: 10.1146/annurev.bb.16.060187.002323. [DOI] [PubMed] [Google Scholar]
- Bloomfield SA, Dacheux RF. Rod vision: pathways and processing in the mammalian retina. Prog Retin Eye Res. 2001;20:351–384. doi: 10.1016/s1350-9462(00)00031-8. [DOI] [PubMed] [Google Scholar]
- Burns ME, Mendez A, Chen J, Baylor DA. Dynamics of cyclic GMP synthesis in retinal rods. Neuron. 2002;36:81–91. doi: 10.1016/s0896-6273(02)00911-x. [DOI] [PubMed] [Google Scholar]
- Cao Y, Song H, Okawa H, Sampath AP, Sokolov M, Martemyanov KA. Targeting of RGS7/Gβ5 to the dendritic tips of ON-bipolar cells is independent of its association with membrane anchor R7BP. J Neurosci. 2008;28:10443–10449. doi: 10.1523/JNEUROSCI.3282-08.2008. [DOI] [PMC free article] [PubMed] [Google Scholar]
- Chichilnisky EJ, Rieke F. Detection sensitivity and temporal resolution of visual signals near absolute threshold in the salamander retina. J Neurosci. 2005;25:318–330. doi: 10.1523/JNEUROSCI.2339-04.2005. [DOI] [PMC free article] [PubMed] [Google Scholar]
- Dacheux RF, Raviola E. The rod pathway in the rabbit retina: a depolarizing bipolar and amacrine cell. J Neurosci. 1986;6:331–345. doi: 10.1523/JNEUROSCI.06-02-00331.1986. [DOI] [PMC free article] [PubMed] [Google Scholar]
- Drummond GB. Reporting ethical matters in The Journal of Physiology: standards and advice. J Physiol. 2009;587:713–719. doi: 10.1113/jphysiol.2008.167387. [DOI] [PMC free article] [PubMed] [Google Scholar]
- Dunn FA, Doan T, Sampath AP, Rieke F. Controlling the gain of rod-mediated signals in the Mammalian retina. J Neurosci. 2006;26:3959–3970. doi: 10.1523/JNEUROSCI.5148-05.2006. [DOI] [PMC free article] [PubMed] [Google Scholar]
- Efron B. The jackknife, the bootstrap, and other resampling plans. 1982. Society of Industrial and Applied Mathematics CBMS-NSF Monographs 38.
- Field GD, Rieke F. Mechanisms regulating variability of the single-photon responses of mammalian rod photoreceptors. Neuron. 2002a;35:733–747. doi: 10.1016/s0896-6273(02)00822-x. [DOI] [PubMed] [Google Scholar]
- Field GD, Rieke F. Nonlinear signal transfer from mouse rods to bipolar cells and implications for visual sensitivity. Neuron. 2002b;34:773–785. doi: 10.1016/s0896-6273(02)00700-6. [DOI] [PubMed] [Google Scholar]
- Field GD, Sampath AP, Rieke F. Retinal processing near absolute threshold: from behaviour to mechanism. Annu Rev Physiol. 2005;67:491–514. doi: 10.1146/annurev.physiol.67.031103.151256. [DOI] [PubMed] [Google Scholar]
- Hecht S, Schlaer S, Pirenne MH. Energy, quanta, and vision. J Gen Physiol. 1942;25:819–840. doi: 10.1085/jgp.25.6.819. [DOI] [PMC free article] [PubMed] [Google Scholar]
- Hudspeth AJ, Corey DP. Sensitivity, polarity, and conductance change in the response of vertebrate hair cells to controlled mechanical stimuli. Proc Natl Acad Sci U S A. 1977;74:2407–2411. doi: 10.1073/pnas.74.6.2407. [DOI] [PMC free article] [PubMed] [Google Scholar]
- Lyubarsky AL, Pugh EN., Jr Recovery phase of the murine rod photoresponse reconstructed from electroretinographic recordings. J Neurosci. 1996;16:563–571. doi: 10.1523/JNEUROSCI.16-02-00563.1996. [DOI] [PMC free article] [PubMed] [Google Scholar]
- Mendez A, Burns ME, Sokal I, Dizhoor AM, Baehr W, Palczewski K, Baylor DA, Chen J. Role of guanylate cyclase-activating proteins (GCAPs) in setting the flash sensitivity of rod photoreceptors. Proc Natl Acad Sci U S A. 2001;98:9948–9953. doi: 10.1073/pnas.171308998. [DOI] [PMC free article] [PubMed] [Google Scholar]
- Nawy S, Jahr CE. cGMP-gated conductance in retinal bipolar cells is suppressed by the photoreceptor transmitter. Neuron. 1991;7:677–683. doi: 10.1016/0896-6273(91)90380-i. [DOI] [PubMed] [Google Scholar]
- Okawa H, Sampath AP, Laughlin SB, Fain GL. ATP consumption by mammalian rod photoreceptors in darkness and in light. Curr Biol. 2008;18:1917–1921. doi: 10.1016/j.cub.2008.10.029. [DOI] [PMC free article] [PubMed] [Google Scholar]
- Rieke F, Baylor DA. Molecular origin of continuous dark noise in rod photoreceptors. Biophys J. 1996;71:2553–2572. doi: 10.1016/S0006-3495(96)79448-1. [DOI] [PMC free article] [PubMed] [Google Scholar]
- Sampath AP, Rieke F. Selective transmission of single-photon responses by saturation at the rod-to-rod bipolar synapse. Neuron. 2004;41:431–443. doi: 10.1016/s0896-6273(04)00005-4. [DOI] [PubMed] [Google Scholar]
- Sampath AP, Strissel KJ, Elias R, Arshavsky VY, McGinnis JF, Chen J, Kawamura S, Rieke F, Hurley JB. Recoverin improves rod-mediated vision by enhancing signal transmission in the mouse retina. Neuron. 2005;46:413–420. doi: 10.1016/j.neuron.2005.04.006. [DOI] [PubMed] [Google Scholar]
- Slaughter MM, Miller RF. 2-Amino-4-phosphonobutyric acid: a new pharmacological tool for retina research. Science. 1981;211:182–185. doi: 10.1126/science.6255566. [DOI] [PubMed] [Google Scholar]
- Smith RG, Freed MA, Sterling P. Microcircuitry of the dark-adapted cat retina: functional architecture of the rod-cone network. J Neurosci. 1986;6:3505–3517. doi: 10.1523/JNEUROSCI.06-12-03505.1986. [DOI] [PMC free article] [PubMed] [Google Scholar]
- Teich MC, Prucnal PR, Vannucci G, Breton ME, McGill WJ. Multiplication noise in the human visual system at threshold: 1. Quantum fluctuations and minimum detectable energy. J Opt Soc Am. 1982;72:419–431. doi: 10.1364/josa.72.000419. [DOI] [PubMed] [Google Scholar]
- Trifonov IU. [Study of synaptic transmission between photoreceptor and horizontal cell by electric stimulations of the retina] Biofizika. 1968;13:809–817. [PubMed] [Google Scholar]
- Tsukamoto Y, Morigiwa K, Ueda M, Sterling P. Microcircuits for night vision in mouse retina. J Neurosci. 2001;21:8616–8623. doi: 10.1523/JNEUROSCI.21-21-08616.2001. [DOI] [PMC free article] [PubMed] [Google Scholar]
- Van Der Velden HA. The number of quanta necessary for the perception of light in the human eye. Opthalmologica. 1946;111:321–331. doi: 10.1159/000300352. [DOI] [PubMed] [Google Scholar]
- van Rossum MC, Smith RG. Noise removal at the rod synapse of mammalian retina. Vis Neurosci. 1998;15:809–821. doi: 10.1017/s0952523898155037. [DOI] [PubMed] [Google Scholar]