

Abstract
Polycystic kidney disease (ADPKD) results from failure of the kidney to properly maintain three-dimensional structure after loss of either polycystin-1 or -2. Mice with kidney selective inactivation of Pkd1 during embryogenesis develop profound renal cystic disease and die from renal failure within 3 weeks of birth. In this model, cysts form exclusively from cells in which Cre recombinase is active, but the apparent pace of cyst expansion varies by segment and cell type. Intercalated cells do not participate in cyst expansion despite the presence of cilia up to at least postnatal day 21. Cystic segments show a persistent increase in proliferation as determined by bromodeoxyuridine (BrdU) incorporation; however, the absolute proliferative index is dependent on the underlying proliferative potential of kidney tubule cells. Components of the extracellular regulated kinase (MAPK/ERK) pathway from Ras through MEK1/2 and ERK1/2 to the effector P90RSK are activated in both perinatal Pkd1 and adult Pkd2 ortholgous gene disease models. The pattern of MAPK/ERK activation is focal and does not correlate with the pattern of active proliferation identified by BrdU uptake. The possibility of a causal relationship between ERK1/2 activation and cyst cell proliferation was assessed in vivo in the acute perinatal Pkd1 model of ADPKD using MEK1/2 inhibitor U0126. U0126 treatment had no effect on progression of cyst formation in this model at doses sufficient to reduce phospho-ERK1/2 in cystic kidneys. Cysts in ADPKD exhibit both increased proliferation and activation of MAPK/ERK, but cyst growth is not prevented by inhibition of ERK1/2 activation.
INTRODUCTION
Polycystic kidney disease is manifest by cystic deformation of kidney tubules over a prolonged period, up to decades, of life. As such, autosomal dominant polycystic kidney disease (ADPKD) represents a failure to properly maintain three-dimensional organ structure and affords an excellent model for discovering the cellular and molecular mechanisms that underlie this poorly understood process. Two causative genes, PKD1 and PKD2, and their respective protein products, polycystin-1 (PC1) and polycystin-2 (PC2) account for all known forms of ADPKD. PC1 and PC2 form a transmembrane receptor–channel complex in the apical primary cilia of renal tubular cells. These single, non-motile cilia are thought to function as cellular sensory organelles for lumen-forming epithelia including kidney tubules, bile ducts and pancreatic ducts. Their functions are believed to include determination of tubule luminal diameter and regulation of proliferation, apoptosis, polarization and differentiation of epithelial cells comprising these structures.
PC1 is a 4302 amino acid polytopic membrane protein with eleven transmembrane segments (1), a ∼3000 amino acid extracellular domain and a cytoplasmic tail that mediates interaction with PC2 (2). PC1 undergoes autoproteolytic cleavage at a GPS site located just before the first transmembrane segment but the N-terminal and C-terminal fragments remain non-covalently associated (3). PC1 has been proposed to function as a part of a sensory complex involved in sensing flow induced shear stress (4), although the recent identification that a homolog of PC1 is involved in sour taste and pH sensation (5) leaves open the possibility that PC1 itself may have chemosensory function as well. The list of downstream pathways that PC1 has been hypothesized to function in is extensive and includes the Wnt, mTOR, MAPK/ERK, and AP-1 cascades, as well as a number of second messenger systems including cAMP, Ca2+, G-proteins and G-protein coupled receptors (6,7).
One challenge in understanding the relative importance of the multitude of candidate pathways that maintain organ structure is the identification of the appropriate surrogate systems in which the relevant pathways are active and identifiable. Cystic kidneys in mice, with mutations in genes orthologous to human disease genes, are a valuable system in this regard. In the case of Pkd1, the mouse orthologue of PKD1, complete knockout of the gene results in a complex embryonic lethal phenotype that manifests with simultaneous defects in formation of the kidney, pancreas, axial skeleton, capillary blood vessels and, varyingly, the heart (8–11). The sporadic mice that survive embryogenesis die shortly after birth with syndromic lesions that include pulmonary hypoplasia (8). As a consequence, studies of postnatal phenotypes and of discrete organ or cell-specific phenotypes are not practical in Pkd1−/− animals.
Conditional gene targeting strategies (12,13) and hypomorphic alleles (14,15) are helpful means to address the limitations of knockout models that are embryonically lethal. In the current study, we produced a conditionally targeted Pkd1 allele and combined this with a kidney-selective Ksp-Cre recombinase transgenic line to generate a postnatal model of ADPKD due to homozygous inactivation of Pkd1 in distal segments of all nephrons in the kidney. The mice developed profound renal cystic disease with associated renal failure leading to death by 17 days after birth. Cysts formed exclusively from cells and segments where the Cre recombinase was active, but the apparent pace of cyst expansion varied by segment and cell type. Cystic segments showed a persistent increase in proliferation but did not show significant increase in apoptosis. The MAPK/ERK pathway has been implicated in the proliferative response of cyst lining cells. We found activation of the MAPK/ERK pathway from Ras to the downstream effector p90RSK in both Pkd1 and Pkd2 ortholgous models. However, this activation was focal and did not correlate with the pattern of active cellular proliferation as identified by bromodeoxyuridine (BrdU) uptake. The MEK1/2 inhibitor U0126, given at doses that reduced phospho-ERK1/2 in Pkd1 cystic kidneys to baseline levels in vivo, had no effect on progression of cyst formation. Developing cysts in ADPKD exhibit both increased proliferation and activation of ERK1/2, but the proliferation does not seem to be dependent on ERK1/2 activation and inhibition of MEK1/2 activity does not prevent disease progression.
RESULTS
Generation of a conditional Pkd1 allele
We produced a Pkd1flox(neo) mouse line in which exons 2–4 of Pkd1 were flanked by loxP sites and a FRT-neo-FRT selection cassette was inserted into intron 4 (Supplementary Material, Fig. S1A and B). Germline transmission of the Pkd1flox(neo) allele was documented by Southern hybridization (Fig. 1A). Pkd1flox(neo)/flox(neo) homozygous mice were not viable with an embryonic lethal phenotype indistinguishable from Pkd1−/− (data not shown) (11). It is likely that the presence of the ∼2.7 kb loxP-FRT-neo-FRT cassette in the ∼260 bp intron 4 disrupted normal splicing of the gene and resulted in an effective null allele. We deleted the neo cassette by intercrossing Pkd1flox(neo)/+ mice with an FLPe transgenic deleter strain (16) to produce the Pkd1flox allele (Supplementary Material, Fig. S1C). Deletion of the neo cassette was confirmed by PCR using primers flanking the neo insertion site (data not shown) as well as by Southern hybridization showing the appearance of a 2.9 kb NheI fragment in all tissues of Pkd1flox/flox mice (Fig. 1B). Pkd1flox/flox mice lacking the neo cassette were viable with no discernible phenotypes in any tissue including the kidney, liver and pancreas suggesting that the Pkd1flox allele produces adequate levels of functional PC1.
Figure 1.
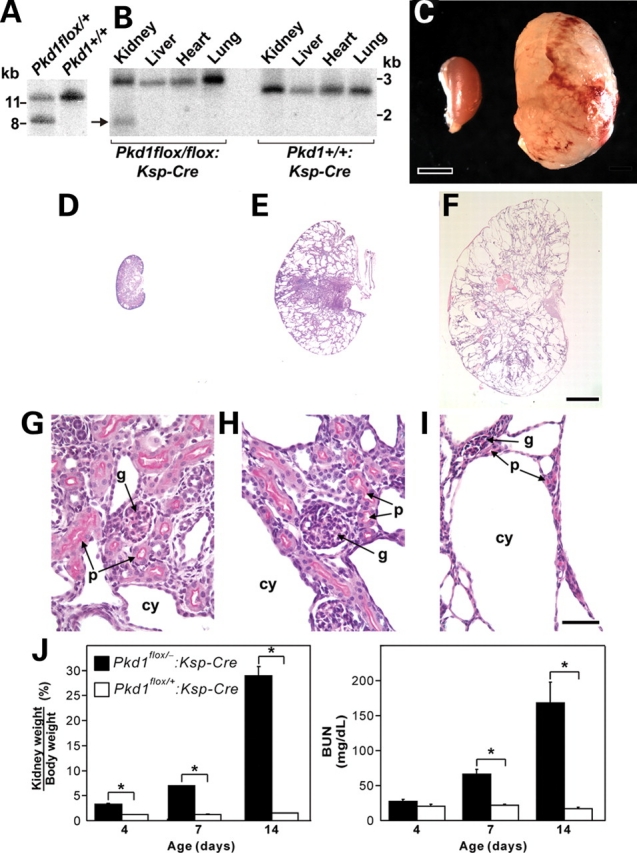
Rapid progression of polycystic kidney disease after kidney selective inactivation of Pkd1 in Pkd1flox/−:Ksp-Cre mice. (A) Genomic Southern digested with HindIII and hybridized with probe 1 (Supplementary Material, Fig. S1) showing germ line transmission of the targeted allele indicated by the 8.5 kb fragment. (B) Genomic Southern showing the 2.9 kb NheI fragment in all tissues resulting from deletion of the neo cassette by FLP deleter and the novel kidney-specific 1.9 kb NheI band (arrow) resulting from deletion of exons 2–4 by Ksp-Cre. (C) Gross appearance of a cystic kidney from a P14 Pkd1flox/−:Ksp-Cre compared with control. Scale bar, 2 mm. Kidneys from P1 (D, G), P7 (E, H) and P14 (F, I) Pkd1flox/flox:Ksp-Cre mice with periodic acid-Schiff (PAS) stain. (D–F) Low power view at the same magnification showing rapid evolution of cystic disease. (G, H) Higher power images showing normal appearing glomeruli (g) and proximal tubules (p) with brush borders stained by PAS at P1 and P7. Cysts (cy) form from PAS negative tubules. (I) Glomeruli and PAS positive proximal tubules are still present at P14 but are now distorted by expansive cyst formation. Scale bar: (D–F), 2 mm; (G–I) 50 µm. (J) Progressive kidney enlargement (increasing kidney weight to body weight ratio) and declining kidney function [rising blood urea nitrogen (BUN)] during 14 postnatal days. Data are shown as mean ± SEM; n = 10 for each time point; *P < 0.01.
Pkd1flox/+ mice were intercrossed with the ACTB-Cre deleter strain to produce Pkd1del2–4 allele. Deletion of exons 2–4 was documented by genomic PCR (data not shown). Pkd1del2–4/del2–4 homozygous mice were embryonic lethal in a pattern indistinguishable from Pkd1−/−, suggesting that the Pkd1flox allele behaves as a null allele after Cre-mediated deletion.
Kidney specific inactivation of Pkd1
We used Ksp-Cre to produce kidney-restricted inactivation of Pkd1. Ksp-Cre mediates recombination in distal segments of the nephron after E11.5 (17,18). Cre mediated deletion of exons 2–4 results in a novel 1.9 kb NheI fragment in genomic DNA (Supplementary Material, Fig. S1D). The deletion was only observed in kidney tissue (Fig. 1B). Densitometric measurement of relative band intensities on Southern blots from postnatal day 7 (P7) kidneys showed that Ksp-Cre-mediated recombination occurred in ∼25% of chromosomes. Mice with Pkd1flox/flox:Ksp-Cre or Pkd1flox/−:Ksp-Cre genotypes were phenotypically indistinguishable and were used interchangeably as the experimental animals. Pkd1+/−:Ksp-Cre or Pkd1flox/+:Ksp-Cre mice were used as controls.
Pkd1flox/−:Ksp-Cre mice are live-born in normal Mendelian ratios but develop significant kidney enlargement (Fig. 1C) and die between P14 and P17. Histological examination of the kidneys from P1, P7 and P14 mice showed rapid progression of polycystic kidney disease (Fig. 1D–F). In keeping with the pattern of Ksp-Cre transgene expression, glomeruli and proximal tubules did not become cystic throughout the 14–17 day lifespan of the mice (Fig. 1G–I). Significantly increased kidney weight to body weight ratio was apparent at postnatal day 4 and increased rapidly thereafter (Fig. 1J). There was rapid rise in blood urea nitrogen (BUN) (Fig. 1J) in association with the cystic enlargement of the kidneys. At 2 weeks of age, cystic mice also showed significant hyperphosphatemia, elevated cholesterol and reduced serum glucose (Supplementary Material, Table S1).
Cyst formation results from Cre-mediated inactivation of the Pkd1flox allele
Pkd1flox/−:Ksp-Cre:R26R mice expressing the ROSA26R (R26R) reporter gene showed that all cysts express lacZ, indicative of Cre activity, whereas non-cystic segments do not (Fig. 2). Most lacZ (i.e., Cre) positive cortical and cortical-medullary junction nephron segments appeared to be abnormally dilated by P3 (Fig. 2A). Collecting tubules of the deep inner medulla/renal papilla (IMCD3) showed prominent Cre activity and appeared mildly ectatic but not cystic at P3 (Fig. 2B). At P7, lacZ positive cortical segments were frankly cystic (Fig. 2C and D), while deep inner medullary segments remained primarily ectatic (Fig. 2E). By P14, the entire kidney was markedly deformed by cyst formation (Fig. 2F). At this stage, lacZ positive segments were all cystic, while lacZ negative cells uniformly comprised non-cystic tubules within an atrophic interstitium (Fig. 2G and H). Non-cystic IMCD3 segments were no longer observed. A minority of cysts had individual cells or pairs of cells that were lacZ negative (Fig. 2C and D). In aggregate, these data show that targeted homozygous inactivation of Pkd1 in kidney tubular segments results in cyst formation and segments in which Pkd1 is not inactivated maintain normal tubular architecture. There is also a suggestion that cortical and cotico-medullay distal nephron segments undergo cystic dilation more readily during kidney growth than inner medullary segments despite comparable degree and time of Pkd1 inactivation.
Figure 2.
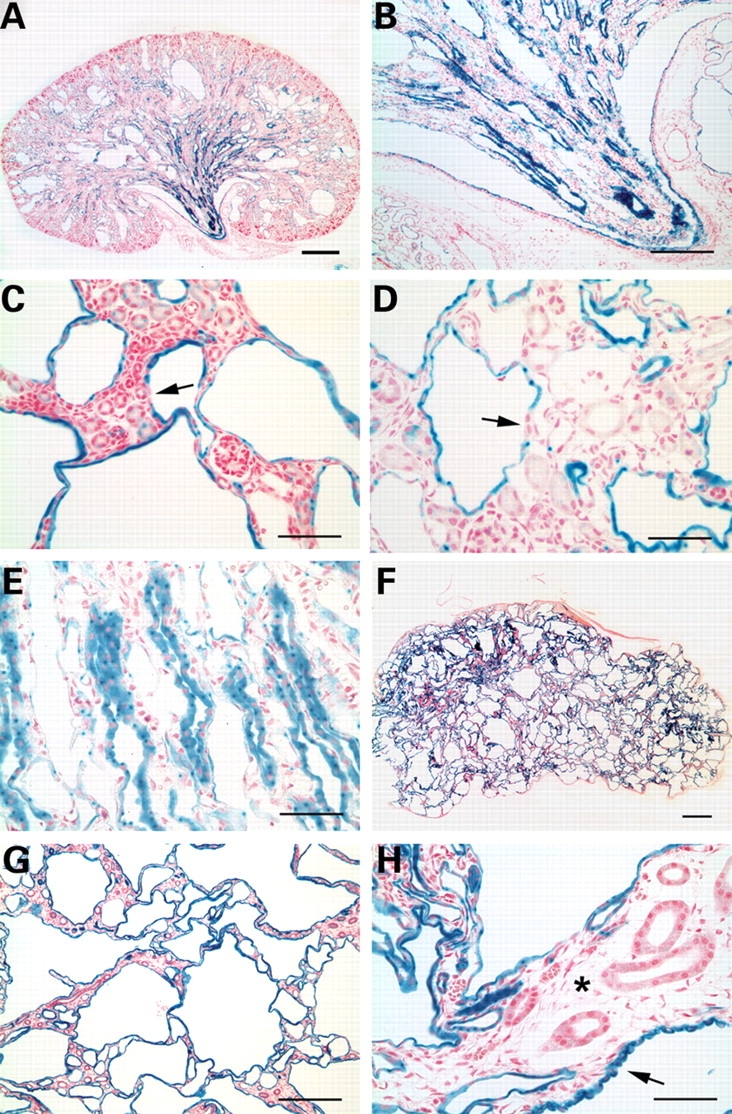
Analysis of Cre activity in cystic kidneys of Pkd1flox/−:Ksp-Cre:R26R mice. Kidneys of P3 (A, B), P7 (C–E) and P12 (F–H) mice stained with β-gal and counter-stained with nuclear fast red. Cyst lining cells at all stages stained positive with β-gal indicating the presence of Cre activity (A–H). However, lacZ positive tubules in the inner medulla showed mild dilatation and ectasia at P3 (B) and P7 (E). A few cells in cyst linings were negative for lacZ expression (arrows; C, D). At later stages, ∼90% of the renal parenchyma is occupied by lacZ positive cysts (F). Almost all cyst epithelial cells are lacZ positive at P12 (G). The majority of cyst lining cells appear as flattened cells with evidence of surrounding tubular atrophy (asterisk), although cysts with lacZ positive cuboidal cells (arrow; H) are also observed. Size bars: (A,B,G) 500 µm; (C,D,E,H) 100 µm; (F) 1 mm.
Cell types comprising cyst linings
The majority of cysts, particularly the largest cysts, stained positive with the collecting duct marker lectin Dolichos biflorus (DBA, Fig. 3A and B). Cyst linings also stained positive with the medullary and cortical thick ascending limb marker Tamm-Horsfall protein (Fig. 3C) but these cysts tended to be smaller and less common. A minority of smaller cysts was derived from the distal convoluted tubule as suggested by positive staining with parvalbumin (Fig. 3B). Proximal tubules marked with lectin Lotus tetragonolobus (L. tetragonolobus) appeared normal and did not form cysts (Fig. 3A). Consistent with the reporter gene studies above, the congruence of the segment-specific pattern of cyst formation with the pattern of Ksp-Cre expression (17) shows that cyst formation in this model is defined by the location of Ksp-Cre expression.
Figure 3.
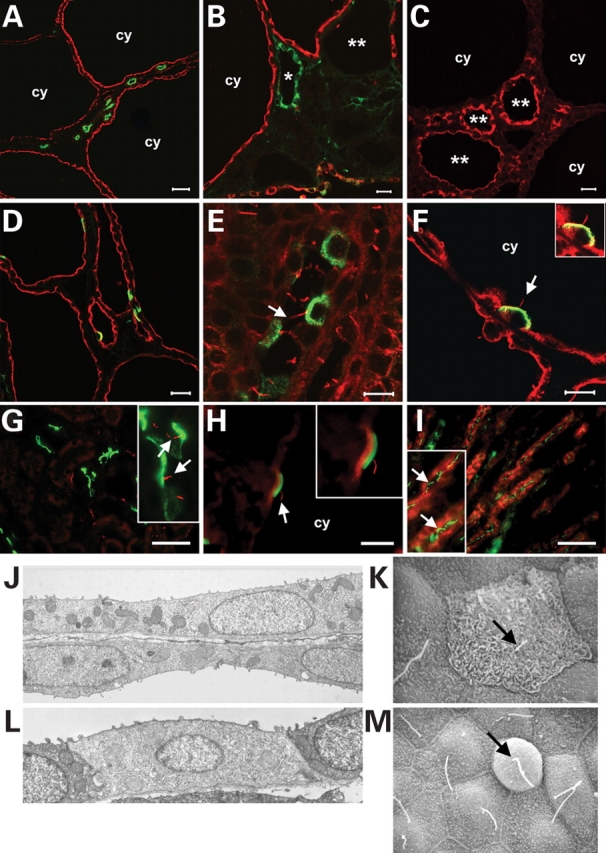
Cell composition and ultrastructural analysis of cysts in Pkd1flox/−:Ksp-Cre kidneys. (A, B) The largest and most common cysts (cy) stained positive for lectin Dolichos biflorus (DBA) indicating collecting duct origin (red). Cysts from distal convoluted tubules [B; parvalbumin, green (asterisk)] and medullary thick ascending limbs [C; Tamm-Horsfall protein, red (double asterisk)] were less common and smaller. Proximal tubules (A; L. tetragonolobus, green) did not form cysts. Intercalated cells marked by the E-subunit of vacuolar H+-ATPase (D, F; green) or pendrin (H; green) are interspersed as single cells in cyst linings (D; DBA, red), indicating that they do not participate in the cyst growth. This is not due to the lack of cilia as both H+-ATPase (E, F; green) and pendrin (G, H; green) positive intercalated cells have cilia marked by anti-acetylated α-tubulin (red, indicated by arrows) in wild-type (E, G) and cystic (F, H) kidneys. (I) IMCD3 segments in adult kidney have apical cilia (aquaporin-2, red; acetylated α-tubulin, green). (J) Transmission electron micrograph (TEM) of principal cells in adjacent cysts show that these cells are more squamoid appearing than normal cortical collecting duct cells, but still have normal appearing lateral junctions, mitochondria, and basement membranes. (K) Scanning electron micrograph (SEM) showing an intercalated cell from a cortical cyst with apical microplicae or microvilli strongly suggesting that this is a type A intercalated cell. (L) TEM of the predominant intercalated cell type seen in cortical cysts. The low density of the cytoplasm, the low number of mitochondria, and the degree of development of the tubulovesicular network suggest that this intercalated cell is relatively immature; lack of apical microplicae or microvilli strongly suggest it is a non-type A intercalated cell. Intercalated cells had normal appearing lateral junctions and basement membranes. (M) SEM of a non-type A intercalated cell from a cortical cyst. Arrows indicate primary cilium. Ages: (A, B, D–F) P14; (C, H) P7; (G) P21. Size bars: (A) 35 µm; (B, C, G, I) 15 µm; (D) 20 µm; (E, F) 10 µm; (H) 5 µm. Digital magnification of inserts: (F) 1×; (G) 4×; (H) 1.5×; (I) 2×.
Principal cells were the predominant cell type comprising DBA-positive collecting duct cysts. Intercalated cells, either type A cells marked by apical E-subunit of vacuolar H+-ATPase (19) or type B cells marked by pendrin (20), were rare in cysts (Fig. 3D, F and H). The pattern of single rather than groups of intercalated cells in cyst linings suggests that these cells do not participate in the expansion of cell mass that gives rise to cyst formation in the Pkd1flox/−:Ksp-Cre model. In support of this conclusion, ∼22.5% of DBA-positive cells in 14 day old control kidneys were positive for H+-ATPase when at least 1000 DBA positive cells were counted in each of three independent sections. In cystic kidneys, only 6.3% of DBA positive cells were labeled with the intercalated cell marker when a similar number of cells were counted (P = 0.023). We used the RA/EG EGFP Cre reporter strain (21) to determine whether the absence of intercalated cell contribution to cyst formation could be explained by the pattern of Ksp-Cre activity. Ksp-Cre is active in anion exchanger 1 (AE1)-positive type A intercalated cells, but not in pendrin-positive type B cells (Supplementary Material, Fig. S2). Therefore, at least the lack of contribution of type A cells to cysts, is not attributable to lack of Cre activity. Intercalated cells have been reported to lack cilia (22), an organelle central to the pathogenesis of tubule cyst formation. However, when we labeled the cilial axoneme with anti-acetylated-α-tubulin, we found that both types A and B intercalated cells in cystic and non-cystic tubules had cilia as late as P21 (Fig. 3E–H), excluding the possibility that lack of cilia accounted for the lack of contribution of intercalated cells to cyst linings. It has also been reported that IMCD3 straight segments in the deep inner medulla in rat do not have cilia (23), perhaps accounting for the apparent temporal lag in cyst formation compared with other segments in our model. However, anti-acetylated-α-tubulin immunostaining in aquaporin-2 positive adult mouse kidney tubule segments in the inner medulla showed the presence of apical cilia in IMCD3 segments as well (Fig. 3I).
Scanning electron micrographs confirmed that principal cells accounted for approximately 85–95% of the cells in cortical cysts. They had a more pronounced squamoid phenotype than observed in the cortical collecting ducts of similarly aged wild-type mouse kidney, but had normal appearing lateral junctions, mitochondria, and basement membranes (Fig. 3J). Abutting cysts often had walls comprised of single cell layers, each with its own tubular basement membrane (Fig. 3J). Occasional type A intercalated cells had a typical appearance with surface microplicae or microvilli (Fig. 3K). Non-type A intercalated cells were identifiable by their lack of apical microplicae and morphology distinct from surrounding principal cells (Fig. 3L and M). Type A and non-type A intercalated cells in cysts had identifiable primary cilia seen with scanning electron microscopy up to 14 days of age (Fig. 3K and M).
Cellular proliferation and apoptosis in cystic kidneys
Increased proliferation and apoptosis have been proposed as features of cystic tissues in ADPKD. We examined these processes in Pkd1 cystic kidneys by BrdU incorporation and TUNEL, respectively (Fig. 4). The large DBA positive cell mass in Pkd1flox/−:Ksp-Cre cystic kidneys provides indirect evidence of increased cellular proliferation in this model. To assess this more quantitatively, at least 1000 nuclei of DBA positive cells were scored for BrdU incorporation 3 h after injection in two independent sections from each of three experimental and three control animals at three time points (Fig. 4). At P7, ∼15% of DBA-positive cyst lining cells showed nuclear BrdU incorporation compared with ∼8% BrdU positive nuclei in DBA positive segments of non-cystic controls. Cystic cell and control proliferation decrease to 8 and 5%, respectively, by P12 (Fig. 4). At P24, using a Pkhd1-Cre that allows longer survival of cystic mice (P.I. and S.S., unpublished data), BrdU incorporation in cystic kidneys occurs in 4% of cyst lining cells but is completely absent in control kidneys (Fig. 4). Loss of PC1 expression results in an incremental increase in cell proliferation irrespective of the underlying proliferative state of cells. However, the absolute proliferative index is dependent on the underlying proliferative potential of kidney tubule cells.
Figure 4.
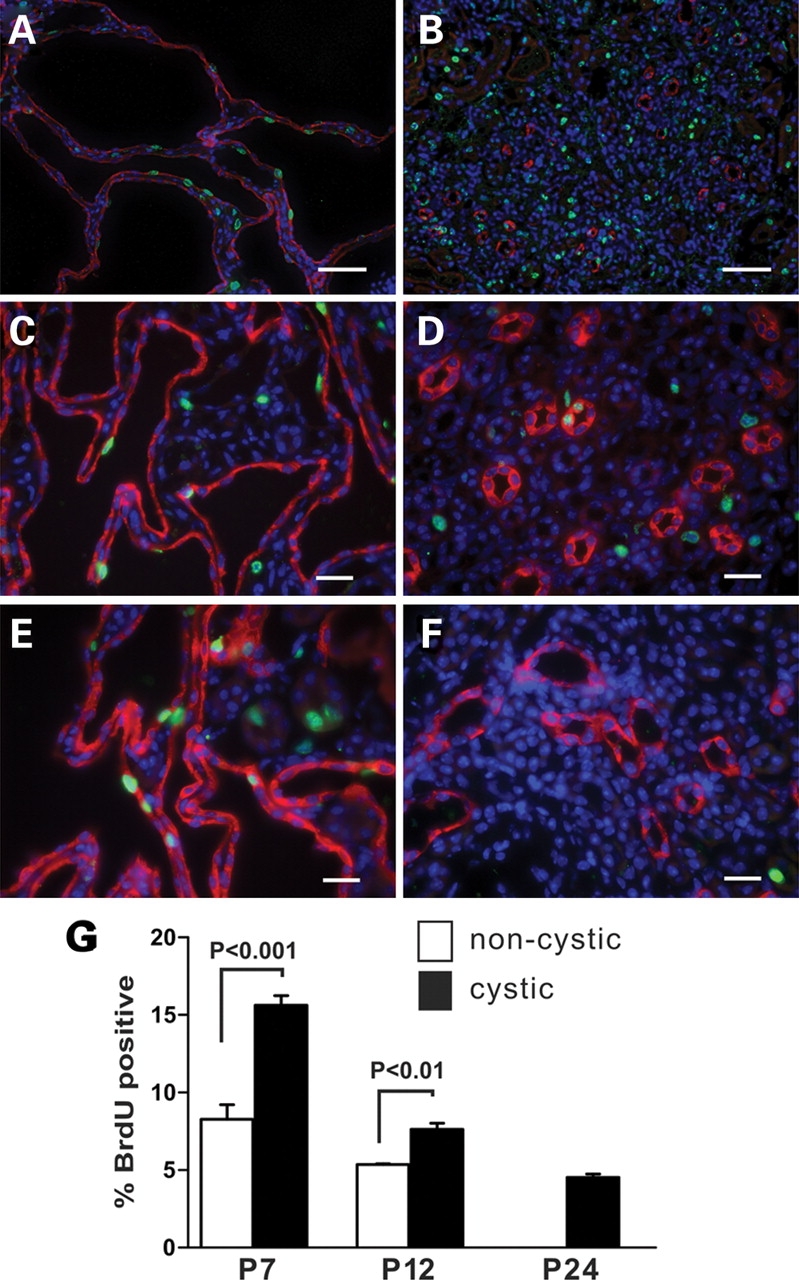
Proliferation in cyst lining cells during kidney development. Nuclear BrdU (green) incorporation 3 h after a single intraperitoneal injection shows relative proliferation in kidney tissue from P7 (A) and P14 (C) Pkd1flox/−:Ksp-Cre and P24 (E) Pkd1flox/−:Pkhd1-Cre cystic kidneys. (B, D, F) Respective littermate non-cystic controls. Green, BrdU positive nuclei; red, DBA; blue, DAPI. Size bars: (A, B) 50 µm; (C–F) 10 µm. (G) Quantitation of BrdU positive nuclei in DBA-positive segments in cystic and control kidney tissues. BrdU incorporation decreases in control kidneys and is undetectable by P24. BrdU incorporation in cyst lining cells is significantly increased over control and persists in the P24 cystic kidney.
Increased apoptosis was not a striking feature in Pkd1flox/−:Ksp-Cre cystic kidneys. TUNEL in P7 and P12 kidneys showed occasional cysts with 2–4 TUNEL positive nuclei but the overall number of apoptotic nuclei seen in low power fields in cystic and non-cystic kidneys was very low and did not differ significantly between cystic and non-cystic kidneys (data not shown).
Activation of the mitogen activated protein kinase/extracellular regulated kinase (MAPK/ERK) pathway
Postnatal mouse models of ADPKD based on mutation of orthologous genes are well suited for investigating the in vivo role of cellular pathways in the pathogenesis of ADPKD. Activation of the MAPK/ERK pathway has been reported in non-orthologous animal models of polycystic kidney disease including the Han:SPRD rat (24) and the pcy mouse that is a model for nephronophthisis (NPHP3) (25). MAPK/ERK activation has also been described as an effector pathway in cAMP stimulated proliferation in human ADPKD cells in culture (26). We sought to define the role of the MAPK/ERK pathway in orthologous mouse models as a means of understanding the in vivo role of this pathway in ADPKD.
Cystic kidneys from Pkd1flox/−:Ksp-Cre mice at P7 showed significant increases in GTP-bound Ras and phosphorylated Raf-1, MEK1/2 and ERK1/2 when compared with kidney tissue from non-cystic litter mate mice (Fig. 5A and B). The amount of protein in each experiment was quantitated to insure equal amounts were used and there was no discernible change in expression of total ERK1/2, MEK1/2, Raf-1 or Ras between cystic and control tissues. Since these findings occurred in P7 postnatal kidneys that were still undergoing development, we determined whether similar activation of the MAPK/ERK pathway also occurs in 3-month old Pkd2WS25/− mice (33). This adult orthologous model based on Pkd2 showed the same pattern of activation of the respective components of MAPK/ERK pathway as the P7 Pkd1-based model (Fig. 5C and D). No increase in activation of B-Raf was observed in either Pkd1 or Pkd2 cystic kidneys (Fig. 5A–D). Among downstream targets of the MAPK/ERK pathways, p90RSK (Fig. 6A–D), but not Elk (data not shown), was activated in both Pkd1 and Pkd2 orthologous models. The finding that MAPK/ERK pathway activation is a common feature in vivo of both Pkd1 and Pkd2 orthologous models irrespective of age supports the hypothesis that this process is likely representative of human ADPKD as well.
Figure 5.
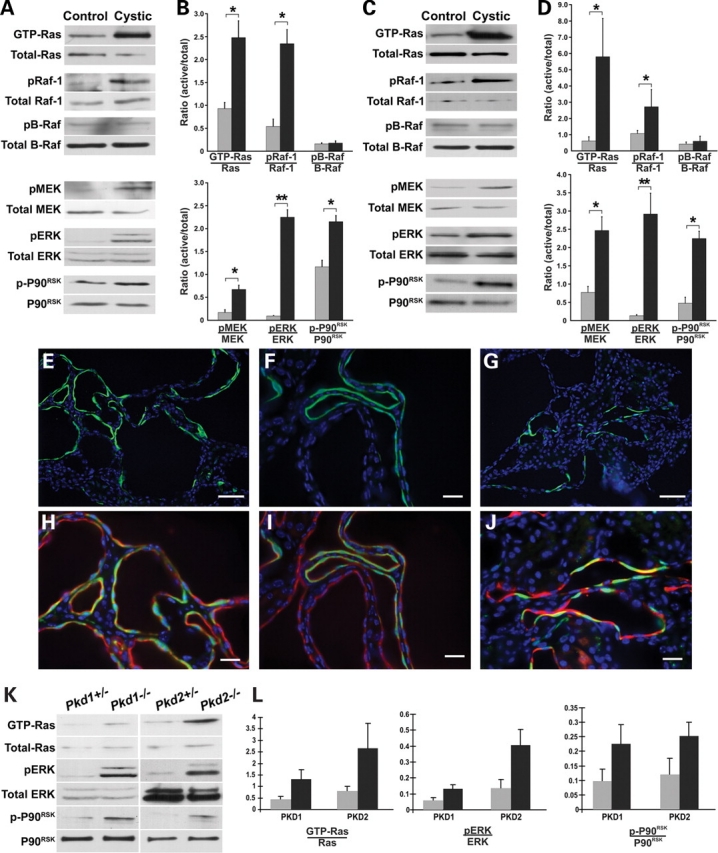
In vivo activation of the MAPK/ERK pathway in Pkd1 and Pkd2 cystic kidneys. P7 Pkd1flox/−:Ksp-Cre (A,B) and 3-month old Pkd2WS25/− (C,D) Cystic kidneys show activation of the MAPK/ERK pathway compared with the respective Pkd1flox/+:Ksp-Cre and Pkd2+/− non-cystic littermate controls. (A,C) Representative immunoblots for active and total components of the MAPK/ERK pathway from kidney tissue. (B,D) Densitometric quantitation of three independent immunoblots for each step in the pathway. Results are expressed as a ratio of the density of active to total forms for each pathway component. Black bars, cystic kidneys; gray bars, control kidneys. *P < 0.05; **P < 0.01. Increased pERK expression is confined to the cells lining a subset of cysts in P7 Pkd1flox/−:Ksp-Cre (E, F, H, I) and P90 Pkd2WS25/− (G, J) kidneys. pERK, green; DBA, red; DAPI, blue. (E–G) pERK and DAPI. (H–J) Include DBA singal; (H, J) Digitally magnified views of (E, G). Size bars: (E, G) 30 µm; (F, H–J) 15 µm. (K) Representative immunoblots for active and total components of the MAPK/ERK pathway in null and heterozygous cell lines for both Pkd1 and Pkd2. pERK activation was found in two independent cell lines for each genotype; data for only one cell line are shown. (L) Densitometric quantitation of three independent immunoblots. Results are expressed as a ratio of the density of active to total forms for each pathway component. Black bars, null cell lines; gray bars, heterozygous cell lines. P < 0.05.
Figure 6.

MAPK/ERK pathway inhibition does not alter progression of cyst formation in ADPKD. (A) Representative immunoblots of pERK1/2 activity in kidneys from vehicle-treated non-cystic (C) and cystic Pkd1flox/−:Ksp-Cre (Cy) mice and from U0126-treated control (C-U) and cystic (Cy-U) mice. Mice received 32 mg/kg U0126 by intraperitoneal injections on P4 and P7 and kidneys were harvested 24 h after the second dose. (B) Densitometric quantitation of immunoblots from three independent experiments as described in (A) showing increased activation of pERK in cystic kidneys (Cy) and normalization of pERK after treatment with 32 mg/kg U0126 (Cy-U); *P < 0.05. (C) Representative kidney sections from P14 Pkd1flox/−:Ksp-Cre mice after treatment with vehicle (control) or with 32 mg/kg U0126. (D) Percent fractional cyst area as a measure of severity of polycystic kidney disease in P14 Pkd1flox/−:Ksp-Cre mice treated with vehicle (Cy) or 32 mg/kg U0126 (Cy-U); (C) non-cystic kidney; n = 3 mice, 6 kidneys examined for each group. U0126 treatment had no effect on cystic disease progression in this model.
The MAPK/ERK pathway is known to play a role in cellular proliferation. In light of the increased proliferation observed in cyst lining cells and the activation of the MAPK/ERK pathway in cystic kidneys, we sought to determine whether the cyst cells themselves were the sites of MAPK/ERK activation in kidney tissue. Immunostaining of kidney tissues with anti-phospho-ERK (pERK) antibodies showed that pERK is confined exclusively to cyst lining cells in both Pkd1 and Pkd2 orthologous ADPKD models (Fig. 5E–J). No comparable areas of increased pERK were observed in 3-month old wild-type mouse kidneys (Supplementary Material, Fig. S3). This finding in the cystic models is notable for the fact that only ∼20% of cyst profiles show ERK activation, but that within this subset of cysts there is extensive contiguous cellular ERK activation (Fig. 5E–J). Up-regulated pERK immunoreactivity was seen both in the nuclei and the cytosol of cyst lining cells (Fig. 5E–J). This pattern of pERK activation in cysts did not correlate with the pattern of proliferation observed with BrdU incorporation in Pkd1flox/−:Ksp-Cre mice (Fig. 4), where most cysts had a few scattered BrdU positive nuclei along the linings. This discordant pattern suggests that ERK1/2 activation may not be the basis for the increase in proliferation in cyst linings in vivo, and that regional factors in the kidney play a role in MAPK/ERK pathway activation.
Cell lines derived from mature kidney tubules that recapitulate the homozygous loss of function of orthologous ADPKD genes are expected to serve as cell culture models for ADPKD. To test this hypothesis and to further establish the genotype dependence of MAPK/ERK pathway activation, we examined kidney tubule cell lines made from our Pkd1 and Pkd2 mouse models (27). Two independent cell lines each for Pkd1−/− and Pkd2−/− cells demonstrate significantly increased basal pERK after 12–16 h of serum starvation when compared with each of two independent Pkd1+/− and Pkd2+/− control cell lines (Fig. 5K and L). This activation is coincident with increases in GTP bound Ras and activation of P90RSK that are similar to those seen in the tissue, suggesting that these cellular models recapitulate the in vivo signaling (Fig. 5K and L). Taken together, these data suggest that MAPK/ERK pathway activation is a common feature of ADPKD due to mutations in Pkd1 or Pkd2 but may not be the underlying basis for increased proliferation observed in cyst lining cells.
Effects of MEK1/2 inhibition on cyst formation in the Pkd1flox/−:Ksp-Cre mouse model
Activation of the MAPK/ERK pathway is a consistent finding in orthologous models of ADPKD independent of the genotype or age of the animal. This finding suggests that the MAPK/ERK pathway may be a target for treatment of ADPKD. U0126 is an inhibitor of MEK1/2 that blocks phosphorylation of ERK1/2 and has shown effectiveness in non-PKD mouse models where activation of the MAPK/ERK pathway plays a role in pathogenesis (28–30). A range of doses from 5 mg/kg (28) to 160 mg/kg (30) has been used in acute mouse studies although only the lowest dose has been used for sustained therapy in perinatal mice (28). A dose of 10 mg/kg in vivo has been shown to inhibit ERK1/2 phosphorylation for at least 72 h (29). We tested dosage regimens of 32 mg/kg and 160 mg/kg given every 72 h by intraperitoneal injection. Mice treated with 160 mg/kg U0126 on P4 and P7 did not show a difference in cystic kidney progression severity at P9, however this dose was toxic and the mice did not survive past P9 (data not shown).
The lower dose (32 mg/kg) of U0126 was well tolerated. We documented effective reduction of phosphorylated ERK1/2 in the kidney to normal levels with this dosing regimen (Fig. 6A and B). This change in pERK levels corresponded to a specific decrease in pERK immunoreactivity in cyst lining cells (Supplementary Material, Fig. S4). We next treated litter mate Pkd1flox/−:Ksp-Cre mice by intraperitoneal injection with either 32 mg/kg of U0126 or an equal volume of vehicle alone. U0126 was administered on P4, P7, P10 and P13 and mice were sacrificed on P14. Sagittal sections from both kidneys of each mouse underwent blinded image analysis as described in the Methods to determine the cystic index, defined as the percent of total cross-sectional area occupied by cysts (Fig. 6C and D). Despite reduction in pERK in treated kidneys, there was no change in the severity of polycystic kidney disease in Pkd1flox/−:Ksp-Cre mice. Although Pkd1flox/−:Ksp-Cre mice show significant activation of the MAPK/ERK pathway in some cyst lining cells, this activation does not correlate anatomically with the diffusely increased proliferation of cyst cells and inhibition pERK1/2 formation using a MEK1/2 inhibitor does not change the rate of cyst growth in Pkd1flox/−:Ksp-Cre mice.
DISCUSSION
In light of the early embryonic lethality of Pkd1 knockouts, we produced a conditional allele to allow both tissue specific and temporal control of inactivation of Pkd1. This mouse model allows for detailed dissection of the in vivo phenotypes associated with loss of PC1 and should provide mechanistic insights into the role of this protein in various tissues and cell types. Our original conditional allele contained the neomycin selection cassette in a small intron and resulted in an effective null allele. Removal of the neo cassette produced a functional allele with no phenotype. Cre-mediated excision of exons 2–4 resulted in a phenotype that is indistinguishable from that observed in our null allele (11).
The absence of cysts in kidneys of mice with either Pkd1+/−:Ksp-Cre or Pkd1flox/− genotypes coupled with the presence of cysts in Pkd1flox/−:Ksp-Cre shows that cyst formation in this model requires the occurrence of second hit mutations, in this instance mediated by Ksp-Cre. Reporter gene analysis with R26R shows that all tubule cells that have undergone second hits become abnormal and form cysts, indicating that homozygous loss of PC1 is sufficient for cyst formation. This model does not, however, directly address whether cysts can be mosaic (31). The Ksp-Cre is relatively uniformly active in distal nephron segments including medullary thick ascending loop of Henle (mTAL) and collecting ducts/tubules (17). In the absence of significant mosaicism of Cre expression along the developing distal segments, this model cannot be used to directly determine whether cysts can arise in mosaic segments where a subset of cells do not have second hits but nonetheless undergo cystic change (31).
Intercalated cells do not appear to participate in cyst expansion in the Pkd1flox/−:Ksp-Cre model. Similar findings have been reported in human recessive PKD (32). Intercalated cells in rabbit collecting ducts have been reported to lack cilia (22), but we found clear evidence for the presence of cilia on intercalated cells up to at least P21 in the postnatal mouse kidney. While the Ksp-Cre transgene does not appear to be active in type B intercalated cells, it is active in type A cells. Neither the lack of cilia nor the lack of Cre activity in type A cells can account for the lack of contribution from these cells to cyst expansion. This result supports the conclusion that the participation in lumen formation by some cell types along the nephron is not dependent on functional PC1. The reporter gene analysis also showed that not all tubule segments form cysts at the same rate. Collecting ducts in the inner medulla show ample cilia and robust expression of lacZ in response to Cre. However, early in the postnatal course, these inner medullary segments show mild ectasia with limited cyst formation at a time when cysts in the cortex and the corticomedullary junction are expanding rapidly. Within the cortical regions, cysts derived from mTAL and DCT appeared consistently smaller than collecting duct cysts at the same time points. These findings are similar to those reported in an adult model of ADPKD due to mutation in Pkd2 (33). The collecting duct predominance in cyst formation in the latter model has helped suggest a possible therapeutic role for V2-receptor antagonists in ADPKD (34). In aggregate, these findings are consistent with the hypothesis that differences in cyst growth potential exist amongst different nephron segments and cell types. Understanding the cellular and molecular bases for these differences will be useful in discovering strategies for altering the rate of cyst growth.
Pkd1flox/−:Ksp-Cre mice showed explosive cyst growth, particularly during the second postnatal week. There was no significant contribution from altered patterns of apoptosis to this process, suggesting that loss of PC1 exclusively increases proliferation in kidney tubule cells. The rate of proliferation was quantitated by determining the rate of DNA synthesis using BrdU incorporation in vivo (35). Normal kidneys showed a decreasing rate of proliferation during postnatal development. By P24, the rate of BrdU incorporation was negligible in normal kidneys, consistent with the terminally differentiated state of the kidney at this time point. Loss of PC1 resulted in an incremental elevation in the rate of tubule cell proliferation at each stage examined. These data suggest that the rate of proliferation (i.e., cyst growth) due to loss of PC1 depends on at least two factors: the underlying proliferative potential of the kidney tubule cells and the cell mass of tubule cells lacking PC1. These may at least in part explain differences in the rate of cyst growth observed in early postnatal mice compared with adult mice (13,36). The relatively slow progression of adult onset ADPKD may reflect a combination of a small cell mass that has undergone second hits coupled with a lesser increase in proliferation after loss of PC1 due to low proliferative potential of the adult kidney. A corollary to this hypothesis is that proliferative stimuli such as the repair response to renal injury may result in exacerbation of cyst growth. Maneuvers to suppress endogenous proliferative potential of normal kidney cells may therefore be beneficial in ADPKD.
Since polycystic kidney disease is a three-dimensional process, in vivo animal models based on the ortholgous disease genes afford the best opportunity to investigate the mechanism of human polycystic kidney disease. Pkd1flox/−:Ksp-Cre mice clearly defined a proliferative process resulting from PC1 inactivation as central to cyst growth and we sought to use this model to understand the mechanism of this proliferation. The MAPK/ERK pathway has been implicated in the proliferation associated with ADPKD in non-orthologous animal models (24,25,37) as well as in renal epithelial morphogenetic processes (38) that are dependent on PC1 (39). PC2 has also been implicated in providing tonic suppression of MAPK/ERK signaling (40). ERK activation observed in cultured ADPKD patient cyst-derived cells has been attributed to cAMP-dependent activation of B-Raf (37,41). Inhibition of the MAPK/ERK cascade has slowed cyst formation in a murine cystic model based on a gene for human nephronophthisis (25).
The data presented demonstrate that MAPK/ERK pathway activation is a common feature of both the perinatal Pkd1flox/−:Ksp-Cre and the adult onset Pkd2WS25/− mouse models. In these ADPKD models, the activated cascade begins upstream with Ras and proceeds through Raf-1 to ERK1/2 and includes at least P90RSK as an effecter. Neither of our ADPKD models showed activation of the 95 kDa B-Raf that has been associated with cAMP dependent proliferation in cultured cyst cells from patients (37,41). In Pkd1flox/−:Ksp-Cre and Pkd2WS25/− mouse models, as well as cultured cell models derived from these mice, ERK1/2 activation occurred specifically in the cyst lining cells that had lost expression of one of the polycystins, indicating that the activation of the MAPK/ERK cascade was dependent on the Pkd1 or Pkd2 genotypes. However, the spatial pattern of ERK1/2 activation in tissues was focal and differed from the homogeneously diffuse pattern of proliferation shown by BrdU incorporation observed in Pkd1flox/−:Ksp-Cre mice. The discordance of these patterns raises the possibility that factors other than MAPK/ERK pathway activation are required for cyst growth.
The apparently focal nature of the MAPK/ERK activation may represent a temporal effect whereby at any given time only a subset of cysts show pathway activation or it may be the consequence of local paracrine effects operational in the cystic kidney. We investigated the role of ERK1/2 activation in cystic disease progression more directly using the MEK1/2 inhibitor U0126. U0126 blocks phosphorylation-dependent activation of ERK1/2 (42). U0126 has recently been shown to improve a perinatal craniosynostosis phenotype associated with ERK1/2 activation in the setting of mutation in fibroblast growth factor receptor 2 (28). We established a dosage regimen that returned active phosphorylated ERK1/2 levels to baseline in cystic kidneys and investigated whether this would have an effect on cyst progression. No effect on Pkd1-dependent ADPKD cyst progression in Pkd1flox/−:Ksp-Cre mice was observed.
In aggregate, the data show that there is activation of the MAPK/ERK cascade specifically in cells that give rise to cysts after losing functional PC1 or PC2 expression. This activation occurs in a focal pattern and does correlate with the diffusely increased proliferation that underlies cyst growth in the Pkd1flox/−:Ksp-Cre model. Inhibition of MEK1/2-dependent ERK1/2 activation does not affect the rate of cyst growth in this model, although it remains possible that intervention at other points in the MAPK/ERK pathway or at other stages of cystic disease (e.g., adult models) may provide a different result. These studies highlight the need for using appropriate in vivo models for both understanding the mechanisms of disease progression and evaluating the value of interventions in preclinical studies.
MATERIALS AND METHODS
Generation of a conditional Pkd1 allele
An ∼8 kb NsiI fragment containing exons 2–5 of Pkd1 was released from mouse BAC clone RPCI22-287A3 and subcloned into pBluescript II KS (Stratagene). A loxP-FRT-PGKneo-FRT cassette released from the PK-11 vector (43) was inserted in a unique XbaI site in intron 4, 850 bp from the 3' end of the targeting vector. A single loxP site released from the pBS 246 vector (GIBCO/Invitrogen) was inserted into the unique BglII site in intron 1 in the same orientation as the other loxP site (Supplementary Material Fig. S1). The final construct was linearized and eletroporated to ES cells.
ES cell clones were initially screened by PCR from within the neo cassette to exon 6 outside the targeting construct. Clones positive by this screen were screened by internal PCR across the loxP in intron 1 to insure that both the upstream and downstream loxP sites were present. Fourteen of 600 G418-resistant ES cells clones were positive by this screen. Two of these clones were further verified for the 5' integration using an outside hybridization probe (probe 1, Supplementary Material, Fig. S1) on HindIII digested genomic DNA. These two ES clones underwent blastocyst injection and were passed through the germline to produce a conditional Pkd1 allele.
Mouse strains and breeding
The FLP1 deleter mouse [B6;SJL-TgN(ACTFLPe)9205Dym from The Jackson Laboratory] was used to delete the neo cassette. Kidney selective inactivation was achieved using the Ksp-Cre transgenic line (17). The Pkd1− null allele has been previously reported (11). The Pkd1 conditional allele was maintained as Pkd1flox/flox homozygotes after deletion of the neo cassette and the Cre lines were maintained on a heterozygous background as Pkd1+/−:Ksp-Cre. Pkhd1-Cre deleter mice will be described elsewhere (Williams and P.I., in preparation).
Histology, β-gal staining and immunofluorescence
For cyst histology and immunofluorescence, mouse tissues were obtained by perfusion fixation with 70 mmHg pressure for 3 min. Mice were anesthetized and perfused with PBS containing 0.4% lidocaine and 0.01% heparin followed by fixation with 4% paraformaldehyde. For histology, kidneys were removed and incubated in 10% phosphate-buffered formalin, hemisected in the midline sagittal plane, embedded in paraffin and stained with hematoxylin-eosin or periodic acid-Schiff.
For β-gal staining, kidneys were fixed in 2.7% formaldehyde, 0.02% NP-40, 0.2% glutaraldehyde in PBS (pH7.4) for 30 min at 4°C and washed. Processing was carried out through a graded series of sucrose concentrations from 15–30% in PBS at 4°C for 5–12 h for each step. Kidneys were then embedded in OCT (Tissue-Tek) and frozen in 2-methyl-butane submerged in liquid nitrogen. Sections (5 or 8 µm thick) were prepared, mounted on slides, washed in PBS for 5 min, and subsequently stained in X-gal solution (1 mg/ml X-gal in DMSO, 2 mm MgCl2, 20 mm potassium ferricyanide, 0.02% NP-40 in PBS), at 37°C overnight. Sections were counterstained with nuclear fast red (Trevigen Inc.).
For immunofluorescence, tissues were fixed in 4% paraformaldehyde in PBS and embedded in OCT. Kidney sections (4–5 µm thick) were blocked with 0.1% BSA/10% goat serum in PBS for 1 h at room temperature and incubated with primary antibodies overnight at 4°C followed by the secondary antibodies for 1 h at room temperature. Images were obtained either with a confocal laser scanning microscope (Zeiss LSM 510) or a Nikon TE2000U inverted microscope microscope equipped for widefield fluorescence and MetaMorph (Universal Imaging) acquisition software. Where noted, images were post-processed with AutoDeblur/AutoVisualize (MediaCybernetics) deconvolution software.
Primary antibodies and lectins used and their respective dilutions: fluorescein labeled L. tetragonolobus lectin (FL-1321, Vector Laboratories), 1:300; rhodamine-Dolichos biflorus agglutinin (RL-1032, Vector Laboratories), 1:300; parvalubumin (MAB1572, Chemicon) 1:1000; Tamm-Horsfall protein (8595–0054, Biotrend Chemicals), 1:200: H+-ATPase [1132dAP2, kind gift of Sylvie Breton (19)] 1:60; AE1 (AB3500P, Chemicon), 1:100; acetylated α-tubulin (T-6793, Sigma); YCC2 (44), 1:500. Secondary antibodies were conjugated to Alexa Fluor 488 and 594 (Molecular Probes) 1:500; pendrin (20). For nuclear counterstaining, slides were incubated propidium iodide (0.5 μg/ml: P-4170, SIGMA) for 5 min after secondary antibody. For analysis of ERK/MAPK signaling, the phospho-ERK1/2 pathway kit (9911, Cell Signaling) was used for MEK/ERK/P90RSK; Raf-1 (9422, Cell Signaling); phosho-(S338)-Raf-1 (9924, Cell Signaling); B-Raf (mAb L12G7, Cell signaling, 9434); phosphor-(Ser445)-B-Raf (2696, Cell Signaling); Ras activity assay kit (17–218, Upstate).
Scanning electron microscopy
Scanning electron microscopy was performed as described previously (45). Briefly, the kidneys of anesthetized mice were perfusion fixed with 3% paraformaldehyde, 3% glutaraldehyde, cut into 2–4 mm sagittal sections and post-fixed in the same fixative for 1 h at 4°C. Tissues were washed in cocodylate buffer, dehydrated, critical point dried, mounted on stubs, sputter coated with PdAu, and visualized on an International Scientific Instruments SS-40 scanning electron microscope.
Proliferation and apoptosis assay
Proliferation was assayed by using BrdU incorporation. Three hours before harvesting the kidneys, mice receive intraperitoneal injection of 100 mg/kg body weight BrdU solution (Catalog# 550891, BD Pharmingen). The kidneys were fixed with 4% paraformaldehyde and embedded in OCT. Sections (4 µm) were cut and BrdU incorporation was detected with anti-BrdU antibody (Catalog# B8434, Sigma) with DAPI nuclear counter stain.
Apoptosis was determined using terminal transferase-mediated fluorescein-dUTP nick end labeling (TUNEL) with the In Situ Cell Death Detection Fluorescein Kit (Roche) as directed by the manufacturer’s instructions.
Cell lines
The generation of conditionally immortalized Pkd2+/− and Pkd2−/− kidney tubule cell lines from mutant mice has been described previously (27). Briefly, two independent Pkd2−/− (5C1, 2D2) and two independent Pkd2+/− (3B3, 2G10) cell lines of proximal tubular origin were derived from non-cystic tubules of a single parental Pkd2WS25/− mouse kidney. The Pkd2−/− cells resulted from the spontaneous ex-vivo conversion of the WS25 allele to a null allele and the Pkd+/− cells resulted from reversion of WS25 to a wild-type allele (33). The generation of Pkd1flox/− and Pkd1−/− cell lines will be described in detail elsewhere (Z.Y. and S.S., in preparation). Briefly, Pkd1 cell lines were derived from a single Pkd1flox/− carrying a conditionally immortalizing, temperature and interferon-γ responsive transgene (H-2Kb-tsA58; ImmortoMouse, Charles River). Pkd1−/− were produced from Pkd1flox/− cells by transient transfection with a plasmid expressing the Cre recombinase. This insures that the respective control and experimental cell lines are genetically identical to each other except for their genotype at Pkd1 (or Pkd2, in the case of the former). Again, two independent cell lines were used for each of the four genotypes to avoid clonal artifacts: Pkd1+/−(PH1, PH3), Pkd1−/− (PN18, PN24). Passage numbers were kept below 20 for all cell lines. Cells were grown for 5–7 days post confluence under non-permissive conditions (37°C, without interferon-γ) to allow complete formation of a polarized phenotype and cilia.
Immunoblotting and densitometry
For immunoblot analyses, fresh kidney tissue or cells were homogenized and lysed in buffer containing 1% NP-40, 50 mm Tris–HCl (pH 7.4), 100 mm NaCl, 10 mm MgCl2 and 1X protein inhibitor cocktail (Roche, #11873580001). Lysates (40 μg of protein/lane) were resolved by SDS–PAGE (10% tris-glycine) and electrophoretically transferred onto PVDF membranes. Membranes were blocked for 1 h (5% dried milk), washed three times with TBS-Tween (0.05%), incubated for 1 h with the primary antibody, washed, incubated for 1 h with horseradish peroxidase-coupled secondary antibody, washed extensively and processed for chemiluminescence by ECL (Amersham, Arlington Heights, IL, USA). The volume of individual immunoblot bands, in pixels, was determined by optical densitometry using ImageQuant software (Molecular Dynamics).
Treatment of mice with MEK1/2 inhibitor
The MEK1/2 inhibitor U0126 (Calbiochem) was administered by intraperitoneal injection every 72 h beginning at P4 and ending either at P9 (160 mg/kg) or P14 (32 mg/kg). The earlier termination for the high dose treatment was required due to toxicity. The vehicle for U0126 administration was DMSO/sunflower seed oil (1:4). To demonstrate effective MEK1/2 inhibition, mice were treated with both the high and low dose U0126 for two doses at P4 and P7 and kidney tissue was harvested 24 h after the last dose (P8) and processed for immunoblot quantitation.
Cystic index
The extent of tubular cyst formation was quantified in sagittal sections of whole kidneys. Four sections (two each from the mid-sagittal region of each kidney) were analyzed for each experimental animal. Whole kidney images were obtained using automated image acquisition by the scan slide module in MetaMorph (Universal Imaging). Total kidney area, total cystic area and total non-cystic area were measured using the integrated morphometry feature in MetaMorph. Cystic index = (total cystic area ÷ total kidney area) × 100 and is expressed as a percent.
Statistics
Data were analyzed by Kruskal–Wallis non-parametrc one-way analysis of variance followed by Dunn’s multiple comparison test. A value of P < 0.05 was considered significant. All data are presented as mean (±SE).
SUPPLEMENTARY MATERIAL
Supplementary Material is available at HMG Online
Conflict of Interest statement. The authors report no conflicts of interest.
FUNDING
This work was supported by grants from the National Institutes of Health (R01DK54053 and P50DK57328 to S.S., and R01DK42921 and R01DK67565 to P.I.). The authors are members of NIH funded Yale Center for the Study of Polycystic Kidney Disease (P50DK57328).
Supplementary Material
REFERENCES
- 1.Nims N., Vassmer D., Maser R.L. Transmembrane domain analysis of polycystin-1, the product of the polycystic kidney disease-1 (PKD1) gene: evidence for 11 membrane-spanning domains. Biochemistry. 2003;42:13035–13048. doi: 10.1021/bi035074c. [DOI] [PubMed] [Google Scholar]
- 2.Hanaoka K., Qian F., Boletta A., Bhunia A.K., Piontek K., Tsiokas L., Sukhatme V.P., Guggino W.B., Germino G.G. Co-assembly of polycystin-1 and -2 produces unique cation-permeable currents. Nature. 2000;408:990–994. doi: 10.1038/35050128. [DOI] [PubMed] [Google Scholar]
- 3.Qian F., Boletta A., Bhunia A.K., Xu H., Liu L., Ahrabi A.K., Watnick T.J., Zhou F., Germino G.G. Cleavage of polycystin-1 requires the receptor for egg jelly domain and is disrupted by human autosomal-dominant polycystic kidney disease 1-associated mutations. Proc. Natl. Acad. Sci. USA. 2002;99:16981–16986. doi: 10.1073/pnas.252484899. [DOI] [PMC free article] [PubMed] [Google Scholar]
- 4.Nauli S.M., Alenghat F.J., Luo Y., Williams E., Vassilev P., Li X., Elia A.E., Lu W., Brown E.M., Quinn S.J., et al. Polycystins 1 and 2 mediate mechanosensation in the primary cilium of kidney cells. Nat. Genet. 2003;33:129–137. doi: 10.1038/ng1076. [DOI] [PubMed] [Google Scholar]
- 5.Ishimaru Y., Inada H., Kubota M., Zhuang H., Tominaga M., Matsunami H. Transient receptor potential family members PKD1L3 and PKD2L1 form a candidate sour taste receptor. Proc. Natl. Acad. Sci. USA. 2006;103:12569–12574. doi: 10.1073/pnas.0602702103. [DOI] [PMC free article] [PubMed] [Google Scholar]
- 6.Torres V.E., Harris P.C. Mechanisms of Disease: autosomal dominant and recessive polycystic kidney diseases. Nat. Clin. Pract. Nephrol. 2006;2:40–55. doi: 10.1038/ncpneph0070. [DOI] [PubMed] [Google Scholar]
- 7.Somlo S., Torres V.E., Caplan M.J. In: Seldin and Giebisch’s The Kidney: Physiology & Pathophysiology. Alpern R.J., Hebert S.C., editors. Academic Press; 2007. pp. 2283–2314. [Google Scholar]
- 8.Lu W., Peissel B., Babakhanlou H., Pavlova A., Geng L., Fan X., Larson C., Brent G., Zhou J. Perinatal lethality with kidney and pancreas defects in mice with a targetted Pkd1 mutation. Nat. Genet. 1997;17:179–181. doi: 10.1038/ng1097-179. [DOI] [PubMed] [Google Scholar]
- 9.Kim K., Drummond I., Ibraghimov-Beskrovnaya O., Klinger K., Arnaout M.A. Polycystin 1 is required for the structural integrity of blood vessels. Proc. Natl. Acad. Sci. USA. 2000;97:1731–1736. doi: 10.1073/pnas.040550097. [DOI] [PMC free article] [PubMed] [Google Scholar]
- 10.Boulter C., Mulroy S., Webb S., Fleming S., Brindle K., Sandford R. Cardiovascular, skeletal, and renal defects in mice with a targeted disruption of the Pkd1 gene. Proc. Natl. Acad. Sci. U. S. A. 2001;98:12174–12179. doi: 10.1073/pnas.211191098. [DOI] [PMC free article] [PubMed] [Google Scholar]
- 11.Wu G., Tian X., Nishimura S., Markowitz G.S., D’Agati V., Hoon P.J., Yao L., Li L., Geng L., Zhao H., et al. Trans-heterozygous Pkd1 and Pkd2 mutations modify expression of polycystic kidney disease. Hum. Mol. Genet. 2002;11:1845–1854. doi: 10.1093/hmg/11.16.1845. [DOI] [PubMed] [Google Scholar]
- 12.Piontek K.B., Huso D.L., Grinberg A., Liu L., Bedja D., Zhao H., Gabrielson K., Qian F., Mei C., Westphal H., Germino G.G. A functional floxed allele of Pkd1 that can be conditionally inactivated in vivo. J. Am. Soc. Nephrol. 2004;15:3035–3043. doi: 10.1097/01.ASN.0000144204.01352.86. [DOI] [PubMed] [Google Scholar]
- 13.Lantinga-van L.I., Leonhard W.N., van der W.A., Breuning M.H., de H.E., Peters D.J. Kidney-specific inactivation of the Pkd1 gene induces rapid cyst formation in developing kidneys and a slow onset of disease in adult mice. Hum. Mol. Genet. 2007;16:3188–3196. doi: 10.1093/hmg/ddm299. [DOI] [PubMed] [Google Scholar]
- 14.Lantinga-van Leeuwen I.S., Dauwerse J.G., Baelde H.J., Leonhard W.N., van de Wal A., Ward C.J., Verbeek S., Deruiter M.C., Breuning M.H., de Heer E., Peters D.J. Lowering of Pkd1 expression is sufficient to cause polycystic kidney disease. Hum. Mol. Genet. 2004;13:3069–3077. doi: 10.1093/hmg/ddh336. [DOI] [PubMed] [Google Scholar]
- 15.Jiang S.T., Chiou Y.Y., Wang E., Lin H.K., Lin Y.T., Chi Y.C., Wang C.K., Tang M.J., Li H. Defining a link with autosomal-dominant polycystic kidney disease in mice with congenitally low expression of Pkd1. Am. J. Pathol. 2006;168:205–220. doi: 10.2353/ajpath.2006.050342. [DOI] [PMC free article] [PubMed] [Google Scholar]
- 16.Rodriguez C.I., Buchholz F., Galloway J., Sequerra R., Kasper J., Ayala R., Stewart A.F., Dymecki S.M. High-efficiency deleter mice show that FLPe is an alternative to Cre-loxP. Nat. Genet. 2000;25:139–140. doi: 10.1038/75973. [DOI] [PubMed] [Google Scholar]
- 17.Shao X., Somlo S., Igarashi P. Epithelial-Specific Cre/lox Recombination in the Developing Kidney and Genitourinary Tract. J. Am. Soc. Nephrol. 2002;13:1837–1846. doi: 10.1097/01.asn.0000016444.90348.50. [DOI] [PubMed] [Google Scholar]
- 18.Shao X., Johnson J.E., Richardson J.A., Hiesberger T., Igarashi P. A minimal Ksp-cadherin promoter linked to a green fluorescent protein reporter gene exhibits tissue-specific expression in the developing kidney and genitourinary tract. J. Am. Soc. Nephrol. 2002;13:1824–1836. doi: 10.1097/01.asn.0000016443.50138.cd. [DOI] [PubMed] [Google Scholar]
- 19.Breton S., Wiederhold T., Marshansky V., Nsumu N.N., Ramesh V., Brown D. The B1 subunit of the H+ATPase is a PDZ domain-binding protein. Colocalization with NHE-RF in renal B-intercalated cells. J. Biol. Chem. 2000;275:18219–18224. doi: 10.1074/jbc.M909857199. [DOI] [PubMed] [Google Scholar]
- 20.Knauf F., Yang C.L., Thomson R.B., Mentone S.A., Giebisch G., Aronson P.S. Identification of a chloride-formate exchanger expressed on the brush border membrane of renal proximal tubule cells. Proc. Natl. Acad. Sci. USA. 2001;98:9425–9430. doi: 10.1073/pnas.141241098. [DOI] [PMC free article] [PubMed] [Google Scholar]
- 21.Constien R., Forde A., Liliensiek B., Grone H.J., Nawroth P., Hammerling G., Arnold B. Characterization of a novel EGFP reporter mouse to monitor Cre recombination as demonstrated by a Tie2 Cre mouse line. Genesis. 2001;30:36–44. doi: 10.1002/gene.1030. [DOI] [PubMed] [Google Scholar]
- 22.LeFurgey A., Tisher C.C. Morphology of rabbit collecting duct. Am. J. Anat. 1979;155:111–124. doi: 10.1002/aja.1001550108. [DOI] [PubMed] [Google Scholar]
- 23.Clapp W.L., Madsen K.M., Verlander J.W., Tisher C.C. Morphologic heterogeneity along the rat inner medullary collecting duct. Lab. Invest. 1989;60:219–230. [PubMed] [Google Scholar]
- 24.Nagao S., Yamaguchi T., Kusaka M., Maser R.L., Takahashi H., Cowley B.D., Grantham J.J. Renal activation of extracellular signal-regulated kinase in rats with autosomal-dominant polycystic kidney disease. Kidney Int. 2003;63:427–437. doi: 10.1046/j.1523-1755.2003.00755.x. [DOI] [PubMed] [Google Scholar]
- 25.Omori S., Hida M., Fujita H., Takahashi H., Tanimura S., Kohno M., Awazu M. Extracellular signal-regulated kinase inhibition slows disease progression in mice with polycystic kidney disease. J. Am. Soc. Nephrol. 2006;17:1604–1614. doi: 10.1681/ASN.2004090800. [DOI] [PubMed] [Google Scholar]
- 26.Yamaguchi T., Pelling J.C., Ramaswamy N.T., Eppler J.W., Wallace D.P., Nagao S., Rome L.A., Sullivan L.P., Grantham J.J. cAMP stimulates the in vitro proliferation of renal cyst epithelial cells by activating the extracellular signal-regulated kinase pathway. Kidney Int. 2000;57:1460–1471. doi: 10.1046/j.1523-1755.2000.00991.x. [DOI] [PubMed] [Google Scholar]
- 27.Grimm D.H., Cai Y., Chauvet V., Rajendran V., Zeltner R., Geng L., Avner E.D., Sweeney W., Somlo S., Caplan M.J. Polycystin-1 distribution is modulated by polycystin-2 expression in mammalian cells. J. Biol. Chem. 2003;278:36786–36793. doi: 10.1074/jbc.M306536200. [DOI] [PubMed] [Google Scholar]
- 28.Shukla V., Coumoul X., Wang R.H., Kim H.S., Deng C.X. RNA interference and inhibition of MEK-ERK signaling prevent abnormal skeletal phenotypes in a mouse model of craniosynostosis. Nat. Genet. 2007;39:1145–1150. doi: 10.1038/ng2096. [DOI] [PubMed] [Google Scholar]
- 29.Jo S.K., Cho W.Y., Sung S.A., Kim H.K., Won N.H. MEK inhibitor, U0126, attenuates cisplatin-induced renal injury by decreasing inflammation and apoptosis. Kidney Int. 2005;67:458–466. doi: 10.1111/j.1523-1755.2005.67102.x. [DOI] [PubMed] [Google Scholar]
- 30.Tibbles L.A., Spurrell J.C., Bowen G.P., Liu Q., Lam M., Zaiss A.K., Robbins S.M., Hollenberg M.D., Wickham T.J., Muruve D.A. Activation of p38 and ERK signaling during adenovirus vector cell entry lead to expression of the C-X-C chemokine IP-10. J. Virol. 2002;76:1559–1568. doi: 10.1128/JVI.76.4.1559-1568.2002. [DOI] [PMC free article] [PubMed] [Google Scholar]
- 31.Nishio S., Hatano M., Nagata M., Horie S., Koike T., Tokuhisa T., Mochizuki T. Pkd1 regulates immortalized proliferation of rean tubular epithelial cells through p53 induction and JNK activation. J. Clin. Invest. 2005;115:910–918. doi: 10.1172/JCI22850. [DOI] [PMC free article] [PubMed] [Google Scholar]
- 32.Holthofer H., Kumpulainen T., Rapola J. Polycystic disease of the kidney. Evaluation and classification based on nephron segment and cell-type specific markers. Lab. Invest. 1990;62:363–369. [PubMed] [Google Scholar]
- 33.Wu G., D’Agati V., Cai Y., Markowitz G., Park J.H., Reynolds D.M., Maeda Y., Le T.C., Hou H.J., Kucherlapati R., et al. Somatic inactivation of Pkd2 results in polycystic kidney disease. Cell. 1998;93:177–188. doi: 10.1016/s0092-8674(00)81570-6. [DOI] [PubMed] [Google Scholar]
- 34.Torres V.E., Wang X., Qian Q., Somlo S., Harris P.C., Gattone V.H. Effective treatment of an orthologous model of autosomal dominant polycystic kidney disease. Nat. Med. 2004;10:363–364. doi: 10.1038/nm1004. [DOI] [PubMed] [Google Scholar]
- 35.Godley L.A., Kopp J.B., Eckhaus M., Paglino J.J., Owens J., Varmus H.E. Wild-type p53 transgenic mice exhibit altered differentiation of the ureteric bud and possess small kidneys. Genes Dev. 1996;10:836–850. doi: 10.1101/gad.10.7.836. [DOI] [PubMed] [Google Scholar]
- 36.Davenport J.R., Watts A.J., Roper V.C., Croyle M.J., van Groen T., Wyss J.M., Nagy T.R., Kesterson R.A., Yoder B.K. Disruption of intraflagellar transport in adult mice leads to obesity and slow-onset cystic kidney disease. Curr. Biol. 2007;17:1586–1594. doi: 10.1016/j.cub.2007.08.034. [DOI] [PMC free article] [PubMed] [Google Scholar]
- 37.Yamaguchi T., Nagao S., Wallace D.P., Belibi F.A., Cowley B.D., Pelling J.C., Grantham J.J. Cyclic AMP activates B-Raf and ERK in cyst epithelial cells from autosomal-dominant polycystic kidneys. Kidney Int. 2003;63:1983–1994. doi: 10.1046/j.1523-1755.2003.00023.x. [DOI] [PubMed] [Google Scholar]
- 38.Ishibe S., Joly D., Zhu X., Cantley L.G. Phosphorylation-dependent paxillin-ERK association mediates hepatocyte growth factor-stimulated epithelial morphogenesis. Mol. Cell. 2003;12:1275–1285. doi: 10.1016/s1097-2765(03)00406-4. [DOI] [PubMed] [Google Scholar]
- 39.Joly D., Ishibe S., Nickel C., Yu Z., Somlo S., Cantley L.G. The polycystin 1-C-terminal fragment stimulates ERK-dependent spreading of renal epithelial cells. J. Biol. Chem. 2006;281:26329–26339. doi: 10.1074/jbc.M601373200. [DOI] [PubMed] [Google Scholar]
- 40.Grimm D.H., Karihaloo A., Cai Y., Somlo S., Cantley L.G., Caplan M.J. Polycystin-2 regulates proliferation and branching morphogenesis in kidney epithelial cells. J. Biol. Chem. 2006;281:137–144. doi: 10.1074/jbc.M507845200. [DOI] [PubMed] [Google Scholar]
- 41.Yamaguchi T., Wallace D.P., Magenheimer B.S., Hempson S.J., Grantham J.J., Calvet J.P. Calcium restriction allows cAMP activation of the B-Raf/ERK pathway, switching cells to a cAMP-dependent growth-stimulated phenotype. J. Biol. Chem. 2004;279:40419–40430. doi: 10.1074/jbc.M405079200. [DOI] [PubMed] [Google Scholar]
- 42.Favata M.F., Horiuchi K.Y., Manos E.J., Daulerio A.J., Stradley D.A., Feeser W.S., Van Dyk D.E., Pitts W.J., Earl R.A., Hobbs F., et al. Identification of a novel inhibitor of mitogen-activated protein kinase kinase. J. Biol. Chem. 1998;273:18623–18632. doi: 10.1074/jbc.273.29.18623. [DOI] [PubMed] [Google Scholar]
- 43.Meyers E.N., Lewandoski M., Martin G.R. An Fgf8 mutant allelic series generated by Cre- and Flp-mediated recombination. Nat. Genet. 1998;18:136–141. doi: 10.1038/ng0298-136. [DOI] [PubMed] [Google Scholar]
- 44.Cai Y., Maeda Y., Cedzich A., Torres V.E., Wu G., Hayashi T., Mochizuki T., Park J.H., Witzgall R., Somlo S. Identification and characterization of polycystin-2, the PKD2 gene product. J. Biol. Chem. 1999;274:28557–28565. doi: 10.1074/jbc.274.40.28557. [DOI] [PubMed] [Google Scholar]
- 45.Thomson R.B., Mentone S., Kim R., Earle K., Delpire E., Somlo S., Aronson P.S. Histopathological analysis of renal cystic epithelia in the Pkd2WS25/- mouse model of ADPKD. Am. J. Physiol. Renal Physiol. 2003;285:F870–F880. doi: 10.1152/ajprenal.00153.2003. [DOI] [PubMed] [Google Scholar]
Associated Data
This section collects any data citations, data availability statements, or supplementary materials included in this article.