Abstract
Rifampicin-loaded nanoparticles were prepared using two different molecular weights of poly-(ethylene oxide)-block-distearoyl phosphatidyl-ethanolamine (mPEG2000–DSPE and mPEG5000–DSPE) polymers. Particle sizes of all formulations studied were in the range of 162–395 nm. The entrapment efficiency (EE) was not affected by the copolymer’s molecular weight, and the highest EE (100%) was obtained with drug to copolymer ratio of 1:5. The differential scanning calorimetry (DSC) thermograms showed Tg of rifampicin-loaded PEG–DSPE nanoparticles that shifted to a lower value, indicating entrapment of rifampicin in polymer matrix. The Fourier transformed infrared spectra revealed no chemical interactions between the drug and both copolymers. The in vitro drug release from the formulations occurred over 3 days and followed first-order release kinetic and Higuchi diffusion model. The nebulization of rehydrated lyophilized rifampicin mPEG–DSPE formulations had mass median aerodynamic diameter of 2.6 µm and fine particle fraction of 42%. The aerodynamic characteristic of the preparations was not influenced by the molecular weight of the copolymers. Therefore, it is suggested that both mPEG–DSPE are promising candidates as rifampicin carrier for pulmonary delivery.
Key words: mPEG–DSPE polymer, nebulization, rifampicin
INTRODUCTION
Tuberculosis (TB) is an infectious disease that is caused by Mycobacterium tuberculosis. TB infected about 2 billion people worldwide and is responsible for causing 1.6 million deaths (1). Despite the availability of effective therapeutic regimens for TB treatment, failure of drug therapy and emergence of drug resistance are still problematic. This treatment failure is related in part to patient non-compliance, because TB treatment involves administering multiple drugs daily for several months (2). Patient compliance can be improved by the use of sustained release antitubercular drug formulations, which reduce the dosing frequency of the drugs. Such system can be designed to target specific regions of the lung and therefore allow controlled drug delivery to the lung or to the systemic circulation via the lung (3,4).
Rifampicin is an antibiotic that is mainly used for the treatment of tuberculosis, leprosy, prophylaxis of meningococcal meningitis, and Haemophilus influenzae infection. Rifampicin is one of the first-line drugs recommended by the World Health Organization in the treatment of tuberculosis despite of the drawbacks of poor bioavailability and short biological half-life (5,6). In order to overcome the problems of poor absorption, fast degradation, and adverse side effects of rifampicin, many researchers have concentrated their attention in the development of controlled-release rifampicin formulations (7–11). PEG–DSPE conjugate polymers have been studied in an attempt to achieve sustained release of drug (12–14). The mechanisms of drug release were found to be either directly from the micelles by diffusion or due to the dissociation of the micelles into free polymeric chains and hydrolysis of the liable bonds (15–17).
Pulmonary tract is an attractive route for administration of drugs, because the lungs have a large surface area for drug absorption (18), low enzymatic metabolism, and absence of the first-pass metabolism (19,20). Therefore, targeting rifampicin to the alveolar macrophages in micro- and nanoparticle sizes in aerosol dosage form is deemed to be a recent approach to TB therapy. Aerosolized microparticles will deposit on the lung periphery, where they can be ingested by the alveolar macrophages and exert their actions. Moreover, delivering the drug directly to the lungs can increase absorption and bioavailability and decrease the dose and hence reduce side effects as compared to systemic administration (21,22).
The objective of this study was to evaluate the potential of biodegradable poly-(ethylene oxide)-block–distearoyl phosphatidyl-ethanolamine of different molecular weight (mPEG2000–DSPE and mPEG5000–DSPE) as rifampicin carrier for pulmonary delivery. The lyophilized preparations were rehydrated and nebulized using a Pari LC Plus nebulizer. The size distribution of aerosolized particles was measured using a Next Generation Cascade Impactor (NGI).
MATERIALS
Poly-(ethylene oxide)-block–distearoyl phosphatidyl-ethanolamine (mPEG2000–DSPE and mPEG5000–DSPE) was purchased from NOF Corporation, Tokyo, Japan. Rifampicin was obtained from Sigma, Aldrich, USA. Methanol was purchased from J.T. Baker, Canada. Potassium dihydrogen orthophosphate and disodium hydrogen orthophosphate were purchased from BHD, England. Sodium azide and ascorbic acid were obtained from Sigma, Germany. All other chemicals were of analytical grade and used as purchased.
METHODS
Preparation of Rifampicin-Loaded mPEG–DSPE Nanoparticles
Various formulations were prepared using mPEG2000–DSPE (MW 2774) and mPEG5000–DSPE (5774); 0.5% w/v of mPEG–DSPE stock solution and 0.05% w/v of rifampicin stock solution were first prepared using methanol. Then, known volumes of the two stock solutions were taken, and the final volume was adjusted with methanol. The solution was subsequently transferred to a round bottom flask, and the methanol was evaporated to dryness under vacuum at 40°C using a rotary evaporator (Büchi-Rotavapor, Switzerland). Ten milliliter of distilled water was added to dissolve the drug/copolymer film in the round bottom flask. The aqueous solution was then incubated at 40°C for 10 min and vortexed for 30 s. The micellar solution was filtered using PTFE membrane filter (0.22 and 0.45 µm) to remove non-entrapped rifampicin and lyophilized (Labconco 7753501, USA). The lyophilized samples were kept in the freezer till further analysis.
Determination of Yield, Drug Loading, and Entrapment Efficiency
Known amount of drug-loaded nanoparticles was dissolved in 4 ml of methanol and water mixture (1:1, v/v). The concentration of rifampicin in the samples was quantified using UV spectrophotometery (Hitachi, Japan) at a wavelength of 334 nm. The analysis was carried out in triplicate for each batch of drug-loaded nanoparticles. The yield, drug loading, and entrapment efficiency were calculated using the following equations:
 |
1 |
 |
2 |
 |
3 |
where DL is the drug loading and EE is the entrapment efficiency (%).
Particle Size Measurement
The mean particle size and size distribution of rifampicin nanoparticles were determined by photon correlation spectroscopy using a Zetasizer 1000HS (Malvern Instrument, UK). Cyclohexane, with a reflective index of 1.42 and dynamic viscosity of 0.91, was chosen as the suitable solvent for suspending the samples. Samples were suspended in cyclohexane containing 1% w/v of Span 80 and sonicated for 1 min before particle size analysis. Three replicate measurements were made for each sample. The Span 80 was used to reduce aggregation of particles. The mean Z average particle diameter and polydispersity index were obtained using Malvern Software System.
Differential Scanning Calorimetry Analysis
Thermal analysis of rifampicin, copolymers, physical mixture of rifampicin and copolymer were carried out using a differential scanning calorimeter (Perkin Elmer, Pyris 6, UK). The instrument was calibrated at a temperature range of 25–250°C and at a heating and cooling rate of 10°C/min using indium. Samples of 5 mg were weighed accurately and sealed in aluminum pans. An empty aluminum pan was used as a reference sample. The reference and sample pans were placed in the DSC furnace, which had been pre-equilibrated and held at 25°C for 1 min before each measurement. All the experiments were carried out under nitrogen atmosphere at a flow rate of 20 ml/min. All samples were scanned at 10°C/min from 25°C to 200°C. All the determinations were performed in triplicate.
Fourier Transformed Infrared Spectroscopy Analysis
Fourier transformed infrared (FTIR) analysis (Nicolet, Impact 410, USA) was carried out to check for any chemical interaction between drug and copolymer. Approximately 2 mg of sample and 18 mg of KBr powder were ground using mortar and pestle. The homogenous mixture was compressed at a compaction force of 16 tons cm−2 and holding for 2 min to obtain a KBr film disc using IR hydraulic press pump (Backman PIG, UK). Sixteen scans were collected for each sample in the region 400–4,000 cm−1 at a resolution of 2 cm−1. The obtained spectra were analyzed using Omnic software (Thermo Nicolet, USA).
In Vitro Drug Release
Phosphate buffer solution (PBS; pH 7) was prepared by dissolving anhydrous disodium phosphate (0.50 g) and potassium dihydrogen orthophosphate (0.301 g) in 1,000 ml of water. Sodium azide (0.02%) and ascorbic acid (0.02%) were added to the PBS solution to prevent microbial growth and degradation of released rifampicin. A known amount of rifampicin powder, lyophilized rifampicin-loaded mPEG–DSPE, was accurately weighed and dispersed in 5 ml of PBS and transferred into a 5-cm dialysis tube (Visking, size 4-22/32, UK). Both ends of the dialysis tube were sealed securely with the tubing closures, and the tube was placed in a glass beaker containing 150 ml of PBS. The glass beaker was covered with laboratory parafilm and horizontally shaken (100 rpm) in a thermostatic water bath (Memmrete, Germany) at 37 ± 0.5°C. At predetermined time intervals, 0.3-ml samples were withdrawn from the beaker and mixed with 2 ml of PBS. The amount of rifampicin released was quantified at 236 nm using UV spectrophotometry method (Hitach, Japan). Triplicate determinations were carried out for each sample.
Characterization of Aerosols Generated by Nebulizer
The particle size distribution was determined using a NGI (Copley, UK). A vacuum pump was connected to NGI and operated at a flow rate of 30 ml/min. The flow rate was calibrated using a flow meter (Copley, UK). The Pari LC Plus nebulizer (Germany) was filled with 8 ml of rehydrated lyophilized rifampicin- mPEG–DSPE formulations, and compressed air from the Pari Master pump (Pari Master, Germany) was supplied to the nebulizer. Nebulization of samples was carried out for 15 min at room temperature (28°C) and a humidity of 65%. The amounts of rifampicin that remained in the nebulizer and deposited in the each stage of cascade impactor were determined by UV spectrophotometer (Hitachi, Japan) at a wavelength of 236 nm. Each measurement was repeated four times to determine the variability in the method.
The mass median aerodynamic diameter (MMAD) and geometric standard deviation (GSD) were calculated using Eqs. 4 and 5, after plotting the cumulative amount of drug deposited in each stage of the cascade impactor versus their corresponding aerodynamic diameter as specified by the cascade impactor using a log-probability paper (23). Emitted dose (ED) and fine particle fraction (FPF) size < 3.9 µm were calculated using Eqs. 6 and 7.
 |
4 |
 |
5 |
 |
6 |
 |
7 |
Statistical Data Analysis
The results of the studies were treated statistically using PC softwares Microsoft Excel and SPSS (Version 11). One-way ANOVA test and post hoc Scheffe’s test were applied, where appropriate. A statistically significant difference was considered when p < 0.05.
RESULTS AND DISCUSSION
Yield, Drug Loading, and Entrapment Efficiency
Results in Table I show that the drug yield varies from 69.7% to 93.1%, drug loading in the range of 10.7% to 19.5%, and entrapment efficiency between 83.5% and 103.9%. It was observed that when the weight ratio and filter porosity were kept constant, variation in the type of mPEG–DSPE used did not have statistically significant difference (p > 0.05) in the drug yield, loading, and entrapment efficiency. Similarly, when the weight ratio and type of copolymer were kept constant, variation in the porosity of filter used also did not have a statistically significant difference (p > 0.05) in the drug yield, loading, and entrapment efficiency. Furthermore, varying the drug to polymer weight ratios and keeping the type of polymer and filter porosity constant, there was a significant difference in the drug loading and entrapment efficiency at the ratios of 1:5, 1:10, and 1.5:10. The result from this study was in line with the Hu et al. (24) finding, which reported that the molecular weight of polymer has little effect on drug entrapment. The authors found that drug entrapment depended more on the copolymer composition rather than the copolymer chain length. They argued that drug entrapment is rather a complicated process and is affected by a combination of many factors, such as molecular weight, the ratio of hydrophobic segment to hydrophilic segment, and crystallinity of the polymer.
Table I.
Physical Characterization of Rifampicin-Loaded mPEG–DSPE Nanoparticles
| Formula code | Copolymer type | Filter porosity (μm) | Rifampicin conc. (mg/ml) | Drug/PEG–DSPE weight ratio (w/w) | Nanoparticles yield (% w/w) | Drug loading (% w/w) | Entrapment efficiency (% w/w) |
|---|---|---|---|---|---|---|---|
| F2 | mPEG2000–DSPE | 0.45 | 0.2 | (1:5) | 89.42 ± 4.19 | 19.30 ± 0.04 | 103.55 ± 0.19 |
| F3 | mPEG2000–DSPE | 0.45 | 0.2 | (1:10) | 77.42 ± 2.52 | 11.40 ± 0.22 | 97.06 ± 1.87 |
| F4 | mPEG2000–DSPE | 0.45 | 0.3 | (1.5:10) | 75.03 ± 1.76 | 14.52 ± 0.48 | 83.54 ± 2.79 |
| F5 | mPEG2000–DSPE | 0.22 | 0.2 | (1:5) | 86.23 ± 8.66 | 19.58 ± 0.45 | 101.89 ± 2.34 |
| F6 | mPEG2000–DSPE | 0.22 | 0.2 | (1:10) | 69.81 ± 1.69 | 12.56 ± 0.46 | 96.32 ± 3.49 |
| F7 | mPEG2000–DSPE | 0.22 | 0.3 | (1.5:10) | 71.00 ± 0.97 | 15.95 ± 0.44 | 86.84 ± 2.42 |
| F8 | mPEG5000–DSPE | 0.45 | 0.2 | (1:5) | 93.19 ± 1.57 | 18.65 ± 0.03 | 103.97 ± 0.14 |
| F9 | mPEG5000–DSPE | 0.45 | 0.2 | (1:10) | 82.26 ± 0.38 | 10.72 ± 0.03 | 97.38 ± 0.26 |
| F10 | mPEG5000–DSPE | 0.45 | 0.3 | (1.5:10) | 78.61 ± 3.16 | 14.33 ± 0.32 | 86.33 ± 1.95 |
| F11 | mPEG5000–DSPE | 0.22 | 0.2 | (1:5) | 86.93 ± 8.97 | 19.58 ± 0.99 | 100.26 ± 5.07 |
| F12 | mPEG5000–DSPE | 0.22 | 0.2 | (1:10) | 73.17 ± 1.24 | 12.18 ± 0.24 | 97.85 ± 1.92 |
| F13 | mPEG5000–DSPE | 0.22 | 0.3 | (1.5:10) | 73.39 ± 0.91 | 15.18 ± 0.98 | 85.09 ± 5.47 |
Mean ± SD; N = 3
Particle Size
Kreuter et al. (25) defined nanoparticles as solid colloidal particles having size between 10 and 1,000 nm. Lyophilized formulations of F2 to F13 were dispersed in cyclohexane instead of distilled water for measurement of particle size. As a result, the measurement is not representing the size of micelles in the water, but the actual size of the lyophilized particles. In general, the sizes of all the formulations studied varied from 162.9 to 395.6 nm and having polydispersity values of less than 1 (Table II). Nanoparticles prepared using mPEG2000–DSPE was significantly larger than those with mPEG5000–DSPE (p < 0.05). The size of mPEG2000–DSPE nanoparticles (F2 to F7) varied from 225.7 to 395.6 nm, while those of mPEG5000–DSPE (F8 to F13) were from 162.9 to 232.5 nm. In addition, 0.45-µm membrane filter produced relatively larger particle size than the 0.22-µm membrane filter for both copolymers at all the weight ratios studied (p < 0.05). For example, the size of the nanoparticles using filter porosity of 0.45 µm ranged from 210.6 to 395.6 nm, in comparison the size of nanoparticles produced using a filter porosity of 0.22 µm that ranged from 162.9 to 318.0 nm. It was observed that nanoparticle size decreased with an increase of PEG content in the copolymer composition. This is due to the characteristic of amphiphilic copolymer micelles that the fewer the hydrophobic component, the smaller the micelles. The finding was in agreement with the result of Hu et al. (24).
Table II.
The Mean Diameter Particle Size and Polydispersity of Rifampicin-Loaded mPEG–DSPE Nanoparticles
| Formula code | Copolymer type | Filter porosity (μm) | Rifampicin conc. (mg/ml) | Drug/copolymer weight ratio (w/w) | Mean diameter (nm) | Polydispersity |
|---|---|---|---|---|---|---|
| F2 | mPEG2000–DSPE | 0.45 | 0.2 | (1:5) | 235.73 ± 84 | 0.73 ± 0.05 |
| F3 | mPEG2000–DSPE | 0.45 | 0.2 | (1:10) | 258.06 ± 74 | 0.86 ± 0.13 |
| F4 | mPEG2000–DSPE | 0.45 | 0.3 | (1.5:10) | 395.63 ± 14 | 0.55 ± 0.05 |
| F5 | mPEG2000–DSPE | 0.22 | 0.2 | (1:5) | 225.70 ± 3.8 | 0.55 ± 0.06 |
| F6 | mPEG2000–DSPE | 0.22 | 0.2 | (1:10) | 247.53 ± 24 | 0.54 ± 0.05 |
| F7 | mPEG2000–DSPE | 0.22 | 0.3 | (1.5:10) | 318.06 ± 11 | 0.55 ± 0.06 |
| F8 | mPEG5000–DSPE | 0.45 | 0.2 | (1:5) | 210.66 ± 13 | 0.48 ± 0.05 |
| F9 | mPEG5000–DSPE | 0.45 | 0.2 | (1:10) | 231.63 ± 4.3 | 0.57 ± 0.10 |
| F10 | mPEG5000–DSPE | 0.45 | 0.3 | (1.5:10) | 232.56 ± 7.1 | 0.61 ± 0.01 |
| F11 | mPEG5000–DSPE | 0.22 | 0.2 | (1:5) | 162.96 ± 36 | 0.60 ± 0.05 |
| F12 | mPEG5000–DSPE | 0.22 | 0.2 | (1:10) | 186.23 ± 19 | 0.63 ± 0.06 |
| F13 | mPEG5000–DSPE | 0.22 | 0.3 | (1.5:10) | 194.03 ± 10 | 0.62 ± 0.02 |
Mean ± SD; N = 3
DSC
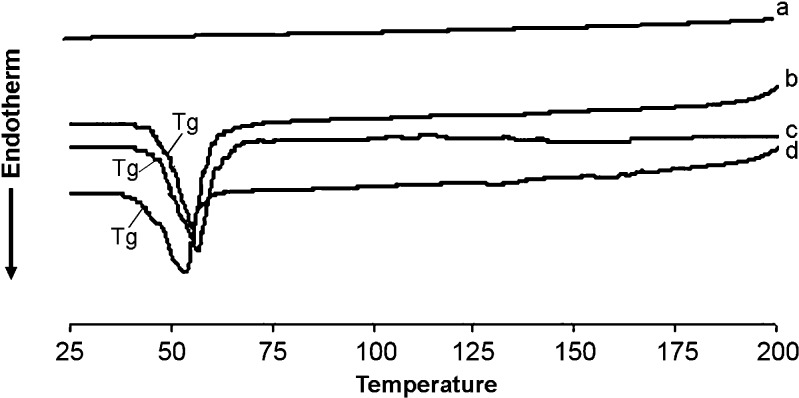
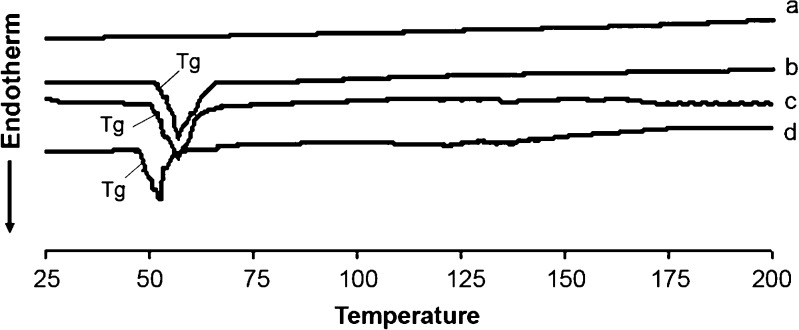
Few studies have deeply investigated the thermodynamic characteristics (endothermic, exothermic, and phase transition) of mixed rifampicin mPEG–DSPE at different temperatures and intermolecular interaction between rifampicin and mPEG–DSPE, which may be important in understanding the intrinsic properties of these PEG-linked lipids (26). There were no endo- and exothermic peaks observed in the thermograms of rifampicin (Figs. 1 and 2). The Tg samples of mPEG2000–DSPE and physical mixture (rifampicin and polymer) have similar Tg peaks at about 52.5°C, but the Tg peak for drug-loaded nanoparticles was shifted down to 48.8°C (Fig. 1). Similarly, Tg peaks for samples of mPEG5000–DSPE and physical mixture were about 55.5°C, but the Tg peak for drug-loaded nanoparticles was again shifted down to 50.8°C (Fig. 2). There was no exothermic peak observed in the thermograms of both drug-loaded nanoparticles and physical mixture of drug and copolymer. DSC results indicated that physical mixing of drug and copolymer did not affect the copolymer structure. In contrast, drug-loaded polymeric nanoparticles caused a slight downward shift of the endothermic peak of the copolymer, which indicated that there was physical interaction between rifampicin and copolymer. The interaction suggested that the drug might molecularly disperse in the copolymer matrix. Zhang et al. (27) showed that Tg of DSC analysis of taxol-loaded polymeric nanoparticles were lower than that of polymeric blanks, which suggested that the downward peak shift might be an indication of the drug either molecularly dispersed in the polymers or distributed in the polymer in an amorphous state. Other authors also reported that Tg shifted to lower values when beclomethasone dipropionated was encapsulated in liposomes (28) or dispersed in polymer matrix (12).
Fig. 1.
DSC thermograms showing Tg of (a) rifampicin powder, (b) blank mPEG2000–DSPE, (c) physical mixture of rifampicin and mPEG2000–DSPE polymer, and (d) rifampicin-loaded mPEG2000–DSPE nanoparticles
Fig. 2.
DSC thermograms showing Tg of (a) rifampicin powder, (b) blank mPEG5000–DSPE, (c) physical mixture of rifampicin and mPEG5000–DSPE polymer, and (d) rifampicin-loaded mPEG5000–DSPE nanoparticles
FTIR
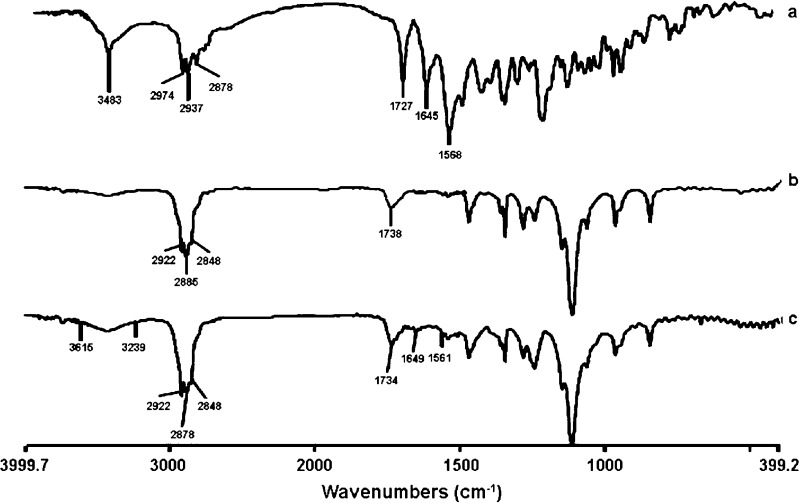
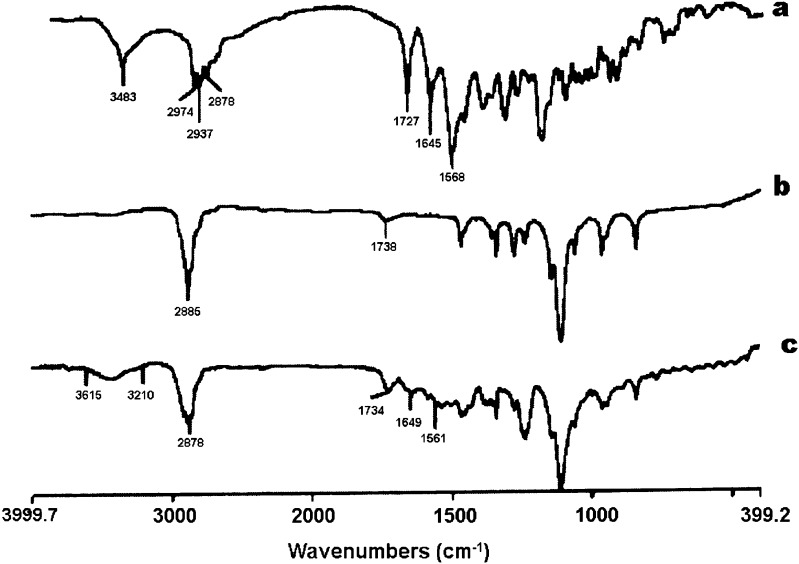
The result of the FTIR indicated that rifampicin (as purchased) showed a sharp peak at 3,483 cm−1 corresponding to OH, N–CH3 band at around 2,878 cm−1, characteristic absorption band at about 1,727 cm−1 for acetyl C═O, sharp peaks at 1,645 and 1568 cm−1 representing the furanone C═O and amide C═O group, respectively. The FTIR result indicated that the purchased rifampicin was in the crystalline form I state. Agrawal et al. (29) reported using the IR spectrum as a qualitative tool for identifying the crystalline and amorphous forms of rifampicin. The FTIR of both mPEG2000–DSPE and mPEG5000–DSPE showed a characteristic carbonyl ketone band at 1,738 cm−1, but CH alkyl stretching band at 2,922 and at 2,848 cm−1 for mPEG2000–DSPE, while a characteristic sharp peak was observed at 2,885 cm−1 for mPEG5000–DSPE (Figs. 3 and 4). The carbonyl furanone and carbonyl amide of rifampicin were also evident in the drug-loaded mPEG–DSPE nanopaticles without major shift, indicating that there was no chemical interaction between the drug and copolymer. However, the peak sizes were smaller that could be due to smaller amount of rifampicin entrapped in the polymer matrix. A similar finding was also reported by Gaber et al. (12) in the beclomethasone dipropionate-loaded mPEG5000–DSPE polymeric micelles. In contrast, Rastogi et al. (30) observed that the FTIR characteristic peaks for isoniazid (amide I and II) were completely masked when the drug was entrapped in alginate microspheres.
Fig. 3.
FTIR spectra of (a) rifampicin powder, (b) blank mPEG2000–DSPE, and (c) rifampicin-loaded mPEG2000–DSPE nanoparticles
Fig. 4.
FTIR spectra of (a) rifampicin powder, (b) blank mPEG5000–DSPE, and (c) rifampicin-loaded mPEG5000–DSPE nanoparticles
In Vitro Drug Release
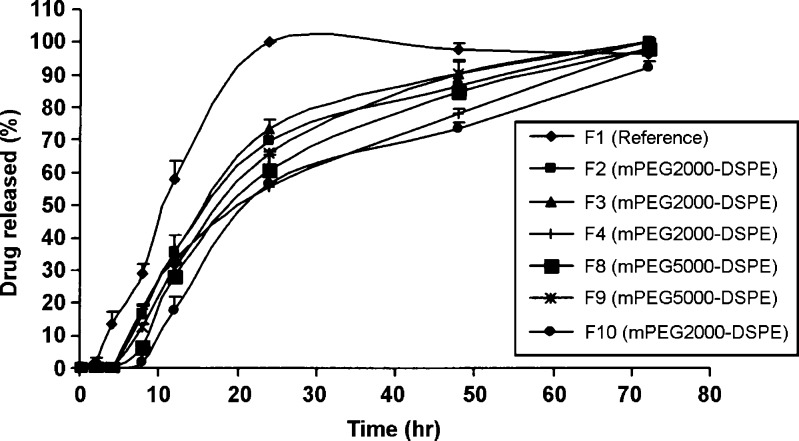
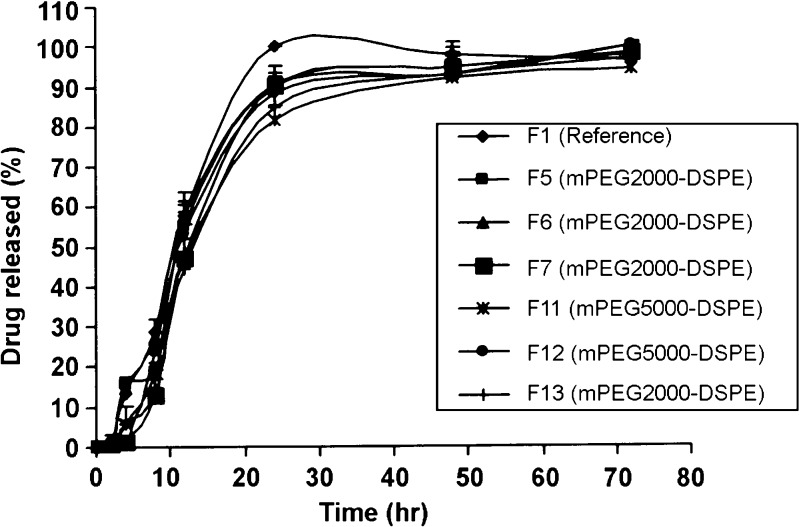
The reference lyophilized rifampicin (F1) was released almost 100% for the first 24 h, and on the contrary, the drug release profiles for F2 to F13 formulations exhibited a prolonged release over 3 days (Figs. 5 and 6). The effect of the PEG–DSPE molecular weight on the drug release profile showed that at any fixed drug to polymer weight ratio, in most cases, there was no significant difference in the release profiles between rifampicin mPEG2000–DSPE and mPEG5000–DSPE formulations. Taking the dissolution T50% as comparison, when using the membrane filter of 0.45 µm, at 1:10 ratio, T50% of F3 (mPEG2000–DSPE) and F9 (mPEG5000–DSPE) were 16.52 and 18.54 h (p > 0.05), respectively, while at 1.5:10 ratio, T50% of F4 (mPEG2000–DSPE) and F10 (mPEG5000–DSPE) were 20.88 and 22.10 h (p > 0.05), respectively. Similarly, for any fixed drug to polymer weight ratio, there was no significant difference in the release profiles between rifampicin mPEG2000–DSPE and mPEG5000–DSPE formulations using membrane filter of 0.22 µm. In addition, at all formulations prepared using membrane filter 0.45 µm at the various drug to polymers weight ratios for both polymers (mPEG2000–DSPE and mPEG5000–DSPE), the release profiles of 1:5 and 1:10 were not significantly different; however, the release profile at the ratio of 1.5:10 was slower than the former two release profiles. The dissolution T50% further substantiated that keeping the amount of drug constant but increasing the amount of polymer caused little changes in the T50% values. In contrast, keeping the polymer constant but increasing the amount of rifampicin resulted in an increase in the T50% values. For example, using mPEG2000–DSPE, T50% values for F2 (1:5) and F3 (1:10) were 17.06 and 16.52 h (p > 0.05), while T50% values for F3 (1:10) and F4 (1.5:10) were 16.52 and 20.88 h (p < 0.05), respectively. Similarly, this trend was consistent, using mPEG5000–DSPE, T50% values for F8 (1:5) and F9 (1:10) were 20.10 and 18.54 h (p > 0.05), while the T50% values for F9 (1:10) and F10 (1.5:10) were 18.54 and 22.10 h (p < 0.05), respectively. Contrary to the membrane filter 0.45 µm, the release profiles using membrane filter 0.22 µm at the various drug to polymer weight ratios for both the two polymers were not significantly different. Using mPEG2000–DSPE, the T50% values for F5 (1:5), F6 (1:10), and F7 (1:5:10) varied from 10.95 to 12.83 h (p > 0.05), while using mPEG5000–DSPE, the T50% values for F11 (1:5), F12 (1:10), and F13 (1:5:10) varied from 11.74 to 13.63 h (p > 0.05). Kim et al. (31) reported that as the amount of drug loading in the nanoparticles increased, the drug release rate decreased. They concluded that the level of drug release seemed to depend on the amount of drug entrapped inside the micelle. It is interesting to note that within the same polymer and drug to polymer weight ratio, formulations prepared using 0.22-µm membrane filter always exhibited shorter T50% values than formulations using 0.45-µm membrane filter. For instance, the T50% values of F2 (0.45 µm) and F5 (0.22 µm) were 17.06 and11.78 h (p < 0.05), respectively, while the T50% values of F8 (0.45 µm) and F11 (0.22 µm) were 20.10 and 12.94 h (p < 0.05), respectively.
Fig. 5.
Release profile of rifampicin powder and rifampicin formulations at drug to polymer weight ratios of 1:5 (F2, F8), 1:10 (F3, F9), and 1.5:10 (F4, F10) using 0.45-µm membrane filter. Mean ± SD; N = 3
Fig. 6.
Release profile of rifampicin powder and rifampicin formulations at drug to polymer weight ratios of 1:5 (F5, F11), 1:10 (F6, F12), and 1.5:10 (F7, F13) using a 0.22-µm membrane filter. Mean ± SD; N = 3
The results in Table III shows that the F1 (reference) followed the zero-order release kinetic, while the F2 to F13 formulations best followed the first-order release kinetic and Higuchi diffusion model. The zero-order rate constant k0 for F1 (reference) was 131.53% day−1. As a whole, the overall release was the slowest for F10 (mPEG5000–DSPE) and the fastest for F7 (mPEG2000–DSPE) as reflected by their corresponding first-order release rate constant k1 of 0.76 and 2.40 day−1, respectively. The slower release profiles of the F2 to F13 formulations indicated that the micellar structure was sufficiently stable, and drug release was prolonged until the end of 3 days. Allen et al. (15) and Lavasanifar et al. (32) reported that the slower drug release was due to the inhibition of ionization of the basic group and an increased hydrophobic interaction between the drug and micellar core. The effects of the molecular weight of polymer on the drug release have been reported by numerous workers. In our study, the increase in the release rate for the lower molecular (mPEG 2000–DSPE) may be due to the weaker hydrophobic interaction between the drug and the hydrophobic part in the core of the micelles (15). Kim et al. (31) found that increasing the molecular weight and the hydrophobic segments of a block polymer also increased the binding affinity between the indomethacin and the hydrophobic portion of the polymer. In another study, Zhang and Zhuo (33) reported that the appropriate drug release rate could be achieved by modulating the composition of the polymers and that the release rate was enhanced with an increase in PEG chain length.
Table III.
Drug Release Kinetic Parameters of Rifampicin (Reference) and Rifampicin-Loaded-mPEG–DSPE Nanoparticles
| Formula code | Formulations | Release rate constant | Correlation coefficient (r) | Higuchi (r) | T 50% (h) | |
|---|---|---|---|---|---|---|
| Zero-order k 0% (day−1) | First-order k 1 (day −1) | |||||
| F1 | Rifampicin | 131.53 ± 16.14 | – | 0.9816 ± 0.07 | 0.9640 ± 0.04 | 10.98 ± 0.03 |
| F2 | R/mPEG2000–DSPE (1:5)/0.45 | – | 1.10 ± 0.07 | 0.9897 ± 0.01 | 0.9780 ± 0.01 | 17.06 ± 0.02 |
| F3 | R/mPEG2000–DSPE (1:10)/0.45 | – | 1.31 ± 0.22 | 0.9923 ± 0.01 | 0.9772 ± 0.01 | 16.52 ± 0.06 |
| F4 | R/mPEG2000–DSPE (1.5:10)/0.45 | – | 0.82 ± 0.03 | 0.9954 ± 0.01 | 0.9890 ± 0.01 | 20.88 ± 0.03 |
| F5 | R/mPEG2000–DSPE (1:5)/0.22 | – | 2.14 ± 0.05 | 0.9843 ± 0.02 | 0.9489 ± 0.02 | 11.78 ± 0.04 |
| F6 | R/mPEG2000–DSPE (1:10)/0.22 | – | 1.56 ± 0.26 | 0.9695 ± 0.03 | 0.9411 ± 0.02 | 10.95 ± 0.02 |
| F7 | R/mPEG2000–DSPE (1.5:10)/0.22 | – | 2.40 ± 0.25 | 0.9759 ± 0.02 | 0.9452 ± 0.03 | 12.83 ± 0.07 |
| F8 | R/mPEG5000–DSPE (1:5)/0.45 | – | 1.04 ± 0.08 | 0.9944 ± 0.01 | 0.9794 ± 0.01 | 20.10 ± 0.05 |
| F9 | R/mPEG5000–DSPE (1:10)/0.45 | – | 1.29 ± 0.21 | 0.9950 ± 0.01 | 0.9849 ± 0.01 | 18.54 ± 0.01 |
| F10 | R/mPEG5000–DSPE (1.5:10)/0.45 | – | 0.76 ± 0.02 | 0.9777 ± 0.03 | 0.9627 ± 0.03 | 22.10 ± 0.03 |
| F11 | R/mPEG5000–DSPE (1:5)/0.22 | – | 1.44 ± 0.31 | 0.9786 ± 0.01 | 0.9560 ± 0.02 | 12.94 ± 0.05 |
| F12 | R/mPEG5000–DSPE (1:10)/0.22 | – | 1.49 ± 0.02 | 0.9476 ± 0.03 | 0.9414 ± 0.01 | 11.74 ± 0.03 |
| F13 | R/mPEG5000–DSPE (1.5:10)/0.22 | – | 1.63 ± 0.52 | 0.9699 ± 0.04 | 0.9540 ± 0.02 | 13.63 ± 0.01 |
Mean ± SD; N = 3
Aerodynamic Characterization
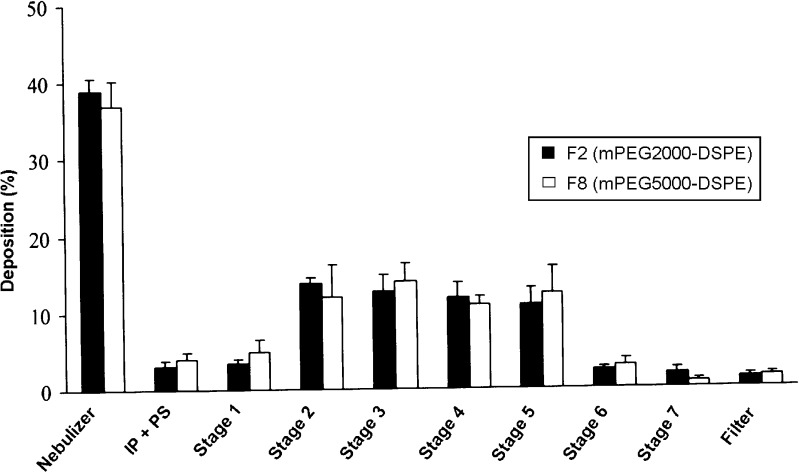
Based on entrapment efficiency (EE) results, F2 (mPEG2000–DSPE) and F8 (mPEG5000–DSPE) formulations were chosen for aerosolization study. Figure 7 depicts the distribution of drug that remained in the nebulizer, the induction port and pre-separator (throat), and the different stages of the cascade impactor. In general, for both formulations, about 38% of rifampicin remained in the nebulizer device, while approximately 62% were emitted into the cascade impactor. It has been reported that the amount of drug retained in the nebulizer was positively correlated to the relative droplet size produced by the nebulizers (34). Since Pari LC Plus, a conventional jet nebulizer having medium droplet size of 4 to 5 µm, was used in this study, it might contribute to the relatively larger amount of rifampicin retained in the nebulizer. High concentrations of active ingredients retained in the nebulizers were also reported at 22% to 74% and 50% to 75%, respectively (28,34). The deposition of the inhaled F2 and F8 in the induction port and pre-separator (simulating the throat of the patient) were 3.1 and 4.1%, respectively. The low amount of deposition of drug in the induction port and pre-separator suggested a possible reduction in the incidence of oropharyngeal irritation. Deposition of drug in stages 1 to 3 (11 ≤ size ≥ 3.9 µm) of NGI for F2 and F8 were 17.25% and 16.86%, respectively. In addition, percentage of drug deposited in stage 3 and below (FPF < 3.9 µm) for F2 and F8 were 40.8 and 42.1%, respectively. The results suggested that both formulations exhibited better and deeper lung penetration.
Fig. 7.
Distribution of aerosolized rehydrated rifampicin formulations in nebulizer and NGI following nebulization at a flow rate of 30 ml/min for 15 min. Mean ± SD, N = 4
Table IV shows the aerodynamic properties of the nebulized liquid formulations. The ED of F2 (61%) and F8 (62.9%) were not significantly different (p > 0.05). The MMAD of both formulations was 2.6 µm. Nonetheless, MMAD of larger than 5 µm is deemed to be undesirable, since these particles may have a problem of reaching the pulmonary target site (22). The GSD of F2 and F8 were 2.4 and 2.6, respectively, which were greater than 1.2, indicating the polydisperse nature of both formulations (35). Nevertheless, the relatively small standard deviations for the MMAD and GSD values indicated that the results were reproducible for both formulations studied. The results in Table IV also showed that the molecular weight of mPEG–DSPE did not influence the aerodynamic properties of F2 (mPEG2000–DSPE) and F8 (mPEG5000–DSPE) (p > 0.05).
Table IV.
Comparison of Aerodynamic Characteristic of Rehydrated Lyophilized Rifampicin-Loaded PEG–DSPE Formulations Following Nebulization at a Flow Rate of 30 ml/min for 15 min
| Parameters | Formulations | |
|---|---|---|
| F2 | F8 | |
| R/mPEG2000–DSPE | R/mPEG5000–DSPE | |
| MMAD (µm) | 2.6 ± 0.1 | 2.6 ± 0.4 |
| GSD | 2.4 ± 0.1 | 2.6 ± 0.4 |
| ED (%) | 61.1 ± 1.6 | 62.9 ± 3.8 |
| FPF ≤ 3.9 µm (%) | 40.8 ± 1.3 | 42.1 ± 4.6 |
| Size ≤ 11 to ≥3.9 µm (%) | 17.25 ± 0.9 | 16.86 ± 0.9 |
| Size ≥ 11 µm (IP–PS) (%) | 3.1 ± 0.7 | 4.1 ± 0.9 |
Mean ± SD; N = 4
IP induction port (throat), PS pre-separator
CONCLUSIONS
The entrapment efficiency of rifampicin in mPEG–DSPE polymers was influenced by drug to polymer ratio, but not by mPEG–DSPE molecular weight and filter porosity. FTIR spectra showed no chemical interactions between the drug and coplymers, but DSC thermograms indicated physical interaction, which suggested that rifampicin was entrapped in the polymeric matrix. The drug release profiles for the rifampicin mPEG2000–DSPE and mPEG5000–DSPE formulations exhibited a slow release for 3 days following Higuchi model, and copolymer molecular weight did not significantly influence the release profiles of drug from both mPEG–DSPE formulations. The rehydrated lyophilized mPEG–DSPE formulations given by the nebulizer had a greater advantage to be used for the pulmonary delivery, because it generated aerosols, which have MMAD in the respirable range, high FPF, and little amount deposited in the induction port (throat deposition). In addition, the molecular weight of mPEG–DSPE did not significantly affect the aerodynamic characteristics of the formulations, and therefore, the results of this study further supported the potential used of pegylated lipid such as mPEG–DSPE as a drug carrier in the treatment of pulmonary-related diseases.
Acknowledgment
The authors would like to thank Universiti Sains Malaysia, Penang, Malaysia, for providing the research grant to support this work.
References
- 1.World Health Organization . Tuberculosis facts 200. Geneva: WHO; 2007. [Google Scholar]
- 2.Burman WJ, Cohn DL, Rietmeijer CA, Judson FN, Sbarbaro JA, Reves RR. Noncompliance with directly observed therapy for tuberculosis: epidemiology and effect on the outcome of treatment. Chest. 1997;111:1168–1173. doi: 10.1378/chest.111.5.1168. [DOI] [PubMed] [Google Scholar]
- 3.Fu J, Fiegel J, Krauland E, Hanes J. New polymeric carriers for controlled drug delivery following inhalation or injection. Biomaterials. 2002;23:4425–4433. doi: 10.1016/S0142-9612(02)00182-5. [DOI] [PubMed] [Google Scholar]
- 4.Prabakaran D, Singh P, Jaganathan KS, Vyas SP. Osmotically regulated asymmetric capsular systems for simultaneous sustained delivery of anti-tubercular drugs. J Control Release. 2004;95:239–248. doi: 10.1016/j.jconrel.2003.11.013. [DOI] [PubMed] [Google Scholar]
- 5.Shishoo CJ, Shah SA, Rathod IS, Savale SS, Vora MJ. Impaired bioavailability of rifampicin in presence of isoniazid from fixed dose combination (FDC) formulation. Int J Pharm. 2001;228:53–67. doi: 10.1016/S0378-5173(01)00831-6. [DOI] [PubMed] [Google Scholar]
- 6.Singh S, Mariappan TT, Shankar R, Sarda N, Singh B. A critical review of the probable reasons for the poor/variable bioavailability of rifampicin from anti-tubercular fixed-dose combination (FDC) products, and the likely solutions to the problem. Int J Pharm. 2001;228:5–17. doi: 10.1016/S0378-5173(01)00754-2. [DOI] [PubMed] [Google Scholar]
- 7.Dutt M, Khuller GK. Liposomes and PLG microparticles as sustained release antitubercular drug carriers-an in vitro-in vivo study. Int J Antimicrob Agents. 2001;18:245–252. doi: 10.1016/S0924-8579(01)00373-9. [DOI] [PubMed] [Google Scholar]
- 8.O'Hara P, Hickey AJ. Respirable PLGA microspheres containing rifampicin for the treatment of tuberculosis: manufacture and characterization. Pharm Res. 2000;17:955–961. doi: 10.1023/A:1007527204887. [DOI] [PubMed] [Google Scholar]
- 9.Rao BS, Murthy KVR. Studies on rifampicin release from ethylcellulose coated nonpareil beads. Int J Pharm. 2002;231:97–106. doi: 10.1016/S0378-5173(01)00874-2. [DOI] [PubMed] [Google Scholar]
- 10.Suarez S, O'Hara P, Kazantseva M, Newcomer CE, Hopfer R, McMurray DN, et al. Airways delivery of rifampicin microparticles for the treatment of tuberculosis. J Antimicrob Chemother. 2001;48:431–434. doi: 10.1093/jac/48.3.431. [DOI] [PubMed] [Google Scholar]
- 11.Vyas SP, Kannan ME, Jain S, Mishra V, Singh P. Design of liposomal aerosols for improved delivery of rifampicin to alveolar macrophages. Int J Pharm. 2004;269:37–49. doi: 10.1016/j.ijpharm.2003.08.017. [DOI] [PubMed] [Google Scholar]
- 12.Gaber NN, Darwis Y, Peh KK, Tan YTF. Characterization of polymeric micelles for pulmonary delivery of beclomethasone dipropionate. J. Nanosci Nanotechnol. 2006;6:1–7. doi: 10.1166/jnn.2006.426. [DOI] [PubMed] [Google Scholar]
- 13.Torchilin VP. Polymer-coated long-circulating microparticulate pharmaceuticals. J Microencapsul. 1998;15:1–19. doi: 10.3109/02652049809006831. [DOI] [PubMed] [Google Scholar]
- 14.Zalipsky S. Long circulating, cationic liposomes containing amino-PEG-phosphatidylethanolamine. FEBS Lett. 1994;353:71–74. doi: 10.1016/0014-5793(94)01013-7. [DOI] [PubMed] [Google Scholar]
- 15.Allen C, Maysinger D, Eisenberg A. Nano-engineering block copolymer aggregates for drug delivery. Colloids Surf B: Biointerfaces. 1999;16:3–27. doi: 10.1016/S0927-7765(99)00058-2. [DOI] [Google Scholar]
- 16.Jones MC, Leroux JC. Polymeric micelles—a new generation of colloidal drug carriers. Eur J Pharm Biopharm. 1999;48:101–111. doi: 10.1016/S0939-6411(99)00039-9. [DOI] [PubMed] [Google Scholar]
- 17.Lukyanov AN, Gao Z, Torchilin VP. Micelles from polyethylene glycol/phosphatidylethanolamine conjugates for tumor drug delivery. J Control Release. 2003;91:97–102. doi: 10.1016/S0168-3659(03)00217-7. [DOI] [PubMed] [Google Scholar]
- 18.Yamamoto H, Kuno Y, Sugimoto S, Takeuchi H, Kawashima Y. Surface-modified PLGA nanosphere with chitosan improved pulmonary delivery of calcitonin by mucoadhesion and opening of the intercellular tight junctions. J Control Release. 2005;102:373–381. doi: 10.1016/j.jconrel.2004.10.010. [DOI] [PubMed] [Google Scholar]
- 19.Azarmi S, Roa WH, Lolbenberg R. Targeted delivery of nanoparticles for the treatment of lung diseases. Adv Drug Deliv Rev. 2008;60:863–875. doi: 10.1016/j.addr.2007.11.006. [DOI] [PubMed] [Google Scholar]
- 20.Suarez S, Hickey AJ. Drug properties affecting aerosol behavior. Respir Care. 2000;45:652–666. [PubMed] [Google Scholar]
- 21.Joshi M, Misra A. Dry powder inhalation of liposomal Ketotifen fumarate: Formulation and characterization. Int J Pharma. 2001;223:15–27. doi: 10.1016/S0378-5173(01)00705-0. [DOI] [PubMed] [Google Scholar]
- 22.Sung JC, Pulliam BL, Edwards DA. Nanoparticles for drug delivery to the lungs. Trends Biotechnol. 2007;25:563–570. doi: 10.1016/j.tibtech.2007.09.005. [DOI] [PubMed] [Google Scholar]
- 23.Wiggins NA. The development of a mathematical approximation technique to determine the mass median aerodynamic diameter (MMAD) and geometric standard deviation (GSD) of drug particles in an inhalation aerosol spray. Drug Dev Ind Pharm. 1991;17:1971–1986. doi: 10.3109/03639049109048062. [DOI] [Google Scholar]
- 24.Hu Y, Jiang X, Ding Y, Zhang L, Yang C, Zhang J, et al. Preparation and drug release behaviors of nimodipine-loaded poly(caprolactone)-poly(ethylene oxide)-polylactide amphiphilic copolymer nanoparticles. Biomaterials. 2003;24:2395–2404. doi: 10.1016/S0142-9612(03)00021-8. [DOI] [PubMed] [Google Scholar]
- 25.Kreuter J. Nanoparticles—a historical perspective. Int J Pharm. 2007;331:1–10. doi: 10.1016/j.ijpharm.2006.10.021. [DOI] [PubMed] [Google Scholar]
- 26.Chou TH, Chu IM. Thermodynamic characteristics of DSPC/DSPE-PEG2000 mixed monolayers on the water subphase at different temperatures. Colloids Surf B: Biointerfaces. 2003;27:333–344. doi: 10.1016/S0927-7765(02)00096-6. [DOI] [Google Scholar]
- 27.Zhang X, Jackson JK, Burt HM. Development of amphiphilic diblock copolymers as micellar carriers of taxol. Int J Pharm. 1996;132:195–206. doi: 10.1016/0378-5173(95)04386-1. [DOI] [Google Scholar]
- 28.Darwis Y, Kellaway IW. Nebulisation of rehydrated freeze-dried beclomethasone dipropionate liposomes. Int J Pharm. 2001;215:113–121. doi: 10.1016/S0378-5173(00)00670-0. [DOI] [PubMed] [Google Scholar]
- 29.Agrawal S, Ashokraj Y, Bharatam PV, Pillai O, Panchagnula R. Solid-state characterization of rifampicin samples and its biopharmaceutic relevance. Eur J Pharm Sci. 2004;22:127–144. doi: 10.1016/j.ejps.2004.02.011. [DOI] [PubMed] [Google Scholar]
- 30.Rastogi R, Sultana Y, Aqil M, Ali A, Kumar S, Chuttani K, et al. Alginate microspheres of isoniazid for oral sustained drug delivery. Int J Pharm. 2007;334:71–77. doi: 10.1016/j.ijpharm.2006.10.024. [DOI] [PubMed] [Google Scholar]
- 31.Kim SY, Shin ILG, Lee YM, Cho CS, Sung YK. Methoxy poly (ethylene glycol) and Є-caprolactone amphiphilic block copolymeric micelle containing indomethacin. II. Micelle formulation and drug release behaviours. J Control Release. 1998;51:13–22. doi: 10.1016/S0168-3659(97)00124-7. [DOI] [PubMed] [Google Scholar]
- 32.Lavasanifar A, Samuel J, Kwon GS. Poly(ethylene oxide)-block-poly(L-amino acid) micelles for drug delivery. Adv Drug Deliv Rev. 2002;54:169–190. doi: 10.1016/S0169-409X(02)00015-7. [DOI] [PubMed] [Google Scholar]
- 33.Zhang Y, Zhuo RX. Synthesis and in vitro drug release behavior of amphiphilic triblock copolymer nanoparticles based on poly (ethylene glycol) and polycaprolactone. Biomaterials. 2005;26:6736–6742. doi: 10.1016/j.biomaterials.2005.03.045. [DOI] [PubMed] [Google Scholar]
- 34.Vaghi A, Berg E, Liljedahl S, Svensson JO. In vitro comparison of nebulised budesonide (Pulmicort Respules®) and beclomethasone dipropionate (Clenil® per Aerosol) Pulm Pharmacol Ther. 2005;18:151–153. doi: 10.1016/j.pupt.2004.10.004. [DOI] [PubMed] [Google Scholar]
- 35.Hickey AJ, Kuchel K, Masinde LE. Method of aerosol particle size characterization. In: Hickey AJ, editor. Pharmaceutical inhalation aerosol technology. New York: Marcel Dekker; 1992. pp. 218–253. [Google Scholar]


