

Abstract
Green fluorescent protein (GFP) from jellyfish Aequorea victoria is the most extensively studied and widely used in cell biology protein. GFP-like proteins constitute a fast growing family as several naturally occurring GFP-like proteins have been discovered and enhanced mutants of Aequorea GFP have been created. These mutants differ from wild-type GFP by conformational stability, quantum yield, spectroscopic properties (positions of absorption and fluorescence spectra) and by photochemical properties. GFP-like proteins are very diverse, as they can be not only green, but also blue, orange-red, far-red, cyan, and yellow. They also can have dual-color fluorescence (e.g., green and red) or be non-fluorescent. Some of them possess kindling property, some are photoactivatable, and some are photoswitchable. This review is an attempt to characterize the main color groups of GFP-like proteins, describe their structure and mechanisms of chromophore formation, systemize data on their conformational stability and summarize the main trends of their utilization as markers and biosensors in cell and molecular biology.
Keywords: Fluorescent proteins, chromoproteins, photoactivated proteins
INTRODUCTION
Fluorescent bioimaging of single molecules, intact organelles, live cells and whole organisms is an extensively used approach in the fields of biochemistry, biotechnology, cell and developmental biology. A new epoch in applying the fluorescent markers to biological research has begun with cloning of green fluorescent protein, GFP [1, 2], and subsequent creation of enhanced mutants of GFP [1–5]. Further impact has been made with cloning of novel GFP-like green, yellow and red proteins [6–8] and non-fluorescent chromoproteins [1, 2]. Currently, GFP-like proteins are a fast growing family consisting of about 200 fluorescent proteins (FPs) and chromoproteins (CPs) from classes Anthozoa and Hydrozoa [10, 11].
A great advantage of GFP-like proteins over other fluorescent tags is determined by their ability to form internal chromophore without requiring accessory cofactors, enzymes or substrates other than molecular oxygen [1, 4, 12] making possible chromophore formation in live organisms, tissues and cells [3]. Fluorescent proteins are more widely used as quantitative genetically encoded markers for studying of protein-protein interaction, protein and cell tracking [4]. This review is an attempt to characterize the main color groups of GFP-like proteins, to describe their structure, conformational stability and mechanisms of chromophore formation, and to summarize the main trends of their utilization as markers and biosensors in cell and molecular biology.
SPECTRAL PROPERTIES OF GFP-LIKE PROTEINS
GFPs were found several decades ago in jellyfish Aequorea victoria [15, 16] and Renilla reniformis sea pansy [5]. These proteins being components of bioluminescent system, transform blue light emitted by aequorin (in Aequorea victoria) or luciferase (Renilla reniformis) into green light. It is possible that association of GFPs with bioluminescence was the main reason of why GFP-like proteins have not been searched in non-bioluminescent corrals for some time. It is clear now that GFP-like proteins are responsible for fluorescent and non-fluorescent coloration of coral polyps.
GFP-like proteins greatly differ in thier spectral properties. In this section the fluorescent properties of GFP-like proteins from different classes are briefly considered. Spectral properties of Aequorea GFP having the most complex absorbtion and excitation spectra are described in more detail. Fluorescent properties of so-called photoactivatable fluorescent proteins which are capable of pronounced changes in their spectral properties in response to irradiation with light of a specific wavelength and intensity are also reviewed.
GFP-like protein from Anthozoa species. GFP-like proteins from Anthozoa species can be divided into three main groups with respect to their fluorescence spectra positions [1, 6]: green (~485–520 nm, Anthozoa GFP), yellow (~540 nm, Anthozoa YFP) and orange-red (>570 nm, Anthozoa RFP). In addition to these three classes, several proteins with dual-color fluorescence (green and red) and non-fluorescent CPs have been found [8, 9]. CPs can effectively absorb but almost do not emit light. Absorption, excitation and fluorescence spectra for these groups are shown in Fig. (1).
Fig. (1).

Spectral properties of GFP-like proteins and their mutants belonging to the color main groups: green (GFPs), yellow (YFPs), red fluorescent proteins (RFPs) and chromoproteins (CPs) [196].
Row I – spectra of wild-type proteins, row II – spectra of mutant proteins. Dashed lines – excitation spectra of FPs or absorption spectra of CPs, solid lines – fluorescence spectra.
Understanding the relationship between spectral properties of FPs and their structure is of great scientific and practical interest. Notwithstanding the availability of great number of sequences, it is difficult to determine the role of individual amino acids in fluorescent properties of GFP-like proteins. As an alternative, site-directed and random mutagenesis were applied to find important residues. In 2000, a single amino acid substitution Ala148 Ser was described that caused the transformation of the non-fluorescent chromoprotein asulCP from sea anemone Anemonia sulcata to RFP [9]. Various mutants of asulCP and DsRed1 (or drFP583 – red fluorescent protein from corrals Discosoma sp.) with dual-color fluorescence (red and green), as well as “green” mutant of DsRed1 were created [9, 18–20]. The interconversion between Anthozoa GFPs and YFPs has been also demonstrated [7]. A non-fluorescent chromoprotein, DsRed-NF, was created from DsRed1 [8]. Analysis of 3D structures of Aequorea GFP and DsRed1 showed that the majority of amino acid residues whose substitutions led to spectral changes were in the immediate proximity of the chromophore (Fig. (2).
Fig. (2).

Amino acid substitutions responsible for the color transition of GFP-like proteins. Numbers correspond to key amino acids substituted in mutants with changed color.
Particular attention has been paid to the creation of far-red FP mutants since the autofluorescence (fluorescence of flavins, vitamins and NAD(P)H) in the red region of spectra is noticeably lower than in blue-green region. All the natural Anthozoa RFPs have fluorescence maxima below 595 nm. A red-shifted mutant, ds/drFP616, with an emission maximum at 616 nm was generated from DsRed1 and dis2RFP using shuffling procedure with subsequent random mutagenesis [9]. The further red shift was achieved by mutagenesis of CPs. HcRed1, dimeric mutant of hcriCP from Heteractis crispa, have absorption and emission spectra with maxima at 590 and 645 nm respectively [10]. Site-directed and random mutagenesis of a blue chromoprotein from Actinia equine, aeCP597, resulted in mutants with emission maxima at up to 663 nm. The most bright and stable mutant of aeCP597, AQ143, possessed excitation and emission maxima at 595 and 655 nm, respectively [11]. A monomeric mutant of DsRed1 with an excitation maximum at 584 nm and an emission maximum at 607 nm, mRFP1, was created [12]. Recently a new generation of monomeric red FPs has been created from mRFP1, mOrange, mStrawberry and mCherry [13], mRaspberry and mPlum [14]. On the basis of the red fluorescent protein eqFP578 (dimeric protein with weak tendency to form tetramers) from sea anemone Entacmaea quadricolor, monomeric red and far-red fluorescent proteins, named TagRFP and mKate, were generated [15, 16]. These proteins are characterized by high brightness, photostability and relatively fast chromophore maturation. Furthermore, TagRFP has extremely high pH stability with pKa < 4.0, which makes it an excellent fluorescent tag for the use within acidic organelles.
GFP-like proteins from the other species. The most of GFP-like proteins from Hydrozoa species belong to the group of green fluorescent proteins with fluorescence maxima in the range of 490–520 nm. Among all GFP-like proteins of this class, Aequorea GFP is the only protein possessing the absorption spectrum with maximum in UV-region. The rest of Hydrozoa GFP-like proteins have maxima of absorption spectrum in the range of 465–498 nm.
Recently 4 novel GFP-like proteins were identified in Hydrozoa species [17]. Two of them (anm1GFP1 and anm1GFP2 from Anthomedusae sp.) are GFPs. Protein anm2CP from Anthomedusae sp. is a non-fluorescent CP with absorption spectrum being very similar to that of CPs and RFPs from Anthozoa species. Based on this similarity several point amino acid substitutions were introduced transforming anm2CP into RFP termed as JRed with excitation and emission maxima 584 nm and 610 nm (Evrogen, Russia). JRed is the first red fluorescent marker specially designed for protein labeling. The fourth FP identified in medusa Phialidium sp. (Hydrozoa species) is YFP phiYFP. In contrast to zoanYFP (Anthozoa species), phiYFP contains tyrosine in the position 203, which is the key mutation imperative to yellow emission in the commercially available Aequorea GFP mutant, YFP. Therefore, phiYFP is the only natural GFP-like protein found to date that utilizes the same structural solutions to adjust its spectral properties as was found for Aequorea GFP in protein engineering studies.
Six closely related (more than 60% identity) GFP-like proteins from planktonic Copepoda of the Pontellidae family (phylum Arthropoda, class Crustacea) have been also described: two from Pontellina plumata (ppluGFP1 and ppluGFP2), one from Labidocera aestiva (laesGFP), two from Pontella meadi (pmeaGFP1 and pmeaGFP2), and one from an unidentified species (pdae1GFP). All these proteins demonstrated green fluorescence with emission maxima in the range of 500–511 nm. A characteristic feature of Copepoda GFP is the absence of tryptophan residues (only laesGFP contains Trp179), which explains their weak excitation at 280 nm.
Recently the occurrence of an endogenous GFP has been demonstrated for the first time in representatives of the deuterostrome branch of the Animal Kingdom, namely Branchiostoma floridae, B. lanceolatum, and B. belcheri (phylum Chordata, subphylum Cephalochordata, Amphioxus species) [18]. Fluorescence spectra from intact adult amphioxus illuminated with UV had maxima in the range of 524–527 nm. A gene isolated from B. floridae and named AmphiGFP has been shown to encode a protein of 218 amino acid residues, whose predicted three-dimensional structure represents an 11-stranded β-barrel. According to the spatial distribution of green fluorescence in adults, the authors proposed photoreceptive or photoprotective functions for these GFPs.
Aequorea GFP and its enhanced mutants. The wild-type Aequorea GFP has the most complex spectra of all GFPs (Fig. 3, a), possessing a major excitation peak at 395 nm that is about three times higher in amplitude than a minor peak at 475 nm. In normal solution, excitation at 395 nm gives emission peaking at 508 nm, whereas excitation at 475 nm gives a maximum at 503 nm [19]. The fact that the emission maximum depends on the excitation wavelength indicates that the population includes at least two chemically distinct species, which do not fully equilibrate within the lifetime of the excited state. At pH 10–11, when the protein is on the verge of unfolding, increasing pH increases the amplitude of the 475-nm absorbance or excitation peak at the expense of the 395-nm peak. It was proposed that the 475-nm peak arises from GFP molecules containing deprotonated or anionic chromophores, whereas the 395-nm peak represents GFPs containing protonated or neutral chromophores [3]. The latter would be expected to deprotonate in the excited state, because phenols almost always become much more acidic in their excited states.
Fig. (3).

Excitation and emission spectra (solid and dashed lines, respectively) and the chromophore structures of typical representatives of six classes of Aequorea GFP mutant proteins [67].
a – wild-type GFP; b – Emerald (substitutions of Ser 65 to Thr, Ser 72 to Ala, Asn 149 to Lys, Met 153 to Thr, Ile 167 to Thr), containing anionic chromophore; c – Sapphire-GFP (substitutions of Thr 203 to Ile, Ser 72 to Ala, Tyr 145 to Phe), containing neutral chromophore; d – Topaz belonging to YFPs; e – W1B from the class of CFPs; f – P4-3 belonging to BFPs.
The wild-type Aequorea GFP has several drawbacks in respect to its use as fluorescent marker. One of them is the low folding efficiency when GFP expressed at 37 °C. This is due to jellyfish Aequorea victoria is found in the cold Pacific Northwest and mature protein is most efficiently formed at temperatures well below 37 °C. The others undesirable properties of Aequorea GFP are low fluorescence intensity when excited by blue light and poor expression in several mammalian cell types [20, 21]. To improve properties of Aequorea GFP, an enhanced GFP variant (EGFP) has been constructed, which contained substitution of Phe64 to Leu that improve folding at 37 °C and substitution of Ser65 to Thr that made the protein 35 times brighter than wild-type GFP [22].
As mentioned above, because of the existing of background fluorescence of cells when excited by green light, special attention has been devoted to creation of red-shifted Aequorea GFP variants. As result, wavelength-shifted Aequorea GFP mutants have been made. They may be divided into six classes (Fig. 3).
First class – proteins with phenolate anions in the chromophore, e.g. EGFP, Emerald and so on (Fig. 3b). They contain the Ser65→Thr substitution leading to the chromophore ionization. In Ser65Thr mutants, the 395 nm excitation peak due to the neutral phenol is suppressed and the 470–475 nm peak due to the anionic phenol is enhanced five- to six-fold in amplitude and shifted to 489–490 nm [20]. Substitutions of Ser65 to glycine, alanine, cysteine or leucine have roughly similar effects. The probable mechanism by which replacement of Ser65 promotes chromophore ionization is that only Ser65 can donate a hydrogen bond to the buried side chain of Glu222 to allow ionization of that carboxylate, which is within 3.7 Å of the chromophore [3, 31]. Gly, Ala, and Leu cannot donate hydrogen bonds, and Thr and Cys are too large to adopt the correct conformation in the crowded microenvironment of the chromophore. Such residues at position 65 force the carboxyl of Glu222 to remain neutral. In this case, the others polar groups solvating the chromophore are sufficient to promote its ionization to an anion, whereas if Glu222 is an anion, electrostatic repulsion forbids the chromophore from becoming an anion. This hypothesis explains why substitution of Glu222 to Gly gives the same spectral changes [23].
Second class – proteins with neutral phenol in the chromophore, e.g. sapphire-GFP (Fig. 3c). Substitution of Thr203 to Ile leads to almost complete suppression of the excitation peak at 475 nm, leaving only the shorter wavelength peak at 399 nm. Presumably a chromophore anion cannot be adequately solvated once the hydroxyl of Thr203 is absent, so the chromophore is neutral in almost all the ground-state molecules. However, protein still have emission maximum at 511 nm because the excited state remains acidic enough to eject a proton [1, 32].
Third class – proteins with π-stacked interaction of aromatic ring and phenolate anion. Aromatic ring can be introduced by substitution of Thr203 to His, Trp, Phe or Tyr. In these cases, the emission maxima are red-sifted, with maximal shift up to 20 nm when Thr203 is substituted to Tyr [24]. These mutants were rationally designed from the crystal structure of S65T GFP in the expectation that the additional polarizability around the chromophore and π–π interaction would reduce the excited state energy, that is, increase both the excitation and emission wavelengths. The crystal structure of a mutant containing Tyr203 confirmed that its aromatic ring stacks next to the chromophore [25]. Substitution of Gln69 to Lys gives an additional shift of about 1–2 nm, resulting in an emission peak around 529 nm, the longest now known. These proteins were termed as EYFP (enhanced yellow fluorescent proteins) for their yellowish coloration (Fig. 3d).
Fourth class – proteins with indole in chromophore instead of a phenol, introduced by substitution of Tyr66 to Trp [20]. Excitation and emission maxima of these proteins (436 and 476 nm respectively) have intermediate positions between those of proteins with neutral phenol and anionic phenolate chromophore. These proteins are called enhanced cyan fluorescent proteins (ECFP) because of their blue-green or cyan fluorescence (Fig. 3e).
Fifth class – proteins with imidazole in chromophore instead of a phenol. These proteins contain substitution of Tyr66 to His [20]. They were called enhanced blue fluorescent proteins (EBFP) since their excitation and emission peaks are around 383 and 447 nm (Fig. 3f).
Sixth class – protein with phenyl in chromophore instead of a phenol, introduced by substitution of Tyr66 to Phe [3, 20]. This protein is characterized by the shortest excitation and emission peak positions (360 and 442 nm respectively). This mutant has been little investigated because no obvious practical use for protein requiring such short wavelength excitation has been proposed. Nevertheless it proves that any aromatic residue at position 66 can form a chromophore.
Photoactivatable fluorescent proteins. A set of so-called photoactivatable fluorescent proteins (PAFPs) has been developed (Table 1). These proteins are capable of pronounced changes in their spectral properties in response to irradiation with light of a specific wavelength and intensity. Some PAFPs convert from a non-fluorescent (dark) to a bright fluorescent state (photoactivation), whereas others change fluorescence color (photoswitching or photoconversion). The PAFPs created to date can be divided into three major groups with respect to their mechanism of photoactivation.
Table 1.
Common Photoactivatable Proteins [113]
| PA-GFP | PS-CFP2 | Kaede | mEosFP | KikGR | Dendra2 | KFP1 | Dronpa | PAmRFP1 | ||
|---|---|---|---|---|---|---|---|---|---|---|
| Oligomeric state |
Monomer | Monomer | Tetramer | Monomer | Tetramer | Monomer | Tetramer | Monomer | Monomer | |
| Activating light |
UV–Violet | UV–Violet | UV–Violet | UV–Violet | UV–Violet | UV–Violet or Blue |
Green | UV–Violet | UV–Violet | |
| Quenching light |
No | No | No | No | No | No | Blue at 450 nm |
Blue at 490 nm |
No | |
| Change of absorbance, nm |
400 to 504 | 400 to 490 | 508 to 572 | 505 to 569 | 507 to 583 | 490 to 553 | Increase at 590 |
Increase at 503 |
Increase at 578 |
|
| Change of emission, nm |
515 to 517 | 470 to 511 | 518 to 580 | 516 to 581 | 517 to 593 | 507 to 573 | None to 600 | None to 518 | None to 605 | |
| Reversibility of pho- toactivation |
Irreversible | Irreversible | Irreversible | Irreversible | Irreversible | Irreversible | Reversible or Irreversible |
Reversible | Irreversible | |
| Brightness increase, fold |
100 | >400 | 800 | n.d. | n.d. | 150–300 | 70 or 35 | n.d. | 70 | |
| Contrast between states, fold |
~200 | >2,000 | 2,000 | n.d. | >2,000 | >3,000 | No | No | No | |
| Before activation |
QY | 0.13 | 0.2 | 0.88 | 0.64 | 0.7 | 0.5 | <0.001 | n.d. | <0.001 |
| EC | 20,700 at 400 nm |
43,000 at 400 nm |
98,800 at 508 nm |
67,200 at 505 nm |
28,200 at 507 nm |
45,000 at 490 nm |
123,000 at 590 nm |
n.d. | n.d. | |
| pKa | 4.5 | 4.3 | 5.6 | n.d. | 7.8 | 6.6 | n.d. | n.d. | n.d. | |
| Bright- nessa |
0.08 | 0.26 | 2.64 | 1.3 | 0.60 | 0.67 | <0.004 | n.d. | n.d. | |
| After activation |
QY | 0.79 | 0.23 | 0.33 | 0.62 | 0.65 | 0.55 | 0.07 | 0.85 | 0.08 |
| EC | 17,400 at 504 nm |
47,000 at 490 nm |
60,400 at 572 nm |
37,000 at 569 nm |
32,600 at 583 nm |
35,000 at 553 nm |
59,000 at 590 nm |
95,000 at 503 nm |
10,000 at 578 nm |
|
| pKa | n.d. | 6.1 | 5.6 | n.d. | 5.5 | 6.9 | n.d. | 5.0 | 4.4 | |
| Bright- nessa |
0.42 | 0.33 | 0.60 | 0.70 | 0.64 | 0.57 | 0.13 | 2.45 | 0.03 |
The advantages and disadvantages of each photoactivatable fluorescent protein are highlighted in light grey and dark grey, respectively. Brightness is a product of QY (quantum yield) and EC (extinction coefficient, M−1cm−1).
Brightness is normalized to that of EGFP. n.d. – not determined.
The first group includes PAFPs which are capable of irreversible photoconversion from the neutral (protonated) to anionic (deprotonated) chromophore form. This group of PAFPs consists of PA-GFP [34], PS-CFP [26] and PAmRFP1 proteins [27]. PA-GFP was created from Aequorea GFP by introducing the single substitution of Thr203 to His, which produces the mostly neutral chromophore form. PA-GFP has the excitation and emission maxima at 400 and 515 nm. The intensity of fluorescence is very low when non-photoactivated PA-GFP is excited at wavelengths that correspond to the excitation spectrum of the anionic chromophore form (480–510 nm). Intense violet-light irradiation (at ~400 nm) leads to irreversible photoconversion of the PA-GFP chromophore from the neutral to the anionic form, which absorbs at 504 nm and emits at 517 nm. This photoconversion results in a 100-fold increase in the green fluorescence of the anionic form.
PS-CFP was developed from a GFP-like protein from the jellyfish Aequorea coerulescens and, in contrast to PA-GFP, it is characterized by cyan fluorescence (λem= 468 nm). Intense violet-light irradiation of PS-CFP results in a 300-fold increase in green fluorescence with maximum at 511 nm and a 5-fold decrease in cyan one. This photoconversion is also irreversible. Proposed mechanism of PA-GFP and PS-CFP photoactivation is based on decarboxylation of Glu 222 residue which results in the reorganization of hydrogen bond network and chromophore deprotonation [37, 38].
Irreversible photoconversion was shown for PAmRFP1s which are red photoactivatable variants of mRFP1 with substitutions at positions 148, 165 and 203. The brightest variant, PAmRFP1-1, initially has weak cyan fluorescence, but after its irreversible photoactivation at 380 nm it exhibits a 70-fold increase in red fluorescence with excitation and emission maxima at 578 nm and 605 nm, respectively.
PAFPs of the second group are capable of irreversible photoconversion from the “green” to “red” chromophore form. This group of PAFPs includes proteins from Anthozoa corals, such as Kaede from Trachyphyllia geoffroyi [28], EosFP from Lobophyllia hemprichii and its monomeric variant mEosFP [29], KikGR, a protein rationally engineered from the green fluorescent protein KikG from Favia favus [30] and several other proteins. The chromophore of these PAFPs is formed by the tripeptide His65-Tyr66-Gly67. UV-violet light irradiation induces a cleavage of backbone between the amide nitrogen and the Cα of His65 and a double bond formation between the Cα and Cβ of His65. The extension of a system of the conjugated double bonds results in red shift of fluorescence spectrum position.
Third group of PAFPs includes dendGFP and its monomeric variant, Dendra, from octocoral Dendronephthya sp. [31]. These proteins are capable of photoconversion from green to red fluorescent state in response to either visible blue or UV-violet light. Dendra represents the first PAFP, which is simultaneously monomeric, efficiently matures at 37 °C in bacterial and mammalian cells, and can be photoactivated by marginally phototoxic blue light. Chromophore of dendGFP and Dendra is formed by amino acids His62–Tyr63–Gly64. Histidine in position 62 is characteristic for a group of Kaede-like PAFPs. However, these proteins demonstrated no convertibility by blue light. Structural features ensuring photoconversion of Dendra in response to blue light remain unclear. Comparison of interior amino acids of dendGFP/Dendra and Kaede, EosFP and KikGR shows that position 116 is occupied by Gln in Dendra but Asn in other Kaede-like proteins. Analysis of EosFP crystal structure shows that the longer Gln side-chain at this position can potentially contact protein backbone near the chromophore-forming His62 residue [32]. Possibly, this contact facilitates backbone break and red chromophore formation in response to blue light. Further studies are required to clarify the mechanism of Dendra photoconversion.
Fourth group PAFPs consists of KFP1, a mutant form of chromoprotein asulCP from the Anemonia sulcata [33, 34] and Dronpa from Pectiniidae sp. corral [28]. Wild-type asulCP effectively absorbs light with absorption maximum at 568 nm, but it emits virtually none. In response to irradiation with intense green light, asulCP converts to a red fluorescent form (kindling) with excitation and emission spectra peaks at 575 and 595 nm, respectively [2]. In the absence of incident green light, asulCP rapidly relaxes back to a non-fluorescent form (t1/2<10 c). On the other hand, asulCP fluorescence can be instantly quenched by blue light. Both “kindling” and quenching of asulCP are reversible processes [33, 34]. The short life time of asulCP fluorescent state restricts its use as photoactivatable fluorescent tag of proteins and organelles in vivo. The enhanced asulCP mutant, KFP1 (kindling fluorescent protein) have been developed. This protein, like asulCP, converts to fluorescent state as result of green light irradiation and then can be quenched by blue light. KFP1 in fluorescent state have absorption and emission spectra with maxima at 580 and 600 nm respectively. Irradiation with green light of greater intensity and/or for a prolonged time causes irreversible kindling with a 30-fold increase of fluorescence intensity in comparison with ground state.
Several KFPs have been created from chromoproteins cgigCP and hcriCP by site-directed mutagenesis [34]. All these proteins are capable of both reversible and irreversible photoactivation depending on the intensity and duration of the activating light. Two hcriCP mutants contain single amino acid substitution of Asn165 to Ala and Asn165 to Gly. These proteins kindled quickly upon blue light irradiation. In contrast to other kindling variants, the kindling wavelength of these mutants was different than the fluorescent excitation wavelength, giving advantages for biotechnology applications, as there is no background kindling in the course of object tracking. In the kindled form these KFPs possess excitation and emission spectra with maxima at 590 and 620 nm.
A protein Dronpa is capable of reversible photoconversion from a green to non-fluorescent form. Initially, Dronpa fluoresces in green area with excitation and emission spectra that peak at 503 nm and 518 nm, respectively. Prolonged or intense irradiation with blue light (470–510 nm) leads to protein quenching to a non-fluorescent form that has an absorption maximum at about 390 nm. Dronpa can then be reversibly converted back to a fluorescent form by irradiation at 400 nm. Remarkably, these activation–quenching events can be repeated many times for KFP1 and Dronpa.
A model has been proposed whereby transition of asulCP and KFP1 from a chromo- to a fluorescent state is related to cis-trans isomerization of the excited chromophore (Fig. 4). As Ala148 is highly conserved in Anthozoa FPs and its substitution to Ser makes asulCP fluorescent [35, 36], it has been suggested that the asulCP chromophore fluorescent (kindled) state is similar to the fluorescent state of Anthozoa FPs and Aequorea GFP. Therefore, if kindling is related to the chromophore cis-trans isomerization, asulCP Tyr66 should contact Ser165 before kindling. In DsRed1, Ile165 spatially blocks this conformation. Therefore, the exceptional wild-type Ser165 in asulCP has been suggested to stabilize the chromophore in the chromo state. However, the excited chromophore has a chance to isomerize to the fluorescent state. The proposed model explains well asulCP and KFP1 properties. At the same time this model is valid only for reversible kindling. The mechanism of irreversible KFP1 photoactivation is unknown and demands of further studies. The phenomenon of reversible Dronpa photoactivation is unclear at present, but it also might be related to cis-trans isomerization.
Fig. (4).

Cis–trans isomerization of KFP1 chromophore during reversible kindling and quenching.
Numbers – the amino acids stabilizing the chromophore in fluorescent or non-fluorescent state.
STRUCTURAL PROPERTIES OF GFP-LIKE PROTEINS
There are two possible explanations for the dramatic spectral differences between GFP-like proteins: (i) distinct non-covalent interaction of the chromophore with amino acids of its microenvironment and (ii) diverse chemical structures of chromophore formed via alternative pathways. Evidently, both possibilities are realized among diverse GFP-like proteins. The maturation mechanisms of “green”, “red”, “yellow” chromophore and chromophore of chromoproteins are summarized in this section. We also review the influence of key amino acid residues of chromophore microenvironment on the spectral properties of GFP-like proteins.
Secondary, tertiary and quaternary structure. In spite of low amino acid homology between GFP-like proteins (about 25–30 %), the analysis of their sequences allowed the detection of all the key secondary structure elements (Fig. 5). All the proteins have a unique β-can fold which represents an 11 β-stranded cylinder threaded by an α-helix running up the axis of the cylinder. The chromophore is attached to the α-helix and buried almost perfectly in the center of the cylinder (Fig. 6). The assumption of the same topology of all GFP-like proteins is supported by the comparison of the Aequorea GFP and DsRed1 3D structures. The chromophore-forming amino acid, Gly67, is present in all known FPs. In Anthozoa FPs, chromophore-forming Tyr66 and Gly67 are absolutely invariant (the residue numbering relates to Aequorea GFP). Residues Arg96 and Glu222 are also highly conserved in GFP-like proteins, thus indicating their importance fir the chromophore maturation [36].
Fig. (5).

Amino acid sequences of GFP-like proteins possessing various fluorescent properties: amajGFP and dstrGFP – subgroup of cyan fluorescent proteins, hcriGFP and zoanGFP – green fluorescent proteins, zoanYFP – yellow fluorescent proteins, DsRed1 and dis2RFP – red fluorescent proteins, and asulCP and hcriCP – non-fluorescent proteins or chromoproteins. ZoanRFP and mcavRFP show dual-color fluorescence [196].
Numbering of amino acids corresponds to Aequorea GFP. Conserved Tyr 66, Gly 67, Arg 96 and Glu 222 are underlined. Shaded areas point out the amino acids whose side chains form the interior of the β-barrel. Amino acids, which are crucial for fluorescent properties formation, are displayed in white on black. Figures below the sequences show the elements of secondary structure.
Fig. (6).

X-ray crystal structure of Aequorea GFP (PDB code 1W7S) in two projections (a) and of DsRed1 from Discosoma sp. (PDB code 1G7K) (b).
Chromophores of GFP and DsRed1 are shown as green and red space-filling unions, respectively. A central α-helix which includes chromophore is shown in yellow. Monomers of DsRed1 are displayed in different colors. The drawing was generated by the graphic programs VMD [197] and Raster3D [198, 199].
With the exception of GFP from jellyfish Aequorea victoria and novel chromoprotein anm2CP from Anthomedusae sp., all green FPs from Hydrozoa species even in dilute solutions are stable dimeric or tetrameric complexes that dissociate only under the denaturing conditions [5, 37]. The formation of dimeric complex of Aequorea GFP is promoted by high protein concentration and high ionic strength [38]. GFP from Aequorea can be crystallized as a monomer or a dimer depending on crystal growth conditions [39]. In dimeric GFP, the interfaces of two monomers are composed by hydrophobic (Ala206, Leu221, Phe223) as well as hydrophilic (Glu146, Asn144, Ser147, Arg168, Tyr200) residues. Tendency of Aequorea GFP to dimerize leads to a dependence of its absorption spectrum on protein concentration. Aequorea GFP dimerization is detectable as a partial suppression of the 475 nm excitation peak [3].
Apparently, GFP dimerization has functional implementations. Chemiluminescent protein aequorin, which is a donor of Aequorea GFP in nonradiative energy transfer, binds to the dimer but not the monomer. Probably in this case the energy of aequorin excited state would be trapped more effectively [3]. Among the GFP-like proteins from class Crustacea, the 3D structure was solved only for ppluGFP2 that is monomer. The majority of naturally occurring Anthozoa FPs and CPs probably form tetramers in solutions, even at nanomolar concentrations. Tetrameric organization has been shown for zoanYFP, zoanGFP, asulGFP, amajGFP [1], ds/drFP616 and red fluorescent variants of asulCP by gel filtration [9], native gel electrophoresis [40, 41], equilibrium sedimentation [40, 42, 43], fluorescence correlation spectroscopy [44] and dynamic-light scattering [43].
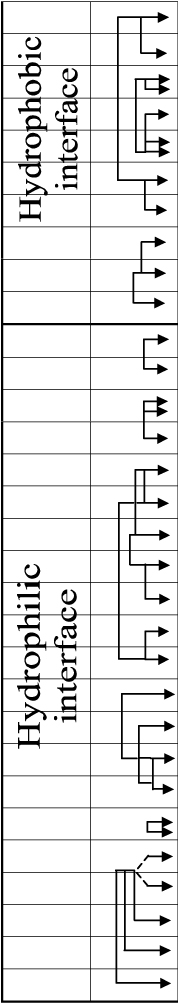
The DsRed1 crystal structure data indicates that this protein is a tetramer [36]. Each DsRed1 monomer interacts with two adjacent monomers by two chemically distinct interfaces (Table 2). Hydrophobic interface is composed by a central cluster of tightly packed hydrophobic residues surrounded by polar amino acids. Hydrophilic interface includes many salt bridges and hydrogen bonds between polar amino acid residues and bound water molecules, and also has an unusual “clasp” formed by C-terminal residues of each monomer. Two DsRed1 structures differing in the position of C-terminal residues (Phe231 and Leu232) have been published. According to the first DsRed1 structure, Phe231 is in the cleft between Arg223 and Glu225 of the adjacent monomers [36]. In the second DsRed1 structure, this cleft is occupied by Leu232, whereas Phe231 is not involved in tetramer formation [35]. Both these conformation may occur in nature.
Table 2.
Interface-Forming Amino Acids in DsRed1 and their Conservation or Variability in Others GFP-like Proteins [201]
| Interface residuesa |
DsRed1 | mRFP1 | dstr GFP |
amaj GFP |
zoan GFP |
zoan YFP |
zoan RFP |
rflo RFP |
mcav RFP |
asul CP |
hcri CP |
|
|---|---|---|---|---|---|---|---|---|---|---|---|---|
 |
97 | V | V | S | T | S | S | S | T | S | T | T |
| 105 | V | V | L | V | V | V | V | V | I | F | I | |
| 107 | T | T | C | T | I | I | I | T | T | T | T | |
| 109 | T | T | T | S | N | N | S | T | R | H | H | |
| 126 | I | R | T | H | Y | N | Y | M | D | L | L | |
| 128 | V | T | L | V | V | M | V | A | V | N | T | |
| 184 | I | T | V | S | V | V | I | I | T | T | S | |
| 19 | E | E | E | D | E | E | E | V | E | E | E | |
| 124 | K | K | K | T | K | I | T | H | R | K | K | |
| 26 | E | E | Y | Y | K | K | K | P | N | Y | Y | |
| 101 | E | E | E | E | E | E | E | E | E | E | E | |
| 157 | R | E | R | C | K | K | S | C | R | V | E | |
| 166 | H | K | H | T | S | S | S | A | N | L | V | |
| 180 | E | E | D | Q | Q | Q | Q | D | D | H | H | |
| 153 | Y | Y | Y | T | I | M | I | F | Y | Y | Y | |
| 176 | H | H | H | N | R | R | R | H | H | H | R | |
| 178 | L | D | V | R | R | R | R | R | R | T | I | |
| 151 | R | R | R | K | K | K | K | I | K | I | V | |
| 168 | A | R | A | F | Y | Y | Y | S | A | A | A | |
| 146 | E | E | E | D | E | E | E | E | E | E | E | |
| 198 | Y | A | Y | N | W | W | W | Y | Y | F | F | |
| 200 | Y | K | Y | V | F | F | F | F | F | F | F | |
| 147 | A | A | P | P | P | A | P | P | P | P | P | |
| 149 | T | T | T | F | C | C | C | T | T | T | T | |
| 229 | H | S | H | T | S | S | S | S | G | C | S | |
| 230 | L | T | P | S | A | A | A | P | L | D | D | |
| 231 | F | G | F | V | L | L | L | L | P | A | L | |
| 232 | L | A | Q | F | P | A | P | Q | R | A | P | |
| 223 | R | R | I | H | H | H | H | G | H | A | A | |
| 225 | E | E | V | V | I | I | I | V | E | V | V | |
| 204 | K | K | K | R | K | K | K | C | S | R | R | |
Interaction between residues of the adjacent subunits are shown by arrows
Interface-forming amino acids of Anthozoa FPs are very diverse. For instance, the hydrophobic interface of DsRed1 includes Glu19, Lys124 and Glu26 residues that can form salt bridges. Hydrophobic interface of rfoRFP [1], apparently, does not contain salt bridges, as it includes Val19, Pro26 and His124. Furthermore, rfoRFP lacks Arg157 that would interact with Glu101 in hydrophilic interface. Protein mcavRFP possibly contains a salt bridge between Arg109 and Asp126 [1]. It should be noticed that all three highly homologous Zoanthus FPs (zoanGFP, zoanYFP and zoan2RFP) have essentially different interfaces with different amino acids at positions 109, 124, 126, 128 and 157. Based on this fact, it can be proposed that fluorescent proteins tend to form homo- rather than heterotetramers. Furthermore, it was shown by fluorescence microscopy of corrals that FPs of different color are usually expressed in different cells of organism. Therefore, the probability to encounter heterotetrameric FPs is extremely low [35].
At the physiological concentrations, wild-type FPs from bioluminescent organisms, including Aequorea and Renilla GFPs, form heterotetramers with their respective photoproteins (FP2×photoprotein2). These observations together with analysis of 3D structures of GFP-like proteins suggested that the role of hydrophobic interface and hydrophilic interface are different. One of these interfaces takes part in homodimer formation, whereas the function of the other interface has changed during evolution. In bioluminescent species, it is responsible for a binding of aequorin or luciferase, while in non-bioluminescent species it binds the second homodimer of GFP-like protein.
The information on the interface-forming residues in DsRed1 tetrameric structure was used to create monomeric variants of FPs. Mutagenesis studies revealed that the tetramer formation is crucial for FPs maturation. Single amino acids substitutions of interface-forming residues led to a drastic decrease in both the fluorescence intensity and the maturation rate [12]. Tetramer disruption is seemed to affect the fluorescent properties of different Anthozoa FPs to a different extent. For instance, HcRed1 was converted to a dimeric form with a single interface mutation of Leu126 to His, without significant loss of fluorescence. The amino acid substitution at the same position (Ile126 to Arg) in DsRed1 resulted in a dimeric protein that was practically non-fluorescent [12]. To recover fluorescence, additional mutations have been introduced. A monomeric variant of DsRed1, mRFP1 containing 33 substitutions has been also created.
Although the overall structures of DsRed1 monomer and Aequorea GFP are very similar (Fig. 6), in contrast to Aequorea GFP, DsRed1 monomers are markedly deformed. GFP is almost perfectly circular when viewed from the end of the barrel, whereas DsRed1 monomer is oval. This structure deformation results in a change of chromophore microenvironment and can influence the protein maturation. This could explain the loss of fluorescence in proteins with substitutions at their interfaces.
Mechanisms of chromophore formation. A unique feature of Aequorea GFP is that its chromophore represents not a prosthetic group (as heme in haemoglobin) but it is formed from residues Ser65–Tyr66–Gly67 within internal α-helix through an autocatalytic posttranslational cyclization between Ser and Gly residues [24, 45] (Fig. 7). Although this tripeptide occurs in other proteins, they lack the chromophore, which confirms the crucial role of spatial structure in formation of mature chromophore. Intriguingly, a recent study of α-synuclein, a protein involved in Parkinson’s disease and a number of other neurodegenerative diseases known as syncleinopathies, uncovered that aggregation of this protein is accompanied by the development of a progressive photo-activity in the visible range of the electromagnetic spectrum [46]. Some parameters of this photo-activity resembled those typical of the family of green fluorescent proteins. Based on these observations it has been hypothesized that the fibrillation-induced photo-activity is governed by the same mechanism as seen for the intrinsic chromophore of 4-(p-hydroxybenzylidene)-5-imidazolinone-type in GFPs and involves several steps of chain cyclization, amino acid dehydration, and aerial oxidation [46].
Fig. (7).

Mechanism of GFP chromophore formation [19]. Rate constants were estimated for mutant of GFP containing the substitution of Ser 65 to Thr [20, 200].
Peptide cyclization is followed by dehydrogenation of the Cα–Cβ bond of Tyr66 by molecular oxygen, resulting in the mature chromophore (a p-hydroxybenzylideneimidazolinone) formation. The chromophore consisting of two aromatic rings and a bridge between them has a planar configuration (Fig. 8a). One of the aromatic rings is a benzene ring of Tyr66 and the other is a 5-membered heterocycle. Thus, the chromophore represents a system of conjugated double bonds which are able to absorb UV-violet and blue light and emit in green spectral region. A hard microenvironment with high packing density is appeared to provide the chromophore high quantum yield.
Fig. (8).

Different types of chromophore in GFP-like proteins.
a –GFP from Aequorea victoria (PDB code 1W7S); b – yellow fluorescent protein zoanYFP from Zoanthus sp. (PDB code 1XAE); c - red fluorescent protein DsRed from Discosoma sp. (PDB code 1G7K); d – far-red fluorescent protein eqFP611 from Entacmaea (PDB code 1UIS); e – non-fluorescent chromoprotein asulCP from Anemonia sulcata (PDB code 2A50); f – non-fluorescent chromoprotein Rtms5 from Montipora (PDB code 1MOU). Numbering of amino acids corresponds to Aequorea GFP. The drawing was generated by the graphic programs VMD [197] and Raster3D [198, 199].
A wide variety of chromophore structures has been observed for Anthozoa GFP-like proteins (Fig. 8). In particular, study of DsRed1 chromophore structure suggested that RFPs contain absorbing structures chemically different from that of GFP [47]. In fact, pronounced spectral shift is hardly due to peculiarities of chromophore microenvironment. After the DsRed1 chromophore structure was solved [48] it became clear that the chromophore-forming amino acids in DsRed1 are Gln65–Tyr66–Gly67. Therefore, pronounced red shift arises from an extension of a system of conjugated double bonds owing to an additional autocatalytic dehydrogenation of the Cα–N bond of Gln65 (Fig. 8d). Crystallographic studies of DsRed1 finally confirmed its chromophore structure, as a change from tetrahedral to planar geometry for α-carbon Gln65 was shown [36]. Furthermore, a chemical synthesis of compounds with similar to DsRed1 chromophore structure demonstrated that an additional double bound can account for the red shift of absorption and emission spectra [49].
The following mechanism of chromophore formation was proposed. First, anionic form of GFP-like chromophore is formed (with excitation and emission maxima at 480 and 500 nm), then anionic chromophore undergoes oxidation leading to mature red chromophore formation (with excitation and emission maxima at 558 and 583 nm). This mechanism was based on several observations: (i) wild-type DsRed1 and its mutant variants contain the molecules which fluoresce in green spectral region [40, 50]; (ii) during maturation process, green fluorescence appears before red one, and than gradually decreases at the same rate as red fluorescence grows; (iii) chemical structure of red chromophore represents a GFP-like core with extended system of conjugated double bonds.
However, an effective energy transfer can exist between red and green monomers in DsRed1 tetramer. Then, decrease in the green fluorescence during the chromophore maturation can be caused by a chemical transformation of green chromophore into red one, as well as by an energy transfer from green to later-maturing red chromophore. To elucidate which of these two mechanisms are valid, absorption spectra should be measured, as fluorescence spectra do not show true amount of each spectral form [50]. The first analysis of absorption spectra during DsRed1 chromophore maturation indicated that the spectrum of freshly expressed DsRed1 has a minor blue peak at 408 nm that is absent in fully matured protein [50]. This spectral form was ascribed to neutral GFP-like chromophore. Also, a continuous increase in intensity of the absorption peak at 480 nm was detected during all the maturation time. Unfortunately, based on the incorrect normalization of all spectra with respect to red absorption at 558 nm, false conclusion about relative decrease of green absorption was made [50].
Recent analysis argues for the revision of maturation mechanism of DsRed1 chromophore [51]. Analysis of the same DsRed1 mutant absorption at different stages of maturation indicated: (i) blue absorption peak at 408 nm appears first, grows for some period of time and then drops to zero; (ii) green absorption peak at 480 nm appears later and increases all the time; (iii) red absorption peak at 558 appears last and also increases all the time; (iv) blue absorption decrease correlates strongly with the red absorption increase (Fig. 10). These data led to conclusion that red chromophore formation passes via accumulation of neutral GFP-like chromophore, while anionic GFP-like chromophore is not intermediate as it was thought earlier [40]. Proposed scheme explains incomprehensible fact of a green forms presence in mature DsRed1 and many of its mutants.
Fig. 10.

(A) Time course of the formation of blue, green and red forms of the DsRed1 chromophore with absorption maxima at 408, 480 and 558 nm, respectively (top) and proposed scheme for these spectral forms formation from non-fluorescent precursor (bottom) [51]. (B) The schematic diagram of the chromophore formation in various GFP-like proteins. The GFP- and DsRed-like chromophores are supposed to be intermediates on the pathway of some other chromophore maturation [57].
Protein Rtms5 from corrals Montipora efflorescens [52] is the first chromoprotein for which the chromophore structure has been solved. Rtms5 has been shown to contain DsRed-like nonplanar chromophore in unusual trans-configuration (DsRed and Aequorea GFP chromophores adopt cys-configuration) (Fig. 8f). Chromophore of red fluorescent protein eqFP611 from the sea anemone Entacmaea quadricolor also adopts trans-configuration [53] but it is planar in contrast to Rtms5 chromophore (Fig. 8e). According to these observations, it can be proposed that coplanarity of the chromophore is required for a high fluorescence quantum yield, while nonplanar chromophore in trans-configuration is typical for chromoproteins. The confirmation of this assumption was obtained via crystallographic studies of photoactivatable protein, asulCP, from sea anemone Anemonia sulcata in non-fluorescent state. It was shown that asulCP chromophore comprises a 5-membered p-hydroxybenzylideneimidazolinone moiety that adopts a non-coplanar trans-configuration (Fig. 8c). Unexpectedly, fragmentation of the polypeptide at the bond between carbon atom of Cys64C and N1 atom of Met65 (numbering of amino acids corresponds to Aequorea GFP) was found to occur after chromophore cyclization [54].
The other fluorescent protein, yellow zoanYFP from the button polyp Zoanthus sp., contains a three-ring chromophore (Fig. 8b). Mature chromophore of zoanYFP is formed from amino acids Lys65–Tyr66–Gly67 (numbering of amino acids corresponds to Aequorea GFP). The GFP-like chromophore structure is formed at the initial stages of maturation, then cyclization of Lys66 results in a new six-membered ring. At the last stage, the polypeptide backbone undergoes cleavage at position between 64 and 65 amino acids [55].
Crystallographic studies of an orange fluorescent protein, mOrange, (mutant variant of DsRed1) revealed that process of its chromophore maturation passes through the formation of a DsRed-like chromophore, which then undergoes additional cyclization reaction of Thr65 with the carbonyl carbon of Phe64 resulting in dihydroxyoxazole ring [56]. The recent general scheme of formation pathway for various chromophores [57] assumes that the DsRed-like chromophore is not the end of the pathway but is just an intermediate compound for several other chromophores such as zoanYFP and mOrange (Fig. 10b).
Chromophore microenvironment. Spectral properties of FPs are determined by non-covalent interactions of chromophore with side chains of residues from its microenvironment which was confirmed by mutagenesis of Aequorea GFP [58] and Anthozoa GFP-like proteins.
DsRed1 chromophore microenvironment contains many polar amino acids, a complex network of hydrogen bonds and salt bridges. The oxygen atom of Tyr66 forms a hydrogen bond with Ser148 residue (Fig. 9b), that is absolutely conserved in all Anthozoa FPs but absent in CPs. This contact between Ser148 and Tyr66 residues is likely to stabilize chromophore in the fluorescent state. The mutagenesis studies confirmed Ser148 to be the key residue in interconversion between FPs and CPs [2, 8]. For instance, asulCP from Anemonia sulcata with quantum yield less then 0.001 has in this position Ala residue, which substitution to Ser causes more then 2-fold increase in the quantum yield.
Fig. (9).

The microenvironment of DsRed1 chromophore (a and b), Aequorea GFP chromophore (c) and asulCP chromophore (d).
Carbon, nitrogen, oxygen and sulfur are gray blue, red and yellow, respectively. The drawing was generated by graphic programs VMD [197] and Raster3D [198, 199.].
In contrast to residues Thr203 and Tyr66 in Aequorea GFP [24] residues Ser203 and Tyr66 in DsRed1 do not form a hydrogen bond despite the short distance between them. At the same time, mutations at position 203 result in considerable changes of the DsRed1 spectral properties. Substitution of Ser203 to Ala leads to increase in the protein maturation rate [59]. Substitution of Ser203 to Thr results in a more pronounced green fluorescence in immature protein, while substitution of Ser203 to Thr partially suppresses green emission and increases folding efficiency [60].
Special emphasis should be paid to position 165. In DsRed1, Ile165 residue is located in immediate proximity to phenolic ring of Tyr66 (Fig. 9b). In GFP, Phe165 also has the same spatial position (Fig. 9c) [24]. These amino acids prevent cis–trans chromophore isomerization, which could be the main reason for the non-radiative deactivation of chromophore exited state [61, 62]. In fact, all FPs contain bulky aliphatic residues (Phe, Ile, Val) in this position, while it is occupied by small hydrophilic amino acids (Asn or Ser) in CPs (Fig. 9d). The significance of these differences was verified by mutagenetic studies. For instance, Ser165→Val substitution in asulCP caused the red fluorescence formation, while Ile165→Asn substitution resulted in the non-fluorescent variant of DsRed1 [8].
It should be noticed that in DsRed1 oxygen of Tyr66 is in the direct contact with the positively charged Lys167 (Fig. 9b), while none of known FPs, including closely related red dis2RFP, have Lys in position 167. Random mutagenesis of DsRed1 revealed no significant change of spectral properties when Lys167 was substituted to Gln or Met [12]. However, Lys167→Met substitution in combination with substitutions at positions 148, 165 and 203 resulted in essential decrease of protein quantum yield. Thus, this ionic contact is unlikely to play an important role in the formation of fluorescent properties. Nevertheless it likely provides additional chromophore stabilization in ionic form.
Based on these findings, DsRed-NF mutant with four amino acid substitutions, namely Ser148→Cys, Ile165→ Gln, Lys167→Met and Ser203→Ala, was created [8]. DsRed-NF have high extinction coefficient (57×103 M−1 CM−1) and extremely low quantum yield (<0,001), which regards DsRed-NF as a true chromoprotein.
Computer modeling of the DsRed-NF chromophore microenvironment showed that Cys148 and Met167 in DsRed-NF, in contrast to Ser148 and Lys167 in DsRed, were incapable of stabilizing the chromophore by hydrogen bonds with oxygen of Tyr66. Furthermore, substitution of Ile165 to Gln generated a free space near the chromophore, which is believed to be sufficient to ensure the chromophore cis-trans isomerization after light absorption. Thus, absence of phenolate-stabilizing contacts together with free space around the chromophore can explain an extremely low fluorescence quantum yield of DsRed-NF.
The chromophore microenvironment of DsRed1 carries also Arg96, Lys69 and Glu222 (Fig. 9ab). Residue Arg96, being located in the immediate proximity of imidazolinone oxygen, is highly conserved (Fig. 9cd). Arg96 was proposed to participate in catalysis of backbone cyclization. Intensive studies revealed that the main function of Arg96 is to induce structural rearrangements important in aligning the molecular orbitals for ring cyclization through electrostatic destabilization and deprotonation [63]. In DsRed1, evolutionarily conserved Glu222 is located closer to the chromophore than in GFP (Fig. 9ac). It contacts the positively charged side chain of Lys-69 and the water molecule positioned near the Gln-65. The correct orientation of Glu222 was suggested to play an important role in the red chromophore maturation [36]. All Anthozoa GFP-like proteins carry Arg or Lys residue at position 69 (Fig. 9d). Positive charge of these amino acid residues is evidently important for polypeptide chain organization regardless the protein spectral properties.
In DsRed1, residue Ser68 is located next to Cα=N double bond of Gln65 (Fig. 9a). Ser68 is proposed to play a role in formation of this bond. In fact, Oγ of Ser-69 is located over the Cα-N bond of Gln65 in a position appropriate for proton abstraction [36]. Comparison of amino acid sequences of GFP-like proteins showed that many red-shifted proteins contain Ser at position 68. Substitution of Asn68 to Ser (in combination with substitution of Ile112 to Ser) in dstrGFP led to an additional red fluorescence peak [7]. At the same time, yellow fluorescent protein zoanYFP has Asp at position 68, substitution of which to Asn resulted in additional green fluorescence peak [7]. Exception to the rule is a group of novel “fluorescent timers”, such as zoan2RFP, mcavRFP and rfloRFP, which change their fluorescence properties during maturation (from green fluorescence to red or mixed) [1]. In spite of the fact that they possess a red-shifted chromophore, they have usual for GFPs Asn residue at position 68. In DsRed1, Asn42 interacts with Glu222, Gln65 and Ser68, fixing them at correct conformations (Fig. 9a). This fact can explain an essential increase of green fluorescence associated with several Asn42 substitutions [50]. Single substitution of Tyr121 to His in DsRed1 increased the absorption peak at 500 nm and suppressed the absorption peak at 580 nm [50]. This substitution apparently resulted in “improper” conformation of Ser68, which was unable to catalyze Gln65 dehydrogenation.
CONFORMATIONAL STABILITY OF GFP-LIKE PROTEINS
GdmCl-induced unfolding: The role of the quaternary structure. Recently, a series of green and red fluorescent proteins with different association state was systematically analyzed to gain more information on the effect of the oligomeric state on structural properties and conformational stabilities of GFP-like fluorescent proteins [64, 65]. Upon denaturation, the GFP chromophore remains chemically intact but the chromophore undergoes attacks by water molecules, and its fluorescence is quenched. Therefore, GFP emits fluorescence only when it has the correct tertiary structure of the native form and the green (or red) fluorescence is a sensitive probe of the folding of the protein [66].
GFP is a globular protein consisting of 238 amino acid residues [67]. Crystallographic structures resolved for the wild-type GFP and its enhanced mutants (ECFP, 1C4F.ent, and EYFP) revealed that these proteins resemble an 11 stranded β-can wrapped around a single central helix in the middle of which is the chromophore [24, 25, 68]. The cylinder has a diameter of about 30 Å and a length of about 40 Å [68]. Both GFP and EGFP possess high conformational stability under a variety of conditions, including a treatment with detergents [37, 69], proteases [70], GdmCl [64, 66], and temperature [64, 71].
Although the monomer of DsRed1 folds into a β-can identical to structure of EGFP [36], both sedimentation [40, 42] and crystallographic studies [36] have revealed that DsRed1 forms a tight tetramer with nanomolar association constant [40]. Many GFP-like proteins possess obligate tetrameric structures [41], raising an important question on the role of oligomeric structure in the conformational stability of GFP-like proteins. Comparison of EGFP and DsRed1 conformational stabilities in vitro and in vivo revealed that the apparent rate constants of thermal and GdmCl-induced denaturation were several orders of magnitude lower for DsRed1 as compared to EGFP [64]. Furthermore, several times longer life-times of DsRed1 vs. EGFP were observed in cultured cells and in embryos. It has been pointed out that the high homology in packing of internal residues in EGFP and DsRed cannot explain the outstanding stability of latter, and the remarkable conformational stability of DsRed under the all conditions studied has been attributed to its tetrameric organization [64]. It has been shown that GFP-like proteins from other Anthozoa organisms with obligate dimeric organization also exhibited higher resistance against unfolding: Renilla reniformis GFP was shown to lose its fluorescence in detergents significantly slower than Aequorea GFP [72], an Renilla muelleri GFP had higher than EGFP melting temperature [70].
The assumption on the crucial role of the oligomeric state on the conformational stability of FPs was checked via the comparative analysis of several FPs with different oligomerization degrees. The list of studied proteins includes EGFP (green monomer), zFP506 (green tetramer), mRFP1 (red monomer), "dimer2" (red dimer), and DsRed1 (red tetramer). These five FPs were subjected to the thorough conformational analysis using fluorescent and absorbance parameters, near-UV and visible CD spectra, accessibility of the chromophores and tryptophans to acrylamide quenching, as well as resistance of these proteins toward the guanidine hydrochloride unfolding and kinetics of the approaching of unfolding equilibrium [65]. The brief description of the proteins of interest is presented below.
In order to prevent red FP oligomerization, the monomer interfaces in the DsRed1 tetramer were modified by the insertion of positively charged arginines, which initially crippled the protein, but red fluorescence was then rescued by random and directed mutagenesis [12]. The final monomeric mRFP1 mutant contains 33 mutations of which 13 are internal to the β-barrel, 3 are in the short N-terminal, 13 are interfaces mutations and 4 are in positions where the exact effects on structure/function are unknown. Although mRFP1 has a 1.3-times lower extinction coefficient and 3.2-times less quantum yield, it acquires red fluorescence more than 10 times faster than DsRed1, showing similar brightness to DsRed1 in living cells [12].
The dimeric form of red FP, "dimer2" [12], is a result of coupled site-directed and random mutagenesis of an engineered fast maturating tetrameric variant of DsRed, known as T1 [73]. Final variant contains 17 substitutions, eight of which are internal to the β-barrel (N42Q, V44A, V71A, F118L, K163Q, S179T, S197T, and T217S), three are the aggregation-reducing mutations, found in T1 (R2A, K5E, and N6D) [73], two are AB interface mutations (I125R and V127T), and four are miscellaneous surface mutations (T21S, H41T, C117T, and S131P) [12]. These mutations produce a stable dimeric variant, which, being characterized by ~15% decrease in the fluorescence quantum yield, was shown to have an extinction coefficient comparable with that of DsRed1 [12]. Furthermore, dimer2 was shown to acquire red fluorescence at 37°C more than 5 times faster than DsRed1 [12].
Finally, zFP506 is a GFP-like protein isolated from Zoanthus sp. [47]. This protein is very different from Aequorea victoria GFP in its amino acid sequence (GFP and zPF506 possess ~30% sequence identity), but major spectroscopic properties of GFP and zPF506 are rather similar [47]. Recently, it has been shown that contrarily to the monomeric GFP from Aequorea victoria, zPF506 is predominantly a tetramer [41].
Incubation of FPs in the presence of concentrated solutions of GdmCl caused rather slow decrease in their fluorescence intensities. The rate of unfolding was shown to depend on the oligomerization state for green FPs, whereas among three red fluorescent proteins studied, the "dimer2" was the least stable and DsRed was extremely stable, losing only ~11% fluorescence intensity after the incubation for more than 20 hrs in the presence of 6.2 M GdmCl. Overall, fluorescent proteins were shown to form the following series in respect of their rates of GdmCl-induced unfolding (from the slowest to the fastest): DsRed < zFP506 < mRFP1 < "dimer2" < EGFP [65].
Fig. 11 illustrates that the establishing of unfolding equilibrium was shown to be an extremely slow process for all FPs studied too. It represents the GdmCl-induced changes in fluorescence intensity measured for a given protein (EGFP, zFP506, mRFP1, "dimer2", and DsRed,) after incubation for the desired amount of time in the presence of the desired GdmCl concentration. These data have been used to estimate the kinetics of the approaching of unfolding equilibrium, as time courses of corresponding C1/2 values (half-transition concentrations of GdmCl). This analysis gave the rate constants of (17.73±0.22)×10−6 and (4.17±0.22)×10−6 s−1 for EGFP and zFP506, respectively, and the rate constants of (4.57±0.26)×10−6, (3.89±0.19)×10−6, and (9.59±0.76)×10−6 s−1 for mRFP1, "dimer2" and DsRed, respectively. Thus, for all fluorescent proteins studied, it took several days to approach the unfolding equilibrium, which is rather unusual [65]. This very slow establishing of equilibrium suggests that there are high folding/unfolding energy barriers [74].
Fig (11).

Quasi-equilibrium unfolding of EGFP (A), zFP506 (B), mRFP1 (C), "dimer2" (D) and DsRed (E) induced by GdmCl. Measurements for EGFP were performed after 5 (circles), 15 (squares), 43 (triangles), 67 (reversed triangles) and 216 hrs (diamonds) of incubation in the presence of desired GdmCl concentration. Fluorescence was excited at excited at 365 nm and detected at 510 nm for EGFP and zFP506, 585 nm for DsRed1 and "dimer2", and at 610 nm for mRFP1. Measurements for zFP506 were done after 1 (circles), 2 (squares), 3 (triangles) and 5 days (reversed triangles) of incubation in the presence of desired GdmCl concentration. Measurements for mRFP1 were performed after 1 (circles), 2 (squares), 3 (triangles), and 5 days (diamonds) of incubation in the presence of desired GdmCl concentration. Measurements for "dimer2" were done after 1 (circles), 2 (squares), 3 (triangles) and 5 days (dimonds) of incubation in the presence of desired GdmCl concentration. Fluorescence was excited at excited at 365 nm and detected at 510 nm for EGFP and zFP506, 585 nm for DsRed1 and "dimer2", and at 610 nm for mRFP1. Measurements for DsRed were done after 5 (circles), 24 (squares), 56 (triangles), 100 hrs (diamonds) of incubation in the presence of desired GdmCl concentration.
Finally, Fig. 12 represents equilibrium GdmCl-induced unfolding curves for FPs and gives further confirmation to the conclusion about the dramatic difference in the conformational stability of FPs. As the establishing of the unfolding equilibrium in FPs is a very slow process [see above and [64, 65], data for this plot have been accumulated after the incubation of all proteins in the presence of desired GdmCl concentration for 9 days. Fig. 12 shows that the addition of small concentrations of denaturant (0.4 M GdmCl) induces considerable increase (~20%) in the green fluorescence intensity for both EGFP and zFP506. The fluorescence intensity remains unchanged within the intervals of 0.4–2.0 and 0.4–5.6 M GdmCl for EGFP and zFP506, respectively, and then sharply decreases. On the other hand, small concentrations of GdmCl affected red fluorescence in a different manner: we have detected 10% increase in the fluorescence intensity of DsRed after the addition of 0.4 M GdmCl, whereas fluorescence of "dimer2" decreases by 10% under the same conditions, and red fluorescence of mRFP1 remains constant from 0 to 4.8 M GdmCl. Fig. 12 shows that when GdmCl concentrations are higher than 0.5 M, the dependencies of the fluorescence intensities on denaturant concentrations are typical sigmoidal curves. Based on these data it has been concluded that zFP506 is much more stable than EGFP, whereas according to their conformational stability, red FPs are distributed as follows: "dimer2" < DsRed < mRFP1 [65].
Fig. (12).

Equilibrium GdmCl-induced unfolding of EGFP (light green circles and lines) zFP506 (dark green circles and lines), mRFP1 (blue circles and lines) "dimer2" (pink circles and lines), and DsRed (red circles and lines) detected by GdmCl-induced changes in characteristic green or red fluorescence measured after the 9 days of incubation in the presence of desired GdmCl concentration.
Overall, this analysis revealed that conformational stabilities of fluorescent proteins varied dramatically. In series of green FPs, the protein association is in fact can be considered as a major stabilizing factor, as tetrameric zFP506 was shown to be much more stable than monomeric EGFP. On the other hand, data for red FPs do not confirm this conclusion. In fact, these proteins possess relatively close conformational stabilities, with monomeric mRFP1 being the most stable species under the equilibrium conditions, and with tetrameric DsRed showing the slowest unfolding kinetics. Furthermore, there was a dramatic difference in the conformational stabilities and unfolding kinetic parameters within the pair of green and red monomers and the pair of green and red tetramers. All this suggests that the quaternary structure, being important, does not represent the only factor determining the dramatic variations between fluorescent proteins in their conformational stabilities [65].
Acid denaturation: Evidence for a partially folded intermediate. Recently, the effect of pH on structure of GFP-like proteins was analyzed using a triple Phe99Ser/Met153Thr/ Val163Ala mutant of GFP, Cycle3 (also known as GFPuv) [75, 76]. Cycle3 was shown to mature more efficiently in vivo than wild-type GFP [77] and to possess highly reversible denaturation [66]. Chromophore and tryptophan fluorescence, as well as far-UV circular dichroism (CD) were utilized as probes to follow equilibrium and kinetic unfolding and refolding processes [75]. Using a stopped-flow apparatus to investigate the rapid folding reactions the kinetic folding reaction of Cycle3 was shown to contain at least five kinetic phases and involves nonspecific collapse within the dead time of a stopped-flow apparatus and the subsequent formation of an on-pathway intermediate that has the characteristics of the molten globule state [75]. Furthermore, the slowest phase and a major portion of the second slowest phase were shown to be rate-limited by slow prolyl isomerization in the intermediate state, and this rate limitation accounted for a major portion of the observed kinetics in Cycle3 folding [75]. In the subsequent more detailed study [76], the equilibrium acid-induced denaturation of Cycle3 was monitored by chromophore and tryptophan fluorescence and small-angle X-ray scattering. This analysis revealed that this protein accumulates at least two equilibrium intermediates, a native-like intermediate and an unfolding intermediate, exhibiting the major characteristics of the molten globule state [76]. The potential role of the equilibrium unfolding intermediate in folding was evaluated via a series of kinetic refolding experiments with various combinations of initial and final pH values, including pH 7.5 (the native condition), pH 4.0 (the moderately denaturing condition where the unfolding intermediate is accumulated), and pH 2.0 (the acid-denaturing condition). At least two kinetic on-pathway intermediates were detected in the refolding from pH 2.0 to pH 7.5, and these intermediates were shown to be the equivalent of, or at least closely related to, the equilibrium intermediate populated at pH 4.0. Furthermore, when the kinetic refolding reaction was initiated from pH 4.0, the first observable phase in the refolding from pH 2.0 disappeared. This suggested that the first observable phase may correspond to a refolding process from the acid-denatured state to the molten globulelike intermediate [76].
Global and local stability of GFP at atomic resolution. The hydrogen/deuterium (H/D) NMR exchange rates of more than 157 assigned amide protons were used to evaluate the dynamics and stability of GFP at atomic resolution [74]. A complete assignment of the NMR resonances for the backbone (13C, 15N and 1H) of GFP [78, 79] enabled the use of H/D exchange technique to probe the stability and folding of the protein under equilibrium conditions. This analysis revealed that the most slowly exchanging residues in GFP are clustered together primarily on one face of the β-can. However, at one end of the can they do form a ring-like structure (see Fig. 13). It is likely that these residues exchange only very slowly because they remain involved in hydrogen-bonded secondary structure in the intermediate state [74].
Fig. (13).

Three-dimensional representation of the positions of residues in GFPuv (PDB code 1B9C) with very slow H/D exchange rate constants for the amide groups [74].
Left and right figures are viewed from two opposite sides. The central figure is from the top of the β-barrel. The chromophore is shown in stick mode. Red and yellow balls represent very slow exchanging residues in β-strands and α-helixes, respectively. Each β-strand is numbered from the N to the C terminus. The drawing was generated by the graphic programs VMD [197] and Raster3D [198, 199].
APPLICATION OF GFP-LIKE PROTEINS IN CELL BIOLOGY
The advantages of GFP-like proteins as fluorescent markers include their high stability and the ability to form for chromophore without auxiliary cofactors or substrate. Furthermore, FP fusion to target protein rarely affects the function of this protein. However, this is not always the case and sometimes fusion of GFP-like proteins to target protein may significantly affect its functions. For example, it has recently been shown that GFP strongly impairs actin-myosin interaction by binding to the actin-binding site of myosin [80]. Another crucial advantage is that GFP-like proteins are non-toxic in most cases. GFP-like proteins were demonstrated to be highly resistant to many proteases [70], detergents [37, 69], organic and chaotropic salts, alkaline pH and high temperature [71]. The main trends of GFP-like protein applications in cell biology, disadvantages of fluorescent proteins, limiting their use, and methods to overcome these limitations are summarized in this section.
Reporters for gene activation and fusion tags. By using a fluorescent protein gene (reporter gene) that is under control of a promoter of interest and recording the FP fluorescence intensity, gene expression can be monitored. Gene of Aequorea GFP was the first reporter gene [70]. Henceforward, FPs have been successfully applied in a variety of cell cultures and organisms, such as bacteria [81], yeast [82], plants [83], worms [84], insects [60, 85] and vertebrates [84, 86]. Chimeric protein between FP and protein of interest (fusion protein) can be constructed by using standard cloning techniques. Fusion protein expression allows researchers to monitor target protein localization and to visualize dynamics of cell events.
The means of GFP-like protein applications in cell biology are widely diverse and include their use as partners for multicolor protein tagging [87, 88], as intracellular reporters of gene activation [89–91], as markers of cell lineage during development and as markers of cell growth, including pathogenic bacteria and cancer cells [60, 84], as markers of protein, organelles and virus particles localization in living cells [92–94], as population markers in symbiotic studies [95, 96], as reporters of bacterial phagocytosis [96, 97] and so on.
It is more preferable to use red FPs as fluorescent markers, because of higher tissue transparency and lower autofluorescence in this spectral region. Moreover, the use of red FPs in counterpart to Aequorea GFP increases the range of FPs applications, enabling multicolor labeling. The presence of cryptic introns in mRNA of wild-type DsRed1 and some others Anthozoa FPs can results in partial splicing in mammalian cells and cause premature translation termination with formation of less whole-length protein having low fluorescence intensity. This disadvantage can be easily overcome by removing putative cryptic introns as in the commercially available version of DsRed1 (Clontech, USA).
Many Anthozoa GFP-like proteins have a tendency to form high molecular weight aggregates both in vivo and in vitro [41]. Protein aggregation may hinder all possible applications due to considerable cellular toxicity and make impossible FRET-based applications (fluorescence resonance energy transfer), the study of protein-protein interactions and proper targeting to cell compartment. Aggregation generally takes place during heterologous over-expression of FPs in both bacterial and eukaryotic cells. FP aggregation can be observed as appearance of large fluorescent granules inside transfected cells, which results in ‘smearing’ of the fluorescent picture, so that nuclei and nucleoli are usually invisible.
The crystal structure of DsRed1 provided clues on the reasons for FP aggregation. Aggregates were suggested to form by properly folded native protein molecules, as they retain bright fluorescence. Two main reasons of protein aggregation were proposed. It can be driven by non-specific interactions of “sticky” hydrophobic patches on the molecular surface [98]. Alternatively, it can be due to the electrostatic interactions between positively and negatively charged surfaces. However, DsRed1 was shown to contain no pronounced hydrophobic areas that may cause strong interactions between tetramers. A computer calculation of the electrostatic potential of tetrameric DsRed1 revealed that the protein surface is mostly negatively charged, except for a short N-terminal region of each monomer that contains a group of positively charged amino acid residues [41]. Based on these observations, it was proposed that each tetramer is able form up to four salt bridges with adjacent tetramers, resulting in the net-like polymeric structure. Four valencies for electrostatic interactions make this structure very stable [41].
Site-directed mutagenesis was used to solve the problem of FP aggregation, regarding positively charged patches at N-termini as a possible cause of aggregation. A variant of DsRed1, E57 (Val105Ala/Ile161Thr/Ser197Ala), was subjected to mutagenesis. Mutant E57 is characterized by fast maturation; its red fluorescence appears 2 times faster than of wild-type DsRed1 [84]. As result, a mutant, denoted E57-NA with minimal level of aggregation both in vivo and in vitro, containing three substitutions (Arg2→Ala, Lys5→Glu, and Lys9→Thr) was created. E57-NA was very similar to E57 in terms of excitation–emission maxima, fluorescence brightness and maturation speed [41], which made it promising for further use. A considerable increase in protein solubility by substitution of one to three positively charged amino acid residues at the N-termini to neutral or negatively charged residues represented a successful strategy for other Anthozoa GFP-like proteins (zFP538, zFP506, amFP486). These findings confirmed an electrostatic nature of interaction responsible for the formation of aggregates of GFP-like proteins.
Although the tetramerization complicates FP applications as partners for FRET and as fusion-partner for a target protein, oligomerization does not limit the use of FPs as markers of gene expression [10, 99]. Tetrameric nature of many GFP-like proteins can result in abnormal localization of a protein tagged by FPs. Furthermore, as the oligomerization of many proteins involved in signal transduction leads to their activation, the fusion of a signal protein to FPs can cause constitutive signaling. Intensive mutagenesis of DsRed1 resulted in monomeric variant mRFP1, containing 33 substitutions: 3 in the hydrophobic interface and 10 in the hydrophilic interface, 3 in short the N-terminal region, 13 internal to the β-barrel and 4 surface mutation with unknown effect on protein structure and function [12]. Mutant mRFP1 possesses 1.3-times lower extinction coefficient and 3.2-times less quantum yield than DsRed1, but it has 10-times higher maturation speed. mRFP1 still contains fraction of “green” chromophore, which can impede with FRET and multicolorlabeling applications. Novel monomeric RFPs, such as mOrange, mStrawberry, mCherry, mRaspberry and mPlum have substantially enhanced maturation rate, brightness and photostability [13, 14]. Recently developed monomeric variant of eqFP578, TagRFP, has even higher brightness than mCherry, which would make TagRFP a protein of choice as a monomeric fluorescent tag in red region of the spectrum. The other monomeric mutant of eqFP578, mKate, has compared to mCherry brightness, but within spectral range of 650–800 nm mKate is essentially brighter than any known monomeric red and far-red fluorescent proteins. Thus mKate is preferable fluorescent marker in far-red region of the spectrum.
Several other approaches have been developed to overcome oligomerization of Anthozoa FPs. One of them is covalent head-to-tail linkage of double copies of the same FPs; formed tandem dimeric structure may prevent oligomerization. This approach was successfully applied for HcRed1 [10] and dimeric variants of DsRed1 [12]. It was shown that tandem proteins, containing 4- and 12-residue linker between monomers for HcRed1 and dimeric variants of DsRed1 respectively, had the best properties in terms of chromophore maturation rate and final fluorescence intensity. Both tandem proteins demonstrated the same spectral properties as their parent proteins. Expression of tandem HcRed1 with β-actin fusion resulted in labeled patterns indistinguishable from those produced by widely used EGFP-fusion constructs, thus indicating the potency of tandem HcRed1-fusion proteins using in in vivo labeling of cytoskeleton structures. Fusion constructions of tandem dimeric DsRed1 with connexin43 were correctly transported to the membrane and successfully formed functional connexin channels, but were unable to assemble into a large gap junction.
The other approach to overcome oligomerization is to use pseudo-monomeric form of tetrameric fluorescent proteins. The strategy is based on the co-expression of FP-fused protein of interest with a large excess of free non-fluorescent variant of this FP (FP-helper). This leads to the formation of FP heterooligomers containing only a single target protein linked to tetrameric FP-tag, which therefore can be considered as pseudo-monomers. The feasibility of this method has been demonstrated with red fluorescent mutant of asulCP, M355NA, fused to human cytoplasmic β-actin and asulCP-Ala148Cys as FP-helper [100]. L929 fibroblasts were transfected with IRES-containing vector for bicystronic expression of the helper asulCP-Ala148Cys and M355NA–actin, or with M355NA–actin under IRES control, but without asulCP-Ala148Cys. As Cap-dependent translation is several times more effective than IRES- dependent one, asulCP-Ala148Cys is produced in higher concentration with regard to M355NA–actin. M355NA–actin expression alone resulted in a high level of cytoplasmic aggregation, in contrast, the templates, obtained with co-expression of M355NA–actin with excess of asulCP-Ala148Cys, were indistinguishable from those produced by EGFP-actin constructs.
Selection of fluorescent proteins (FP) for the multicolor protein labeling. In the Table 3 best currently available proteins for each of blue, cyan, green, yellow, orange, red and far-red wavelength ranges are summarized. We would like to briefly review here some criteria to choose the right fluorescent proteins for experiment.
Table 3.
Current Mostly Used Fluorescent Proteins
| Protein | Reference | Excitation peak, nm | Emission peak, nm | Brightness, % of EGFPa |
|---|---|---|---|---|
| Blue fluorescent proteins | ||||
| EBFP | [202] | 380 | 440 | 27 |
| Azurite | [203] | 383 | 447 | 43 |
| EBFP2 | [204] | 383 | 448 | 60 |
| Cyan fluorescent proteins | ||||
| Cerulean | [205] | 433 | 475 | 79 |
| ECFP | www.clontech.com | 439 | 476 | 39 |
| CyPet | [172] | 435 | 477 | 53 |
| TagCFP | www.evrogen.com | 458 | 480 | 84 |
| Green fluorescent proteins | ||||
| AzamiGreen | www.mblintl.com | 492 | 505 | 121 |
| TagGFP | www.evrogen.com | 482 | 505 | 100 |
| EGFP | www.clontech.com | 484 | 507 | 100 |
| Emerald | [206] | 487 | 509 | 116 |
| T-Sapphire | [207] | 399 | 511 | 78 |
| Yellow fluorescent proteins | ||||
| TagYFP | www.evrogen.com | 508 | 524 | 137 |
| EYFP | www.clontech.com | 514 | 527 | 151 |
| Topaz | [206] | 514 | 527 | 169 |
| Venus | [208] | 515 | 528 | 156 |
| Citrine | [209] | 516 | 529 | 174 |
| YPet | [172] | 517 | 530 | 238 |
| Orange fluorescent proteins | ||||
| Monomeric Kusabira Or- ange (mKO) |
www.mblintl.com | 548 | 559 | 92 |
| mOrange | [13] | 548 | 562 | 146 |
| Red fluorescent proteins | ||||
| dTomato (dimer) | [13] | 554 | 581 | 142 |
| DsRed (tetramer) | www.clontech.com | 558 | 583 | 176 |
| DsRed-Express (tetramer) | www.clontech.com | 555 | 584 | 58 |
| TagRFP | [15], www.evrogen.com | 555 | 584 | 146 |
| DsRed-Monomer | www.clontech.com | 556 | 586 | 10 |
| mStrawberry | [13] | 574 | 596 | 78 |
| mCherry | [13] | 587 | 610 | 47 |
| mKeima | [210] | 440 | 620 | 12 |
| Far-red fluorescent proteins | ||||
| mRaspberry | [14] | 598 | 625 | 37 |
| Katushka (dimer) | [16] | 588 | 635 | 67 |
| mKate (TagFP635) | [16], www.evrogen.com | 588 | 635 | 45 |
| HcRed (tetramer) | [211] | 592 | 645 | 5 |
| mPlum | [14] | 590 | 649 | 12 |
Brightness is a product of extinction coefficient and quantum yield of protein.
Higher intrinsic brightness: Recommended brightness is at least 30% of that of common EGFP.
Monomeric state: even a weak FP dimerization may cause incorrect cellular labeling pattern. The best recommended approach is comparing the pattern with the immunostaining using antibodies to the labeled protein. Less good is comparing the cellular labeling pattern with that of the EGFP labeling. At last run a native SDS-PAGE gel with the purified FP.
Faster chromophore formation: the shorter time for fluorescence maturation will result in detecting the faster intracellular events. Recommended maturation time is less than 30 minutes for the time to achieve a half-maximum of the FP fluorescence.
Higher pH-stability: the higher pH stability of FP is the brighter labeling in acidic organelles such as endosomes, lysosomes, etc. Recommended pKa value is less than 6.0 (here, pKa is pH value at which FP looses a half of its brightness).
Higher photostability: the larger stability of the chromophore in the high-power light irradiation is the longer you are able imaging the cell. The most photostable FP for each respective wavelength range is recommended.
Larger spectral separation of two FPs to be used simultaneously: with common filters and standard microscopic techniques 50 nm or more difference between both the FP excitation and FP emission peaks is recommended.
Fluorescent timers. Red fluorescent proteins from Anthozoa species (such as DsRed1) are characterized by much slower maturation than Aequorea GFP. This property could be used in developmental timing studies. When expressed under the same promoter, red fluorescence of DsRed1 appears 18–20 hours later than green fluorescence of Aequorea GFP. If the activation of expression occurs soon after cell division or differentiation, then color of fluorescence is indicative of the cell differentiation order [60].
Some of Anthozoa RFPs, such as zoan2RFP, mcavRFP, rfloRFP [1] and mutant DsRed-E5 [84], change their spectral properties during maturation. DsRed-E5 and zoan2RFP can be considered as absolute fluorescent timers, since at early stage of maturation they fluoresce in green spectral region and after complete maturation they exhibit red fluorescence. At the same time, mature mcavRFP and rfloRFP have fluorescence spectra with both green and red peaks.
DsRed-E5 and zoan2RFP can be used to obtain precise information about activation and downregulation of target promoters. Theoretically, the appearance of green fluorescence indicate recent promoter activation, yellow-orange fluorescence means continuous activation and red one shows cessation of promoter activity.
DsRed-E5 was used to trace the activity of the Otx-2 promoter, which is involved in Xenopus laevis development. A Xenopus laevis embryo was microinjected with a plasmid containing DsRed-E5 gene under control of the Otx-2 promoter. Expression of Otx-2 was primary observed in the telencephalic and ventral diencephalic brain regions. At the tadpole stage, Otx-2 expression in these regions was almost completely suppressed, but high level of Otx-2 expression was found in the mesencephalic area [101].
Studies of diffusion and transport of proteins, organelles and cells. Aequorea GFP, as well as the majority of Anthozoa FPs, can be irreversibly photobleached being irradiated with the intensive light at their absorption maxima for a prolonged time (about 10–103 c). Presumably because Anthozoa RFPs have more complex chromophore structure and can possess several chromophore forms they show more complex photobleaching kinetic than Aequorea EGFP does. DsRed1 and its mutants, including monomeric mRFP1, are characterized by two-exponential photobleaching kinetic, as EGFP displays mono-exponential behavior. The spatially restricted chromophore photobleaching can be used to visualize protein and organelle motility within the cell [102] by methods of fluorescence recovery after photobleaching (FRAP) and fluorescence loss in photobleaching (FLIP).
Photobleaching of Anthozoa RFPs and YFPs, which contain at least two different types of chromophore (green and red/yellow) [36, 40, 60, 84], can lead to the change of spectral characteristics of these proteins. In the tetramer of fluorescent protein composed of monomers with both types of chromophore, green fluorescence is suppressed by energy transfer from green chromophore to red/yellow chromophore. Selective photobleaching of red/yellow chromophore results in an increased green fluorescence. When DsRed1 was used for cellular and subcellular labeling, resultant green-to-red color change was 1.2–2.0×10² in HEK293 and CHO-K1 cells, and this spectral changes persisted for >30 h [103]. This type of photoconversion can be applied for selective optical labeling of whole cell, organelles and proteins.
Irradiation of some Anthozoa RFPs with very intense red light can induce the photoconversion of the red chromophore into blue- and far-red spectral species. For instance, irradiation of free or immobilized DsRed1 with light of high intensity at the wavelength 532 nm for 14 h resulted in a decrease of absorption peak at 558 nm and its shift up to 574 nm, besides new absorption peak at 386 nm appeared with 25 % of initial peak at 558 nm magnitude [104]. At the same time, green chromophore absorption peak at 475 nm changed neither amplitude nor position. When exited at the wavelength 390 nm, fluorescence spectrum of DsRed1 after photoconversion had maximum at 500 nm (due to an energy transfer from blue to green chromophore) and pronounced shoulder at 450 nm (50 % of the maximum amplitude); when exited at the wavelength 570 nm, photoconverted DsRed1 possess fluorescence spectrum peaked at about 595 nm. Keeping in the dark of modified protein for 24 h did not lead to any changes in spectral properties. This type of photoconversion is hardly to be used in cell biology, but it can be applied in biotechnology to label DsRed1-containing immobilized structures by spectrally resolved blue fluorescence [104].
KFPs and PAFPs give an opportunity of spatio-temporal labeling and monitoring of living cells, organelles and molecules within the cell. One of the main PAFPs application is protein labeling. By using PAFP-tagged proteins and selectively irradiating the part of the cell, one can induce photochemical chromophore transitions (photoconversion of PAFP from non-fluorescent to fluorescent state or change the color of fluorescence) and observe protein localization, turnover and trafficking by means of confocal microscopy [105]. For example, PA-GFP–α-tubulin fusion protein has been used to visualize peripheral microtubules motion and their inclusion into a mitotic spindle [106]. DNA or RNA molecules can be labeled with PAFPs by fusing of DNA/RNA-binding domain fused with PAFP and introducing the corresponding nucleotide sequence into nucleic acid of interest [107]. In contrast to irreversibly photoconverted PAFPs, KFP1 and Dronpa permit repeated and successive photoactivation of different region of the cell. By using Dronpa–ERK1 fusion protein and repeatedly photoactivating and quenching the fluorescence signal in the nucleus and cytoplasm of a single cell the import and export of ERK1 kinase in the response to the cell stimulation have been studied [108].
Cellular organelles can be labeled by PAFPs via fusing of PAFP to polypeptide targeting signals or to proteins that have specific localization. PAFPs have been used to study endocytosis [26], exocytosis, phagocytosis [109], the assembly and disassembly of cellular organelles [26, 33, 81, 109–111], and to follow the exchange of organelle content [26, 27, 112].
KFP1 has been used in mRNA microinjection assays to monitor Xenopus laevis embryo development [33]. In vivo applications for PAFPs also include tracking cells in cancer and metastasis, tracking unicellular organisms, free living and in a host, tracking viruses or protein particles in a host [113].
CALI applications. The method CALI (Chromophore Assisted Laser Inactivation) is successfully used for acute inactivation of proteins in living cells [114–116]. This method is based on the ability of some fluorescent dye (fluorescein, malachite green, ReAsH and F1AsH) to produce reactive oxygen species (ROS) upon laser irradiation at a wavelength of light absorbed by the dye [117]. Such dyes are termed photosensitizers. At the cellular level, subjection of photosensitizer-tagged protein to mild illumination for a limited time interval results in precise inactivation of the target while neighboring molecules remain intact. CALI has been successfully applied in functional studies of various proteins [118–120]. As applied to the living tissues, high level of ROS production can lead to the target damaging by necrosis or apoptosis [121–123]. Some photosensitizers tend to accumulate in tumors, and thus found their use in photodynamic therapy of cancer [124]. While known photosensitizers are chemical compounds that must be added into living systems exogenously.
Recently it was reported that the mutant developed from Hydrozoa jellyfish chromoprotein anm2CP, KillerRed, is capable of ROS generation upon green light irradiation. KillerRed is the first fully genetically encoded photosensitizer. The mechanism of ROS generation by KillerRed remains unclear but it was shown that amino acid residues Asn145 and Ala161, spatially close to the chromophore, are necessary for the effect, indicating a key role of chromophore surrounding for its capability to generate ROS. Development of KillerRed should give a second breath to the CALI of molecules in living cells. Potentially, KillerRed can be fused to entire collections of open reading frames providing an instrument for high-throughput analysis of protein function in living cells. KillerRed provides much lower 2 % non-specific inactivation, while ReAsH produce up to 21 % nonspecific protein inactivation [125].
Another possible field of KillerRed application is CALI of nucleic acids. KillerRed, being fused to an RNA- or DNA-binding domain, can be targeted to a specific RNA or a gene [126]. If KillerRed induces breaks or damage in adjacent nucleic acid strand then it should be possible to inactivate expression of target genes temporally or even permanently by a pulse of light.
As KillerRed is a fully genetically encoded photosensitizer and don’t require any exogenous compounds it can be used in stable cell lines and transgenic animals. Expression of KillerRed under a specific promoter provides a unique opportunity to investigate cell fate in developing and adult organisms by spatially and temporally controlled cell killing.
Finally, KillerRed opens new perspectives for the photodynamic therapy too. Recent studies on nude mice demonstrated accumulation of GFP-expressed bacteria or virus within various tumors [127]. Possibly, bacteria or viruses expressing KillerRed can be used not only for visualization but also for light-induced killing of tumor cells.
Protein aggregation studies. A broad range of human diseases known as protein conformational or protein misfolding diseases arises from the failure of a specific peptide or protein to adopt its native functional conformational state. The obvious consequences of misfolding are protein aggregation (and/or fibril formation), loss of function, and gain of toxic function. Some proteins have an intrinsic propensity to assume a pathologic conformation, which becomes evident with aging or at persistently high concentrations. Interactions (or impaired interactions) with some endogenous factors (e.g., chaperones, intracellular or extracellular matrixes, other proteins, small molecules) can change conformation of a pathogenic protein and increase its propensity to misfold. Misfolding can originate from point mutation(s) or result from an exposure to internal or external toxins, impaired posttranslational modifications (phosphorylation, advanced glycation, deamidation, racemization, etc.), an increased probability of degradation, impaired trafficking, lost binding partners or oxidative damage. All these factors can act independently or in association with one another.
Misfolding diseases can affect a single organ or be spread through multiple tissues. The largest group of misfolding diseases, including numerous neurodegenerative disorders and the amyloidoses, originates from the conversion of specific proteins from their soluble functional states into stable, highly ordered, filamentous protein aggregates, known as amyloid fibrils, and from the deposition of these aggregated material in the variety of organs and tissues. In each of these pathological states, a specific protein or protein fragment changes from its natural soluble form into insoluble fibrils, which accumulate in a variety of organs and tissues [128–134]. Amyloid-like fibrils display many common properties including a core cross-β-sheet structure in which continuous β-sheets are formed with β-strands running perpendicular to the long axis of the fibrils [135]. Morphologically, they typically consist of 2–6 unbranched protofilaments 2–5 nm in diameter associated laterally or twisted together to form fibrils with 4–13 nm diameter (e.g., see [136–138]). A current set of known proteins involved in protein deposition diseases associated with the formation of extracellular amyloid fibrils or intracellular inclusions with amyloid-like characteristics includes about 70 proteins which are responsible for more than 160 diseases and syndromes [139]. It has been pointed out that these disorders can be broadly grouped into neurodegenerative conditions, where aggregation occurs in the brain, nonneuropathic localized amyloidoses, where aggregation takes place in a single type of tissue other than the brain, and nonneuropathic systemic amyloidoses, where aggregation affects multiple tissues [140]. Protein deposition diseases can be sporadic (85%), hereditary (10%) or even transmissible, as in the case of prion diseases (5%) [140]. All these diseases, being very different clinically, share similar molecular mechanisms where a specific protein or protein fragment changes from its natural soluble form into insoluble fibrils [128–134, 141–143]. Although approximately 70 different proteins are known to be involved in protein deposition diseases, they are mostly unrelated in terms of sequence or structure and prior to fibrillation the amyloidogenic polypeptides causing diseases may be rich in β-sheet, α-helix, β-helix, or be natively unfolded [134]. Furthermore, the proteinaceous deposits found in patients with any of the protein misfolding diseases beside a major protein component that comprises from a causative protein and forms the core, posses several additional associated species, including metal ions, glycosaminoglycans, the serum amyloid P component, apolipoprotein E, collagen, and many others [144].
For many years it has been generally assumed that the ability to form amyloid fibrils is limited to a relatively small number of proteins, essentially those found in the diseases, and that these proteins posses specific sequence motifs encoding the unique structure of the amyloid core. However, recent studies have established that many diseases unrelated proteins were shown to form fibrils [129, 134, 145, 146]. It is even believed that virtually any protein can be forced to fibrillate if the appropriate conditions are found [129, 134, 145]. The structural diversity of amyloidogenic proteins and close similarity of the resultant fibrils imply that considerable structural rearrangements have to occur in order for fibril formation to happen. A general hypothesis of fibrillogenesis states: structural transformation of a polypeptide chain into a partially folded conformation represents an important prerequisite for protein fibrillation [134]. These aggregation-prone intermediates would be structurally different for different proteins. Furthermore, intermediate might contain different amount of ordered structure even for the same protein undergoing different aggregation processes. It is believed that the precursor of soluble aggregates is the most structured, whereas amyloid fibrils are formed from the least ordered conformation (cf. [147]). It has been also pointed out that the variations in the amount of the ordered structure in the amyloidogenic precursor might be responsible for the formation of fibrils with distinct morphologies [148].
The formation of amyloid fibrils does not represent the only pathological hallmark of conformational or protein deposition diseases. In several neurodegenerative disorders (as well as in numerous in vitro experiments) the protein depositions are composed of the amorphous aggregates, cloud-like inclusions without defined structure. Similarly, soluble oligomers represent another alternative final product of the aggregation process. The choice between three aggregation pathways, fibrillation, amorphous aggregate formation or oligomerization, is determined by the amino acid sequence (which could be modified by mutation) and by the peculiarities of the protein environment.
Obviously, the progress in understanding the pathology of protein misfolding diseases and in rational design of drugs to inhibit or reverse protein aggregation depends on our ability to study the details of the misfolding process, to follow the aggregation process, and to see and analyze the structure of the aggregated particles. GFP-like proteins were shown to represent a set of unique tools that allow visualization and analysis of aggregated structures and aggregation process both in vitro and in vivo.
When production of misfolded proteins exceeds the cellular capacity to degrade them, the proteins are deposited in large aggregates surrounding the microtubule (MT)-organizing center (MTOC) and ensheathed in a cage of vimentin. This subcellular structure was termed the aggresome and it was proposed that the formation of an aggresome is a general cellular response to the presence of aggregated, nondegraded proteins [149]. The process of aggresome formation by a GFP-250 chimera composed of the GFP fused to a 250–amino acid fragment of the cytosolic protein p115 was investigated in great details [150]. p115 is a protein involved in the membrane transport. It is peripherally associated with membranes, and has been localized to the Golgi [151, 152] and to the transport intermediates carrying cargo from the ER to the Golgi [153]. Time-lapse image analysis in living cells was used to characterize the dynamics of aggresome formation. This analysis revealed that small aggregates were formed peripherally and traveled on microtubules in a minus-end direction to MTOC region where they remained as distinct but closely apposed particulate structures. Furthermore, aggresome formation interfered with correct Golgi localization and disrupted the normal astral distribution of microtubules [153].
Novel GFP-based technique called ‘split GFP complementation assay’ has been introduced to detect the aggregated state of proteins in vitro or in prokaryotes [154]. This method is based on separating the GFP into two soluble and spontaneously associating fragments, that when mixed together spontaneously complement, resulting in GFP folding and formation of the fluorophore. Here, a protein of interest is fused to a small GFP fragment via a flexible linker. The complementary GFP fragment is expressed separately. Neither fragment alone is fluorescent. When mixed, the small and large GFP fragments spontaneously associate, resulting in GFP folding and formation of the fluorophore [154]. The largest challenge in this endeavor was a poor foldability of the GFP fragments. To overcome this problem, several pairs of fragments were tested from either the folding reporter GFP, which contains the mutations F99S, M153T, V163A [77], F64L and S65 Thttp://www.nature.com/nbt/journal/v23/n1/full/nbt1044.html - B16#B16 [155], or the exceptionally stable 'superfolder' GFP, containing the folding reporter GFP mutations and S30R, Y39N, N105T, Y145F, I171V and A206V [154]. Although coexpression of the superfolder GFP fragments containing amino acids 1–214 (GFP 1–10) and 214–230 (GFP 11) gave fluorescent Escherichia coli colonies, the complication with this pair was insolubility of superfolder GFP 1–10. Next, superfolder GFP 1–10 was evolved by DNA shuffling [156] to improve its solubility and increase its complementation. This procedure gave a variant, termed GFP 1−10 OPT, which was moderately soluble and in addition to the folding reporter GFP mutations, contained S30R, Y145F, I171V and A206V substitutions from superfolder GFP and seven new mutations: N39I, T105K, E111V, I128T, K166T, I167V and S205T [154]. In the original study, split GFP complementation provided a robust quantitative monitoring of the aggregation process of test proteins in vitro and in Escherichia coli [154]. Recently, this technique was successfully applied to quantitatively measure tau protein aggregation in situ allowing determination of the key mediators of tau aggregation and early aggregation processes in living mammalian cells [157].
Among the various neurodegenerative diseases, the poly(Q) diseases, including Huntington disease and various types of spinocerebellar ataxia, are of special interest. Poly(Q) diseases (also known as the CAG repeat diseases) are a group of at least nine inherited neurodegenerative disorders caused by abnormal expansions of the poly(Q) stretch within disease-causing proteins. These expansions of the poly(Q) stretch to above 40 glutamines trigger the disease-causing proteins to aggregate into insoluble β-sheet-rich amyloid fibrils [158, 159]. To provide a model system for investigating common pathogenic features, the behavior of poly(Q) expansions fused to GFP and expressed in Caenorhabditis elegans has been examined [160]. In this model, the effect of polyglutamine expansions in C. elegans was examined by expressing GFP fusion proteins with 19 or 82 glutamine residues (Q19-GFP or Q82-GFP) in body wall muscle cells. Although Q19-GFP was distributed evenly throughout the body wall muscle cells, Q82-GFP formed discrete intracellular aggregates. These aggregates appeared early in embryogenesis, increased in number and size during development from the larval to the adult stage and correlated with a delay in larval to adult development. It has been also shown that the toxic effect of poly(Q) expression and the formation of aggregates can be reversed by coexpression of the yeast chaperone Hsp104 [160].
Recently, fluorescence correlation spectroscopy (FCS) based on GFP-like protein fused to a target protein was employed to explore oligomerization of the poly(Q) proteins in cells [161]. A time-dependent increase in the diffusion time and particle size of expanded poly(Q)-GFP fusion proteins expressed in cultured cells was detected by FCS, indicating oligomer formation. Intriguingly, the poly(Q)-binding peptide QBP1 was shown to suppress poly(Q)-GFP oligomer formation [161]. Based on these observations it has been concluded that FCS of GFP-fused proteins is a useful technique to monitor the oligomerization of disease-causing proteins in cells as well as its inhibition in the conformational diseases.
Large-scale search for compounds that inhibit protein aggregation and which therefore potentially could be used as therapeutic agents for the prevention or treatment of protein misfolding diseases poses an enormous challenge. A novel high-throughput GFP-based screen capable of isolating inhibitors of Aβ aggregation from large libraries of inactive candidates was recently developed. This technology used a fusion of Aβ42 to GFP and was based on the observation that in the absence of aggregation inhibition, the rapid misfolding and aggregation of Aβ42 caused the entire fusion protein to misfold, thereby preventing green fluorescence. Compounds that inhibited Aβ42 aggregation enable GFP to fold into its native structure and were identified by the increased fluorescent signal. This GFP-based method is rapid and inexpensive and can be used to screen large combinatorial libraries for inhibitors of protein misfolding and aggregation [162].
BIOSENSORS BASED ON GFP-LIKE PROTEINS
A numerous variants of GFP-like proteins created to date represent genetically encoded biosensors of different intracellular processes. Fluorescent properties of these proteins depend on pH of environment, redox potential of the cell, and concentration of metal ions. Widely used FRET-biosensors change fluorescence color in response to various physiologic and biochemical signals.
Most chimeric FPs constructions have been created by fusing of proteins of interest to the amino or carboxyl termini of GFP-like proteins. In some cases, GFP-like protein without essential reorganization of its structure has been successfully inserted into a host protein. However, major rearrangements of FPs structure, such as insertion of protein of interest into FP or circular permutation within FP can provide a new strategy for generating the biosensors.
FRET-biosensors. Fluorescence resonance energy transfer (FRET), in which the excited-state energy of the initially excited donor is transferred without the appearance of a photon via long-range dipole-dipole interactions to an acceptor, is widely used in cell biology for registration of protein-protein interaction. The rate of FRET depends on the extent of spectral overlap of the emission spectrum of the donor with the absorption spectrum of the acceptor, the distance between the donor and acceptor molecules and the relative orientation of the donor and acceptor transition dipoles [163]. Thus, any biochemical signal which changes the relative orientation of the donor and acceptor transition dipoles or the distance between them, can be detected by FRET [67, 164]. FRET can be registered by sensitized fluorescence of the acceptor, decrease of life-time of donor exited-state or increase of the resistance to donor bleaching. For a long time, FRET application was limited to proteins labeled by antibodies, hormones or other ligands tagged with suitable pairs of dyes or lanthanide elements. The creation of enhanced mutants of Aequorea GFP with different spectral properties (EBFP, ECFP, EYFP) have opened a possibility to genetically introduce into the cell the fusion constructs possessing intrinsic fluorescence and preserving the localization and functions of parent proteins. First extensively used FRET pairs were EBFP/EGFP and ECFP/EYFP (donor/acceptor). But these pairs have several essential disadvantages, such as low quantum yield of the EBFP and ECFP, low photostability of EBFP, excitation of the EYFP acceptor in the absorption region of the ECFP donor and the parasitic donor emission in the fluorescence region of the acceptor [165]. Cloning of YFP and RFPs from Anthozoa species allowed using two independent donor-acceptor pairs in the same cell at the same time, which increased the sensitivity of the analysis.
The Forster radii (the distances between donor and acceptor at which the rate of FRET is 50 %) were calculated for different donor-acceptor pairs of GFP-like proteins. The highest values were obtained for EGFP/DsRed1, sapphire-GFP/DsRed1 and EYFP/DsRed1 pairs: 4.73, 4.90 and 4.94 nm, respectively [166]. These values approach the Forster radius of the best ECFP/EYFP pair (4.92 nm), which together with long-wavelength fluorescence spectrum of DsRed mutants make easier the detection of sensitized emission of the above-mentioned and other green and yellow donors. In fact, when the red subunits of tetrameric DsRed1 were photobleached in HeLa cells green subunits fluorescence intensity increased 2.7–5.6 fold, which corresponds to the FRET level of 68–83 % between the green and red subunits [40]. These values are equal or even exceed the highest value of FRET (68 %) detected for ECFP and EYFP linked by zinc finger domain [167].
Applications of RFPs as FRET-partner have two limitations – their tetrameric organization and broad absorption spectra overlapping with excitation spectra of green donors. Both problems are solved now: the former – by using the tandem dimeric constructions of DsRed and HcRed1 as acceptor [10, 12], and the later – by using the above-mentioned mutant forms of Aequorea GFP (EGFP, sapphire-GFP and EYFP). Sapphire-GFP belongs to the class of GFP mutants with neutral phenol in the chromophore. In its excited state, the Sapphire-GFP chromophore is ionized (deprotonated), explaining the large Stokes shift of emission (absorption maximum – 399 nm, emission maximum – 511 nm). Thus, the use of Sapphire-GFP allows preventing parasitic acceptor excitation in absorption region of donor.
Advantages of sapphire-GFP as FRET-partner of DsRed1 were demonstrated for the so called cameleons, which are the genetically encoded calcium indicators consisting of tandem fusions of FP1-donor, calmodulin, calmodulin-binding peptide (M13) and FP2-acceptor [168, 169]. In the absence of calcium, donor and acceptor are remote. Calcium binding to the calmodulin caused it to interact with M13 and brought FP1 and FP2 into proximity, thus increasing FRET. In HeLa cells stimulated with 10 µM histamine, the maximal change of fluorescence intensity of DsRed1 (acceptor) to the donor fluorescence intensity was 1.10, 1.25, and 1.28 for cameleons containing ECFP, EYFP and sapphire-GFP donors, respectively [72]. In dissociated hippocampal neurons, the change of calcium concentration induced by depolarization resulted in increase of acceptor/donor fluorescence intensity by 1.32- and 1.26-fold for cameleons with EYFP and sapphire-GFP donors, respectively. Using FRET for protein-protein interaction in Arabidopsis plant cells, EGFP was shown to be a suitable donor for RFPs. Interaction of phyto-chromeB-EGFP and cryptochrome2-DsRed1 fusion proteins in nuclear speckles resulted in sensitized fluorescence from DsRed1
Tandem RFPs were shown to be suitable acceptors for FP-donors like EYFP [10]. A simple model system was used representing the EYFP–t-HcRed1 fusion (tandem protein) and the factor Xa protease cleavage site between second HcRed1 and EYFP. Incubation of purified fusion-constructs with factor Xa caused a gradual increase in the yellow fluorescence intensity at 528 nm and a simultaneous decrease in the red fluorescence intensity at 650 nm. Digestion of fusion protein resulted in 80 % increase of yellow emission and 30 % decrease of red emission. The ratio of donor/acceptor fluorescence intensity changed by 2.6-fold, being close to FRET ratio of other widely used pairs of GFP-like proteins [168]. Thus, t-HcRed1 might be used in FRET analysis of protease activity in vivo, protein-protein interaction and the creation of intracellular biosensors. It should be highlighted that dimeric tandem RFPs have an advantage as partner for Aequorea GFP donors over monomeric mRFP1 containing a fraction of molecules with “green” chromophore [12]. Tandem constructs of non-fluorescent mutants of FPs from Anthozoa species and chromoproteins, such as DsRed-NF and asulCP-Ala148Cys [8] can be used as effective fluorescence quenchers.
It was shown that orange fluorescent proteins such as mKO (a monomeric variant of an orange-emitting FP form coral Fungia concinna [170]) and mOrange (a monomeric protein derived from DsRed1 [13]) are suitable as donor for red fluorescent acceptor. Calculated Forster radii of mKO/mCherry and mOrange/mCherry pairs are equal to 6.4 and 6.3 nm, respectively, which is substantially higher than the Forster radius of ECFP/EYFP pair [171]. This improvement can be explained by the relative high quantum yield of orange donors and by the λ4 component in the overlap integral which generally increases the Forster radius of pairs in the red region of the spectrum. In contrast to mOrange, mKO has higher photostability. The suitability of mKO/mCherry pair for monitoring the homodimerization of the NF-κB subunit p65 was shown. A two-fold increase in the FRET efficiency relative to the ECFP/EYFP pair was obtained by using the mKO/mCherry pair. It should be noted that red-shifted pairs are well-suited for donor-based quantitative FRET methods in living cells; i.e., FLIM and acceptor photobleaching, but relatively low quantum yield of acceptor can limit the application of these pair in acceptor-based FRET methods.
Using the FRET-based screening the FRET efficiency of popular ECFP/EYFP pair has been substantially increased resulting in an optimized CyPet/YPet pair [172]. The CyPet/YPet pair had a 7-fold increase in ratiometric FRET signal change with respect to ECFP/EYFP pair. An enhanced FRET signal of CyPet/YPet pair is thought to be caused by a weak dimerisation of the two fluorescent proteins in the tandem constructs [173]. According to this a new strategy to increase the FRET-biosensor sensitivity of protease activity was proposed in which introduction of two substitutions (Ser208 Phe and Val224 Leu) at the dimer-dimer interface of the two fluorescent domains induces intramolecular interactions and results in a strong increase in energy transfer efficiency [174].
Except to GFP-like proteins, organic dyes, luciferases [175] and lanthanide elements [176] are appropriate donors for FRET, BRET (energy transfer from bioluminescent donor) and LRET (energy transfer from luminescent donor), respectively, because emission spectra of these substances overlap absorption spectra of RFPs from Anthozoa species. Dyes suitable as donors are green-emitting fluorescein derivatives [177, 178]. The use of the yellow and orange dyes with large Stokes shift and high quantum yield, such as SYPRO Orange (absorption maximum 480 nm, emission maximum 568 nm), R-phycoerythrin (absorption maximum 480 nm, emission maximum 578 nm) and AttoPhos (absorption maximum 440 nm, emission maximum 555 nm) can provide reduced acceptor excitation in the absorption region of a donor and larger Forster radii. FRET analysis cannot be directly used in photosensitive tissues, such as retina, or in tissues easily damaged by exciting light. BRET analysis avoids the undesirable consequences of fluorescence excitation and direct excitation of the acceptor but requires addition of cofactors (luciferins). Applications of luciferase from Renilla emitting in the blue region of spectrum with maximum at 480 nm as a donor and Aequorea GFP mutants (e.g., EYFP) as acceptor have been demonstrated [179]. Insect luciferases with emission maxima at 550–575 nm are supposed to be better donors for RFPs from Anthozoa. The lanthanides represent luminescent elements which being chelated possess high quantum yield, multi-line spectra in green-red region and millisecond fluorescence life-times. LRET analysis with terbium and europium as donors are widely used in protein conformational studies and in high throughput screenings [165].
Recently, a fluorescence microscopy method, termed three-chromophore fluorescence resonance energy transfer, has been developed [180]. This method is capable of measuring FRET signals within a system of three donor-acceptor pairs, such as CFP-YFP, CFP-mRFP and YFP-mRFP, in vivo and in vitro. 3-FRET microscopy has a great potential in studies of many cellular processes driven by multicomponent molecular machineries including signaling processes in living cells.
Biosensors with chromophore modification. The fluorescent properties of wild-type GFP from Aequorea and most of its mutants depend on pH. At alkalescent pH (8.0), GFP has major and minor excitation peaks at 395 and 475 nm, and fluorescence peaks at 509 and 508 nm, respectively. At high pH (10.0–12.2), absorbance and excitation amplitude at 395 nm sharply decreases, and amplitude at 475 nm increases by 3-fold [37]. This pH-dependent shift of absorbance and excitation spectra at extremely alkaline pH might be induced by the ionization of Tyr66 in the chromophore and/or by the deprotonation of Arg96 that stabilizes enolate form of chromophore imidazolinone. At acidic pH (4–6), wild-type GFP is quenched with an apparent pKa near 4.5 (at this pH value GFP is 50 % quenched). In spite of intensive studies, the mechanism of pH-dependent quenching has not been addressed. Since the fluorescent response of GFP on pH changes is both rapid and reversible, it was proposed to use this protein as non-invasive intracellular pH indicator when usual synthetic pH-indicators are impractical [181–183]. Some of the enhanced variants of Aequorea GFP are even more pH sensitive than wild-type GFP: EGFP is 50 % quenched at pH 5.5. EYFP having a pKa value of 7.1 was successively applied to pH measurements in cytosol and in Golgi compartment. To measure pH of more acidic organelles, EGFP or wild-type GFP should be used since EYFP at these conditions is almost completely quenched. ECFP is less pH sensitive than EGFP or EYFP and is rarely used.
A series of pH-sensitive mutants known as pHluorins has been created using the site-directed mutagenesis of Aequorea GFP [181]. They can be divided into two groups: ratiometric and ecliptic pHluorins. The lowering of pH results in the change of the ratio of fluorescence intensities excited at 395 and 475 nm for ratiometric pHluorins. The fluorescence intensity of ecliptic pHluorins excited at 475 nm decreases with the decrease in pH and at pH less then 6.0 they becomes non-fluorescent. The spectral changes are reversible for both groups of pHluorins [181].
Ecliptic pHluorins have been used for optical measurements of presynaptic activity within intact or semi-intact neuronal networks [184]. The fusion protein of ecliptic pHluorin and VAMP (vesicle associated membrane protein) was constructed. In this construct, pHluorin was attached to the VAMP lumenal domain. As a result, the incorporation of the fusion protein into vesicle membrane led to the localization of pHluorin within vesicles. Synaptic vesicles are specialized endosomes that maintain an acidic lumen (pH 5.6). At this pH value, ecliptic pHluorin is completely quenched. Following the fusion of the vesicles with the plasma membrane during action potential firing, the lumenal surface of the synaptic vesicle switches to the more alkaline pH of the extracellular environment (7.4), which causes the pHluorin transition to fluorescent state. Subsequent endocytosis and reacidification of vesicles then result in the fluorescence signal recovering. Therefore, the changes in fluorescence during action potentials reflect a ratio of externalized on the plasma membrane surface pHluorins, which are brightly fluorescent, and internalized into the vesicles pHluorins, which are non-fluorescent [184].
Novel pH-sensitive variants of Aequorea GFP, termed deGPFs, have been constructed [185]. These proteins contain substitutions of residue 65 with threonine and residues 148 and/or 203 with cysteine and display pKa values ranging from 6.8 to 8.0. The ratio of the emission at 515 nm (green fluorescence) to the emission at 460 nm (blue fluorescence) of deGPFs changes with decrease in pH. Crystal structure analysis of deGFPs showed that at low pH the structure does not contain a hydrogen bond network that would provide rapid deactivation of the excited state via proton transfer, hence blue emission is observed; at high pH, backbone rearrangements caused by changes in the associated hydrogen bond network allow proton to be transferred from the excited-state of the neutral chromophore to the bulk solvent via Ser147 and bound water molecules, resulting in green emission from the anionic chromophore [185].
Indicators on the base of β-barrel surface modifications. Wild-type Aequorea GFP has a strong affinity for Cu2+, less for Ni2+ and interacts poorly with Zn2+ and Co2+ [186]. GFP contains 10 histidine residues, 3 of which, His77, His81 and His231, are located within 7.5 Å of each other and have been suggested as putative site of metal binding.
Since metal ions in the vicinity of a chromophore are known to quench fluorescence, two mutant variants of GFP with an increased affinity for metal ions were developed as potential in vivo metal ion sensors [187]. The 10C GFP mutant containing the Thr203→Tyr, Ser54→Gly, Val68→Leu, and Ser72→Ala substitutions was chosen as an object for mutagenesis. One of the novel mutants contained a metal-binding site composed of two histidines (Ser147→His and Gln204→His substitutions), a metal-binding site of second mutant was composed of three potential metal ligands (resulted from the Ser147→His, Gln204→His and Ser202→ Asp substitutions). The fluorescence of both mutants was quenched at a much lower metal concentration (Cu2+, Co2+ or Ni2+) than of 10C mutant [187].
Novel mutants of Aequorea GFP, termed roGFPs, are suitable for the redox potential measurements [188]. They contain substitutions of surface-exposed residues at positions 147 and 204 or 149 and 202 (which are situated close to the chromophore on the adjacent antiparallel β-strands) with cysteines. The disulfide bridge formation introduces a degree of structural strain into the molecule and hence into the chromophore environment, which promote chromophore deprotonation. As a result, the intensity of the excitation peak at 400 nm increases whereas the peak at 475 nm decreases in intensity. Ratiometric changes in fluorescence excited at 400 and 475 nm display a fraction of oxidized roGFP and, thus, cell redox status. roGFP1 has been used to investigate redox status of the mitochondria in HeLa cells [188]. The proteins of this class might be excellent tools for study of numerous cell functions dependent on the redox equilibrium, such as cell growth, stress responses, differentiation, metabolism, cell cycle, communication, migration, gene transcription, immune responses and so on [189].
Biosensors based on the large scale rearrangements of GFP-like protein structure. As it was mentioned above, the GFP-like protein maturation is a complex multistep process involving the chromophore formation. Mature GFP-like protein has a highly compact and rigid structure which would seem unlikely to permit major transpositions and insertions of the other proteins. Nevertheless, the possibility of the foreign protein insertion into GFP has been demonstrated [190, 191]. Aequorea GFP is tolerant to the insertions at several positions [192]. When the insert represents a receptor, conformational changes following the ligand binding can affect the fluorescent properties of GFP-like protein thus providing a new strategy for the creation of genetically encoded biosensors for biochemical and physiological signals. For instance, the calmodulin insertion at position 145 into ECFP, EGFP or EYFP resulted in fusion proteins preserving the fluorescent properties and acquiring the affinity for Ca2+ [191]. EYFP with inserted calmodulin showed the largest Ca2+ -sensitivity. At pH 7.5 and in the absence of Ca2+, absorption spectrum of this protein had a major peak at 400 nm and small shoulder at 490nm, meaning that EYFP chromophore was mainly protonated. At the same pH value, Ca2+ -binding with calmodulin caused the drastic increase in the absorption peak at 490 at the expense of the peak at 400 nm, suggesting the chromophore deprotonation. The excitation spectra in the presence and the absence of Ca2+ had the only peak at 490 nm, being consistent with the model according to which EYFP molecules with protonated chromophore are non-fluorescent. Thus, when recording the excitation and emission spectra upon saturation with Ca2+, the intensity of corresponding peak simply increased by up to 7-fold without changing its position [191].
The other approach to insert the target protein into FPs at different positions is the creation of circularly permuted FPs (cpFPs), the original amino and carboxyl termini of which are connected by a peptide linker and new amino and carboxyl termini are introduced at other positions. Circular permutation is known to be possible when the original amino and carboxyl termini of protein are rather close to each other, as is the case for GFP-like proteins. If a protein composes of several autonomous domains connected by a flexible linker, it is easy to imagine that rearrangement of the order of these domains would not disrupt the protein functions. However, preservation of GFP-like protein functions would seem unlikely because of their monolithic cylindrical structure, rigid antiparallel folding of β-strands in β-can and complex chromophore maturation process. Nevertheless, it was shown that such gross perturbation of GFP-like protein structure as circular permutation did not disturb their ability to fold correctly and form mature chromophore. Circular permuted variants of Aequorea GFP and its enhanced mutants, such as cpEGFP, cpEYFP, cpECFP [191], have been generated. The original EGFP can be interrupted at Glu142, Tyr143, Tyr145, His148, Asp155, His169, Glu172, Asp173, Ala227 and Ile229.
Circular permuted EYFP has been used for the creation of the so-called pericams, chimeric molecules containing calmodulin and cpEYFP and showing Ca2+-sensitivity [193]. In the cpEYFP, the original amino and carboxyl termini were linked through a pentapeptide linker GlyGlySerGlyGly, rendering Tyr145 and Asn144 new amino and carboxyl termini, respectively. Then cpEYFP was fused to the carboxyl terminus of M13, and to the amino terminus of calmodulin. The fluorescence properties of pericams changed in response to the increase of Ca2+ concentration, probably because of the Ca2+-dependent interaction between calmodulin and M13 leading to an alteration of the chromophore microenvironment. Three types of pericam were obtained by amino acid substitutions in the chromophore microenvironment. The first of these, “flash-pericam” is characterized by the 8-fold increase in the fluorescence intensity at 520 nm upon Ca2+ saturation. The second, “ratiometric-pericam” has the excitation spectra with two peaks at 415 and 494 nm and, in the presence of Ca2+, the ratio of the fluorescence intensities excited at 415 and 494 nm changes by approximately 10-fold. The third, “inverse-pericam”, in contrast to “flash-pericam”, is characterized by the decrease in green fluorescence to 15% in the presence of Ca2+. All three types of pericam expressed in HeLa cells allowed monitoring Ca2+-oscillations in the cytosol and the nucleus. Ratiometric-pericams having appropriate localization signals were used for the measurement of free Ca2+ concentrations in the nucleus and mitochondria [193].
Recently, a genetically encoded biosensor for H2O2 with submicromolar affinity to H2O2 and no affinity to other oxidants, named HyPer, was designed. This sensor consisted of cpYFP inserted into OxyR-RD (the regulatory domain of E. coli OxyR). The excitation spectrum of HyPer had two maxima at 420 and 500 nm; upon exposure to H2O2, the excitation peak at 500 nm increased at the expense of the peak at 420 nm. HyPer was successively used for the observation of H2O2 concentration changes in cytoplasm and mitochondria of mammalian cells during apoptosis and growth factor stimulation [194].
Fig. 14 shows the possible topologies of GFP or cpGFP with other proteins. Because the new amino and carboxyl termini can be introduced at several positions, the spatial orientation of inserted protein with respect to cpGFP will be different. When the target protein inserted at position which is close to the chromophore or it fused to amino or carboxyl terminus of cpFP which is close to the chromophore, any conformational changes of the target protein would affect the chromophore microenvironment and the fluorescent properties of FP. Thus, the insertion of the target protein into FPs or the creation of its fusion constructions with cpFP might be promising for biosensors generating.
Fig. (14).

Possible topologies of GFP (cylinders), circularly permuted GFP (cpGFP, cylinders) and chimeras with other proteins (spheres and hemisphers) [191]. Figure depicts non-modified GFP (a), tandem fusion of a target protein to GFP (b), GFP insertion into the target protein (c), insertion of a target protein into cpGFP (d), cpGFP (e), fusion of a target protein to cpGFP (f), cpGFP insertion into the target protein (g), and insertion of a target protein into GFP (h).
Since Aequorea GFP mutants [24] and Anthozoa GFP-like proteins such as DsRed [35, 36] and mutant variant of asulCP have the same topology, it might be expected that the insertion of the target protein into KFPs and their monomeric variants would not cause the loss of chromophore ability for cis–trans isomerization. The use of KFPs is supposed to result in the creation of biosensors that will be able to switch between chromo and fluorescent states in response to changes in the chromophore microenvironment mediated by conformational changes of a target protein.
CONCLUSIONS
Following intensive studies on GFP-like proteins, their advantages have been greatly enhanced (the creation of the expanded range of GFPs mutant with different spectrum position; photoconvertable and photoswitchable mutants; pH-, redox potential-, metal ion-sensitive mutants and so on) and disadvantages have been successfully overcome (the creation of mutants with high quantum yield, fast maturation, low tendency to aggregate, monomeric and dimeric forms of GFP-like proteins). Nevertheless further studies, generating the novel far-red and infra-red genetically encoded fluorescent markers and photoactivatable mutants as well as improvement of the properties of existing GFP-like proteins, together with cloning of new FPs and CPs are of great practical interest because of high transparency of animal tissues in the region of 650–900 nm. New generation of laser scanning microscopes that split emission onto multi-channel detectors may expand the possibilities and overcome the limits of the existing multicolor labeling and FRET detection methods [195]. We also expect further broadening of the application of GFP-like proteins in intact tissues and small model organisms where methods of cDNA introduction, such as “gene gun” and homologous recombination, are well established. The combination of spatio-restricted and deeper multi-photon laser excitation with high-output fiber endoscopy will permit in situ FP-based analysis of numerous biological processes in transgenic animals.
ACKNOWLEDGEMENTS
We thank K.A. Lukyanov for effective discussion of the manuscript. This work was supported in part by grants RFBR 06-04-48231, Russian Science Support Foundation and Administration of St. Petersburg (O.V.S.); Programs "Leading Scientific Schools of Russia" 9396.2006.4 and "Molecular and Cell Biology of the Russian Academy of Science" (K.K.T.) and by grants GM070358 and GM073913 from the U.S. National Institutes of Health (V.V.V.).
ABBREVIATIONS
- BFP
Blue fluorescent protein
- CFP
Cyan fluorescent protein
- CP
Chromoprotein
- FP
Fluorescent protein
- GFP
Green fluorescent protein
- KFP
Kindling fluorescent protein
- PAFP
Photoactivatable fluorescent protein
- PS-CFP
Photoswitchable cyan fluorescent protein
- RFP
Red fluorescent protein
- YFP
Yellow fluorescent protein
REFERENCES
- 1.Labas YA, Gurskaya NG, Yanushevich YG, Fradkov AF, Lukyanov KA, Lukyanov SA, Matz MV. Proc Natl Acad Sci U S A. 2002;99:4256–4261. doi: 10.1073/pnas.062552299. [DOI] [PMC free article] [PubMed] [Google Scholar]
- 2.Lukyanov KA, Fradkov AF, Gurskaya NG, Matz MV, Labas YA, Savitsky AP, Markelov ML, Zaraisky AG, Zhao X, Fang Y, Tan W, Lukyanov SA. J Biol Chem. 2000;275:25879–25882. doi: 10.1074/jbc.C000338200. [DOI] [PubMed] [Google Scholar]
- 3.Cubitt AB, Heim R, Adams SR, Boyd AE, Gross LA, Tsien RY. Trends Biochem Sci. 1995;20:448–455. doi: 10.1016/s0968-0004(00)89099-4. [DOI] [PubMed] [Google Scholar]
- 4.Zacharias DA, Baird GS, Tsien RY. Curr Opin Neurobiol. 2000;10:416–421. doi: 10.1016/s0959-4388(00)00101-x. [DOI] [PubMed] [Google Scholar]
- 5.Ward WW, Cormier MJ. J Biol Chem. 1979;254:781–788. [PubMed] [Google Scholar]
- 6.Carter RW, Schmale MC, Gibbs PD. Comp Biochem Physiol C Toxicol Pharmacol. 2004;138:259–270. doi: 10.1016/j.cca.2004.07.002. [DOI] [PubMed] [Google Scholar]
- 7.Gurskaya NG, Savitsky AP, Yanushevich YG, Lukyanov SA, Lukyanov KA. BMC Biochem. 2001;2:6. doi: 10.1186/1471-2091-2-6. [DOI] [PMC free article] [PubMed] [Google Scholar]
- 8.Bulina ME, Chudakov DM, Mudrik NN, Lukyanov KA. BMC Biochem. 2002;3:7. doi: 10.1186/1471-2091-3-7. [DOI] [PMC free article] [PubMed] [Google Scholar]
- 9.Fradkov AF, Chen Y, Ding L, Barsova EV, Matz MV, Lukyanov SA. FEBS Lett. 2000;479:127–130. doi: 10.1016/s0014-5793(00)01895-0. [DOI] [PubMed] [Google Scholar]
- 10.Fradkov AF, Verkhusha VV, Staroverov DB, Bulina ME, Yanushevich YG, Martynov VI, Lukyanov S, Lukyanov KA. Biochem J. 2002;368:17–21. doi: 10.1042/BJ20021191. [DOI] [PMC free article] [PubMed] [Google Scholar]
- 11.Shkrob MA, Yanushevich YG, Chudakov DM, Gurskaya NG, Labas YA, Poponov SY, Mudrik NN, Lukyanov S, Lukyanov KA. Biochem J. 2005;392:649–654. doi: 10.1042/BJ20051314. [DOI] [PMC free article] [PubMed] [Google Scholar]
- 12.Campbell RE, Tour O, Palmer AE, Steinbach PA, Baird GS, Zacharias DA, Tsien RY. Proc Natl Acad Sci U S A. 2002;99:7877–7882. doi: 10.1073/pnas.082243699. [DOI] [PMC free article] [PubMed] [Google Scholar]
- 13.Shaner NC, Campbell RE, Steinbach PA, Giepmans BN, Palmer AE, Tsien RY. Nat Biotechnol. 2004;22:1567–1572. doi: 10.1038/nbt1037. [DOI] [PubMed] [Google Scholar]
- 14.Wang L, Jackson WC, Steinbach PA, Tsien RY. Proc Natl Acad Sci U S A. 2004;101:16745–16749. doi: 10.1073/pnas.0407752101. [DOI] [PMC free article] [PubMed] [Google Scholar]
- 15.Merzlyak EM, Goedhart J, Shcherbo D, Bulina ME, Shcheglov AS, Fradkov AF, Gaintzeva A, Lukyanov KA, Lukyanov S, Gadella TW, Chudakov DM. Nat Methods. 2007;4:555–557. doi: 10.1038/nmeth1062. [DOI] [PubMed] [Google Scholar]
- 16.Shcherbo D, Merzlyak EM, Chepurnykh TV, Fradkov AF, Ermakova GV, Solovieva EA, Lukyanov KA, Bogdanova EA, Zaraisky AG, Lukyanov S, Chudakov DM. Nat Methods. 2007;4:741–746. doi: 10.1038/nmeth1083. [DOI] [PubMed] [Google Scholar]
- 17.Ianushevich Iu G, Shagin DA, Fradkov AF, Shakhbazov KS, Barsova EV, Gurskaia NG, Labas Iu A, Matts MV, Luk'ianov A, Lul'ianov SA. Bioorg Khim. 2005;31:49–53. [PubMed] [Google Scholar]
- 18.Deheyn DD, Kubokawa K, McCarthy JK, Murakami A, Porrachia M, W RG, Holland ND. Biol Bull. 2007;213:95–100. doi: 10.2307/25066625. [DOI] [PubMed] [Google Scholar]
- 19.Heim R, Prasher DC, Tsien RY. Proc Natl Acad Sci U S A. 1994;91:12501–12504. doi: 10.1073/pnas.91.26.12501. [DOI] [PMC free article] [PubMed] [Google Scholar]
- 20.Heim R, Cubitt AB, Tsien RY. Nature. 1995;373:663–664. doi: 10.1038/373663b0. [DOI] [PubMed] [Google Scholar]
- 21.Inouye S, Tsuji FI. FEBS Lett. 1994;351:211–214. doi: 10.1016/0014-5793(94)00859-0. [DOI] [PubMed] [Google Scholar]
- 22.Cormack BP, Valdivia RH, Falkow S. Gene. 1996;173:33–38. doi: 10.1016/0378-1119(95)00685-0. [DOI] [PubMed] [Google Scholar]
- 23.Ehrig T, O'Kane DJ, Prendergast FG. FEBS Lett. 1995;367:163–166. doi: 10.1016/0014-5793(95)00557-p. [DOI] [PubMed] [Google Scholar]
- 24.Ormo M, Cubitt AB, Kallio K, Gross LA, Tsien RY, Remington SJ. Science. 1996;273:1392–1395. doi: 10.1126/science.273.5280.1392. [DOI] [PubMed] [Google Scholar]
- 25.Wachter RM, Elsliger MA, Kallio K, Hanson GT, Remington SJ. Structure. 1998;6:1267–1277. doi: 10.1016/s0969-2126(98)00127-0. [DOI] [PubMed] [Google Scholar]
- 26.Chudakov DM, Verkhusha VV, Staroverov DB, Souslova EA, Lukyanov S, Lukyanov KA. Nat Biotechnol. 2004;22:1435–1439. doi: 10.1038/nbt1025. [DOI] [PubMed] [Google Scholar]
- 27.Verkhusha VV, Sorkin A. Chem Biol. 2005;12:279–285. doi: 10.1016/j.chembiol.2005.01.005. [DOI] [PubMed] [Google Scholar]
- 28.Ando R, Hama H, Yamamoto-Hino M, Mizuno H, Miyawaki A. Proc Natl Acad Sci U S A. 2002;99:12651–12656. doi: 10.1073/pnas.202320599. [DOI] [PMC free article] [PubMed] [Google Scholar]
- 29.Wiedenmann J, Ivanchenko S, Oswald F, Schmitt F, Rocker C, Salih A, Spindler KD, Nienhaus GU. Proc Natl Acad Sci U S A. 2004;101:15905–15910. doi: 10.1073/pnas.0403668101. [DOI] [PMC free article] [PubMed] [Google Scholar]
- 30.Tsutsui H, Karasawa S, Shimizu H, Nukina N, Miyawaki A. EMBO Rep. 2005;6:233–238. doi: 10.1038/sj.embor.7400361. [DOI] [PMC free article] [PubMed] [Google Scholar]
- 31.Gurskaya NG, Verkhusha VV, Shcheglov AS, Staroverov DB, Chepurnykh TV, Fradkov AF, Lukyanov S, Lukyanov KA. Nat Biotechnol. 2006;24:461–465. doi: 10.1038/nbt1191. [DOI] [PubMed] [Google Scholar]
- 32.Nienhaus K, Nienhaus GU, Wiedenmann J, Nar H. Proc Natl Acad Sci U S A. 2005;102:9156–9159. doi: 10.1073/pnas.0501874102. [DOI] [PMC free article] [PubMed] [Google Scholar]
- 33.Chudakov DM, Belousov VV, Zaraisky AG, Novoselov VV, Staroverov DB, Zorov DB, Lukyanov S, Lukyanov KA. Nat Biotechnol. 2003;21:191–194. doi: 10.1038/nbt778. [DOI] [PubMed] [Google Scholar]
- 34.Chudakov DM, Feofanov AV, Mudrik NN, Lukyanov S, Lukyanov KA. J Biol Chem. 2003;278:7215–7219. doi: 10.1074/jbc.M211988200. [DOI] [PubMed] [Google Scholar]
- 35.Wall MA, Socolich M, Ranganathan R. Nat Struct Biol. 2000;7:1133–1138. doi: 10.1038/81992. [DOI] [PubMed] [Google Scholar]
- 36.Yarbrough D, Wachter RM, Kallio K, Matz MV, Remington SJ. Proc Natl Acad Sci U S A. 2001;98:462–467. doi: 10.1073/pnas.98.2.462. [DOI] [PMC free article] [PubMed] [Google Scholar]
- 37.Ward WW, Bokman SH. Biochemistry. 1982;21:4535–4540. doi: 10.1021/bi00262a003. [DOI] [PubMed] [Google Scholar]
- 38.Prendergast FG, Mann KG. Biochemistry. 1978;17:3448–3453. doi: 10.1021/bi00610a004. [DOI] [PubMed] [Google Scholar]
- 39.Brejc K, Sixma TK, Kitts PA, Kain SR, Tsien RY, Ormo M, Remington SJ. Proc Natl Acad Sci U S A. 1997;94:2306–2311. doi: 10.1073/pnas.94.6.2306. [DOI] [PMC free article] [PubMed] [Google Scholar]
- 40.Baird GS, Zacharias DA, Tsien RY. Proc Natl Acad Sci U S A. 2000;97:11984–11989. doi: 10.1073/pnas.97.22.11984. [DOI] [PMC free article] [PubMed] [Google Scholar]
- 41.Yanushevich YG, Staroverov DB, Savitsky AP, Fradkov AF, Gurskaya NG, Bulina ME, Lukyanov KA, Lukyanov SA. FEBS Lett. 2002;511:11–14. doi: 10.1016/s0014-5793(01)03263-x. [DOI] [PubMed] [Google Scholar]
- 42.Vrzheshch PV, Akovbian NA, Varfolomeyev SD, Verkhusha VV. FEBS Lett. 2000;487:203–208. doi: 10.1016/s0014-5793(00)02344-9. [DOI] [PubMed] [Google Scholar]
- 43.Verkhusha VV, Akovbian NA, Efremenko EN, Varfolomeyev SD, Vrzheshch PV. Biochemistry (Mosc) 2001;66:1342–1351. doi: 10.1023/a:1013325627378. [DOI] [PubMed] [Google Scholar]
- 44.Heikal AA, Hess ST, Baird GS, Tsien RY, Webb WW. Proc Natl Acad Sci U S A. 2000;97:11996–12001. doi: 10.1073/pnas.97.22.11996. [DOI] [PMC free article] [PubMed] [Google Scholar]
- 45.Cody CW, Prasher DC, Westler WM, Prendergast FG, Ward WW. Biochemistry. 1993;32:1212–1218. doi: 10.1021/bi00056a003. [DOI] [PubMed] [Google Scholar]
- 46.Tcherkasskaya O. Protein Sci. 2007;16:561–571. doi: 10.1110/ps.062578307. [DOI] [PMC free article] [PubMed] [Google Scholar]
- 47.Matz MV, Fradkov AF, Labas YA, Savitsky AP, Zaraisky AG, Markelov ML, Lukyanov SA. Nat Biotechnol. 1999;17:969–973. doi: 10.1038/13657. [DOI] [PubMed] [Google Scholar]
- 48.Gross LA, Baird GS, Hoffman RC, Baldridge KK, Tsien RY. Proc Natl Acad Sci U S A. 2000;97:11990–11995. doi: 10.1073/pnas.97.22.11990. [DOI] [PMC free article] [PubMed] [Google Scholar]
- 49.He X, Bell AF, Tonge PJ. Org Lett. 2002;4:1523–1526. doi: 10.1021/ol0200403. [DOI] [PubMed] [Google Scholar]
- 50.Wiehler J, von Hummel J, Steipe B. FEBS Lett. 2001;487:384–389. doi: 10.1016/s0014-5793(00)02365-6. [DOI] [PubMed] [Google Scholar]
- 51.Verkhusha VV, Chudakov DM, Gurskaya NG, Lukyanov S, Lukyanov KA. Chem Biol. 2004;11:845–854. doi: 10.1016/j.chembiol.2004.04.007. [DOI] [PubMed] [Google Scholar]
- 52.Prescott M, Ling M, Beddoe T, Oakley AJ, Dove S, Hoegh-Guldberg O, Devenish RJ, Rossjohn J. Structure. 2003;11:275–284. doi: 10.1016/s0969-2126(03)00028-5. [DOI] [PubMed] [Google Scholar]
- 53.Petersen J, Wilmann PG, Beddoe T, Oakley AJ, Devenish RJ, Prescott M, Rossjohn J. J Biol Chem. 2003;278:44626–44631. doi: 10.1074/jbc.M307896200. [DOI] [PubMed] [Google Scholar]
- 54.Wilmann PG, Petersen J, Devenish RJ, Prescott M, Rossjohn J. J Biol Chem. 2005;280:2401–2404. doi: 10.1074/jbc.C400484200. [DOI] [PubMed] [Google Scholar]
- 55.Remington SJ, Wachter RM, Yarbrough DK, Branchaud B, Anderson DC, Kallio K, Lukyanov KA. Biochemistry. 2005;44:202–212. doi: 10.1021/bi048383r. [DOI] [PubMed] [Google Scholar]
- 56.Shu X, Shaner NC, Yarbrough CA, Tsien RY, Remington SJ. Biochemistry. 2006;45:9639–9647. doi: 10.1021/bi060773l. [DOI] [PubMed] [Google Scholar]
- 57.Remington SJ. Curr Opin Struct Biol. 2006;16:714–721. doi: 10.1016/j.sbi.2006.10.001. [DOI] [PubMed] [Google Scholar]
- 58.Remington SJ. Methods Enzymol. 2000;305:196–211. doi: 10.1016/s0076-6879(00)05489-6. [DOI] [PubMed] [Google Scholar]
- 59.Terskikh AV, Fradkov AF, Zaraisky AG, Kajava AV, Angres B. J Biol Chem. 2002;277:7633–7636. doi: 10.1074/jbc.C100694200. [DOI] [PubMed] [Google Scholar]
- 60.Verkhusha VV, Otsuna H, Awasaki T, Oda H, Tsukita S, Ito K. J Biol Chem. 2001;276:29621–29624. doi: 10.1074/jbc.C100200200. [DOI] [PubMed] [Google Scholar]
- 61.Niwa H, Inouye S, Hirano T, Matsuno T, Kojima S, Kubota M, Ohashi M, Tsuji FI. Proc Natl Acad Sci U S A. 1996;93:13617–13622. doi: 10.1073/pnas.93.24.13617. [DOI] [PMC free article] [PubMed] [Google Scholar]
- 62.Weber W, Helms V, McCammon JA, Langhoff PW. Proc Natl Acad Sci U S A. 1999;96:6177–6182. doi: 10.1073/pnas.96.11.6177. [DOI] [PMC free article] [PubMed] [Google Scholar]
- 63.Barondeau DP, Putnam CD, Kassmann CJ, Tainer JA, Getzoff ED. Proc Natl Acad Sci U S A. 2003;100:12111–12116. doi: 10.1073/pnas.2133463100. [DOI] [PMC free article] [PubMed] [Google Scholar]
- 64.Verkhusha VV, Kuznetsova IM, Stepanenko OV, Zaraisky AG, Shavlovsky MM, Turoverov KK, Uversky VN. Biochemistry. 2003;42:7879–7884. doi: 10.1021/bi034555t. [DOI] [PubMed] [Google Scholar]
- 65.Stepanenko OV, Verkhusha VV, Kazakov VI, Shavlovsky MM, Kuznetsova IM, Uversky VN, Turoverov KK. Biochemistry. 2004;43:14913–14923. doi: 10.1021/bi048725t. [DOI] [PubMed] [Google Scholar]
- 66.Fukuda H, Arai M, Kuwajima K. Biochemistry. 2000;39:12025–12032. doi: 10.1021/bi000543l. [DOI] [PubMed] [Google Scholar]
- 67.Tsien RY. Annu Rev Biochem. 1996;67:509–544. doi: 10.1146/annurev.biochem.67.1.509. [DOI] [PubMed] [Google Scholar]
- 68.Yang F, Moss LG, Phillips GN., Jr Nat Biotechnol. 1996;14:1246–1251. doi: 10.1038/nbt1096-1246. [DOI] [PubMed] [Google Scholar]
- 69.Bokman SH, Ward WW. Biochem Biophys Res Commun. 1981;101:1372–1380. doi: 10.1016/0006-291x(81)91599-0. [DOI] [PubMed] [Google Scholar]
- 70.Chalfie M, Tu Y, Euskirchen G, Ward WW, Prasher DC. Science. 1994;263:802–805. doi: 10.1126/science.8303295. [DOI] [PubMed] [Google Scholar]
- 71.Ward WW, Prentice HJ, Roth AF, Cody CW, Reeves SC. Photochemistry and Photobiology. 1982;35:803–808. [Google Scholar]
- 72.Mizuno H, Sawano A, Eli P, Hama H, Miyawaki A. Biochemistry. 2001;40:2502–2510. doi: 10.1021/bi002263b. [DOI] [PubMed] [Google Scholar]
- 73.Bevis BJ, Glick BS. Nat Biotechnol. 2002;20:83–87. doi: 10.1038/nbt0102-83. [DOI] [PubMed] [Google Scholar]
- 74.Huang JR, Craggs TD, Christodoulou J, Jackson SE. J Mol Biol. 2007;370:356–371. doi: 10.1016/j.jmb.2007.04.039. [DOI] [PubMed] [Google Scholar]
- 75.Enoki S, Saeki K, Maki K, Kuwajima K. Biochemistry. 2004;43:14238–14248. doi: 10.1021/bi048733+. [DOI] [PubMed] [Google Scholar]
- 76.Enoki S, Maki K, Inobe T, Takahashi K, Kamagata K, Oroguchi T, Nakatani H, Tomoyori K, Kuwajima K. J Mol Biol. 2006;361:969–982. doi: 10.1016/j.jmb.2006.07.009. [DOI] [PubMed] [Google Scholar]
- 77.Crameri A, Whitehorn EA, Tate E, Stemmer WP. Nat Biotechnol. 1996;14:315–319. doi: 10.1038/nbt0396-315. [DOI] [PubMed] [Google Scholar]
- 78.Georgescu J, Rehm T, Wiehler J, Steipe B, Holak TA. J Biomol NMR. 2003;25:161–162. doi: 10.1023/a:1022296413190. [DOI] [PubMed] [Google Scholar]
- 79.Khan F, Stott K, Jackson S. J Biomol NMR. 2003;26:281–282. doi: 10.1023/a:1023817001154. [DOI] [PubMed] [Google Scholar]
- 80.Agbulut O, Huet A, Niederlander N, Puceat M, Menasche P, Coirault C. J Biol Chem. 2007;282:10465–10471. doi: 10.1074/jbc.M610418200. [DOI] [PubMed] [Google Scholar]
- 81.Jakobs S, Subramaniam V, Schonle A, Jovin TM, Hell SW. FEBS Lett. 2000;479:131–135. doi: 10.1016/s0014-5793(00)01896-2. [DOI] [PubMed] [Google Scholar]
- 82.Rodrigues F, van Hemert M, Steensma HY, Corte-Real M, Leao C. J Bacteriol. 2001;183:3791–3794. doi: 10.1128/JB.183.12.3791-3794.2001. [DOI] [PMC free article] [PubMed] [Google Scholar]
- 83.Dietrich C, Maiss E. J Gen Virol. 2003;84:2871–2876. doi: 10.1099/vir.0.19245-0. [DOI] [PubMed] [Google Scholar]
- 84.Terskikh A, Fradkov A, Ermakova G, Zaraisky A, Tan P, Kajava AV, Zhao X, Lukyanov S, Matz M, Kim S, Weissman I, Siebert P. Science. 2000;290:1585–1588. doi: 10.1126/science.290.5496.1585. [DOI] [PubMed] [Google Scholar]
- 85.Nolan T, Bower TM, Brown AE, Crisanti A, Catteruccia F. J Biol Chem. 2002;277:8759–8762. doi: 10.1074/jbc.C100766200. [DOI] [PubMed] [Google Scholar]
- 86.Werdien D, Peiler G, Ryffel GU. Nucleic Acids Res. 2001;29:E53–E53. doi: 10.1093/nar/29.11.e53. [DOI] [PMC free article] [PubMed] [Google Scholar]
- 87.Hawley TS, Telford WG, Hawley RG. Stem Cells. 2001;19:118–124. doi: 10.1634/stemcells.19-2-118. [DOI] [PubMed] [Google Scholar]
- 88.Hawley TS, Telford WG, Ramezani A, Hawley RG. Biotechniques. 2001;30:1028–1034. doi: 10.2144/01305rr01. [DOI] [PubMed] [Google Scholar]
- 89.Moede T, Leibiger B, Berggren PO, Leibiger IB. Diabetes. 2001;50 Suppl 1:S15–S19. doi: 10.2337/diabetes.50.2007.s15. [DOI] [PubMed] [Google Scholar]
- 90.Yang YS, Hughes TE. Biotechniques. 2001;31:1040–1041. doi: 10.2144/01315st03. 1036, 1038. [DOI] [PubMed] [Google Scholar]
- 91.Hakkila K, Maksimow M, Karp M, Virta M. Anal Biochem. 2002;301:235–242. doi: 10.1006/abio.2001.5517. [DOI] [PubMed] [Google Scholar]
- 92.Charpilienne A, Nejmeddine M, Berois M, Parez N, Neumann E, Hewat E, Trugnan G, Cohen J. J Biol Chem. 2001;276:29361–29367. doi: 10.1074/jbc.M101935200. [DOI] [PubMed] [Google Scholar]
- 93.Engqvist-Goldstein AE, Warren RA, Kessels MM, Keen JH, Heuser J, Drubin DG. J Cell Biol. 2001;154:1209–1223. doi: 10.1083/jcb.200106089. [DOI] [PMC free article] [PubMed] [Google Scholar]
- 94.Nelson G, Paraoan L, Spiller DG, Wilde GJ, Browne MA, Djali PK, Unitt JF, Sullivan E, Floettmann E, White MR. J Cell Sci. 2002;115:1137–1148. doi: 10.1242/jcs.115.6.1137. [DOI] [PubMed] [Google Scholar]
- 95.Bloemberg GV, Wijfjes AH, Lamers GE, Stuurman N, Lugtenberg BJ. Mol Plant Microbe Interact. 2000;13:1170–1176. doi: 10.1094/MPMI.2000.13.11.1170. [DOI] [PubMed] [Google Scholar]
- 96.Peloquin JJ, Lauzon CR, Potter S, Miller TA. Curr Microbiol. 2002;45:41–45. doi: 10.1007/s00284-001-0045-1. [DOI] [PubMed] [Google Scholar]
- 97.Maselli A, Laevsky G, Knecht DA. Microbiology. 2002;148:413–420. doi: 10.1099/00221287-148-2-413. [DOI] [PubMed] [Google Scholar]
- 98.Eaton WA, Hofrichter J. Adv Protein Chem. 1990;40:63–279. doi: 10.1016/s0065-3233(08)60287-9. [DOI] [PubMed] [Google Scholar]
- 99.Lauf U, Lopez P, Falk MM. FEBS Lett. 2001;498:11–15. doi: 10.1016/s0014-5793(01)02462-0. [DOI] [PubMed] [Google Scholar]
- 100.Bulina ME, Verkhusha VV, Staroverov DB, Chudakov DM, Lukyanov KA. Biochem J. 2003;371:109–114. doi: 10.1042/BJ20021796. [DOI] [PMC free article] [PubMed] [Google Scholar]
- 101.Ermakova GV, Alexandrova EM, Kazanskaya OV, Vasiliev OL, Smith MW, Zaraisky AG. Development. 1999;126:4513–4523. doi: 10.1242/dev.126.20.4513. [DOI] [PubMed] [Google Scholar]
- 102.Lippincott-Schwartz J, Snapp E, Kenworthy A. Nat Rev Mol Cell Biol. 2001;2:444–456. doi: 10.1038/35073068. [DOI] [PubMed] [Google Scholar]
- 103.Marchant JS, Stutzmann GE, Leissring MA, LaFerla FM, Parker I. Nat Biotechnol. 2001;19:645–649. doi: 10.1038/90249. [DOI] [PubMed] [Google Scholar]
- 104.Cotlet M, Hofkens J, Habuchi S, Dirix G, Van Guyse M, Michiels J, Vanderleyden J, De Schryver FC. Proc Natl Acad Sci U S A. 2001;98:14398–14403. doi: 10.1073/pnas.251532698. [DOI] [PMC free article] [PubMed] [Google Scholar]
- 105.Patterson GH, Lippincott-Schwartz J. Methods. 2004;32:445–450. doi: 10.1016/j.ymeth.2003.10.006. [DOI] [PubMed] [Google Scholar]
- 106.Tulu US, Rusan NM, Wadsworth P. Curr Biol. 2003;13:1894–1899. doi: 10.1016/j.cub.2003.10.002. [DOI] [PubMed] [Google Scholar]
- 107.Shav-Tal Y, Darzacq X, Shenoy SM, Fusco D, Janicki SM, Spector DL, Singer RH. Science. 2004;304:1797–1800. doi: 10.1126/science.1099754. [DOI] [PMC free article] [PubMed] [Google Scholar]
- 108.Ando R, Mizuno H, Miyawaki A. Science. 2004;306:1370–1373. doi: 10.1126/science.1102506. [DOI] [PubMed] [Google Scholar]
- 109.Lee WL, Kim MK, Schreiber AD, Grinstein S. Mol Biol Cell. 2005;16:2077–2090. doi: 10.1091/mbc.E04-06-0464. [DOI] [PMC free article] [PubMed] [Google Scholar]
- 110.Arimura S, Yamamoto J, Aida GP, Nakazono M, Tsutsumi N. Proc Natl Acad Sci U S A. 2004;101:7805–7808. doi: 10.1073/pnas.0401077101. [DOI] [PMC free article] [PubMed] [Google Scholar]
- 111.Karbowski M, Arnoult D, Chen H, Chan DC, Smith CL, Youle RJ. J Cell Biol. 2004;164:493–499. doi: 10.1083/jcb.200309082. [DOI] [PMC free article] [PubMed] [Google Scholar]
- 112.Patterson GH, Lippincott-Schwartz J. Science. 2002;297:1873–1877. doi: 10.1126/science.1074952. [DOI] [PubMed] [Google Scholar]
- 113.Lukyanov KA, Chudakov DM, Lukyanov S, Verkhusha VV. Nat Rev Mol Cell Biol. 2005;6:885–891. doi: 10.1038/nrm1741. [DOI] [PubMed] [Google Scholar]
- 114.Jay DG. Proc Natl Acad Sci U S A. 1988;85:5454–5458. doi: 10.1073/pnas.85.15.5454. [DOI] [PMC free article] [PubMed] [Google Scholar]
- 115.Beermann AE, Jay DG. Methods Cell Biol. 1994;44:715–732. doi: 10.1016/s0091-679x(08)60940-1. [DOI] [PubMed] [Google Scholar]
- 116.Surrey T, Elowitz MB, Wolf PE, Yang F, Nedelec F, Shokat K, Leibler S. Proc Natl Acad Sci U S A. 1998;95:4293–4298. doi: 10.1073/pnas.95.8.4293. [DOI] [PMC free article] [PubMed] [Google Scholar]
- 117.Liao JC, Roider J, Jay DG. Proc Natl Acad Sci U S A. 1994;91:2659–2663. doi: 10.1073/pnas.91.7.2659. [DOI] [PMC free article] [PubMed] [Google Scholar]
- 118.Rajfur Z, Roy P, Otey C, Romer L, Jacobson K. Nat Cell Biol. 2002;4:286–293. doi: 10.1038/ncb772. [DOI] [PubMed] [Google Scholar]
- 119.Rubenwolf S, Niewohner J, Meyer E, Petit-Frere C, Rudert F, Hoffmann PR, Ilag LL. Proteomics. 2002;2:241–246. doi: 10.1002/1615-9861(200203)2:3<241::aid-prot241>3.0.co;2-7. [DOI] [PubMed] [Google Scholar]
- 120.Wong EV, David S, Jacob MH, Jay DG. J Neurosci. 2003;23:3112–3117. doi: 10.1523/JNEUROSCI.23-08-03112.2003. [DOI] [PMC free article] [PubMed] [Google Scholar]
- 121.Cho KS, Lee EH, Choi JS, Joo CK. Invest Ophthalmol Vis Sci. 1999;40:911–919. [PubMed] [Google Scholar]
- 122.Moor AC. J Photochem Photobiol B. 2000;57:1–13. doi: 10.1016/s1011-1344(00)00065-8. [DOI] [PubMed] [Google Scholar]
- 123.Plaetzer K, Kiesslich T, Krammer B, Hammerl P. Photochem Photobiol Sci. 2002;1:172–177. doi: 10.1039/b108816e. [DOI] [PubMed] [Google Scholar]
- 124.Calin MA, Gruia M, Herascu N, Coman T. J Exp Ther Oncol. 2004;4:247–251. [PubMed] [Google Scholar]
- 125.Tour O, Meijer RM, Zacharias DA, Adams SR, Tsien RY. Nat Biotechnol. 2003;21:1505–1508. doi: 10.1038/nbt914. [DOI] [PubMed] [Google Scholar]
- 126.Kremser L, Petsch M, Blaas D, Kenndler E. Anal Chem. 2004;76:7360–7365. doi: 10.1021/ac048999m. [DOI] [PubMed] [Google Scholar]
- 127.Yu YA, Timiryasova T, Zhang Q, Beltz R, Szalay AA. Anal Bioanal Chem. 2003;377:964–972. doi: 10.1007/s00216-003-2065-0. [DOI] [PubMed] [Google Scholar]
- 128.Kelly JW. Curr Opin Struct Biol. 1998;8:101–106. doi: 10.1016/s0959-440x(98)80016-x. [DOI] [PubMed] [Google Scholar]
- 129.Dobson CM. Trends Biochem Sci. 1999;24:329–332. doi: 10.1016/s0968-0004(99)01445-0. [DOI] [PubMed] [Google Scholar]
- 130.Bellotti V, Mangione P, Stoppini M. Cell Mol Life Sci. 1999;55:977–991. doi: 10.1007/s000180050348. [DOI] [PMC free article] [PubMed] [Google Scholar]
- 131.Uversky VN, Talapatra A, Gillespie JR, Fink AL. Med Sci Monitor. 1999;5:1001–1012. [Google Scholar]
- 132.Uversky VN, Talapatra A, Gillespie JR, Fink AL. Med Sci Monitor. 1999;5:1238–1254. [Google Scholar]
- 133.Rochet JC, Lansbury PT., Jr Curr Opin Struct Biol. 2000;10:60–68. doi: 10.1016/s0959-440x(99)00049-4. [DOI] [PubMed] [Google Scholar]
- 134.Uversky VN, Fink AL. Biochim Biophys Acta. 2004;1698:131–153. doi: 10.1016/j.bbapap.2003.12.008. [DOI] [PubMed] [Google Scholar]
- 135.Sunde M, Serpell LC, Bartlam M, Fraser PE, Pepys MB, Blake CC. J Mol Biol. 1997;273:729–739. doi: 10.1006/jmbi.1997.1348. [DOI] [PubMed] [Google Scholar]
- 136.Shirahama T, Benson MD, Cohen AS, Tanaka A. J Immunol. 1973;110:21–30. [PubMed] [Google Scholar]
- 137.Shirahama T, Cohen AS. J Cell Biol. 1967;33:679–708. doi: 10.1083/jcb.33.3.679. [DOI] [PMC free article] [PubMed] [Google Scholar]
- 138.Jimenez JL, Guijarro JI, Orlova E, Zurdo J, Dobson CM, Sunde M, Saibil HR. Embo J. 1999;18:815–821. doi: 10.1093/emboj/18.4.815. [DOI] [PMC free article] [PubMed] [Google Scholar]
- 139.Uversky VN. Nanomedicine. 2007 doi: 10.2217/17435889.2.5.615. In press. [DOI] [PubMed] [Google Scholar]
- 140.Chiti F, Dobson CM. Annu Rev Biochem. 2006;75:333–366. doi: 10.1146/annurev.biochem.75.101304.123901. [DOI] [PubMed] [Google Scholar]
- 141.Kelly JW. Curr Opin Struct Biol. 1996;6:11–17. doi: 10.1016/s0959-440x(96)80089-3. [DOI] [PubMed] [Google Scholar]
- 142.Dobson CM. Biochem Soc Symp. 2001:1–26. [PubMed] [Google Scholar]
- 143.Dobson CM. Philos Trans R Soc Lond B Biol Sci. 2001;356:133–145. doi: 10.1098/rstb.2000.0758. [DOI] [PMC free article] [PubMed] [Google Scholar]
- 144.Hirschfield GM, Hawkins PN. Int J Biochem Cell Biol. 2003;35:1608–1613. doi: 10.1016/s1357-2725(03)00169-9. [DOI] [PubMed] [Google Scholar]
- 145.Uversky VN. Cell Mol Life Sci. 2003;60:1852–1871. doi: 10.1007/s00018-003-3096-6. [DOI] [PMC free article] [PubMed] [Google Scholar]
- 146.Chiti F, Webster P, Taddei N, Clark A, Stefani M, Ramponi G, Dobson CM. Proc Natl Acad Sci U S A. 1999;96:3590–3594. doi: 10.1073/pnas.96.7.3590. [DOI] [PMC free article] [PubMed] [Google Scholar]
- 147.Khurana R, Gillespie JR, Talapatra A, Minert LJ, Ionescu-Zanetti C, Millett I, Fink AL. Biochemistry. 2001;40:3525–3535. doi: 10.1021/bi001782b. [DOI] [PubMed] [Google Scholar]
- 148.Smith DP, Jones S, Serpell LC, Sunde M, Radford SE. J Mol Biol. 2003;330:943–954. doi: 10.1016/s0022-2836(03)00687-9. [DOI] [PubMed] [Google Scholar]
- 149.Johnston JA, Ward CL, Kopito RR. J Cell Biol. 1998;143:1883–1898. doi: 10.1083/jcb.143.7.1883. [DOI] [PMC free article] [PubMed] [Google Scholar]
- 150.Garcia-Mata R, Bebok Z, Sorscher EJ, Sztul ES. J Cell Biol. 1999;146:1239–1254. doi: 10.1083/jcb.146.6.1239. [DOI] [PMC free article] [PubMed] [Google Scholar]
- 151.Waters MG, Clary DO, Rothman JE. J Cell Biol. 1992;118:1015–1026. doi: 10.1083/jcb.118.5.1015. [DOI] [PMC free article] [PubMed] [Google Scholar]
- 152.Nakamura N, Lowe M, Levine TP, Rabouille C, Warren G. Cell. 1997;89:445–455. doi: 10.1016/s0092-8674(00)80225-1. [DOI] [PubMed] [Google Scholar]
- 153.Nelson DS, Alvarez C, Gao YS, Garcia-Mata R, Fialkowski E, Sztul E. J Cell Biol. 1998;143:319–331. doi: 10.1083/jcb.143.2.319. [DOI] [PMC free article] [PubMed] [Google Scholar]
- 154.Cabantous S, Terwilliger TC, Waldo GS. Nat Biotechnol. 2005;23:102–107. doi: 10.1038/nbt1044. [DOI] [PubMed] [Google Scholar]
- 155.Patterson GH, Knobel SM, Sharif WD, Kain SR, Piston DW. Biophys J. 1997;73:2782–2790. doi: 10.1016/S0006-3495(97)78307-3. [DOI] [PMC free article] [PubMed] [Google Scholar]
- 156.Stemmer WP. Proc Natl Acad Sci U S A. 1994;91:10747–10751. doi: 10.1073/pnas.91.22.10747. [DOI] [PMC free article] [PubMed] [Google Scholar]
- 157.Chun W, Waldo GS, Johnson GV. J Neurochem. 2007 doi: 10.1111/j.1471-4159.2007.04941.x. [DOI] [PubMed] [Google Scholar]
- 158.Gusella JF, MacDonald ME. Nat Rev Neurosci. 2000;1:109–115. doi: 10.1038/35039051. [DOI] [PubMed] [Google Scholar]
- 159.Zoghbi HY, Orr HT. Annu Rev Neurosci. 2000;23:217–247. doi: 10.1146/annurev.neuro.23.1.217. [DOI] [PubMed] [Google Scholar]
- 160.Satyal SH, Schmidt E, Kitagawa K, Sondheimer N, Lindquist S, Kramer JM, Morimoto RI. Proc Natl Acad Sci U S A. 2000;97:5750–5755. doi: 10.1073/pnas.100107297. [DOI] [PMC free article] [PubMed] [Google Scholar]
- 161.Takahashi Y, Okamoto Y, Popiel HA, Fujikake N, Toda T, Kinjo M, Nagai Y. J Biol Chem. 2007;282:24039–24048. doi: 10.1074/jbc.M704789200. [DOI] [PubMed] [Google Scholar]
- 162.Kim W, Kim Y, Min J, Kim DJ, Chang YT, Hecht MH. ACS Chem Biol. 2006;1:461–469. doi: 10.1021/cb600135w. [DOI] [PubMed] [Google Scholar]
- 163.Lakowicz JR. Principles of Fluorescence Spectroscopy. New York: Plenum Press; 1983. [Google Scholar]
- 164.Zimmer M. Chem Rev. 2002;102:759–781. doi: 10.1021/cr010142r. [DOI] [PubMed] [Google Scholar]
- 165.Selvin PR. Nat Struct Biol. 2000;7:730–734. doi: 10.1038/78948. [DOI] [PubMed] [Google Scholar]
- 166.Patterson GH, Piston DW, Barisas BG. Anal Biochem. 2000;284:438–440. doi: 10.1006/abio.2000.4708. [DOI] [PubMed] [Google Scholar]
- 167.Miyawaki A, Tsien RY. Methods Enzymol. 2000;327:472–500. doi: 10.1016/s0076-6879(00)27297-2. [DOI] [PubMed] [Google Scholar]
- 168.Miyawaki A, Llopis J, Heim R, McCaffery JM, Adams JA, Ikura M, Tsien RY. Nature. 1997;388:882–887. doi: 10.1038/42264. [DOI] [PubMed] [Google Scholar]
- 169.Miyawaki A, Griesbeck O, Heim R, Tsien RY. Proc Natl Acad Sci U S A. 1999;96:2135–2140. doi: 10.1073/pnas.96.5.2135. [DOI] [PMC free article] [PubMed] [Google Scholar]
- 170.Karasawa S, Araki T, Nagai T, Mizuno H, Miyawaki A. Biochem J. 2004;381:307–312. doi: 10.1042/BJ20040321. [DOI] [PMC free article] [PubMed] [Google Scholar]
- 171.Goedhart J, Vermeer JE, Adjobo-Hermans MJ, van Weeren L, Gadella TW. PLoS ONE. 2007;2:e1011. doi: 10.1371/journal.pone.0001011. [DOI] [PMC free article] [PubMed] [Google Scholar]
- 172.Nguyen AW, Daugherty PS. Nature Biotechnology. 2005;23:355–360. doi: 10.1038/nbt1066. [DOI] [PubMed] [Google Scholar]
- 173.Ohashi T, Galiacy SD, Briscoe G, Erickson HP. Protein Sci. 2007;16:1429–1438. doi: 10.1110/ps.072845607. [DOI] [PMC free article] [PubMed] [Google Scholar]
- 174.Vinkenborg JL, Evers TH, Reulen SW, Meijer EW, Merkx M. ChemBioChem. 2007;8:1119–1121. doi: 10.1002/cbic.200700109. [DOI] [PubMed] [Google Scholar]
- 175.Wilson T, Hastings JW. Annu Rev Cell Dev Biol. 1998;14:197–230. doi: 10.1146/annurev.cellbio.14.1.197. [DOI] [PubMed] [Google Scholar]
- 176.Weiss S. Science. 1999;283:1676–1683. doi: 10.1126/science.283.5408.1676. [DOI] [PubMed] [Google Scholar]
- 177.Griffin BA, Adams SR, Tsien RY. Science. 1998;281:269–272. doi: 10.1126/science.281.5374.269. [DOI] [PubMed] [Google Scholar]
- 178.Zlokarnik G, Negulescu PA, Knapp TE, Mere L, Burres N, Feng L, Whitney M, Roemer K, Tsien RY. Science. 1998;279:84–88. doi: 10.1126/science.279.5347.84. [DOI] [PubMed] [Google Scholar]
- 179.Xu Y, Piston DW, Johnson CH. Proc Natl Acad Sci U S A. 1999;96:151–156. doi: 10.1073/pnas.96.1.151. [DOI] [PMC free article] [PubMed] [Google Scholar]
- 180.Galperin E, Verkhusha VV, Sorkin A. Nat Methods. 2004;1:209–217. doi: 10.1038/nmeth720. [DOI] [PubMed] [Google Scholar]
- 181.Yuste R, Miller RB, Holthoff K, Zhang S, Miesenbock G. Methods Enzymol. 2000;327:522–546. doi: 10.1016/s0076-6879(00)27300-x. [DOI] [PubMed] [Google Scholar]
- 182.Robey RB, Ruiz O, Santos AV, Ma J, Kear F, Wang LJ, Li CJ, Bernardo AA, Arruda JA. Biochemistry. 1998;37:9894–9901. doi: 10.1021/bi980857x. [DOI] [PubMed] [Google Scholar]
- 183.Elsliger MA, Wachter RM, Hanson GT, Kallio K, Remington SJ. Biochemistry. 1999;38:5296–5301. doi: 10.1021/bi9902182. [DOI] [PubMed] [Google Scholar]
- 184.Sankaranarayanan S, De Angelis D, Rothman JE, Ryan TA. Biophys J. 2000;79:2199–2208. doi: 10.1016/S0006-3495(00)76468-X. [DOI] [PMC free article] [PubMed] [Google Scholar]
- 185.Hanson GT, McAnaney TB, Park ES, Rendell ME, Yarbrough DK, Chu S, Xi L, Boxer SG, Montrose MH, Remington SJ. Biochemistry. 2002;41:15477–15488. doi: 10.1021/bi026609p. [DOI] [PubMed] [Google Scholar]
- 186.Li Y, Agrawal A, Sakon J, Beitle RR. J Chromatogr A. 2001;909:183–190. doi: 10.1016/s0021-9673(00)01100-6. [DOI] [PubMed] [Google Scholar]
- 187.Richmond TA, Takahashi TT, Shimkhada R, Bernsdorf J. Biochem Biophys Res Commun. 2000;268:462–465. doi: 10.1006/bbrc.1999.1244. [DOI] [PubMed] [Google Scholar]
- 188.Hanson GT, Aggeler R, Oglesbee D, Cannon M, Capaldi RA, Tsien RY, Remington SJ. J Biol Chem. 2004;279:13044–13053. doi: 10.1074/jbc.M312846200. [DOI] [PubMed] [Google Scholar]
- 189.Dooley CT, Dore TM, Hanson GT, Jackson WC, Remington SJ, Tsien RY. J Biol Chem. 2004;279:22284–22293. doi: 10.1074/jbc.M312847200. [DOI] [PubMed] [Google Scholar]
- 190.Heinemann U, Hahn M. Trends Biochem Sci. 1995;20:349–350. doi: 10.1016/s0968-0004(00)89073-8. [DOI] [PubMed] [Google Scholar]
- 191.Baird GS, Zacharias DA, Tsien RY. Proc Natl Acad Sci U S A. 1999;96:11241–11246. doi: 10.1073/pnas.96.20.11241. [DOI] [PMC free article] [PubMed] [Google Scholar]
- 192.Abedi MR, Caponigro G, Kamb A. Nucleic Acids Res. 1998;26:623–630. doi: 10.1093/nar/26.2.623. [DOI] [PMC free article] [PubMed] [Google Scholar]
- 193.Nagai T, Sawano A, Park ES, Miyawaki A. Proc Natl Acad Sci U S A. 2001;98:3197–3202. doi: 10.1073/pnas.051636098. [DOI] [PMC free article] [PubMed] [Google Scholar]
- 194.Belousov VV, Fradkov AF, Lukyanov KA, Staroverov DB, Shakhbazov KS, Terskikh AV, Lukyanov S. Nat Methods. 2006;3:281–286. doi: 10.1038/nmeth866. [DOI] [PubMed] [Google Scholar]
- 195.Zimmermann T, Rietdorf J, Pepperkok R. FEBS Lett. 2003;546:87–92. doi: 10.1016/s0014-5793(03)00521-0. [DOI] [PubMed] [Google Scholar]
- 196.Verkhusha VV, Matz MV, Sakurai T, Lukyanov KA. In: Protein structures: kaleidoscope of structural properties and function. Uversky VN, editor. Trivandrum, India: Research Signpost; 2003. pp. 405–439. [Google Scholar]
- 197.Humphrey W, Dalke A, Schulten K. J Mol Graph. 1996;14:33–38. doi: 10.1016/0263-7855(96)00018-5. 27–8. [DOI] [PubMed] [Google Scholar]
- 198.Merritt EA, Bacon DJ. Methods Enzymol. 1977;277:505–524. doi: 10.1016/s0076-6879(97)77028-9. [DOI] [PubMed] [Google Scholar]
- 199.Merritt EA, Murphy ME. Acta Crystallogr D Biol Crystallogr. 1994;50:869–873. doi: 10.1107/S0907444994006396. [DOI] [PubMed] [Google Scholar]
- 200.Reid BG, Flynn GC. Biochemistry. 1997;36:6786–6791. doi: 10.1021/bi970281w. [DOI] [PubMed] [Google Scholar]
- 201.Verkhusha VV, Lukyanov KA. Nat Biotechnol. 2004;22:289–296. doi: 10.1038/nbt943. [DOI] [PubMed] [Google Scholar]
- 202.Yang TT, Sinai P, Green G, Kitts PA, Chen YT, Lybarger L, Chervenak R, Patterson GH, Piston DW, Kain SR. J Biol Chem. 1998;273:8212–8216. doi: 10.1074/jbc.273.14.8212. [DOI] [PubMed] [Google Scholar]
- 203.Mena MA, Treynor TP, Mayo SL, Daugherty PS. Nature Biotechnology. 2006;24:1569–15671. doi: 10.1038/nbt1264. [DOI] [PubMed] [Google Scholar]
- 204.Ai H-W, Shaner NC, Cheng Z, Tsien RY, Campbell RE. Biochemistry. 2007;46 doi: 10.1021/bi700199g. 5904-5901. [DOI] [PubMed] [Google Scholar]
- 205.Rizzo MA, Springer GH, Granada B, Piston DW. Nature Biotechnology. 2004;22:445–449. doi: 10.1038/nbt945. [DOI] [PubMed] [Google Scholar]
- 206.Cubitt AB, Woollenweber LA, Heim R. Meth Cell Biol. 1999;58:19–30. doi: 10.1016/s0091-679x(08)61946-9. [DOI] [PubMed] [Google Scholar]
- 207.Zapata-Hommer O, Griesbeck O. BMC Biotechnol. 2003;3:5. doi: 10.1186/1472-6750-3-5. [DOI] [PMC free article] [PubMed] [Google Scholar]
- 208.Nagai T, Ibata K, Park ES, Kubota M, Mikoshiba K, Miyawaki A. Nature Biotechnology. 2002;20:87–90. doi: 10.1038/nbt0102-87. [DOI] [PubMed] [Google Scholar]
- 209.Griesbeck O, Baird GS, Campbell RE, Zacharias DA, Tsien RY. J Biol Chem. 2001;276:29188–29194. doi: 10.1074/jbc.M102815200. [DOI] [PubMed] [Google Scholar]
- 210.Kogure T, Karasawa S, Araki T, Saito K, Kinjo M, Miyawaki A. Nature Biotechnology. 2006;24:577–581. doi: 10.1038/nbt1207. [DOI] [PubMed] [Google Scholar]
- 211.Gurskaya NG, Fradkov AF, Terskikh A, Matz MV, Labas YA, Martynov VI, Yanushevich YG, Lukyanov KA, Lukyanov SA. FEBS Lett. 2001;507:16–20. doi: 10.1016/s0014-5793(01)02930-1. [DOI] [PubMed] [Google Scholar]