Abstract
Mitochondrial membrane hyperpolarization and morphological changes are important in inflammatory cell activation. Despite the pathophysiological relevance, no valid and reproducible method for measuring mitochondrial homeostasis in human inflammatory cells is currently available. This study's purpose was to define and validate reproducible methods for measuring relevant mitochondrial perturbations and to determine whether these methods could discern mitochondrial perturbations in type 2 diabetes mellitus (T2DM), a condition associated with altered mitochondrial homeostasis. We employed 5,5',6,6'-tetrachloro-1,1'3,3'-tetraethylbenzamidazol-carboncyanine (JC-1) to estimate mitochondrial membrane potential (ψm) and acridine orange 10-nonyl bromide (NAO) to assess mitochondrial mass in human mononuclear cells isolated from blood. Both assays were reproducible. We validated our findings by electron microscopy and pharmacological manipulation of ψm. We measured JC-1 and NAO fluorescence in the mononuclear cells of 27 T2DM patients and 32 controls. Mitochondria were more polarized (P=0.02) and mitochondrial mass was lower in T2DM (P=0.008). Electron microscopy demonstrated diabetic mitochondria were smaller, more spherical, and occupied less cellular area in T2DM. Mitochondrial superoxide production was higher in T2DM (P=0.01). Valid and reproducible measurements of mitochondrial homeostasis can be made in human mononuclear cells using these fluorophores. Further, potential clinically relevant perturbations in mitochondrial homeostasis in T2DM human mononuclear cells can be detected.
Keywords: Diabetes, Mitochondria, Human, Mononuclear Cells
Introduction
Mitochondria are central to catabolism and the production of ATP. Recently, there has been increased awareness of the importance of perturbations of mitochondrial homeostasis in pathological states, including diabetic vascular disease.1 Prior data also demonstrate the central and proximal roles of activated T-lymphocytes2, 3 and monocytes4 in the pathogenesis of atherosclerosis.5 While these cells can be activated by multiple stimuli, emerging evidence suggest that the presence of type 2 diabetes leads to activation of the inflammatory mechanisms in these cells through pathways that involve alterations in mitochondrial homeostasis.6 Specifically, mitochondrial hyperpolarization, which has been shown in basic and animal studies to occur in type 2 diabetes,1 appears to be a key step in the activation of the immune process in both lymphocytes7 and monocytes.8
Further, mitochondrial mass and morphology are also central to mitochondrial function.9, 10 Reductions in mitochondrial mass have been observed under diabetic conditions in skeletal muscle,11 and cell culture studies demonstrate hyperglycemia induces mitochondrial fission with the subsequent development of excessive mitochondrial reactive oxygen species (ROS) production, reduced ATP production, and blunted cell growth.12
Prior work using tumor cell lines suggest the potential for making measurements of mitochondrial membrane potential and mass in human mononuclear cells.13 However, despite the potential pathophysiological significance of perturbations of mitochondrial morphology and membrane potential in diabetic mononuclear cells, there are no protocols that establish an efficient, valid, and reproducible method for making measurements of mitochondrial homeostasis in human mononuclear cells. In this study, we establish a valid and reproducible method for measuring mitochondrial membrane potential and mass in this easily accessible cell population and apply this methodology to demonstrate significant differences in mitochondrial homeostasis between patients with type 2 diabetes (T2DM) and non-diabetics.
Methods
Subject Selection
The study protocols and advertisements were approved by the Medical College of Wisconsin Institutional Review Board or the Boston University Medical Center Institutional Review Board, and all subjects underwent the informed consent process as required by these institutions. All mitochondrial measurements for reproducibility and comparison of patients with type 2 diabetes to non-diabetics were performed at the Medical College of Wisconsin.
27 diabetic and 32 non-diabetic subjects ages 35–70 were consecutively enrolled. The diagnosis of type 2 diabetes was made by the enrollee's primary physician prior to enrollment based on standard criteria.14 Control subjects were screened prior to enrollment, and excluded if they had metabolic syndrome per the International Diabetes Federation criteria,15 a history of cardiovascular disease (including a clinical history of stroke or myocardial infarction,16 or a documented history of a cardiac catheterization with ≥50% stenosis in at least one major epicardial coronary artery), a major chronic illness, a positive pregnancy test as determine by urinary beta-HCG test, a diagnosis of type 1 diabetes, or a history of cigarette smoking within a year prior to the study.
All studies were performed in the fasting state and done between 7:30AM and 9AM. Subjects with diabetes mellitus were instructed to hold their morning oral diabetes medications prior to their blood draw.
Isolation of Monocytes and Lymphocytes
We collected venous blood into prefabricated tubes containing a density gradient solution for the isolation of lymphocytes and monocytes (BD™ Vacutainer™ CPT Cell Preparation tubes with sodium citrate Becton, Dickenson and Company, Franklin, NJ). Tubes were spun at 3000 rpm for 30 minutes at room temperature and cell layers were collected and transferred into 5 mL of 1× Hank's Buffered Salt Solution (HBSS) by pipet. This solution was centrifuged for additional 10 minutes at 250 × g at room temperature. The pellet was resuspended in fresh 1× HBSS. Cell count was determined using a hemacytometer, with all counts made in duplicate and the average taken to be the cell concentration. Preparations were subsequently diluted with HBSS to a concentration of 8.0 × 10⁵ cells/mL for further analyses. In five healthy subjects, flow cytometry analysis confirmed that this isolation procedure yields a mixture of 96% mononuclear cells (lymphocytes and monocytes).
Measurement of Mitochondrial Membrane Potential
We assessed mitochondrial membrane potential (ΔΨm) using 5,5',6,6'-tetrachloro-1,1'3,3'-tetraethylbenzamidazol-carboncyanine (JC-1, Invitrogen, Carlsbad, CA). JC-1 is a cationic dye whose mitochondrial uptake is directly related to the magnitude of the mitochondrial membrane potential. The greater the mitochondrial uptake, the greater concentration of JC-1 aggregate forms which have a red fluorescent emission signal, as opposed to the JC-1 monomer that fluoresces green.17 Prior studies demonstrate a linear relationship between red:green ratio of JC-1 fluorescence and membrane potential over a physiological range.17
One milliliter of isolated cells (concentration 8.0 × 10⁵ cells/mL ) were incubated with 10μL of 200 μM JC-1 (final JC-1 concentration of 2 μM) for 20 minutes at 37°C with 5% CO2. Cells were subsequently pelleted by centrifugation (5000 rpm for 5 minutes at 4°C) and resuspended in 1× phosphate buffered saline (PBS). JC-1 fluorescence for the cell suspensions and PBS controls were measured in triplicate in costar-96 well plates (Corning, NY) using a microplate reader (Ex/Em(green)/Em(red):: 485/538/590nm)(SpectraMAX Gemini EM, Molecular Devices, Sunnyvale, CA). A higher red:green ratio indicates a more polarized, or more negative and hyperpolarized mitochondrial inner membrane.
Measurement of Mitochondrial Mass by Estimating Cardiolipin Content
As a measure of mitochondrial mass, we used acridine orange 10-nonyl bromide (NAO, Invitrogen), a metachromic dye that fluoresces at 533 nm. NAO binds to cardiolipin, a phospholipid specifically present on the mitochondrial membrane. Importantly, binding is independent of ΔΨm over the physiologically relevant range.18, 19
Six μL of 2.5 mM stock NAO solution were diluted to a concentration of 5 μM NAO using 2.994 mL of 1× HBSS. Then, we added 3 mL of freshly isolated cells at 8.0 × 10⁵ cells/mL into this solution to reach final NAO concentration to 2.5 μM. These cells were incubated in light-shielded vials at 37°C in a water bath for 30 minutes. The cell solution was then centrifuged twice at 4C for 5 minutes at 1,500 rpm. The pellet was resuspended in 1 mL of fresh 1× HBSS, washed, and the sample was diluted to a cell count of 1.0 × 10⁵ cells/mL. NAO fluorescence for the cell suspension and HBSS controls was measured in triplicate using the microplate reader (Ex/Em 485/538 nm) previously described.
Measurement of Mitochondrial Superoxide Production
To verify the potential functional significance of our findings, we measured mitochondria specific superoxide production in monocytes isolated from an additional 8 patients with T2DM and 6 non-diabetic subjects. A 35-mm petri dish (Corning, Lowell, MA) was coated with 0.01% Poly-L-Lysin (Sigma Aldrich, St.Louis, MO), and washed with deionized water. For each subject, 1mL of mononuclear cell suspension solution (8×10⁵ cells/ml) containing 5 μM of MitoSox™ (Invitrogen, Carlsbad, CA) was added to a petri dish, which was subsequently incubated 37°C for 30 min. MitoSox™ is comprised of hydroethidium covalently bonded to a triphenylphosphonium group that allows for selective targeting of this superoxide detector to mitochondria, leading an approximately 1000× concentration of this fluorophore in the mitochondria relative to the cytosol.20 Following washing, fluorescence intensity of individual cells was measured by fluorescent microscopy (Nikon Eclipes TE 200-U, Tokyo, Japan) with wavelength of Ex/Em 510/572 nm. A reviewer blinded to the clinical status of the study subjects measured fluorescence intensity of individual cells in ten different section of the dish and corrected these measurements for local background fluorescence using MetaMorph 6.2 (Molecular Devices, Sunnyvale, CA).
Validity and Reproducibility Studies
We assessed intra-assay variability for each fluorophore by performing measurements of JC-1 and NAO fluorescent intensities on two separate blood samples taken on the same day from 10 subjects without diabetes. To measure inter-assay variability, JC-1 and NAO fluorescent intensities, blood samples were obtained on two separate occasions at least one week apart from 11 non-diabetic study participants for JC-1 and 8 participants for NAO (6 non-diabetic subjects, 2 diabetic subjects).
To identify the sub-cellular location of JC-1 accumulation, we imaged mononuclear cells attached on 0.01% Poly-L-Lysin (Sigma Aldrich, St.Louis, MO) coated micro cover glasses (VWR Scientific, Inc., Media, PA), which was fixed on a slide using a confocal laser scanning microscope (Nikon Eclipes TE2000-U, Tokyo, Japan) with Ex/Em wavelengths of 488/530/590 nm. These images were superimposed to show the relative localization of the fluorescent signals from JC-1 monomers (green) and dimers (red) using MetaMorph 6.2. The red and green fluorescent intensity of the sample cells were measured using Image J 1.38. Electron microscopy images of these cells were also taken for comparison [JEOL 1011 transmission electron microscope (Tokyo, Japan) with a mounted Gatan digital camera (Pleasanton, CA)]. Confocal microscopic images were obtained of mononuclear cells from both T2DM and non-diabetic subjects exposed to nonyl acridine orange (Ex/Em 490/526 nm) and MitoSox™ (Ex/Em 510/580 nm).
To confirm our ability to detect changes in membrane potential using this method, we isolated mononuclear cells from 6 non-diabetic and 2 T2DM subjects and measured JC-1 fluorescence after incubation with the mitochondrial membrane depolarizing agent carbonyl cyanide 4-(trifluoromethoxy) phenylhydrazone (FCCP) with a dose range of 0 to 10 μM for 30 minutes.
We used transmission electron microscopy as an alternative way to assess mitochondrial mass in cells collected from three control subjects and three subjects with type 2 diabetes mellitus using a previously described methodology.12 Images of 20–40 cells per subject were obtained at 12,000× [Hitachi H 600 TEM (Tokyo, Japan) equipped with an AMT 1K side mount camera (Advanced Microscopy Techniques, Danvers, MA)]
ImageJ version 1.38 was used to measure the cell area and the area and dimensions of all visible mitochondria within the cell (3–18 mitochondria/ cell). To quantify mitochondrial morphology, higher power images (30,000×) were analyzed from three diabetic and three non-diabetic subjects (10–12 cells per subject). ImageJ 1.38 was used to calculate the average mitochondrial aspect ratio (length of major axis ÷ length of minor axis) and form factor for each individual. A perfectly circular mitochondrion would have an aspect ratio of 1. Form factor is the inverse of circularity.21. A higher form factor is indicative of more branching and complex mitochondria. All cell analyses were blinded to the clinical status of the subjects.
Statistical Analysis
Study data were collected and managed using REDCap electronic data capture tools hosted at the Medical College of Wisconsin.22 With respect to the reproducibility data, we calculated the coefficients of variation, Pearson's correlation coefficient, and intraclass correlation coefficients for the log-transformed JC-1 red:green ratio, and NAO fluorescent intensity for both repeated measures performed at the same time and repeated measures performed approximately one week apart.
For the comparison between patients with T2DM and non-diabetics, study population characteristics, JC-1 red:green ratios, and NAO fluorescence intensities were compared using unpaired t-tests, Wilcoxon rank sum test, or Fisher's exact test as appropriate. JC-1 red:green ratios and NAO fluorescence intensities were normalized by log transformation prior to evaluation of univariate and multivariate predictors. We determined univariate associations between the log transformed mitochondrial measurements and age, sex, body mass index (BMI), waist circumference, LDL, HDL, triglycerides, total cholesterol, systolic blood pressure, and diastolic blood pressure. Multivariable models were constructed for to determine independent predictors of log JC-1 red:green ratio and log NAO fluorescence intensity that included all significant univariate predictors (P<0.05 for univariate associations). All values are reported as mean ± S.D unless otherwise specified. P-values ≤ 0.05 were considered significant.
Results
Subject Demographics
The demographic data for the 32 non-diabetic and 27 type 2 diabetic subjects enrolled in this cross-sectional investigation are listed in Table 1. The average time since diagnosis for the T2DM patients was 4.4±3.6 years. Fasting glucose level, BMI, waist circumference, triglycerides, and systolic blood pressure were all significantly higher in the diabetic group. Diabetes also had lower LDL levels. Medications taken by the diabetic subjects are listed in the caption to Table 1. No control subjects were taking any of these medications.
Table 1.
Subiect Demoqraphic Data
| Controls (N=32) |
Diabetics (N=27)** |
|
|---|---|---|
| Age (years) | 46±6 | 54±8* |
| Sex (% Female) | 53% | 63% |
| Body Mass Index (kg/m2) | 28.4±5.5 | 33.2±7.4* |
| Waist Circumference (cm) | 94±16 | 110±17* |
| Fasting Glucose (mg/dl)b | 87±9 | 134±40† |
| LDL Cholesterol (mg/dl) | 115±33 | 94±23* |
| HDL Cholesterol (mg/dl) | 54±17 | 52±14 |
| Triglycerides (mg/dl) | 98±41 | 138±56* |
| Total Cholesterol (mg/dl) | 188±41 | 172±28 |
| Systolic Blood Pressure (mmHg) | 124±19 | 132±16* |
| Diastolic Blood Pressure (mmHg) | 75±12 | 72±10 |
P< 0.05 for comparison between groups.
N=19 for fasting glucose in diabetic group.
The number of diabetics taking each of the following medications or classes of medications are as follows: sulfonylureas: 7, metformin: 17, thiazoladinediones:1, angiotensin converting enzyme inhibitors: 3, angiotension II receptor blockers:6, aspirin:6, HMG CoA reductase inhibitors:10, calcium channel blockers:1, and beta-blockers:4.
Confirmation of Fluorophore Localization and Activity
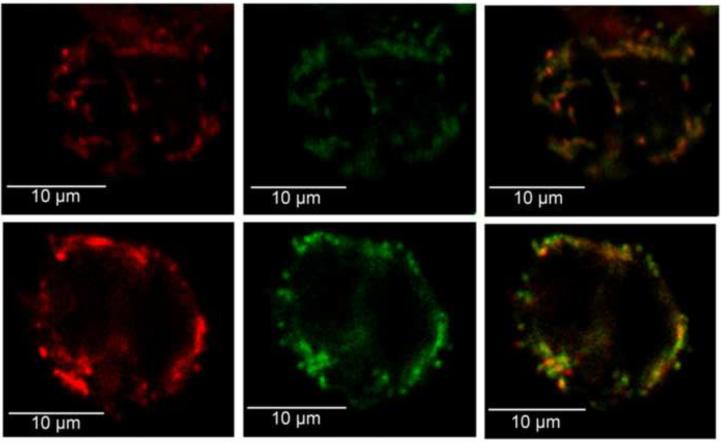
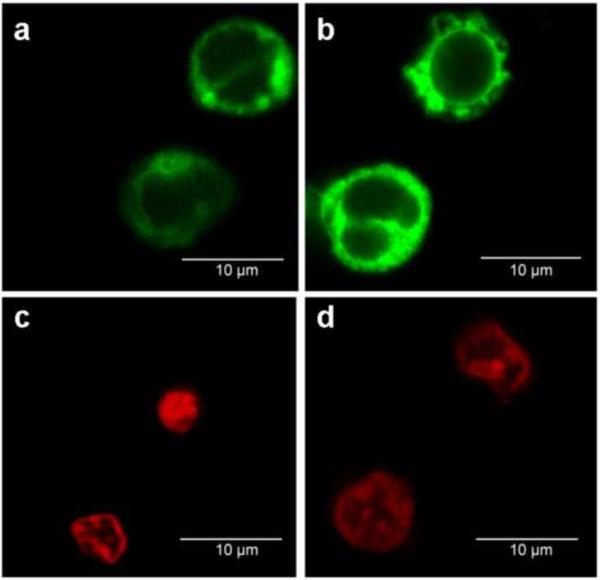
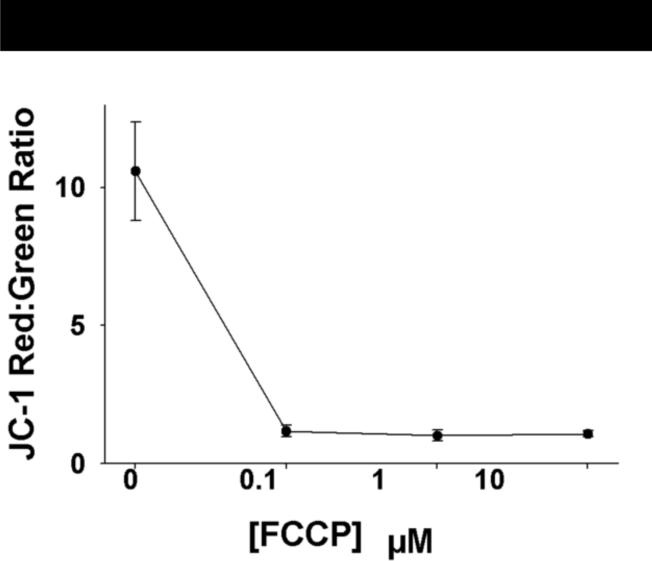
Representative confocal images of mononuclear cells from participants with T2DM and non-diabetic subjects for JC-1, NAO, and MitoSox™ are shown in Figures 1 and 2. FCCP produced a readily detectable decrease in ΔΨm as represented by the log JC-1 red:green fluorescent intensity within a physiologically relevant range (Figure 3).
Figure 1.
JC-1 localization in representative confocal images of mononuclear cells from a subject with T2DM (a,b,c) and a subject without diabetes (d,e,f). (a,d) Localization of red JC-1 fluorescent intensity following excitation with a wavelength of 488 nm. (b,e) Green JC-1 fluorescence intensity following excitation with the same wavelength. (c,f) Overlay for green and red JC-1 fluorescence, showing co-localization to the same area of the cells. The red:green fluorescence ratio for the diabetic and non-diabetic cells were 1.88 and 1.19, respectively.
Figure 2.
Representative flourscent confocal images of human mononuclear cells with NAO (a,b) and MitoSox™ (c,d) fluorophores for a patient with T2DM (a,c) and without diabetes (b,d
Figure 3.
Mitochondrial membrane potential as estimated by JC-1 is appropriately depolarized by FCCP exposure. Mononuclear cells were incubated for 30 minutes in the indicated concentrations of FCCP.
Validation and Reproducibility of Measures of Mitochondrial Homeostasis
Table 2 displays reproducibility data for the red:green ratio of JC-1, mitochondrial membrane potential, and NAO fluorescent intensity. The intra-assay Pearson and intra-class correlation coefficients for the log JC-1 ratio and log NAO fluorescent intensity were both 0.98. The inter-assay Pearson and intra-class correlation coefficients for log JC-1 were respectively 0.80 and 0.81 for log JC-1 and 0.96 and 0.93 for log NAO. The intra- and inter-assay coefficients of variation are also reported in Table 2.
Table 2.
Reproducibility Data for Measurements of Mitochondrial Membrane Potential and Mass Using JC-1 and NAO in Human Mononuclear Cells
| Samples Drawn on the Same Day (n=10) | Samples Drawn >1 week apart (n=11 JC-1, n=8 for NAO) | |||||
|---|---|---|---|---|---|---|
| Measurement | Intra-assay Coefficient of Variation | Pearson's Correlation Coefficient | Intraclass Correlation Coefficient | Inter-assay Coefficient of Variation | Pearson's Correlation Coefficient | Intraclass Correlation Coefficient |
| Log JC-1 Red:Green Ratio | 3.6% | 0.98 | 0.98 | 14.3% | 0.81 | 0.80 |
| Log NAO Fluorescent Intensity (per mg/mL protein) | 13.3% | 0.98 | 0.98 | 8.2% | 0.96 | 0.93 |
Mitochondrial Morphology in Patients with T2DM Versus Non-Diabetics
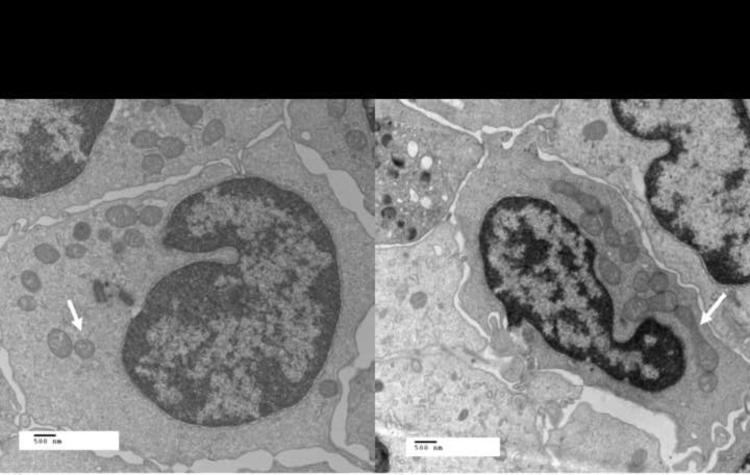
Table 3 reports the quantitative measurements of mitochondrial morphology for both groups. While there were no significant between-group differences in the number of mitochondria per cell, the mitochondria of patients with T2DM were significantly smaller, occupied significantly less cell area, and were significantly more spherical than those of non-diabetics. There was a trend toward reduced mitochondrial branching complexity as measured by the form factor in patients with T2DM, but this comparison did not reach statistical significance. Figure 4 illustrates representative EM micrographs of the mitochondrial morphology found in patients with T2DM (Figure 4a) and non-diabetic participants (Figure 4b)
Table 3.
Mitochondrial Morphological Data
| Morphological Characteristic |
Controls (n=3) |
Diabetics (n=3) |
|---|---|---|
| Mitochondrial Number (#/cell) | 8.8±0.3 | 8.2±1.2 |
| Average Individual Mitochondrial Area (μm) | 0.27±0.05 | 0.17±0.02* |
| Total Mitochondrial Area/Cell (μm/cell) | 2.3±0.4 | 1.4±0.3* |
| Mitochondrial Area/Cell Area (%) | 6.4±1.4 | 3.5±0.2* |
| Aspect Ratio | 1.9±0.1 | 1.5±0.1* |
| Form Factor | 1.9±0.5 | 1.6±0.2 |
P<0.05
Figure 4.
Differences in mitochondrial morphology between patients with T2DM and controls. Displayed are electron microscopy images (original magnification 12,000×, print magnification 23900× @8 in, 500 nm scale) showing that the mitochondria of Type 2 diabetics (a) are generally smaller and rounder compared to non diabetic controls (b). White arrows point to representative mitochondria in each image.
Comparison of Mitochondrial Membrane Potential and Mass in Patients with T2DM and Non-Diabetic Controls
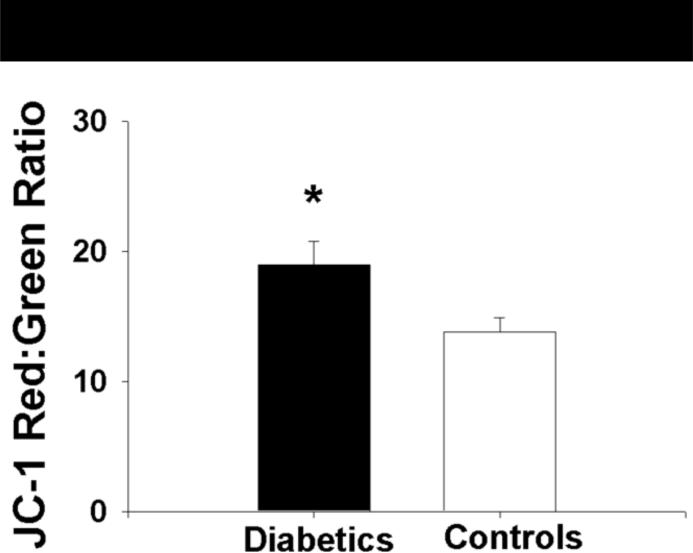
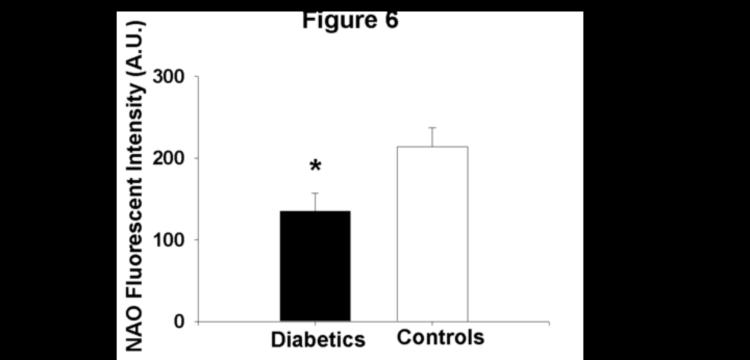
Mitochondrial membrane potential, expressed as the absolute red:green ratio, in the isolated mononuclear cells of patients with T2DM was significantly greater in magnitude than that measured in non-diabetic subjects (19.0±9.3 vs. 13.8±6.0 for patients with T2DM and controls, respectively, P=0.02, Figure 5). Further, mitochondrial mass as estimated by NAO fluorescent intensity was lower in patients with T2DM compared to control subjects (135±111 vs.214±128 A.U. for diabetics and controls, respectively, P=0.008, Figure 6). Differences between groups for both measures remained following log transformation (P=0.008 and 0.003 for red:green ratio and NAO fluorescence intensity, respectively).
Figure 5.
The mitochondria patients with T2DM are more highly polarized (more negative) than controls subjects as measured by the red:green fluorescent intensity ration of theJC-1 probe. Data presented as mean±S.E.
*− P=0.02
Figure 6.
Mitochondrial mass/cardiolipin content is lower in patients with T2DM relative to control subjects as measured by nonyl acridine orange fluorescent intensity
*−P=0.008
Predictors of Mitochondrial Membrane Potential and Mitochondrial Mass
Table 4 shows the results of our univariate analyses for predictors of mitochondrial membrane potential and mass. The presence of diabetes was the only variable significantly associated with mitochondrial membrane potential (r=0.34, p=0.008). With respect to mitochondrial mass estimated by NAO, only age, presence of diabetes, and body mass index were significant univariate predictors.
Table 4.
Univariate Associations between Mitochondrial Measurements and Subject Characteristics
| Mitochondrial Membrane Potential (JC-1) |
Mitochondrial Mass (NAO) |
|||
|---|---|---|---|---|
| r | P-value | r | P-value | |
| Age | 0.17 | 0.21 | 0.26 | 0.048* |
| Sex | 0.03 | 0.85 | 0.06 | 0.65 |
| Presence of Diabetes | 0.34 | 0.008* | 0.38 | 0.003* |
| BMI | 0.06 | 0.65 | 0.27 | 0.041* |
| Waist Circumference | 0.06 | 0.66 | 0.23 | 0.10 |
| SBP | 0.01 | 0.93 | 0.05 | 0.68 |
| DBP | 0.10 | 0.45 | 0.25 | 0.06 |
| Total Cholesterol | 0.16 | 0.24 | 0.19 | 0.15 |
| LDL Cholesterol | 0.16 | 0.22 | 0.25 | 0.06 |
| HDL Cholesterol | 0.06 | 0.68 | 0.02 | 0.91 |
| Triglycerides | 0.01 | 0.96 | 0.04 | 0.76 |
-significant univariate association
In an age-adjusted model, the presence of diabetes remained an independent predictor of mitochondrial membrane potential by JC-1 (P<0.001 for model, R2=0.16, p=0.02 for presence of diabetes, p=0.43 for age). Age- and BMI-adjustment blunted the association between the presence of diabetes and mitochondrial mass (P=0.01 for model, R2=0.18, p=0.08 for presence of diabetes, p=0.33 for age, p=0.18 for BMI).
Comparison of Mitochondrial Superoxide Production between Patients with T2DM and Non-Diabetics
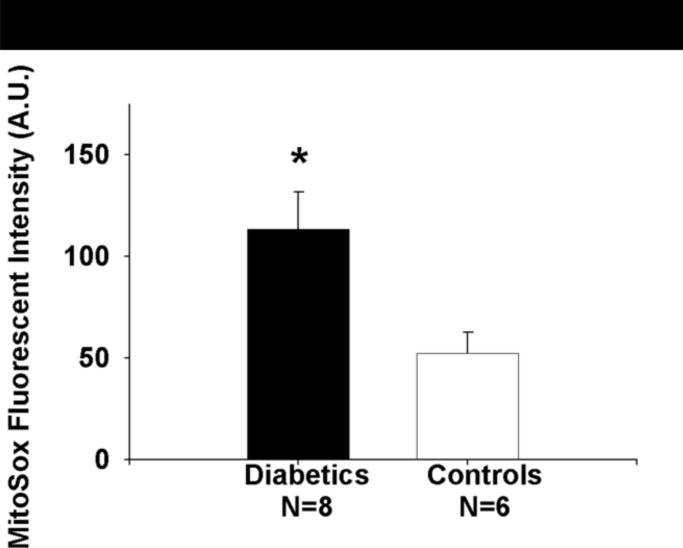
Mitochondrial superoxide productions was significantly higher in a subset of 8 patients with T2DM relative to 6 non-diabetic controls.(113±52 vs. 52±26 A.U. for DM vs. non-diabetics, P=0.01, Figure 7)
Figure 7.
Mitochondrial superoxide production is higher in a subset patients with T2DM relative to control subjects as measured by MitoSox™. Data presented as mean±S.E.
*−P=0.01
Discussion
In this study, we demonstrated an efficient method to perform valid and reproducible measurements of mitochondrial mass and membrane potential in human mononuclear cells isolated from the peripheral venous circulation using JC-1 and NAO. Further, we demonstrated greater mitochondrial membrane polarization and lower mitochondrial mass in patients with T2DM compared to age matched controls. The presence of diabetes was the only subject characteristic associated with mitochondrial hyperpolarization and this association was independent of age. The relationship between mitochondrial mass and the presence of diabetes appears to be in part mediated by age and body mass index. We also found that mitochondrial superoxide production was higher in a subgroup of patients with T2DM relative to controls. Importantly, these data support our ability to make valid and reproducible measurements of mitochondrial homeostasis. To our knowledge, these data are the first to characterize the mitochondrial membrane potential and morphology in the mononuclear cells of patients with T2DM relative to non-diabetics. These findings add to the growing literature implicating derangements of mitochondrial homeostasis in the pathophysiology of type 2 diabetes.
We found mitochondrial hyperpolarization along with lower mitochondrial mass and spherical, less complex mitochondrial morphology in patients with T2DM relative to non-diabetics. Our findings parallel cell culture data delineating a similar pattern of mitochondrial hyperpolarization and morphological alterations central to the inflammatory activation process of monocytes and T-cells in type 2 diabetes.7, 23 12 Specifically, the hyperglycemic state of type 2 diabetes is known to trigger the production of multiple pro-inflammatory cytokines, induce cytotoxic and helper T-cell proliferation,24 and activate immune responses in T-cells and monocytes,25 and lead to concomitant increased ROS production.26, 27,28 The heightened overall inflammatory state in type 2 diabetes likely contributes significantly to the microvascular and macrovascular complications of this disease,29 suggesting our findings may have pathophysiological relevance to the cardiovascular morbidity of diabetes.
The present study also demonstrated significant differences in mitochondrial morphology in mononuclear cells from diabetic patients. There is a growing recognition that mitochondrial morphology and function are the significant linked.9, 10 With respect to diabetes, hyperglycemia induces rapid mitochondrial fission and this response is associated with excessive mitochondrial ROS production and mitochondrial hyperpolarization.12 Further, in vitro cell culture work has demonstrated that increased mitochondrial fission and inhibition of mitochondrial fusion lead to less efficient ATP production,30 slower cell growth,31 and increased mitochondrial DNA damage.32 Our data extend these findings, suggesting chronic hyperglycemia and insulin resistance produce small, divided, and hyperpolarized mitochondria producing elevated levels of superoxide, contributing to an overall heightened state of activation and inflammation in mononuclear cells. The influence of diabetes on mitochondrial mass may be modified by both age and body mass, findings that merits future investigation.
In the present study, we used NAO fluorescence as an index of mitochondrial mass. This approach relies on a strong, direct relationship between mitochondrial cardiolipin and mitochondrial number. Cardiolipin is a large phospholipid specific to the mitochondrial inner membrane, comprising approximately 20% of membrane lipid content. Cardiolipin plays a key role in maintaining the fidelity of oxidative phosphorylation, but is prone to oxidative modifications and removal.33, 34 We cannot exclude reduced mitochondrial cardiolipin content in diabetic mononuclear cells as a contributor to the differences in NAO fluorescence observed. Given the importance of cardiolipin to mitochondrial membrane integrity, alterations in cardiolipin content in mononuclear cells in diabetics merit further investigation.
While useful for rapid assessments of structure and function, measurements of mitochondrial homeostasis using fluorescent probes should generally be considered semi-quantitative given limitations with all currently available probes.35 For example, studies using the mitochondrial membrane potential fluorophore TMRE may be problematic because it has been shown to bind to the inner mitochondrial membrane such that the fluorescent signal is primarily derived from bound rather than free TMRE depending on experimental conditions.36 With respect to probes employed in this study, NAO fluorescent intensity may be in part dependent on ΔΨm.37–39 These prior studies demonstrate that use of high-dose pharmacological agents to depolarize mitochondria also reduces NAO fluorescent intensity. While we cannot exclude ΔΨm dependence of the NAO measurements in our study, these prior reports suggest that the difference in mitochondrial mass observed between non-diabetics and patients with diabetes in our study may actually be larger than we have observed using NAO to estimate mass.
JC-1 is widely used for qualitative estimates of ΔΨm. Use of this probe to estimate membrane potential can be challenging given dose sensitivity of mitochondrial specificity of green fluorescence.35, 40 However, three lines of evidence suggest JC-1 measurements using our protocol represent a reasonable semi-quantitative measurement of mitochondrial membrane potential. First, we identified appropriate per-nuclear cellular localization JC-1 (Figure 1). Second, our good reproducibility data suggest that, with our protocol, any non-specificity of monomeric JC-1 localization within a cell has limited effect on the variability of our measurements. This suggests our protocol supplies stable within-subjects cell loading concentrations of JC-1 to exposed mononuclear cells. Finally, our results are consistent with prior cell culture work showing mitochondrial hyperpolarization using JC-1 in the setting of hyperglycemia, adding to the validity of our measurements.41 While no probe for mitochondrial membrane potential measurement is without its limitations, including TMRE,42, 43 further verification of our membrane potential finding using a second mitochondrial-membrane potential sensitive fluorophore unrelated to JC-1 would help corroborate our findings.
Our study has several limitations. We did not measure glycosylated hemoglobin levels in our subjects. Future work looking at the relative effects of the acute glycemic milieu verses chronic glycemic control on our measurements of mitochondrial homeostasis will help discern the relative influences of these two exposures on these mitochondrial measurements. Due to the cross-sectional nature of this work, we cannot determine the relative causal contributions of impaired mitochondrial biogenesis, respiratory state ratio (state 3 vs. state 4) and hyperglycemia-induced fragmentation to our findings in patients with T2DM. Ethical considerations precluded our ability to study subjects withdrawn from their medications to determine their mitochondrial status in the absence of medications. Some of these medications, including metformin and HMG-CoA reductase inhibitors, may have relevant in vivo effects on mitochondria. The lowering LDL cholesterol concentrations in our T2DM population relative to non-diabetics is likely secondary to greater use of HMG-CoA reductase inhibitors by those with T2DM. The relative mitochondrial impact of medications on mitochondrial homeostasis will need to be further assessed. While JC-1's dependence on mitochondrial membrane potential is well-established, JC-1 aggregate formation can also be driven in part by mitochondrial volume. Given our finding of lower cell surface area of mitochondria in T2DM, it is conceivable a portion of our JC-1 findings may be secondary to lower mitochondrial volume in T2DM as suggested by our NAO studies and EM micrographs. Further studies manipulating the mitochondrial membrane potential while measuring mitochondrial superoxide production in both populations will be helpful to determine the relative contributions of differences in mitochondrial volume and membrane potential in our JC-1 observations. Balanced against these limitations are significant strengths including the novelty of establishing efficient and reproducible measurements of mitochondrial homeostasis in cells easily obtained by venipuncture and the application of this methodology to demonstrate potentially important differences in mitochondrial function and morphology between patients with T2DM and non-diabetics. These strengths underscore the potential of these measurements to be applied in future clinical research studies to better delineate the relevance of mitochondrial perturbations in type 2 diabetes and changes in mitochondrial function following interventions.
Conclusion
Our data demonstrate the ability to reliably estimate mitochondrial membrane potential and mass using available fluorescent probes. Further, using our measurements, we determined that relative mitochondrial hyperpolarization accompanies lower mitochondrial mass and significant alterations in mitochondrial morphology in circulating mononuclear cells from patients with T2DM relative to non-diabetic controls. These findings are consistent with prior cell culture and animal work, suggesting these differences may have important pathophysiological implications that merit further investigation.
Acknowledgements
The authors would like to thank Tom Christensen and Clive Wells for their technical help with obtaining electron microscopy images for this manuscript. Dr. Widlansky work is supported by K23HL089326 and a grant from Advancing a Healthier Wisconsin (5520119-9520094). This work was supported by the Clinical Translational Research Institute at the Medical College of Wisconsin and NIH grant HL081587. Drs. Kizhakekuttu and Wang are supported by a Ruth L. Kirschstein NIH T32 training grant (HL007792-15). Dr. Hagen is supported by AG017141 and AT002034 Dr. Gutterman is supported by HL094971 and HL080704. Dr. Vita is supported by HL083269, HL083801, HL081587, and HL75795. The authors also wish to acknowledge the help of David Baber, Carlyn Leahey, Roy Liu, and Jennifer Mulkerin for their work with fluorescence measurements reported in this study.
Abbreviations
- T2DM
Type 2 Diabetes
- FCCP
carbonyl cyanide-p-trifluoromethoxyphenylhydrazone
- JC-1
5,5',6,6'-tetrachloro-1,1'3,3'-tetraethylbenzamidazol-carboncyanine
- NAO
acridine orange 10-nonyl bromide
- NO
Nitric Oxide
- ROS
Reactive Oxygen Species
- ψm
Mitochondrial Membrane Potential
Footnotes
Publisher's Disclaimer: This is a PDF file of an unedited manuscript that has been accepted for publication. As a service to our customers we are providing this early version of the manuscript. The manuscript will undergo copyediting, typesetting, and review of the resulting proof before it is published in its final citable form. Please note that during the production process errors may be discovered which could affect the content, and all legal disclaimers that apply to the journal pertain.
Reference List
- (1).Brownlee M. Biochemistry and molecular cell biology of diabetic complications. Nature. 2001 December 13;414(6865):813–20. doi: 10.1038/414813a. [DOI] [PubMed] [Google Scholar]
- (2).Liuzzo G. Perturbation of the T-cell repertoire in patients with unstable angina. Circulation. 1999;100:2135–9. doi: 10.1161/01.cir.100.21.2135. [DOI] [PubMed] [Google Scholar]
- (3).Liuzzo G, Goronzy JJ, Yang H, et al. Monoclonal T-cell proliferation and plaque instability in acute coronary syndromes. Circulation. 2000 June 27;101(25):2883–8. doi: 10.1161/01.cir.101.25.2883. [DOI] [PubMed] [Google Scholar]
- (4).Berdowska A, Zwirska-Korczala K. Neopterin measurement in clinical diagnosis. J Clin Pharm Ther. 2001 October;26(5):319–29. doi: 10.1046/j.1365-2710.2001.00358.x. [DOI] [PubMed] [Google Scholar]
- (5).Libby P, Ridker PM, Maseri A. Inflammation and atherosclerosis. Circulation. 2002 March 5;105(9):1135–43. doi: 10.1161/hc0902.104353. [DOI] [PubMed] [Google Scholar]
- (6).Srinivasan S, Yeh M, Danziger EC, et al. Glucose regulates monocyte adhesion through endothelial production of interleukin-8. Circ Res. 2003 March 7;92(4):371–7. doi: 10.1161/01.RES.0000061714.74668.5C. [DOI] [PubMed] [Google Scholar]
- (7).Perl A, Gergely P., Jr. Nagy G, Koncz A, Banki K. Mitochondrial hyperpolarization: a checkpoint of T-cell life, death and autoimmunity. Trends Immunol. 2004 July;25(7):360–7. doi: 10.1016/j.it.2004.05.001. [DOI] [PMC free article] [PubMed] [Google Scholar]
- (8).Kim HS, Park KG, Koo TB, Huh S, Lee IK. The modulating effects of the overexpression of uncoupling protein 2 on the formation of reactive oxygen species in vascular cells. Diabetes Res Clin Pract. 2007 September;77(Suppl 1):S46–S48. doi: 10.1016/j.diabres.2007.01.032. [DOI] [PubMed] [Google Scholar]
- (9).Yoon Y. Regulation of mitochondrial dynamics: another process modulated by Ca2+ signals? Sci STKE. 2005 April 19;2005(280):e18. doi: 10.1126/stke.2802005pe18. [DOI] [PubMed] [Google Scholar]
- (10).Riva A, Tandler B, Loffredo F, Vazquez E, Hoppel C. Structural differences in two biochemically defined populations of cardiac mitochondria. Am J Physiol Heart Circ Physiol. 2005 August;289(2):H868–H872. doi: 10.1152/ajpheart.00866.2004. [DOI] [PubMed] [Google Scholar]
- (11).Morino K, Petersen KF, Dufour S, et al. Reduced mitochondrial density and increased IRS-1 serine phosphorylation in muscle of insulin-resistant offspring of type 2 diabetic parents. J Clin Invest. 2005 December;115(12):3587–93. doi: 10.1172/JCI25151. [DOI] [PMC free article] [PubMed] [Google Scholar]
- (12).Yu T, Robotham JL, Yoon Y. Increased production of reactive oxygen species in hyperglycemic conditions requires dynamic change of mitochondrial morphology. Proc Natl Acad Sci U S A. 2006 February 21;103(8):2653–8. doi: 10.1073/pnas.0511154103. [DOI] [PMC free article] [PubMed] [Google Scholar]
- (13).Lugli E, Troiano L, Cossarizza A. Polychromatic analysis of mitochondrial membrane potential using JC-1. Curr Protoc Cytom. 2007 July; doi: 10.1002/0471142956.cy0732s41. Chapter 7:Unit7. [DOI] [PubMed] [Google Scholar]
- (14).Genuth S, Alberti KG, Bennett P, et al. Follow-up report on the diagnosis of diabetes mellitus. Diabetes Care. 2003 November;26(11):3160–7. doi: 10.2337/diacare.26.11.3160. [DOI] [PubMed] [Google Scholar]
- (15).Alberti KG, Zimmet P, Shaw J. The metabolic syndrome--a new worldwide definition. Lancet. 2005 September 24;366(9491):1059–62. doi: 10.1016/S0140-6736(05)67402-8. [DOI] [PubMed] [Google Scholar]
- (16).Thygesen K, Alpert JS, White HD. Universal definition of myocardial infarction. J Am Coll Cardiol. 2007 November 27;50(22):2173–95. doi: 10.1016/j.jacc.2007.09.011. [DOI] [PubMed] [Google Scholar]
- (17).Smiley ST, Reers M, Mottola-Hartshorn C, et al. Intracellular heterogeneity in mitochondrial membrane potentials revealed by a J-aggregate-forming lipophilic cation JC-1. Proc Natl Acad Sci U S A. 1991 May 1;88(9):3671–5. doi: 10.1073/pnas.88.9.3671. [DOI] [PMC free article] [PubMed] [Google Scholar]
- (18).Lee HC, Yin PH, Lu CY, Chi CW, Wei YH. Increase of mitochondria and mitochondrial DNA in response to oxidative stress in human cells. Biochem J. 2000 June 1;348(Pt 2):425–32. [PMC free article] [PubMed] [Google Scholar]
- (19).Castedo M, Ferri K, Roumier T, Metivier D, Zamzami N, Kroemer G. Quantitation of mitochondrial alterations associated with apoptosis. J Immunol Methods. 2002 July 1;265(1–2):39–47. doi: 10.1016/s0022-1759(02)00069-8. [DOI] [PubMed] [Google Scholar]
- (20).Ross MF, Kelso GF, Blaikie FH, et al. Lipophilic triphenylphosphonium cations as tools in mitochondrial bioenergetics and free radical biology. Biochemistry (Mosc) 2005 February;70(2):222–30. doi: 10.1007/s10541-005-0104-5. [DOI] [PubMed] [Google Scholar]
- (21).Koopman WJ, Verkaart S, Visch HJ, et al. Inhibition of complex I of the electron transport chain causes O2-. -mediated mitochondrial outgrowth. Am J Physiol Cell Physiol. 2005 June;288(6):C1440–C1450. doi: 10.1152/ajpcell.00607.2004. [DOI] [PubMed] [Google Scholar]
- (22).Harris PA, Taylor R, Thielke R, Payne J, Gonzalez N, Conde JG. Research electronic data capture (REDCap)--a metadata-driven methodology and workflow process for providing translational research informatics support. J Biomed Inform. 2009 April;42(2):377–81. doi: 10.1016/j.jbi.2008.08.010. [DOI] [PMC free article] [PubMed] [Google Scholar]
- (23).Emre Y, Hurtaud C, Nubel T, Criscuolo F, Ricquier D, Cassard-Doulcier AM. Mitochondria contribute to LPS-induced MAPK activation via uncoupling protein UCP2 in macrophages. Biochem J. 2007 March 1;402(2):271–8. doi: 10.1042/BJ20061430. [DOI] [PMC free article] [PubMed] [Google Scholar]
- (24).Dworacka M, Winiarska H, Borowska M, Abramczyk M, Bobkiewicz-Kozlowska T, Dworacki G. Pro-atherogenic alterations in T-lymphocyte subpopulations related to acute hyperglycaemia in type 2 diabetic patients. Circ J. 2007 June;71(6):962–7. doi: 10.1253/circj.71.962. [DOI] [PubMed] [Google Scholar]
- (25).Stentz FB, Kitabchi AE. Hyperglycemia-induced activation of human T-lymphocytes with de novo emergence of insulin receptors and generation of reactive oxygen species. Biochem Biophys Res Commun. 2005 September 23;335(2):491–5. doi: 10.1016/j.bbrc.2005.07.109. [DOI] [PubMed] [Google Scholar]
- (26).Li PF, Dietz R, von HR. p53 regulates mitochondrial membrane potential through reactive oxygen species and induces cytochrome c-independent apoptosis blocked by Bcl-2. EMBO J. 1999 November 1;18(21):6027–36. doi: 10.1093/emboj/18.21.6027. [DOI] [PMC free article] [PubMed] [Google Scholar]
- (27).Gergely P, Jr., Niland B, Gonchoroff N, Pullmann R, Jr., Phillips PE, Perl A. Persistent mitochondrial hyperpolarization, increased reactive oxygen intermediate production, and cytoplasmic alkalinization characterize altered IL-10 signaling in patients with systemic lupus erythematosus. J Immunol. 2002 July 15;169(2):1092–101. doi: 10.4049/jimmunol.169.2.1092. [DOI] [PMC free article] [PubMed] [Google Scholar]
- (28).Suthanthiran M, Anderson ME, Sharma VK, Meister A. Glutathione regulates activation-dependent DNA synthesis in highly purified normal human T lymphocytes stimulated via the CD2 and CD3 antigens. Proc Natl Acad Sci U S A. 1990 May;87(9):3343–7. doi: 10.1073/pnas.87.9.3343. [DOI] [PMC free article] [PubMed] [Google Scholar]
- (29).Williams MD, Nadler JL. Inflammatory mechanisms of diabetic complications. Curr Diab Rep. 2007 June;7(3):242–8. doi: 10.1007/s11892-007-0038-y. [DOI] [PubMed] [Google Scholar]
- (30).Yaffe MP. The cutting edge of mitochondrial fusion. Nat Cell Biol. 2003 June;5(6):497–9. doi: 10.1038/ncb0603-497b. [DOI] [PubMed] [Google Scholar]
- (31).Chen H, Chomyn A, Chan DC. Disruption of fusion results in mitochondrial heterogeneity and dysfunction. J Biol Chem. 2005 July 15;280(28):26185–92. doi: 10.1074/jbc.M503062200. [DOI] [PubMed] [Google Scholar]
- (32).Ono T, Isobe K, Nakada K, Hayashi JI. Human cells are protected from mitochondrial dysfunction by complementation of DNA products in fused mitochondria. Nat Genet. 2001 July;28(3):272–5. doi: 10.1038/90116. [DOI] [PubMed] [Google Scholar]
- (33).Chicco AJ, Sparagna GC. Role of cardiolipin alterations in mitochondrial dysfunction and disease. Am J Physiol Cell Physiol. 2007 January;292(1):C33–C44. doi: 10.1152/ajpcell.00243.2006. [DOI] [PubMed] [Google Scholar]
- (34).Shigenaga MK, Hagen TM, Ames BN. Oxidative damage and mitochondrial decay in aging. Proc Natl Acad Sci USA. 1994;91:10771–8. doi: 10.1073/pnas.91.23.10771. [DOI] [PMC free article] [PubMed] [Google Scholar]
- (35).Bernardi P, Scorrano L, Colonna R, Petronilli V, Di LF. Mitochondria and cell death. Mechanistic aspects and methodological issues. Eur J Biochem. 1999 September;264(3):687–701. doi: 10.1046/j.1432-1327.1999.00725.x. [DOI] [PubMed] [Google Scholar]
- (36).Scaduto RC, Jr., Grotyohann LW. Measurement of mitochondrial membrane potential using fluorescent rhodamine derivatives. Biophys J. 1999 January;76(1 Pt 1):469–77. doi: 10.1016/S0006-3495(99)77214-0. [DOI] [PMC free article] [PubMed] [Google Scholar]
- (37).Keij JF, Bell-Prince C, Steinkamp JA. Staining of mitochondrial membranes with 10-nonyl acridine orange, MitoFluor Green, and MitoTracker Green is affected by mitochondrial membrane potential altering drugs. Cytometry. 2000 March 1;39(3):203–10. doi: 10.1002/(sici)1097-0320(20000301)39:3<203::aid-cyto5>3.0.co;2-z. [DOI] [PubMed] [Google Scholar]
- (38).Jacobson J, Duchen MR, Heales SJ. Intracellular distribution of the fluorescent dye nonyl acridine orange responds to the mitochondrial membrane potential: implications for assays of cardiolipin and mitochondrial mass. J Neurochem. 2002 July;82(2):224–33. doi: 10.1046/j.1471-4159.2002.00945.x. [DOI] [PubMed] [Google Scholar]
- (39).Garcia Fernandez MI, Ceccarelli D, Muscatello U. Use of the fluorescent dye 10-N-nonyl acridine orange in quantitative and location assays of cardiolipin: a study on different experimental models. Anal Biochem. 2004 May 15;328(2):174–80. doi: 10.1016/j.ab.2004.01.020. [DOI] [PubMed] [Google Scholar]
- (40).Reers M, Smith TW, Chen LB. J-aggregate formation of a carbocyanine as a quantitative fluorescent indicator of membrane potential. Biochemistry. 1991 May 7;30(18):4480–6. doi: 10.1021/bi00232a015. [DOI] [PubMed] [Google Scholar]
- (41).Du XL, Edelstein D, Dimmeler S, Ju Q, Sui C, Brownlee M. Hyperglycemia inhibits endothelial nitric oxide synthase activity by posttranslational modification at the Akt site. J Clin Invest. 2001 November;108(9):1341–8. doi: 10.1172/JCI11235. [DOI] [PMC free article] [PubMed] [Google Scholar]
- (42).Duchen MR, Leyssens A, Crompton M. Transient mitochondrial depolarizations reflect focal sarcoplasmic reticular calcium release in single rat cardiomyocytes. J Cell Biol. 1998 August 24;142(4):975–88. doi: 10.1083/jcb.142.4.975. [DOI] [PMC free article] [PubMed] [Google Scholar]
- (43).Bernardi P. Mitochondrial transport of cations: channels, exchangers, and permeability transition. Physiol Rev. 1999 October;79(4):1127–55. doi: 10.1152/physrev.1999.79.4.1127. [DOI] [PubMed] [Google Scholar]


