

Abstract
Ideal biomarkers of Alzheimer's disease should correlate with accepted measures of pathology in the cerebrospinal fluid (CSF); they should also correlate with, or predict, future clinical decline, and should be readily measured in hundreds to thousands of subjects. Here we explored the utility of automated 3D maps of the lateral ventricles as a possible biomarker of AD. We used our multi-atlas fluid image alignment (MAFIA) method, to compute ventricular models automatically, without user intervention, from 804 brain MRI scans with 184 AD, 391 MCI, and 229 healthy elderly controls (446 men/338 women; age: 75.50+/-6.81 [SD] years). Radial expansion of the ventricles, computed pointwise, was strongly correlated with current cognition, depression ratings, Hachinski Ischemic scores, language scores and with future clinical decline after controlling for any effects of age, sex, and educational level. In statistical maps ranked by effect sizes, ventricular differences were highly correlated with CSF measures of Aβ1-42, and correlated with ApoE4 genotype. These statistical maps are highly automated, and offer a promising biomarker of AD for large-scale studies.
1. Introduction
Alzheimer's disease (AD) is a degenerative brain disorder leading to irreversible neuronal loss and progressive cognitive decline, spreading from memory to all other cognitive domains, and eventually death (Selkoe et al., 2001). To test disease modifying drugs that may delay or resist disease progression, accurate measures of disease burden in the brain are vital, and multiple neuroimaging and CSF-based measures are currently being investigated. Cognitive assessments are notoriously variable over time, and there is increasing evidence that neuroimaging may provide accurate, reproducible measures of brain atrophy, that correlate with the underlying pathology (Whitwell et al., 2008), and with declining cognition (Jack et al., 2009;), and that predict future decline (Risacher et al., 2009). The additional ability to map disease effects in 3D using imaging has provided insights into the trajectory of the earlier phases of the disease, even before symptoms are detectable (Braskie et al., 2008). MRI-based volume measurements offer surrogate markers of disease progression even in preclinical AD (Jack et al., 2010; Frisoni et al., 2010).
Several methods have been used to quantify structural brain changes in MRI including: region-of-interest measures, such as hippocampal volumes or maps (Morra et al., 2008a,b), the “boundary shift integral” – a technique that quantifies differences between two successive co-registered 3D MRIs (Fox et al., 2001), and maps that localize atrophy, such as voxel-based morphometry (Whitwell et al., 2008), tensor-based morphometry (Ho et al, 2010c; Hua et al., 2009, 2010; Stein et al., 2010), and cortical thickness or gray matter density analyses (Thompson et al., 2003; Frisoni et al., 2007, 2009; Walhovd et al., 2010).
As noted in Weiner (2008), ventricular expansion correlates more strongly with changes on cognitive tests than medial temporal lobe (MTL) atrophy rates (Jack et al., 2004). Measuring ventricular geometry may seem like an unnecessarily indirect approach for assessing disease burden, when the pathology and atrophy are focused elsewhere. Even so, ventricular volume measures are relatively easy to measure and provide excellent sensitivity to disease effects and pre-clinical brain changes (Weiner, 2008). In addition, the ventricles can be measured more reliably than hippocampal or cortical structures, whose boundaries are difficult for experts to agree on. In 79 healthy elderly subjects examined annually for up to 15 consecutive years, ventricular volume expansion accelerated on average 2.3 years prior to the diagnosis of MCI (Carlson et al., 2008). In addition, abnormally fast ventricular dilation over time has been linked to the accumulation of AD pathology including cortical neurofibrillary tangles and amyloid plaques (Silbert et al., 2003), and to rates of cognitive decline in AD patients and controls (Adak et al., 2004).
There is great interest in determining which MRI-based measures link best with standard cognitive assessments (Jack et al., 2004) and which sets of measures can optimally predict future clinical decline (Kohannim et al., 2010; Walhovd et al., 2010), often defined as conversion to AD over a specific follow-up interval (Fleisher et al., 2008). Ventricular measures have been proposed as a useful biomarker of disease progression as they distinguish disease from normality with a high effect size (Carmichael et al., 2007). Here we used a high-throughput method, known as multi-atlas fluid image alignment (MAFIA; Chou et al., 2008), to create detailed surface-based maps of ventricular anatomy in 804 subjects, comparing groups of AD and MCI subjects to controls. Our goal was to determine, and rank, the clinical and pathological correlates of ventricular expansion, using detailed maps rather than simple volumetric summaries. Pinpointing where changes occur more precisely can give us a much better picture of the changes, while simultaneously increasing the chance that subtle, localized or non-uniform patterns of differences will be detected. Using maps of surface-based statistics, we created cumulative distribution function (CDF) plots to rank correlates in order of their effect size. We hypothesized that the correlates of ventricular expansion would be in the following order (from strongest to weakest): clinical scores, language deficits, CSF biomarkers, and then known risk factors such as ApoE genotype. To test this rank order, we investigated, at a pointwise level, how regional ventricular expansion correlated with baseline measures and future (1-year) changes in scores on the Mini-Mental State Exam (MMSE), global and sum-of-boxes Clinical Dementia Rating (CDR), Geriatric Depression Score (i.e., more severe depression), delayed logical memory test and Hachinski Ischemic scores. We hypothesized that the more general measures of cognition (MMSE, CDR) would correlate best with ventricular differences, but correlations would be lower for more specific measures (depression, delayed recall, Hachinski Ischemic), after statistically controlling for any effects of age, sex, and education. Second, we correlated ventricular differences with CSF-derived biomarkers of AD pathology including levels of tau protein (Tau), 181-phosphorylated tau protein (pTau181p), beta amyloid (Aβ1-42), Tau/Aβ1-42 and the pTau181p/Aβ1-42 ratio. Our goal was to establish a rank order to see which CSF biomarkers correlated best with ventricular differences detectable on MRI. Finally, we studied correlations between our ventricular maps and ApoE; we expected that ApoE risk gene carriers in all diagnostic groups, would show greater ventricular expansion.
We hypothesized that more general measures of cognition would correlate best with ventricular differences, and that tests of more specific cognitive subdomains would correlate more weakly. The reason for this hypothesis is that ventricular changes are a general indicator of atrophy occurring anywhere in the brain; patients with different patterns of strengths and weaknesses across several different cognitive domains may be experiencing somewhat different profiles of atrophy, although generally consistent with the expected pattern of early temporal atrophy in MCI and AD. As such we considered that no single cognitive domain would monitor all the systems where atrophy leads to ventricular expansion, but more general clinical assessments (such as MMSE, and CDR) might better reflect the overall level of impairment. This hypothesis is supported by our recent studies of atrophic rates over time in ADNI (Leow et al., 2009), where more general clinical measures (MMSE, CDR) correlated more strongly with atrophic rates, and more specific measures (memory tests or delayed recall subscales) correlated more weakly.
2. Materials and Methods
2.1 Subjects
Images were obtained from the Alzheimer's Disease Neuroimaging Initiative (ADNI) dataset (Mueller et al., 2005; Jack et al., 2008; http://www.loni.ucla.edu/ADNI/). The ADNI was launched in 2003 by the National Institute on Aging (NIA), the National Institute of Biomedical Imaging and Bioengineering (NIBIB), the Food and Drug Administration (FDA), private pharmaceutical companies and non-profit organizations, as a 5-year public-private partnership. The primary goal of ADNI has been to test whether serial MRI, PET, other biological markers, and clinical and neuropsychological assessments acquired in a multi site manner mirroring enrollment methods used in clinical trials, can replicate results from smaller single site studies measuring the progression of MCI and early AD. Determination of sensitive and specific markers of very early AD progression is intended to aid researchers and clinicians to develop new treatments and monitor their effectiveness, as well as lessen the time and cost of clinical trials. The Principal Investigator of this initiative is Michael W. Weiner, M.D., VA Medical Center and University of California, San Francisco.
In this study, we used the 804 available baseline MRI scans, including 184 AD patients (age: 76.1 ± 7.6 years), 391 amnestic MCI subjects (75.0 ± 7.3 years), and 229 healthy elderly controls (76.0 ± 5.0 years). All subjects underwent thorough clinical and cognitive assessment at the time of scan acquisition. As part of a thorough clinical/cognitive evaluation, each subject's mini-mental state examination (MMSE) score, and global and “sum-of-boxes” clinical dementia ratings (Morris et al., 1993), and Alzheimer's Disease Assessment Scale-cognitive subscale (ADAS-Cog) were assessed. Global CDR scores are discrete values of 0, 0.5, 1, 2, and 3, indicating no dementia, very mild, mild, moderate, and severe dementia. The sum-of-boxes CDR scores run from 0 to 18 in 0.5 intervals, (0 is no dementia; 18, very severe dementia). All AD patients met NINCDS/ADRDA criteria for probable AD (McKhann et al., 1984) with an MMSE score between 20 and 26, a global CDR of 0.5 or 1, and a sum-of-boxes CDR of 1.0-9.0. As such, these subjects would be considered as having mild, but not severe, AD. Hachinski ischemic scores were used in screening to differentiate vascular dementia from dementia of the Alzheimer type. Patients with a score of 7 or higher are more likely to have a vascular dementia. Detailed exclusion criteria, e.g., regarding concurrent use of psychoactive medications, may be found in the ADNI protocol (Mueller et al., 2005). Briefly, subjects were excluded if they had any serious neurological disease other than incipient AD, any history of brain lesions or head trauma, or psychoactive medication use (including antidepressants, neuroleptics, chronic anxiolytics or sedative hypnotics, etc.). Participants with a Geriatric Depression Scale score of 6 or higher were excluded from the study. We were nevertheless interested in any effects of mild depressive symptoms. Many reports link depression with subcortical atrophy, especially in the hippocampus, so subclinical effects may be related to anatomical changes. Table 1 summarizes demographic and clinical measures for all covariates tested here, including diagnosis e (normal, MCI, AD), education level, the mini-mental state exam (MMSE) (Folstein et al., 1975), global clinical dementia rating (CDR) (Morris, 1993), and sum-of-boxes CDR, change (over one year) in MMSE, change in global CDR, change in “sum-of-boxes” CDR, depression severity measured using the Geriatric Depression Scale (GDS; Yesavage et al., 1982), delayed logical change (in years), Hachinski Ischemic scores, and ADAS-Cog Tests.
Table 1.
Demographic and clinical scores are shown for all covariates examined. In columns 2-4, the first number shown is the mean score, and the number following it, in parentheses, is the standard deviation (SD).
| Normal | MCI | AD | |
|---|---|---|---|
| N | 229 | 391 | 184 |
| Men/Women | 118/111 | 255/136 | 93/91 |
| Age (years) | 75.99 (5.03) | 74.96 (7.28) | 76.05 (7.61) |
| Volume (L/R; mm3) | 29830(6235)/27307(5603) | 31971(7085)/29091(6513) | 34322(6602)/32018(6549) |
| MMSE | 29.11(1.00) | 26.99(1.77) | 23.2(2.0) |
| Global CDR | 0 (0) | 0.50 (0.03) | 0.74(0.25) |
| Sum-of-boxes CDR | 0.03 (0.12) | 1.60 (0.87) | 4.33(1.60) |
| Geriatric Depression Score | 0.83 (1.15) | 1.57 (1.37) | 1.65 (1.44) |
| Delayed Logical Memory | 12.98 (3.59) | 3.76 (2.69) | 1.22 (1.84) |
| Hachinski Ischemic Scale | 0.61 (0.68) | 0.59 (0.66) | 0.64 (0.72) |
| MMSE Change | 0 (1.36) | -0.68 (2.59) | -2.44 (4.14) |
| Global CDR Change | 0.01 (0.20) | 0.03 (0.20) | 0.23 (0.54) |
| Sum of Boxes CDR Change | -0.08 (0.98) | 0.69 (1.28) | 1.41 (2.55) |
| Geriatric Depression Change | 0.21(1.21) | 0.42 (1.76) | 0.12 (1.85) |
| Delayed Logical Memory Change | 0.35(3.68) | 0.54(3.47) | -0.29 (2.50) |
| Tau (pg/ml) | 69.66 (31.31) | 104.09 (61.24) | 118.96 (52.02) |
| Aβ1-42 (pg/ml) | 206.27 (54.07) | 161.63 (52.89) | 143.55 (40.49) |
| pTau181p (pg/ml) | 25.05 (14.72) | 35.71 (18.11) | 41.19(19.34) |
| Tau/ Aβ1-42 | 0.39 (0.27) | 0.76 (0.60) | 0.89 (0.44) |
| pTau181p/Aβ1-42 | 0.14 (0.13) | 0.26 (0.18) | 0.32 (0.18) |
| Education (years) | 16.02 (2.86) | 15.69 (3.04) | 14.55 (3.15) |
| ADAS-Cog: Word Recognition | 2.55 (2.30) | 4.62 (2.71) | 6.62 (2.97) |
| ADAS-Cog: Spoken Language | 0.02 (0.15) | 0.09 (0.34) | 0.33 (0.79) |
| ADAS-Cog: Word Finding | 0.10 (0.32) | 0.27 (0.58) | 0.56 (0.95) |
In addition, several biomarkers obtained from CSF were also included for assessing correlations, including beta amyloid 1-42 (Aβ1-42), tau protein (Tau), phosphorylated-tau protein 181 (pTau181p), the tau and Aβ1-42 ratio (Tau/Aβ1-42), and p-tau Aβ1-42 ratio (pTau181p/Aβ1-42). Biomarker measurements were performed by Drs. Leslie Shaw and John Trojanowski of the ADNI Biomarker Core at the University of Pennsylvania School of Medicine (using the Luminex platform and AlzBio3 immunoassay research use only reagents, Innogenetics, Ghent, Belgium as described in Shaw et al, 2009) which collects and banks biological samples (blood, urine and CSF) from all participating sites, and conducts studies of selected AD biomarkers, including apolipoprotein E (ApoE) genotype, isoprostanes, tau, Abeta, and homocysteine levels (Shaw et al., 2009). Table 1 shows summary statistics for the biomarker profiles of the AD, MCI and Normal study groups.
CSF is in direct contact with brain and thus may reflect brain-associated biochemical events better than any other biological fluid. CSF Aβ1-42, Tau and pTau181p are linked to AD-associated neuropathological changes, and they have been the most widely studied potential biomarkers for AD. CSF Aβ1-42 levels are consistently lower in AD (Motter et al. 1995), and can distinguish patients with mild AD from healthy controls with reasonable accuracy (Blennow and Hampel, 2003).
The ADAS-Cog is a structured scale that evaluates memory (word recall, word recognition), reasoning (following commands), language (naming, comprehension), orientation, ideational praxis (placing a letter in an envelope) and constructional praxis (copying geometric designs). Ratings of spoken language, language comprehension, word finding difficulty, and ability to remember test instructions are also obtained (Rosen et al., 1984).
2.2 Image acquisition and preprocessing
High-resolution T1-weighted scans were acquired on 1.5 Tesla MRI scanners from Siemens, Phillips, and General Electric Healthcare with the standard ADNI MRI protocol (Jack et al., 2008). Each subject was scanned with a sagittal 3D MP-RAGE sequence, with acquisition parameters: inversion time (TI)/repetition time (TR): 1000/2400 ms; flip angle: 8°; 24 cm field of view; 192×192×166 acquisition matrix, and a voxel size of 1.25×1.25×1.2 mm3. In plane, zero-filled reconstruction yielded a 256×256 matrix for a reconstructed voxel size of 0.9375×0.9375×1.2 mm3. Images were calibrated with phantom-based geometric corrections to ensure consistency among scans acquired at different sites (Gunter et al., 2006). Additional image corrections were also applied, to adjust for scanner- and session-specific calibration errors (detailed in Jack et al., 2008). In addition to the original uncorrected image files, images with all of these corrections already applied (GradWarp, B1, phantom scaling, and N3) are available to the general scientific community (at www.loni.ucla.edu/ADNI).
To adjust for global differences in brain positioning and scale, we spatially normalized all images to the ICBM-53 average brain template with a 9-parameter linear transformation using the Minctracc algorithm (Collins et al., 1994). Aligned images were resampled in an isotropic space of 2203 voxels with a final voxel size of 1 mm3. To equalize image intensities across subjects, registered scans were histogram-matched.
2.3 Automated Lateral Ventricle Segmentation and Shape Modeling
Lateral ventricular volumes were automatically estimated for all scans using the multi-atlas fluid image alignment (MAFIA) method that we recently validated (Chou et al., 2008, 2009), summarized in Figure 1. Briefly, a small subgroup of 6 images (2 AD, 2 MCI and 2 normal) were randomly chosen and the lateral ventricles were manually traced in contiguous coronal brain sections, following previously described criteria with established inter- and intra-rater reliability (Narr et al., 2001). Lateral ventricular surface models were converted into parametric meshes (we refer to these labeled images as ‘atlases’; Thompson et al., 1996). We fluidly registered each atlas and the embedded mesh models to all other subjects (Fig. 1(a)), treating the deforming image as a Navier-Stokes viscous fluid, guaranteeing a diffeomorphic mapping (i.e. a smooth one-to-one 3D deformation with no folds or holes). Fluid transforms were applied to the manually traced ventricular boundary using tri-linear interpolation, generating a propagated contour on the unlabeled images (Fig. 1(b)). Sets of points representing the tissue boundaries were resampled and made spatially uniform by stretching a regular rectangular grid (100 × 150 surface points) over each surface (Fig 1(c)). This scheme provides a means to convert dense systems of points, sampled during outlining, into fully parametric surfaces and allows homologous points from the ventricular surfaces could be matched between subjects. The scheme we used (detailed in Thompson et al., 2004) involves cutting the ventricles into 3 pieces (superior, temporal and occipital horns), as the branching structure of the ventricles makes it difficult to map the entire structure onto a single 2D domain. As such, the first coronal section in which the superior and temporal horns appear is used as a boundary between the 3 parts of the structure. Grid-points from corresponding surfaces were then matched across subjects to obtain group average parametric meshes (Fig 1(d)). For each surface model, a medial curve was defined as the line traced out by the centroid of the ventricular boundary (illustrated in Fig. 1(e); Thompson et al., 2000, 2004; see Styner et al., 2005, Cootes et al., 1994 and Yushkevich 2009 for related work on M-reps, Active Shape Models and continuous medial models, respectively). The medial curve was defined separately in each individual, before averaging the surfaces. The operations of averaging surfaces and defining the medial curve from a surface are not commutative, in the sense that a medial curve derived from an average surface would not be the same as the average of the medial curves derived from each individual. Because we were interested in measuring radial ventricular expansion in each individual, we computed these measures in each subject with reference to their own medial curve, but plotted the resulting statistics on the average surface for the groups being compared. The local radial size was defined as the radial distance between a boundary point and its associated medial curve (Fig 1(f)). This allows statistical comparisons of local surface contractions and expansions at equivalent surface locations between groups in 3D.
Figure 1.
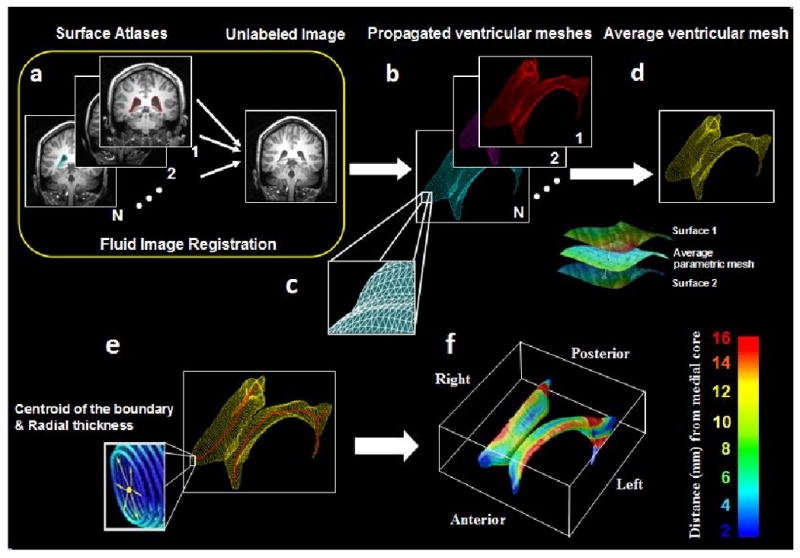
Mapping surface meshes into new subjects' scans via fluid registration. (a) N image volumes (subsequently called atlases) are randomly selected from the sample and the lateral ventricles are manually traced and converted into surface mesh models. (b) N new ventricular models are then produced by fluid registration of each image volume to a different atlas. (c) Surface points are converted into 3D parametric surface meshes composed of spatially uniform triangular tiles. (d) The N surface meshes are integrated by simple mesh averaging for each individual subject. (e) Medial curves (red) are extracted, and the radial distance of each ventricular boundary point to a medial curve may be interpreted as a local thickness. (f) These distance measures are then averaged across subjects at each boundary point and plotted in color to produce a regional measure of radial expansion or contraction of the ventricles.
By integrating multiple propagated labels, random digitization errors from each hand-traced segmentation are significantly reduced. The resulting average model is also robust to inaccuracies in individual registrations that may occur when non-global minima of the intensity-based cost function are reached. In addition, increasing the number of labeled atlases N resulted in an asymptotic decrease in both the average symmetric Hausdorff error and mean 2-norm between manually and automatically extracted models. To determine the optimal value of N, we performed 2-tailed t tests to see by how much Hausdorff errors fell when adding an additional atlas. By comparing composite segmentations from N-1 and N atlases, we picked N such that N+1 gave no additional improvement - values of N>4 did not detectably increase the power. Even so, in this study, we picked 6 atlases rather than 4 (2 from AD, 2 from and 2 from normals) to balance the groups – avoiding bias towards segmenting AD, MCI or normals.
2.4 Statistical Maps and Analysis
At each surface point, a correlation was run to compare diagnostic groups and determine the association of diagnosis or clinical scores with atrophy, as measured by differences in radial distance. In all maps shown, we used a multiple regression model to adjust for age, sex and educational level. P-values describing the uncorrected significance of these statistics were plotted onto the average surface model, as a color-coded map. This step provides a 3-D visualization of the point-wise significance level. All correlation maps were corrected for multiple comparisons using the widely-used false discovery rate method (FDR. The FDR method decides whether a threshold can be assigned to the statistical map (of correlations) that keeps the expected false discovery rate below 5% (i.e., no more than 5% of the voxels are false positive findings). This threshold is based on the expected proportion of voxels with statistics exceeding any given threshold under the null hypothesis.
To rank which clinical measures and CSF biomarkers were most strongly associated with ventricular morphology, we created cumulative distribution function (CDF) plots of the resulting uncorrected p-values (as in a conventional false discovery rate analysis). The x value at which the CDF plot intersects the y = 20x line represents the highest statistical threshold that can be applied to the data, for which at most 5% false positives are expected in the map. The use of the y=20x line is related to the fact that significance is declared when the volume of suprathreshold statistics is more than 20 times that expected under the null hypothesis. If there is no such intersection point (other than the origin), there is no evidence to reject the null hypothesis. Our empirical CDFs of p-values are the flip of the more common FDR PP plot; steeper CDFs show stronger effect sizes. We have used this procedure to study statistical maps in several prior papers (Morra et al., 2008b; Hua et al., 2008a).
3. Results
3.1 Linking Ventricular Morphology and Clinical Characteristics
At each surface point, correlations were assessed for each group between the radial distances (local ventricular expansion) and several clinical measures at baseline. The resulting statistical maps (Figure 2) show widespread expansion of ventricular spaces in AD compared to controls (p= 0.0492, FDR corrected), and a more restricted pattern of expansion in MCI (p=0.0367, FDR corrected). Figure 2 shows that all clinical measures were significantly associated with ventricular expansion, including lower MMSE (p=0.0488, FDR corrected), higher Global CDR (p=0.0489, FDR corrected), higher sum-of-boxes CDR (p=0.0494, FDR corrected), higher Geriatric Depression Scores (p=0.0220, FDR corrected), lower delayed logical memory scores (p=0.0480, FDR corrected) and higher Hachinski Ischemic scores (p=0.0007, FDR corrected). When these measures were ranked by how strongly each correlated with ventricular expansion, the global clinical scores (MMSE, CDR) and delayed recall memory scores were significantly correlated over 96-99% of the ventricular surface (N=781). The partial correlation coefficients (r-maps) were shown in Figure 3. Figure 6 shows CDFs for the significance maps, and the proportion of the surface is shown where associations are detected with each clinical scores. Depression ratings and Hachinski Ischemic scores were more weakly correlated, with significant correlations detected over 44% and 1%, respectively of the ventricular surface (N=781). With enough subjects, correlations with all measures would most likely be detectable over the entire surface.
Figure 2.
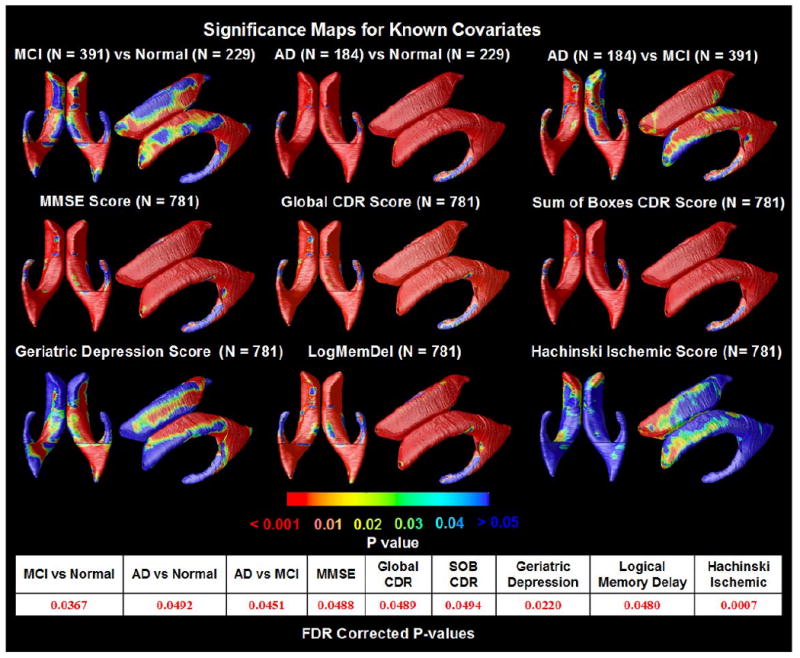
Significance maps for correlations between local ventricular enlargement and (1) diagnosis (MCI vs. normal, AD vs. normal and AD vs. MCI); (2) cognitive scores (MMSE, Global CDR, and Sum of Boxes CDR); (3) Geriatric Depression scores; (4) Logical Memory Delayed Recall scores and (5) Hachinski Ischemic scores, adjusting for age, sex and educational level. The bottom panel shows the FDR-corrected p-values for each map; these are all highly significant, partly due to the very large sample sizes. Depression scores are linked with ventricular differences in several regions affected in MCI.
Figure 3.
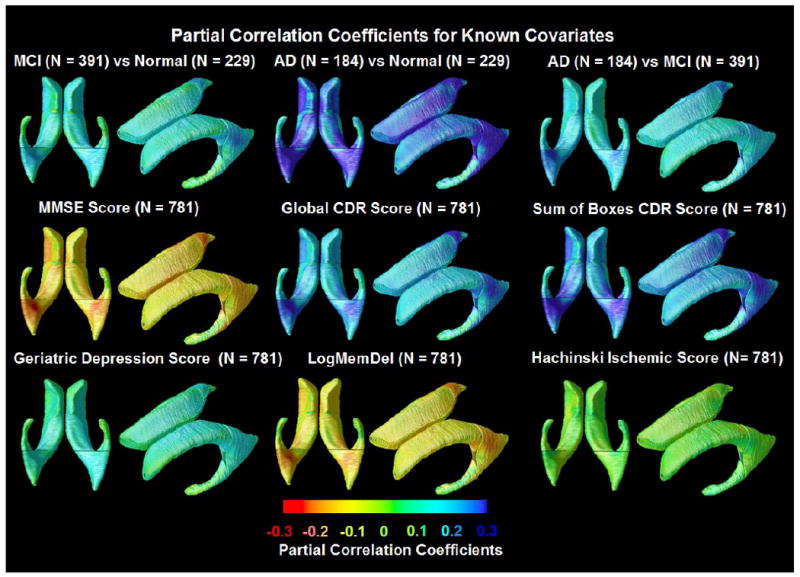
Partial correlation coefficients (r-maps) for the 3 diagnostic comparisons, showing the strength of association between radial ventricular size and diagnosis, as well as with cognitive and clinical scores. The correlations in the MMSE and Delayed Logical Memory map are negative (red colors) because a higher MMSE and Delayed Logical Memory score is associated with less degeneration (opposite to all the other ones). These maps are visually in very strong agreement with the corresponding p-maps, and so they are not shown for the other covariates.
Figure 6.
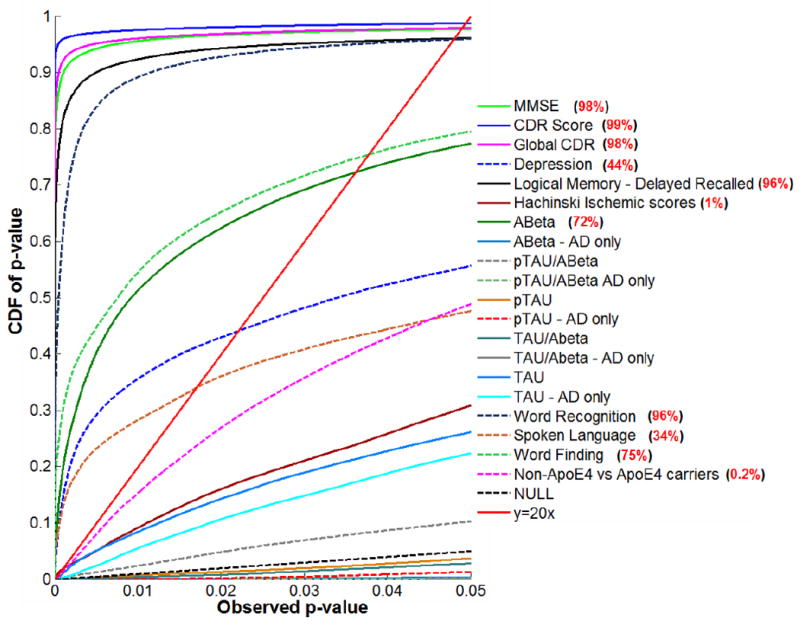
Cumulative Distribution Functions (CDFs) for significance maps associating ventricular enlargement with clinical measures and CSF biomarkers. Red values (right) show the percentage of the maps with significant correlations, when a threshold is applied to control the false discovery rate at 5%. This threshold (the highest one that controls the FDR at 5%) is sometimes called the critical P-value. At that critical P-value, the volume of suprathreshold statistics is more than 20 times that expected under null-hypothesis, and can as high as 100% if every surface location shows correlations with the clinical or pathological measure (Chou, et al., 2009b, Hua, et al., 2009, Hua, et al., 2008a, Morra, et al., 2009). A-Beta shows strong correlations with ventricular size (72% of the surface shows correlations), while correlations with other CSF biomarkers were not detectable. By contrast, all cognitive measures correlated very highly with ventricular expansion, with more specific clinical ratings (such as depression and Hachinski Ischemic scores) showing slightly less effect sizes than more general clinical ratings (such as MMSE and CDR; 98-99% of the ventricular surface was correlated with these measures). Also, ApoE4 genotype and the ADAS-Cog tests including word recognition, spoken language and word finding all correlated with ventricular expansion.
3.2 Correlations of Ventricular Morphology with CSF Biomarkers
We also investigated whether these cross-sectional measures of lateral ventricular expansion were correlated with CSF biomarker levels, in order to rank the biomarkers in order of how strong these correlations are. In a pilot study with a sample only one-third this size, we found correlations with Aβ1-42 but not with measures of Tau, so we were keen to see if expanding the sample 3-fold would allow us to pick up correlations Tau. In the maps (Figure 4(a)), correlations were significant between ventricular expansion and lower Aβ1-42 protein levels in the pooled data (Figure 4(a); entire sample of all AD, MCI and normal subjects; p=0.0361, FDR corrected).
Figure 4.
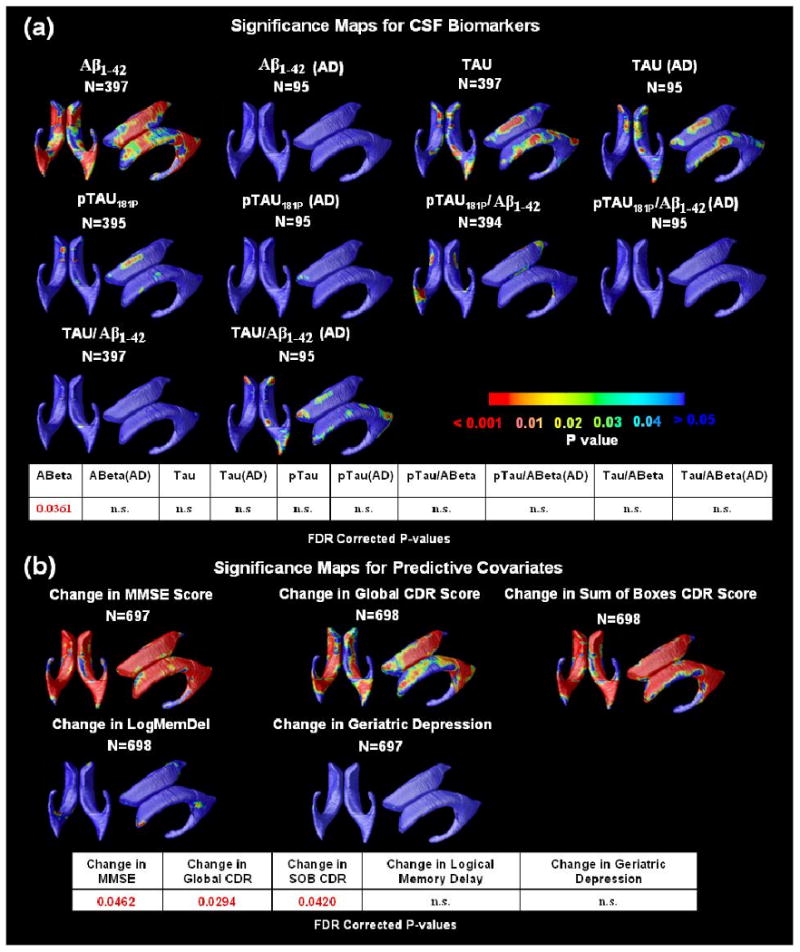
(a) Correlations between local ventricular enlargement and CSF biomarker levels, including Aβ1-42, pTau181p, Tau, and ratios of Tau/Aβ1-42 and pTau/Aβ1-42 in the pooled data and within the AD group. The bottom panel shows the FDR corrected p-values (critical p-values) for these maps. The critical p-value is the highest threshold that can be applied to the statistical map while keeping the false discovery rate below 5%. Correlations detected on one side only probably reflect limited power to detect a small effect size on both sides; it is unlikely that these maps show any true laterality (other than the fact that the left occipital horn is about 5 mm longer, on average), as ventricular expansion on both sides is highly correlated. n.s. means not significant. (b) Significance maps show regions where differences in baseline ventricular anatomy are associated with subsequent decline, over the following year, in 3 commonly used clinical scores with the control for age, sex and educational level. As hypothesized, ventricular expansion is a better index of future changes in global cognition function than changes in more specific cognitive domains, which likely depend on the integrity of specific cortical and hippocampal regions (e.g., the cingulate for apathy, etc.). The bottom panel shows the FDR-corrected p-values for these maps.
3.3 Predicting Future Cognitive Change
One goal of ADNI is to determine which brain imaging measures predict future clinical decline, primarily for “enrichment”, a statistical strategy to empower drug trials by selecting those most likely to show imminent cognitive decline (see e.g., Kohannim et al., 2010). Subjects who returned for 1-year follow-up were evaluated for any change in clinical diagnosis. Figure 4(b) reveals regions where ventricular expansion at baseline correlated with subsequent clinical changes over 1 year; baseline maps were significant overall, after correcting for multiple comparisons, for predicting future changes in MMSE (p=0.0462, FDR corrected), global CDR (p=0.0294, FDR corrected) and sum-of-boxes CDR scores (p=0.0420, FDR corrected). Again, the rank order of these maps is of interest. Baseline ventricular anatomy was a very good predictor of changes in the global clinical scores (MMSE, CDR). For delayed recall memory scores, which correlated strongly with ventricular anatomy at baseline, there was a detectable correlation only on the right, suggesting a weaker (but significant) association. For depression ratings, which correlated significantly with ventricular anatomy at baseline (but less strongly than delayed recall memory scores did), there was no association between changes in these scores and baseline ventricular anatomy, even in 698 subjects. Atrophy in more specialized structures is more likely to be associated with changes in these scores.
3.4 Influence of Genetic Variants
There is great interest in whether common variants of the ApoE gene influence brain structure, as they are known to affect the risk that a person will develop AD in the future (Corder, et al., 1993). Table 2 summarizes the genotype frequencies for the ADNI subjects examined here. In the AD group, approximately 64% of the subjects carried one or two copies of the ApoE4 gene (each copy confers increased risk for AD). The frequency of ApoE4 was around 54% in the MCI group, and only 27% in the normal group. In contrast, carriers of the ApoE2 gene (with genotypes ε2/ε2 and ε2/ε3) were mainly found in the normal group. Around 15% of normal subjects carried a copy of the ε2 allele, most of whom are ε2/ε3 (ε2/ε2 and ε2/ε4 are rare, occurring in only ∼2% of normal subjects). To investigate how ApoE genotype affects the shape of lateral ventricles, we created groups for each diagnosis, categorized by their different combinations of ApoE alleles. Carriers of an ApoE2 gene (which confers lower risk for AD than that of the general population) or an ApoE4 gene (with greater risk for AD versus the general population) were compared with homozygous ApoE3, the commonest genotype (Corder et al., 1993).
Table 2. Frequency of ApoE genotypes in the AD, MCI and Normal groups.
| AD (n = 172) | MCI (n = 383) | Normal (n = 226) | ||||
|---|---|---|---|---|---|---|
| N | % | N | % | N | % | |
| ε2/ε2 | 0 | 0.0 | 0 | 0.0 | 2 | 0.9 |
| ε2/ε3 | 4 | 2.3 | 16 | 4.2 | 30 | 13.3 |
| ε2/ε4 | 3 | 1.7 | 9 | 2.3 | 3 | 1.3 |
| ε3/ε3 | 57 | 33.1 | 161 | 42 | 134 | 59.3 |
| ε3/ε4 | 77 | 44.8 | 151 | 39.4 | 52 | 23 |
| ε4/ε4 | 31 | 18 | 46 | 12 | 5 | 2.2 |
As shown in Figure 5(a), ApoE4 carriers versus non- carriers versus showed weak but significant differences in ventricular anatomy. In healthy subjects, the presence of ApoE2 was associated with reduced CSF volume on the anterior ventricular horn, when compared with homozygous ApoE3 carriers. If true, this may support the hypothesis that this genotype has a protective effect.
Figure 5.
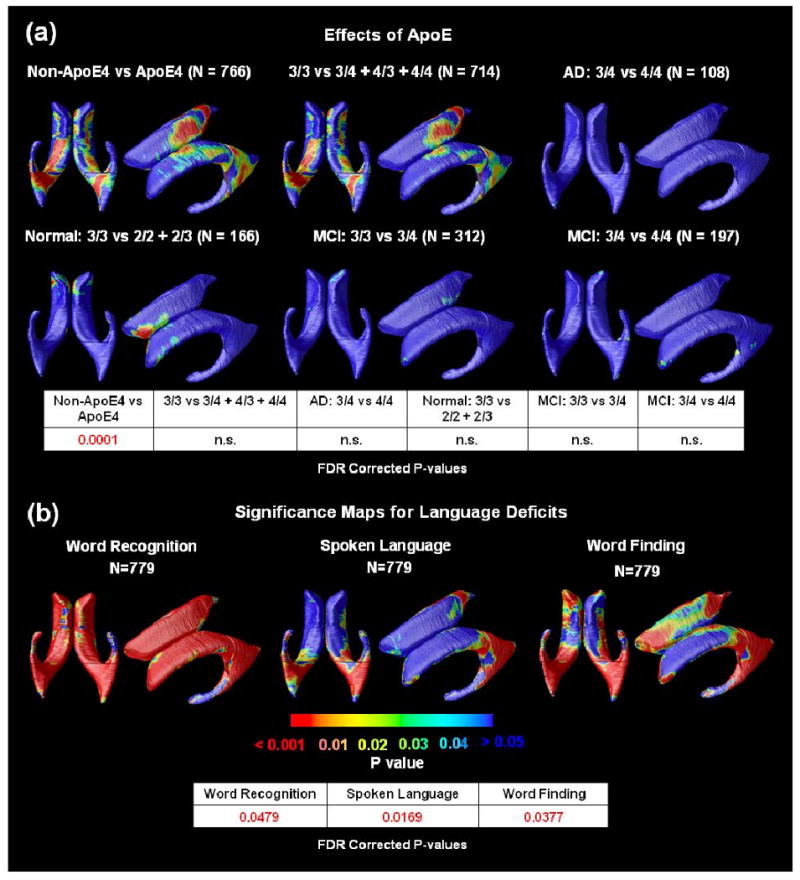
(a)Significance maps for correlations between local ventricular enlargement and ApoE genotype. The bottom panel shows FDR corrected p-values (critical p-values) for these maps; n.s. means not significant. ApoE4 carriers versus non-carriers showed weak but significant differences. (b)Significance maps show the strength of association between radial ventricular size and ADAS-Cog tests, including word recognition, spoken language and word finding. The bottom panel shows the FDR corrected p-values for these maps. Associations were detected for all three ADAS-Cog tests.
3.5 Correlations of Ventricular Morphology with Language Scores
As shown in Figure 5(b), significant associations were found for the linguistic aspects of the ADAS-Cog tests, including word recognition, spoken language and word finding performance, with FDR corrected p-values 0.0479, 00169 and 0.0377, respectively. The correlations with ventricular anatomy were strongest for word recognition, followed by word finding, and weakest (but still detectable) for spoken language.
3.6 Ranking the Effect Size of Different Covariates of Interest
Cumulative distribution curves (Figure 6) show the relative effect sizes for associations between ventricular expansion and different pathological markers and clinical scores. Curves that rise more sharply at the origin denote statistical maps with greater effect sizes, and those curves that intersect the line y=20x at points other than the origin, pass the conventional criterion for controlling the false discovery rate (FDR) at an expected rate of 5%, and are regarded, by convention, as significant after multiple comparisons correction. This approach ranks the effect sizes of different covariates of interest: FDR was controlled when showing 98% of the surface for MMSE, 99% for the sum-of-boxes CDR score, 98% for the global CDR score, 44% for the Geriatric Depression Score, 96% for delayed logical memory scores, 72% for Aβ1-42, 96% for word recognition, 75% for word finding and 34% for spoken language but only 1% for Hachinski Ischemic scores and 0.1% for ApoE4 carriers versus non-carriers.
4. Discussion
In one of the largest MRI studies to date, we determined the correlates of ventricular enlargement in AD and MCI and ranked them in order of effect size. We found that ventricular enlargement (1) correlates with cognitive impairment (measured using MMSE, global and sum-of-boxes Clinical Dementia Rating, Geriatric Depression, delayed logical memory test and Hachinski Ischemic scores), (2) correlates strongly with lower levels of CSF Aβ1-42 but not with CSF Tau (after adjusting for age, sex and educational level), (3) predicts future cognitive decline (in MMSE, global and sum-of-boxes Clinical Dementia Rating), in all of the AD, MCI, and normal groups (4) ApoE4 carriers versus non-carriers, and (5) ADAS-Cog (tests including word recognition, spoken language and word finding).
One notable aspect of this cohort is that ApoE4 carriers are somewhat over-represented relative to other studies. As noted in Table 2, approximately 64% the AD group, 54% in the MCI group, and 27% of the normal group carried one or two copies of the ApoE4 gene (each copy confers increased risk for AD). In a related study (Ho et al., 2010, in press), we compared the level of brain atrophy in 587 ADNI subjects with that of another cohort of 113 MCI and AD subjects from the Cardiovascular Health Study-Cognition Study (CHS-CS; see Lopez et al., 2003, Raji et al., 2010, and Ho et al., 2010, for details of the CHS-CS study). The atrophic pattern in MCI and AD was consistent in both ADNI and CHS populations, but the percentage of patients carrying the ApoE4 genetic variant was much higher in ADNI compared to CHS for both AD (ADNI=67.0% versus CHS=23.3%; X21 = 18.8, P-value=1.5 × 10⁻⁵) and MCI subject groups (ADNI=54.6% versus CHS=27.5%; X21 = 16.0, P-value= 6.5 × 10⁻⁵); these numbers differ very slightly from the figures reported in this paper, as Ho et al. (2010) examined only 587 of the full cohort of 804 ADNI subjects assessed here). Differences in the prevalence of ApoE4 may be due to the fact that ADNI assesses a referral clinic-based population rather than a population-based community cohort (as is the case for the CHS study). There is some evidence that the referral-based cohort, ADNI, may include subjects with more severe symptoms of AD at an earlier age (Ho et al., 2010), suggesting that even larger studies comparing ADNI data with other cohorts may be useful.
In a subsequent pilot ADNI study (N=240; Chou et al., 2009), we attempted to correlate ventricular morphology with ApoE genotype and found no effects (in 115 carriers versus 122 non-carriers), supporting the argument above. However, we were concerned that the sample was too small to detect subtle associations so here we used a sample size almost three times greater, and still found no effect. Even so, the expanded dataset allowed us to detect significant differences between MCI and normal, and to rank a large range of influential covariates according to their effect sizes.
When we correlated baseline ventricular morphology with subsequent changes over 1 year, in MMSE, global CDR and sum-of-boxes CDR scores, all maps were highly significant. This is a useful observation, as it shows that all regions of the ventricles, not just selective regions, have characteristic expansion that predicts future decline. Even so, this correlation is to be expected, as subjects who are more impaired at baseline are more likely to have future cognitive decline than subjects who are less impaired. In other words, cognitive impairment measured by MMSE, global CDR or sum-of-boxes CDR scores, predicts (or correlates with) future decline in the same measures. Furthermore, the ApoE4 gene and increasing age are risk factors for developing AD, so that in any sufficiently large group of controls, MCI, or AD subjects, the ApoE4 gene (and age) will also correlate with future cognitive decline.
The failure to detect a correlation between Tau measures and ventricular morphology does not mean that there is no such association, and the effects in the maps are borderline. In Figure 4(a), ventricular expansion correlates well with A-beta levels in the CSF, and somewhat less well with Tau effects after controlling for age sex and educational level, but visual inspection of the maps in the full sample of 397 subjects shows that the A-beta effects are quite robust, and the Tau effects are also formally significant but cover less of the ventricular surface. This suggests that either the effects are more anatomically selective for Tau, or, more likely, they have weaker effect sizes across the entire surface and so do not pass the significance threshold in so many places on the surface. Due to a peculiarity of the false discovery rate method, a map is only declared significant overall if there is some statistical threshold (called the critical P value) that can be applied to the map, that successfully controls the proportion of false positives in the map to be no more than 5%. This criterion is satisfied for Tau uncontrolled for age, sex and educational level, but only just, as the critical P value is very low (0.0029). In FDR, perhaps confusingly, low critical P values denote weaker effects than higher critical P values, as a low critical P value means that only stringent statistical thresholds can control the false discovery rate (if a high threshold controls the false discovery rate, generally all lower ones do). When the Tau effects are controlled for age, sex and educational level (Figure 4(a)), the map is not much different from the uncorrected map, but it is marginally weaker and just falls below the threshold for FDR, so is declared not significant. The most reasonable interpretation is that Tau effects are not as robust as those of A-beta, which pass the FDR threshold easily (the critical P value is 0.0361 in Figure 4(a), showing that much of the surface shows a detectable effect). Most likely, if the sample size were expanded, both effects would be robustly detected. This scenario has been noted in other papers relating CSF biomarkers to morphometry. Weak correlations are detected in some studies but not others. Any null findings do not necessarily imply that the biomarkers are not causally related (as both are sensitive to the ongoing progression of AD, but the CSF markers tend to fluctuate over time).
In this study, we chose to analyze a radial distance measure (i.e., distance from a central curve threading down the hippocampus) instead of a surface distance measure, i.e., the distance from one surface to another. In very early work (Thompson et al., 1996, 1997), we did in fact quantify differences in anatomy using a distance between the surface mesh points across subjects after aligning all the subjects' brains to a standard coordinate system. This can be useful, and a series of early computational anatomy papers focused on modeling the mesh displacements as chi-squared or Hotelling's T-squared distributed random fields (Thompson and Toga, 1997). Even so, a limitation of the surface displacement measure is that the relative shifting of the surfaces in stereotaxic space can be due to atrophy occurring elsewhere in the brain. This means that effects mapped on the surfaces may be disease-related but may not be occurring in the structure modeled. Subsequently, we switched to a method based on fitting a central line down the medial axis of the structure (as in related work by Yushkevich et al., 2009, Styner et al., 2005, Gerig et al., 2001, Pizer et al., 2003, Bansal et al., 2000 and many other authors). This has the advantage that the distances to this central line do reflect atrophy that is intrinsic to the structure – the resulting atrophy measures would not be altered by a shifting of the structure in stereotaxic space. Alternatively, surface invariants may be used (Gutman et al., 2009), although they do not provide spatial detail on the pattern of effects. Radial distance maps have been used in over 30 studies and occasionally allow better group discrimination than simple volumetric measures, although both measures are useful. Alternatively, it is possible to analyze parcellated subvolumes, but again they provide less spatial detail on the pattern of effects. For a very detailed comparison of many different surface metrics for disease discrimination, please see Wang et al. (2010).
Also, the computation of group anatomical differences relies on a computed correspondence derived from a surface-based parameterization method that stretches a grid over the surfaces. Even so, stretching a grid over the surface does not mean that the points match up either anatomically or in the best possible geometric way. Ongoing research in computational anatomy is focusing on how to align features within surfaces to provide higher order correspondences between regions that may correspond across subjects. This may lead to the reinforcement and better detection of systematic effects, especially when differentiated cellular fields lie within surfaces (Zeineh et al., 2001). Current work on surface reparameterization includes alignment of explicitly identified internal landmarks that lie within the surfaces (Thompson et al., 2004; Durrleman et al., 2008), and alignment of curvature fields or other differential geometric features such as Riemannian structures using flows within surfaces (Lui et al., 2010). Active work is focusing on which method boosts power the most for detecting statistical effects on brain structure (Wang et al., 2010).
The maps reported here assessed residual anatomical differences after an initial 9-parameter global scaling of all AD, MCI, and control subjects' images to match an anatomical template. This scaling was performed in the automated registration step, and, in our cohort, the degrees of scaling (mean global expansion factors) for groups of controls, MCI and AD patients were 1.020 (SD=0.031), 1.019 (0.031) and 1.018 (0.026) respectively, and there was no significant difference among the three groups (single factor ANOVA p-value=0.773). As such, we did not adjust for group differences in overall brain scaling in our analyses, as no such differences were detected.
In general, our studies of ventricular differences show bilateral statistical effects if they show effects at all, and only occasionally, when effects are borderline, effects are picked up on one side but not the other. There are some natural asymmetries in the anatomy of the ventricles: the occipital horn extends around 5 mm further back on the left than the right. This asymmetry, which is present in most but not all subjects, emerges early in embryonic development due to the tendency for the perisylvian language areas, such as the planum temporale, to expand more in the left hemisphere. This expansion has a mild but systematic torquing effect on subcortical anatomy. One limitation of this study is that we did not test relationships between the degree of ventricular asymmetry and cognitive decline; this is because the primary biological process of atrophy is pervasive in both hemispheres. As such, we do not expect there to be strong hemispheric differences in the relation between ventricular expansion and cognitive decline.
It is interesting to determine the possible contribution of vascular disease burden to the ventricular expansion noted here, especially in the light of recent reports that the level of atrophy in elderly normals is associated with cardiovascular risk factors such as high body mass index (Raji et al., 2010) and carrying the obesity risk gene, FTO (Ho et al., 2010). Salerno et al. (1992) and others have argued that otherwise healthy, but hypertensive elderly subjects have significantly larger mean ventricular volumes. In our study, however, the Hachinski ischemic scale showed no significant differences among the three diagnostic groups (single factor ANOVA p-value=0.717), suggesting that vascular burden is unlikely to be the primary contributor to the effects. Even so, subtle vascular insufficiencies may contribute to neuronal atrophy and may not be readily detectable on T1- or T2-weighted MRI. In a recent study of obesity and brain structure in an independent sample (Raji et al., 2010), the effects of body mass index on brain atrophy were quite strong, but could not be explained by conventional measures of white matter vascular burden, such as the volume of white matter hyperintensities on T2-weighted MRI. It is therefore possible that the ventricular expansion seen here is somewhat independent of vascular disease burden, or that microvascular damage may contribute to it but occurs at a finer anatomical scale than is readily detectable on T1- or T2-weighted MRI.
In this paper, we report correlations between atrophy and cognitive or CSF-derived measures in the pooled ADNI sample (combining patients with AD, MCI and controls), yet we also report other correlations within groups split by diagnosis (“disaggregated” analyses). Both types of analysis are complementary, and each has limitations. When analyzing a mixed cohort of subjects with AD, MCI, and controls, it is important to determine (1) the cognitive correlates of atrophy in the entire study, and (2) whether the chosen biomarker of disease burden is linked with decline across the full spectrum of controls, MCI, and AD subjects. As the whole cohort is arguably a continuum, it is vital to look beyond the diagnostic categories and see if the level of atrophy seen is related to function, and if so, which functional scores it relates to. This same correlation may be missed if it is assessed within one group only (e.g., MCI) due to a “restricted range” effect. Similarly, true correlations may be missed if the range of cognitive performance is restricted to include only healthy normal subjects. Furthermore, it is a fallacy to pre-select a diagnostic group based partly on cognitive domains, and then later test if a correlation is maintained with a cognitive subscale that is correlated with tests used to select the group. By running split analyses only, many important correlations will be missed. For instance, the level of brain atrophy correlates well with CSF-derived measures of pathology across the continuum from aging to MCI to AD. But if one sub-selects a group such as MCI, or a group of subjects with a very narrow range of disease burden, it is possible that no such correlation will be detected, due to the restricted range. If groupings are made based on the measure whose correlation is being tested, results may be uninterpretable. If the selection criterion for the group correlates with the variable of interest, nearly all the maps would be false negatives due to the truncated range.
Pooled analyses also have limitations. First, correlations with cognitive scores in a pooled cohort will tend to show similar patterns to a direct comparison of AD and healthy controls, if the cognitive measures are correlated with diagnosis. Second, if correlation analyses are performed across the full diagnostic continuum in a pooled cohort such as ADNI, then any correlations detected may depend somewhat on the proportion of subjects with each diagnosis - in ADNI, this is approximately 1:2:1 for AD:MCI:controls. In other words, part of the range of cognitive decline may be over-sampled. In ADNI, the over-sampling of MCI is deliberate, but it may not reflect a representative sampling of all subjects of a certain age. As such, any correlations with the atrophy in ADNI may not be detected in the same degree in other population studies with different proportions of subjects, or within diagnostic subcategories. For that reason, both pooled and split analyses have value for understanding the cognitive and pathological correlates of atrophy.
In summary, we examined the clinical and pathological correlates of ventricular expansion, in a very large sample of AD, MCI and healthy subjects. Although the ventricles are not the site of pathology deposition, and are at best an indirect measure of brain atrophy, they are nevertheless easier to measure than hippocampal and cortical structures, due to their high contrast on standard MRI. The resulting maps and measures show promise as a biomarker of AD, and provide a useful measure for combination with other more direct measures of pathology or neuronal loss.
Acknowledgments
Data collection and sharing for this project was funded by the Alzheimer's Disease Neuroimaging Initiative (ADNI) (National Institutes of Health Grant U01 AG024904). ADNI is funded by the National Institute on Aging, the National Institute of Biomedical Imaging and Bioengineering, and through generous contributions from the following: Abbott, AstraZeneca AB, Bayer Schering Pharma AG, Bristol-Myers Squibb, Eisai Global Clinical Development, Elan Corporation, Genentech, GE Healthcare, GlaxoSmithKline, Innogenetics, Johnson and Johnson, Eli Lilly and Co., Medpace, Inc., Merck and Co., Inc., Novartis AG, Pfizer Inc, F. Hoffman-La Roche, Schering-Plough, Synarc, Inc., and Wyeth, as well as non-profit partners the Alzheimer's Association and Alzheimer's Drug Discovery Foundation, with participation from the U.S. Food and Drug Administration. Private sector contributions to ADNI are facilitated by the Foundation for the National Institutes of Health (www.fnih.org <http://www.fnih.org/>). The grantee organization is the Northern California Institute for Research and Education, and the study is coordinated by the Alzheimer's Disease Cooperative Study at the University of California, San Diego. ADNI data are disseminated by the Laboratory for Neuro Imaging at the University of California, Los Angeles. This research was also supported by NIH grants P30 AG010129, K01 AG030514, and the Dana Foundation.
Footnotes
Data used in the preparation of this article were obtained from the Alzheimer's Disease Neuroimaging Initiative (ADNI) database (www.loni.ucla.edu\ADNI). As such, the investigators within the ADNI contributed to the design and implementation of ADNI and/or provided data but did not participate in analysis or writing of this report. ADNI investigators include (complete listing available at http://www.loni.ucla.edu/ADNI/Collaboration/ADNI_Manuscript_Citations.pdf).
Disclosure statement for authors: The authors have no potential financial or personal conflicts of interest including relationships with other people or organization within three years of beginning the work submitted that could inappropriately influence their work.
Publisher's Disclaimer: This is a PDF file of an unedited manuscript that has been accepted for publication. As a service to our customers we are providing this early version of the manuscript. The manuscript will undergo copyediting, typesetting, and review of the resulting proof before it is published in its final citable form. Please note that during the production process errors may be discovered which could affect the content, and all legal disclaimers that apply to the journal pertain.
References
- Adak S, Illouz K, Gorman W, Tandon R, Zimmerman EA, Guariglia R, Moore MM, Kaye JA. Predicting the rate of cognitive decline in aging and early Alzheimer disease. Neurology. 2004;63:108–114. doi: 10.1212/01.wnl.0000132520.69612.ab. [DOI] [PubMed] [Google Scholar]
- Bansal R, Geiger B, Banihashemi A, Krishnan A. Integrated Segmentation, Registration and Visualization of Multimodal Medical Image Datasets. Work-In-Progress IEEE Visualization. 2000 [Google Scholar]
- Blennow K, Hampel H. CSF markers for incipient Alzheimer's disease. Lancet Neurol. 2003;2:605–613. doi: 10.1016/s1474-4422(03)00530-1. [DOI] [PubMed] [Google Scholar]
- Carlson NE, Moore MM, Dame A, Howieson D, Silbert LC, Quinn JF, Kaye JA. Trajectories of brain loss in aging and the development of cognitive impairment. Neurology. 2008;70(11):828–33. doi: 10.1212/01.wnl.0000280577.43413.d9. 2008 Mar 11. Epub 2007 Nov 28. [DOI] [PubMed] [Google Scholar]
- Carmichael OT, Kuller LH, Lopez OL, Thompson PM, Dutton RA, Lu A, Lee SE, Lee JY, Aizenstein HJ, Meltzer CC, Liu Y, Toga AW, Becker JT. Ventricular volume and dementia progression in the Cardiovascular Health Study. Neurobiol Aging. 2007;(28):389–397. doi: 10.1016/j.neurobiolaging.2006.01.006. [DOI] [PMC free article] [PubMed] [Google Scholar]
- Chou Y, Leporé N, de Zubicaray G, Carmichael O, Becker J, Toga A, Thompson P. Automated Ventricular Mapping with Multi-Atlas Fluid Image Alignment Reveals Genetic Effects in Alzheimer's Disease. Neuroimage. 2008;40(2):615–630. doi: 10.1016/j.neuroimage.2007.11.047. [DOI] [PMC free article] [PubMed] [Google Scholar]
- Chou YY, Lepore N, Brun C, Barysheva M, McMahon K, de Zubicaray GI, Wright MJ, Toga AW, Thompson PM. Can Tissue Segmentation Improve Registration? A study of 92 Twins. Organization for Human Brain Mapping; 2009. [Google Scholar]
- Cootes T, Hill A, Taylor C, Haslam J. The use of active shape models for locating structures in medical images. Image and Vision Computing. 1994;12:355–366. [Google Scholar]
- Collins DL, Neelin P, Peters TM, Evans AC. Automatic 3D intersubject registration of MR volumetric data in standardized Talairach space. J Comput Assist Tomogr. 1994;18:192–205. [PubMed] [Google Scholar]
- Corder EH, Saunders AM, Strittmatter WJ, Schmechel DE, Gaskell PC, Small GW, Roses AD, Haines JL, Pericak-Vance MA. Gene dose of apolipoprotein E type 4 allele and the risk of Alzheimer's disease in late onset families. Science. 1993;261(5123):921–3. doi: 10.1126/science.8346443. [DOI] [PubMed] [Google Scholar]
- Durrleman S, Pennec X, Trouve A, Thompson PM, Ayache N. Inferring Brain Variability from Diffeomorphic Deformations of Currents: An Integrative Approach. Medical Image Analysis. 2008;12(5):626–37. doi: 10.1016/j.media.2008.06.010. 2008 Oct. Epub 2008 Jun 21. [DOI] [PMC free article] [PubMed] [Google Scholar]
- Fleisher AS, Sun S, Taylor C, Ward CP, Gamst AC, Petersen RC, Jack CR, Aisen PS, Thal LJ. Volumetric MRI vs clinical predictors of Alzheimer disease in mild cognitive impairment. Neurology. 2008;70:191–199. doi: 10.1212/01.wnl.0000287091.57376.65. [DOI] [PubMed] [Google Scholar]
- Folstein MF, Folstein SE, McHugh PR. “Mini-mental state”. A practical method for grading the cognitive state of patients for the clinician. J Psychiatr Res. 1975;12:189–198. doi: 10.1016/0022-3956(75)90026-6. [DOI] [PubMed] [Google Scholar]
- Fox NC, Crum WR, Scahill RI, Stevens JM, Janssen JC, Rossor MN. Imaging of onset and progression of Alzheimer's disease with voxel-compression mapping of serial magnetic resonance images. Lancet. 2001;358:201–205. doi: 10.1016/S0140-6736(01)05408-3. [DOI] [PubMed] [Google Scholar]
- Frisoni GB, Pievani M, Testa C, Sabattoli F, Bresciani L, Bonetti M, Beltramello A, Hayashi KM, Toga AW, Thompson PM. The topography of grey matter involvement in early and late onset Alzheimer's disease. Brain. 2007;130(Pt 3):720–30. doi: 10.1093/brain/awl377. [DOI] [PubMed] [Google Scholar]
- Frisoni GB, Prestia A, Rasser PE, Bonetti M, Thompson PM. In vivo mapping of incremental cortical atrophy from incipient to overt Alzheimer's disease. Journal of Neurology. 2009;256(6):916–24. doi: 10.1007/s00415-009-5040-7. [DOI] [PubMed] [Google Scholar]
- Frisoni GB, Fox NC, Jack CR, Jr, Scheltens P, Thompson PM. The clinical use of structural MRI in Alzheimer disease. Nature Reviews Neurology. 2010;6:1–11. doi: 10.1038/nrneurol.2009.215. [DOI] [PMC free article] [PubMed] [Google Scholar]
- Gerig G, Styner M, Weinberger D, Jones D, Lieberman J. Shape Analysis of brain ventricles using SPHARM. IEEE Workshop on Mathematical Methods in Biomedical Image Analysis MMBIA; 2001; pp. 171–178. [Google Scholar]
- Gunter J, Bernstein M, Borowski B, Felmlee J, Blezek D, Mallozzi R. Validation testing of the MRI calibration phantom for the Alzheimer's Disease Neuroimaging Initiative Study. ISMRM 14th Scientific Meeting and Exhibition.2006. [Google Scholar]
- Gutman B, Wang YL, Morra JH, Toga AW, Thompson PM. Disease Classification with Hippocampal Surface Invariants. 6. Vol. 19. Hippocampus; 2009. pp. 572–578. [Special Issue], 2009. [DOI] [PMC free article] [PubMed] [Google Scholar]
- Ho AJ, Stein JL, Hua X, Lee S, Hibar DP, Leow A, Dinov ID, Toga AW, Saykin AJ, Shen L, Foroud T, Pankratz N, Huentelman MJ, Craig DW, Gerber JD, Allen A, Corneveaux J, Stephan DA, Webster J, DeChairo BM, Potkin SG, Jack CR, Weiner MW, Raji CA, Lopez OL, Becker JT, Thompson PM. Commonly carried allele within FTO, an obesity-associated gene, relates to accelerated brain degeneration in the elderly. Proc Natl Acad Sci U S A. 2010a doi: 10.1073/pnas.0910878107. published online, April 19 2010. [DOI] [PMC free article] [PubMed] [Google Scholar]
- Ho AJ, Raji CA, Becker JT, Lopez OL, Kuller LH, Hua X, Lee S, Hibar D, Dinov ID, Stein JL, Jack CR, Weiner MW, Toga AW, Thompson PM, Cardiovascular Health Study, and the ADNI Obesity and Brain Structure in 700 AD and MCI Patients. Neurobiology of Aging (Special Issue on ADNI) 2010b doi: 10.1016/j.neurobiolaging.2010.04.006. in press. [DOI] [PMC free article] [PubMed] [Google Scholar]
- Ho AJ, Hua X, Lee S, Yanovsky I, Leow AD, Gutman B, Dinov ID, Toga AW, Jack CR, Jr, Bernstein MA, Reiman EM, Harvey D, Kornak J, Schuff N, Alexander GE, Weiner MW, Thompson PM. Comparing 3T and 1.5T MRI for tracking AD progression with tensor-based morphometry. Human Brain Mapping. 2010c;31(4):499–514. doi: 10.1002/hbm.20882. [DOI] [PMC free article] [PubMed] [Google Scholar]
- Hua X, Leow A, Lee S, Klunder AD, Toga A, Lepore N, Chou YY, Chiang MC, Barysheva M, Jack CR, Bernstein M, Britson P, Gunter J, Ward C, Whitwell J, Borowski B, Fleisher A, Fox NC, Boyes RG, Barnes J, Harvery D, Kornak J, Schuff N, Boreta L, Studholme C, Alexander G, Weiner MW, Thompson P. 3D characterization of brain atrophy in Alzheimer's disease and mild cognitive impairment using tensor-based morphometry. Neuroimage. 2008a doi: 10.1016/j.neuroimage.2008.02.010. Feb. 2008 (published online) [DOI] [PMC free article] [PubMed] [Google Scholar]
- Hua X, Leow AD, Parikshak N, Lee S, Chiang MC, Toga AW, Jack CR, Weiner MW, Thompson PM. Tensor-Based Morphometry as a Neuroimaging Biomarker for Alzheimer's Disease: An MRI Study of 676 AD, MCI, and Normal Subjects. NeuroImage. 2008b doi: 10.1016/j.neuroimage.2008.07.013. 2008 Jul 22. [Epub ahead of prin] [DOI] [PMC free article] [PubMed] [Google Scholar]
- Hua X, Lee S, Hibar DP, Yanovsky I, Leow AD, Toga AW, Jack CR, Jr, Bernstein MA, Reiman EM, Harvey DJ, Kornak J, Schuff N, Alexander GE, Weiner MW, Thompson PM. Mapping Alzheimer's disease progression in 1309 MRI scans: power estimates for different inter-scan intervals. NeuroImage. 2010 doi: 10.1016/j.neuroimage.2010.01.104. published online, 2010. [DOI] [PMC free article] [PubMed] [Google Scholar]
- Hua X, Lee S, Yanovsky I, Leow AD, Chou YY, Ho AJ, Gutman B, Toga AW, Jack CR, Jr, Bernstein MA, Reiman EM, Harvey DJ, Kornak J, Schuff N, Alexander GE, Weiner MW, Thompson PM. Optimizing power to track brain degeneration in Alzheimer's disease and mild cognitive impairment with tensor-based morphometry: an ADNI study of 515 subjects. Neuroimage. 2009;48(4):668–81. doi: 10.1016/j.neuroimage.2009.07.011. [DOI] [PMC free article] [PubMed] [Google Scholar]
- Jack C, Bernstein M, Fox NC, Thompson P, Alexander G, Harvery D, Borowski B, Britson P, Whitwell J, Ward C, Dale A, Felmlee J, Gunter J, Hill D, Killiany R, Schuff N, Fox-Bosetti S, Lin C, Studholme C, DeCarli C, Krueger G, Ward H, Metzger G, Scott E, Mallozzi R, Blezek D, Levy J, Debbins J, Fleisher A, Albert M, Green R, Bartzokis G, Glover G, Mugler J, Weiner MW. The Alzheimer's Disease Neuroimaging Initiative (ADNI): The MR imaging protocol. Journal of MRI. 2008;27(4):685–691. doi: 10.1002/jmri.21049. [DOI] [PMC free article] [PubMed] [Google Scholar]
- Jack CR, Shiung MM, Gunter JL, O'Brien PC, Weigand SD, Knopman DS, Boeve BF, Ivnik RJ, Smith GE, Cha RH, Tangalos EG, Petersen RC. Comparison of different MRI brain atrophy rate measures with clinical disease progression in AD. Neurology. 2004;62:591–600. doi: 10.1212/01.wnl.0000110315.26026.ef. [DOI] [PMC free article] [PubMed] [Google Scholar]
- Jack CR, Jr, Lowe VJ, Weigand SD, Wiste HJ, Senjem ML, Knopman DS, Shiung MM, Gunter JL, Boeve BF, Kemp BJ, Weiner M, Petersen RC. Serial PIB and MRI in normal, mild cognitive impairment and Alzheimer's disease: implications for sequence of pathological events in Alzheimer's disease. Brain. 2009;132(Pt 5):1355–65. doi: 10.1093/brain/awp062. [DOI] [PMC free article] [PubMed] [Google Scholar]
- Jack CR, Knopman DS, Jagust WJ, Shaw LM, Aisen PS, Weiner MW, Petersen RC, Trojanowski JQ. Hypothetical model of dynamic biomarkers of the Alzheimer's pathological cascade. Lancet Neurol. 2010 Jan;9(1):119–28. doi: 10.1016/S1474-4422(09)70299-6. [DOI] [PMC free article] [PubMed] [Google Scholar]
- Kohannim O, Hua X, Hibar DP, Lee S, Chou YY, Toga AW, Jack CR, Weiner MW, Thompson PM, Alzheimer's Disease Neuroimaging Initiative Boosting power for clinical trials using classifiers based on multiple biomarkers. Neurobiology of Aging (Special Issue on ADNI) doi: 10.1016/j.neurobiolaging.2010.04.022. in press. [DOI] [PMC free article] [PubMed] [Google Scholar]
- Leow AD, Yanovsky I, Parikshak N, Hua X, Lee S, Toga AW, Jack CR, Bernstein MA, Britson PJ, Ward CP, Borowski B, Trojanowski JQ, Shaw L, Fleisher AS, Harvey D, Kornak J, Schuff N, Alexander GE, Weiner MW, Thompson PM. Alzheimer's Disease Neuroimaging Initiative: A One-year Follow up Study Correlating Degenerative Rates, Biomarkers and Cognition. NeuroImage. 2009;45(3):645–55. doi: 10.1016/j.neuroimage.2009.01.004. 2009 Apr 15. [DOI] [PMC free article] [PubMed] [Google Scholar]
- Lopez OL, Jagust WJ, DeKosky ST, Becker JT, Fitzpatrick A, Dulberg C, Breitner J, Lyketsos C, Jones B, Kawas C, Carlson M, Kuller LH. Prevalence and classification of mild cognitive impairment in the Cardiovascular Health Study Cognition Study: part 1. Arch Neurol. 2003;60(10):1385–9. doi: 10.1001/archneur.60.10.1385. [DOI] [PubMed] [Google Scholar]
- Lui LM, Thiruvenkadam S, Wang YL, Thompson PM, Chan TF. Optimized Conformal Surface Registration with Shape-based Landmark Matching. SIAM Journal on Imaging Sciences. 2010;3(1):52–78. 19 February 2010. [Google Scholar]
- McKhann G, Drachman D, Folstein M, Katzman R, Price D, Stadlan EM. Clinical diagnosis of Alzheimer's disease: report of the NINCDS-ADRDA Work Group under the auspices of Department of Health and Human Services Task Force on Alzheimer's Disease. Neurology. 1984;34:939–944. doi: 10.1212/wnl.34.7.939. [DOI] [PubMed] [Google Scholar]
- Morra J, Tu Z, Apostolova LG, Green AE, Avedissian C, Madsen SK, Parikshak N, Hua X, Toga AW, Jack CR, Schuff N, Weiner MW, Thompson PM. Validation of a Fully Automated 3D Hippocampal Segmentation Method Using Subjects with Alzheimer's Disease, Mild Cognitive Impairment, and Elderly Controls. NeuroImage. 2008a doi: 10.1016/j.neuroimage.2008.07.003. 2008 Jul 16. [Epub ahead of print] [DOI] [PMC free article] [PubMed] [Google Scholar]
- Morra J, Tu Z, Apostolova LG, Green AE, Avedissian C, Madsen SK, Parikshak N, Hua X, Toga AW, Jack CR, Schuff N, Weiner MW, Thompson PM. In: Automated 3D Mapping of Hippocampal Atrophy and its Clinical Correlates in 400 Subjects with Alzheimer's Disease, Mild Cognitive Impairment, and Elderly Controls, NeuroImage, Special Issue on Mathematics in Brain Imaging. Thompson PM, Miller MI, Poldrack R, Nichols T, et al., editors. 2008b. published online, Nov. 8 2008. [DOI] [PMC free article] [PubMed] [Google Scholar]
- Morra JH, Tu Z, Toga AW, Thompson PM. Machine Learning for Brain Image Segmentation, Tutorial Chapter in textbook, Biomedical Image Analysis and Machine Learning. Gonzalez F, Romero E, editors. 2009 available at: http://www.loni.ucla.edu/∼thompson/PDF/MorraThompson-ML-Chpt08.pdf.
- Morris J. The clinical dementia rating (CDR): current version and scoring rules. Neurology. 1993;43:2412–2414. doi: 10.1212/wnl.43.11.2412-a. [DOI] [PubMed] [Google Scholar]
- Mueller SG, Weiner MW, Thal LJ, Petersen RC, Jack CR, Jagust W, Trojanowski JQ, Toga AW, Beckett L. Ways toward an early diagnosis in Alzheimer's disease: The Alzheimer's Disease Neuroimaging Initiative (ADNI) Alzheimers Dement. 2005;1:55–66. doi: 10.1016/j.jalz.2005.06.003. [DOI] [PMC free article] [PubMed] [Google Scholar]
- Motter R, Vigo-Pelfrey C, Kholodenko D, Barbour R, Johnson-Wood K, Galasko D, Chang L, Miller B, Clark C, Green R. Reduction of beta-amyloid peptide42 in the cerebrospinal fluid of patients with Alzheimer's disease. Ann Neurol. 1995;38:643–648. doi: 10.1002/ana.410380413. [DOI] [PubMed] [Google Scholar]
- Narr KL, Thompson PM, Sharma T, Moussai J, Blanton R, Anvar B, Edris A, Krupp R, Rayman J, Khaledy M, Toga AW. Three-dimensional mapping of temporo-limbic regions and the lateral ventricles in Schizophrenia: gender effects. Biol Psychiatry. 2001;50:84–97. doi: 10.1016/s0006-3223(00)01120-3. [DOI] [PubMed] [Google Scholar]
- Pizer SM, Gerig G, Joshi S, Aylward S. Multiscale Medial Shape-Based Analysis of Image Objects. Proceedings of the IEEE. 2003;91(10):1670–1679. [Google Scholar]
- Raji CA, Ho AJ, Parikshak NN, Becker JT, Lopez OL, Kuller LH, Hua X, Leow AD, Toga AW, Thompson PM. Brain structure and obesity. Hum Brain Mapp. 2010;31(3):353–364. doi: 10.1002/hbm.20870. [DOI] [PMC free article] [PubMed] [Google Scholar]
- Risacher SL, Saykin AJ, West JD, Shen L, Firpi HA, McDonald BC. Baseline MRI predictors of conversion from MCI to probable AD in the ADNI cohort. Current Alzheimer research. 2009;6(4):347–61. doi: 10.2174/156720509788929273. [DOI] [PMC free article] [PubMed] [Google Scholar]
- Salerno JA, Murphy DG, Horwitz B, DeCarli C, Haxby JV, Rapoport SI, Schapiro MB. Brain atrophy in hypertension. A volumetric magnetic resonance imaging study. Hypertension. 1992;20:340–348. doi: 10.1161/01.hyp.20.3.340. [DOI] [PubMed] [Google Scholar]
- Selkoe DJ. Alzheimer's disease: genes, proteins, and therapy. Physiological Reviews. 2001;81(2):741–766. doi: 10.1152/physrev.2001.81.2.741. [DOI] [PubMed] [Google Scholar]
- Silbert L, Quinn J, Moore M, Corbridge E, Ball M, Murdoch G, et al. Changes in premorbid brain volume predict Alzheimer's disease pathology. Neurology. 2003;61(4):487–92. doi: 10.1212/01.wnl.0000079053.77227.14. [DOI] [PubMed] [Google Scholar]
- Shaw LM, Vanderstichele H, Knapik-Czajka M, Clark CM, Aisen PS, Petersen RC, Blennow K, Soares H, Simon A, Lewczuk P, Dean R, Siemers E, Potter W, Lee VMY, Trojanowski JQ. Alzheimer's Disease Neuroimaging Initiative. Cerebrospinal fluid biomarker signature in Alzheimer's disease neuroimaging initiative subjects. Annals of Neurology. 65(4):403–413. doi: 10.1002/ana.21610. [DOI] [PMC free article] [PubMed] [Google Scholar]
- Stein JL, Hua X, Morra JH, Lee S, Hibar DP, Ho AJ, Leow AD, Toga AW, Sul JH, Kang H, Eskin E, Saykin AJ, Shen L, Foroud T, Pankratz N, Huentelman MJ, Craig DW, Gerber JD, Allen AN, Corneveaux JJ, Stephan DA, Webster J, DeChairo BM, Potkin SG, Jack CR, Weiner MW, Thompson PM. Genome-wide analysis reveals novel genes influencing temporal lobe structure with relevance to neurodegeneration in Alzheimer's disease. NeuroImage. 2010 doi: 10.1016/j.neuroimage.2010.02.068. published online, 2010. [DOI] [PMC free article] [PubMed] [Google Scholar]
- Styner M, Lieberman JA, McClure RK, Weinberger DR, Jones DW, Gerig G. Morphometric analysis of lateral ventricles in schizophrenia and healthy controls regarding genetic and disease-specific factors. PNAS. 2005;102(12):4872–4877. doi: 10.1073/pnas.0501117102. [DOI] [PMC free article] [PubMed] [Google Scholar]
- Thompson PM, Schwartz C, Lin, Toga AW. High-resolution random mesh algorithms for creating a probabilistic 3D surface atlas of the human brain. NeuroImage. 1996;3:19–34. doi: 10.1006/nimg.1996.0003. [DOI] [PubMed] [Google Scholar]
- Thompson PM, Toga AW. Detection, Visualization and Animation of Abnormal Anatomic Structure with a Deformable Probabilistic Brain Atlas based on Random Vector Field Transformations (Invited Paper) Medical Image Analysis. 1997;1(4):271–294. doi: 10.1016/s1361-8415(97)85002-5. November 1997. [DOI] [PubMed] [Google Scholar]
- Thompson PM, Mega MS, Narr KL, Sowell ER, Blanton RE, Toga AW. Brain image analysis and atlas construction, invited chapter. In: Fitzpatrick M, Sonka M, editors. SPIE Handbook on Medical Image Analysis. Society of Photo-Optical Instrumentation Engineers (SPIE) Press; 2000. pp. 1063–1131. [Google Scholar]
- Thompson PM, Hayashi KM, de Zubicaray G, Janke AL, Rose SE, Semple J, Herman D, Hong MS, Dittmer SS, Doddrell DM, Toga AW. Dynamics of gray matter loss in Alzheimer's disease. J Neurosci. 2003;23:994–1005. doi: 10.1523/JNEUROSCI.23-03-00994.2003. [DOI] [PMC free article] [PubMed] [Google Scholar]
- Thompson PM, Hayashi KM, de Zubicaray G, Janke AL, Rose SE, Semple J, Hong MS, Herman D, Gravano D, Doddrell DM, Toga AW. Mapping Hippocampal and Ventricular Change in Alzheimer's Disease. NeuroImage. 2004;22(4):1754–66. doi: 10.1016/j.neuroimage.2004.03.040. Aug. 2004; published online, June 1, 2004. [DOI] [PubMed] [Google Scholar]
- Thompson PM, Hayashi KM, Sowell ER, Gogtay N, Giedd JN, Rapoport JL, de Zubicaray GI, Janke AL, Rose SE, Semple J, Doddrell DM, Wang YL, van Erp TGM, Cannon TD, Toga AW. Mapping Cortical Change in Alzheimer's Disease, Brain Development, and Schizophrenia, Special Issue on Mathematics in Brain Imaging. In: Thompson PM, Miller MI, Ratnanather JT, Poldrack R, Nichols TE, editors. NeuroImage. Vol. 23. 2004b. pp. S2–18. September 2004. [DOI] [PubMed] [Google Scholar]
- Walhovd KB, Fjell AM, Brewer J, McEvoy LK, Fennema-Notestine C, Hagler DJ, Jr, Jennings RG, Karow D, Dale AM, Alzheimer's Disease Neuroimaging Initiative Combining MR Imaging, Positron-Emission Tomography, and CSF Biomarkers in the Diagnosis and Prognosis of Alzheimer Disease. AJNR Am J Neuroradiol. 2010 Jan 14; doi: 10.3174/ajnr.A1809. Epub ahead of print. [DOI] [PMC free article] [PubMed] [Google Scholar]
- Wang YL, Zhang J, Gutman B, Chan TF, Becker JT, Aizenstein HJ, Lopez OL, Tamburo RJ, Toga AW, Thompson PM. Multivariate Tensor-Based Morphometry on Surfaces: Application to Mapping Ventricular Abnormalities in HIV/AIDS. NeuroImage. 2010;49(3):2141–57. doi: 10.1016/j.neuroimage.2009.10.086. 2010 Feb 1. Epub 2009 Nov 6. [DOI] [PMC free article] [PubMed] [Google Scholar]
- Weiner MW. Expanding ventricles may detect preclinical Alzheimer disease. Neurology. 2008;70:824–825. doi: 10.1212/01.wnl.0000304743.72127.cc. [DOI] [PMC free article] [PubMed] [Google Scholar]
- Whitwell JL, Josephs KA, Murray ME, Kantarci K, Przybelski SA, Weigand SD, Vemuri P, Senjem ML, Parisi JE, Knopman DS, Boeve BF, Petersen RC, Dickson DW, Jack CR., Jr MRI correlates of neurofibrillary tangle pathology at autopsy: a voxel-based morphometry study. Neurology. 2008;71(10):743–9. doi: 10.1212/01.wnl.0000324924.91351.7d. [DOI] [PMC free article] [PubMed] [Google Scholar]
- Yesavage JA, Brink TL, Rose TL, Lum O, Huang V, Adey M, Leirer VO. Development and validation of a geriatric depression screening scale: a preliminary report. J Psychiatr Res. 1982;17:37–49. doi: 10.1016/0022-3956(82)90033-4. [DOI] [PubMed] [Google Scholar]
- Yushkevich PA. Continuous medial representation of brain structures using the biharmonic PDE. Neuroimage. 2009 Mar;45(1 Suppl):S99–110. doi: 10.1016/j.neuroimage.2008.10.051. Epub 2008 Nov 12. [DOI] [PMC free article] [PubMed] [Google Scholar]
- Zeineh MM, Engel SA, Thompson PM, Bookheimer S. Unfolding the Human Hippocampus with High-Resolution Structural and Functional MRI [Invited Paper] The New Anatomist (Anatomical Record) 2001;265(2):111–120. doi: 10.1002/ar.1061. Apr. 15, 2001. [DOI] [PubMed] [Google Scholar]