

Abstract
We present a method for calculating the configurational-dependent diffusion coefficient of a globular protein as a function of the global folding process. Using a coarse-grained structure-based model, we determined the diffusion coefficient, in reaction coordinate space, as a function of the fraction of native contacts formed Q for the cold shock protein (TmCSP). We find nonmonotonic behavior for the diffusion coefficient, with high values for the folded and unfolded ensembles and a lower range of values in the transition state ensemble. We also characterized the folding landscape associated with an energetically frustrated variant of the model. We find that a low-level of frustration can actually stabilize the native ensemble and increase the associated diffusion coefficient. These findings can be understood from a mechanistic standpoint, in that the transition state ensemble has a more homogeneous structural content when frustration is present. Additionally, these findings are consistent with earlier calculations based on lattice models of protein folding and more recent single-molecule fluorescence measurements.
Introduction
The energy landscape theory of protein folding (1–5) has been an invaluable theoretical framework for understanding protein folding (6–10), oligomerization (11–13), and functional transitions (14–18). According to the theory, the energy landscape associated with protein folding lacks large energetic traps and has an overall funnel shape where the native ensemble is the lowest energy state. These minimally frustrated landscapes can be idealized as being devoid of energetic roughness, which enables the use of structure-based (Gō-like) models (8,10,19–23) to study the thermodynamic and kinetic properties of the folding process. Because these structure-based models lack energetic trapping, they also provide a means to characterize the topological contributions to folding.
Although there is a strong correlation between simulated barrier heights and experimental folding times (24), rates are a consequence of both the free-energy profile and the diffusion coefficient (25,26). Accordingly, direct comparison between experiments and theory requires both quantities. In principle, one may circumvent the need for the diffusion coefficient by simulating many thousands of folding trajectories and calculating the mean first passage time of folding (27–29). Such approaches are often computationally intractable and they do not always advance our physical understanding of the process. Therefore, it is desirable to calculate both the free energy F and the diffusion coefficient D as functions of a global folding coordinate Q (30–34). If D is constant, then it only serves as a prefactor to the folding rate. However, when D is not constant, as we describe below, it can give rise to kinetic barriers in addition to the thermodynamic barriers (32).
The diffusion coefficient D is a result of the underlying energy landscape. As every conformation has a unique set of locally accessible interactions, D is a function Q. Although Q can be defined by a variety of measures, here we use the fraction of native contacts, as it has been shown to capture, accurately, the transition state ensemble of two-state proteins (35). Low values of Q correspond to the unfolded state and high values correspond to the folded ensemble. When Q is low, energetic contributions are largely from water-protein interactions. In the folded state (high Q), the burial of hydrophobic surface area can be the dominant energetic contribution. In these two regimes, the local energetic roughness can be quite different, which can lead to different diffusion coefficients.
Many recent efforts have attempted to characterize D(Q) via experimental methods (36–42) and theoretical calculations (26,32–34,43–49). These studies have found that diffusion is not constant as a protein folds to the native state. This naturally leads to the question: Does diffusion vary with the degree of compactness because of energetic trapping, or topological constraints? To address this, we calculate D for a structure-based model that lacks energetic roughness and compare the findings to variants of the model that include energetic frustration.
In this article, we present the diffusive properties of a Cα structure-based model in molecular dynamics simulations. We compare the results obtained from the unfrustrated model (i.e., only native interactions are stabilizing) with an energetically frustrated variant of the model, which allows for a quantitative, and qualitative, comparison of topological and energetic contributions to the diffusion coefficient. As there is a large body of experimental data available, including denaturant-dependent diffusion coefficient measurements, we chose to study the cold shock protein from the hyperthermophilic bacterium Thermotoga maritima known as TmCSP (36) (Fig. 1 a). TmCSP is a 66-amino-acid β-barrel protein that is known to have well-defined two-state folding behavior (50–53). Through comparison with previous computational, theoretical, and experimental results, we provide evidence of the degree of roughness present in TmCSP.
Figure 1.
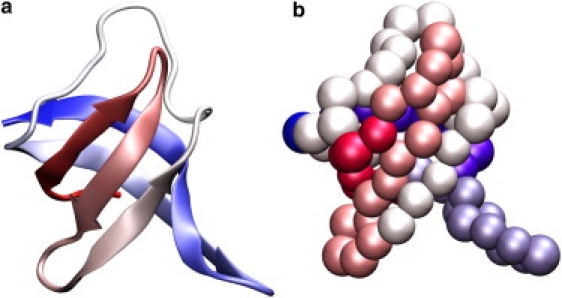
Cold-shock protein from Thermotoga maritima (TmCSP Protein DataBank entry 1G6P (36)), shown in (a) cartoon representation and (b) Cα representation. The size of the atoms in panel b correspond to the excluded volume radii used in this model. The structures are colored from red (C-terminus) to blue (N-terminus) and were visualized with VMD (82). The TmCSP is a small globular protein with 66 amino acids, molecular mass of 7.5 kDa, and a three-dimensional structure known as a Greek-key β-barrel (five β-strands divided in two antiparallel β -sheets).
Models and Methods
Structure-based Cα model
Here, we employ a well-studied coarse-grained structure-based model (8). In this model, each residue is represented as a single bead, located at the position of the Cα atom (Fig. 1 b). For unfrustrated simulations, only native interactions are stabilizing and all residue pairs not in contact in the native structure are given a repulsive interaction to prevent chain crossing. In this model, the native structure is the global energetic minimum and the landscape lacks energetic traps. Native contacts were determined by the Contact of Structural Units software package (54). The functional form of the potential is
| (1) |
where εr = 100, εθ = 20, εφ = 1, εC = 1, εNN = 1, and σNN = 4.0 Å. ro, θo, φo, and σij are given the values found in the native structure.
To model nonspecific energetic frustration, we introduced an additional attractive interaction between all residue pairs that are not in contact in the native state and are separated by at least four residues in sequence. The functional form of the nonnative interactions is
| (2) |
with rg = 6.5 Å and σg = 1.0 Å. The degree of energetic frustration is determined by εNC. In this study, we performed simulations with εNC = 0.1–0.7.
Biasing potential
To calculate the diffusion coefficient about a specific value of Q, we introduced umbrella potentials (55,56) that restrained each simulation to a specified range of Q values. See Supporting Material for technical details.
φ-values analysis
Experimentally, the structural content of the transition state ensemble in proteins is often studied by measuring changes in native stability and folding/unfolding rates upon point mutations. An approximate kinetic measure of the protein structure around a mutated residue is given by (57,58)
| (3) |
where kmut and kwt are the mutant and the wild-type folding rates, and ΔΔG0 is the change in stability of the folded state upon mutation.
From a simulation, one may also calculate φ-values by determining the change in the thermodynamic free energy barrier upon site mutation and comparing it to the change in native stability ΔΔGF–U. Computationally, this is less demanding than trying to determine differences in folding rates upon mutation. The φ-values from structure-based simulations for each native contact pair (residues i and j) can be further approximated as (8,59)
| (4) |
where PijX is the probability of a contact between i and j being formed in state X (with X being F, TS, or U). For ease of discussion, here, we report φi-values averaged over all native contacts with residue i.
Results
Diffusion coefficient is robust to changes in restraining potential
The primary objective of this study was to determine how the diffusion coefficient D, in reaction coordinate space, changes during the folding process of TmCSP (Fig. 1 a). To calculate D, we employed a Cα structure-based model (Fig. 1 b) with a restraining potential to ensure that each simulation sampled the phase space local to a particular value of Q (see Models and Methods for full description). The restraining potential was harmonic, centered at Q∗, and was given a strength of KQ. When adding such a restraint, one must first ensure that the quantities of interest are not dependent on the strength of the restraint. To ensure that the diffusion coefficients are a result of the underlying energy landscape, and not the biasing potential, several sets of simulations were performed, each with a different strength of the restraint.
To calculate the diffusion coefficient from a simulation, we employed a quasiharmonic diffusive approximation (25)
| (5) |
where ΔQ(T)2 is the mean-squared fluctuations in Q, and τ(T) is the relaxation time associated with the decay of the autocorrelation function of Q, i.e., CQ(t). Here, Q(t) is defined as the fraction of native Cα-Cα contacts formed as a function of time (see Models and Methods). To use Eq. 5, the value of KQ must be in a range for which a quasiharmonic approximation is warranted and D is not dependent on KQ.
To determine values of KQ for which the quasiharmonic approximation is valid, we compared the probability distributions in Q for a variety of KQ values. Fig. 2 a shows the probability distributions for several values of KQ (where the harmonic restraint is centered at Q∗ = 0.5), each at the folding temperature in the unrestrained case. For KQ = 10, the probability distribution is clearly bimodal, with one peak corresponding to nativelike structures (Q ≈ 0.8) and one peak corresponding to the unfolded ensemble (Q ≈ 0.2). For KQ = 50, the probability distribution possesses a single peak near the minimum of the restraining potential Q = 0.5. For KQ = 100, the width of the distribution is further reduced. This additional reduction of the width is undesirable. Because the diffusion coefficient describes the multidimensional process of the protein escaping from local energetic/topological minima, an overly-strong restraint may lead to artifacts by disallowing some possible routes of escape. In that scenario, our calculations of D could probe the restraining potential and not the underlying energy landscape.
Figure 2.

(a) Probability distributions in Q for biased (KQ > 0, Q∗ = 0.5) simulations with different strengths of the restraining potential KQ. As KQ increases, the distribution changes from a bimodal distribution, with peaks corresponding to the native and unfolded ensembles, to a single peak centered about the minimum of the restraining potential Q∗. The distribution is quasiharmonic for KQ > 10. (b) The diffusion coefficient D is shown, on a semilog plot, as a function of KQ for five values of Q∗. For 10 < KQ < 50 (region delimited by the vertical dashed lines) D(Q) is relatively constant, demonstrating that estimates of D will be independent of KQ over this interval. Simulations were performed at the folding temperature of the pure structure-based model Tf0.
In addition to identifying a range of value of KQ for which a quasiharmonic approximation is valid, we also determined a range of KQ-values for which the calculated diffusion coefficients are not KQ-dependent. Fig. 2 b shows D as a function of KQ for a wide range of Q values. For low values of KQ (< 10), all calculated values of D increase with KQ. As discussed above, this is due to the probability distribution being altered from a bimodal distribution to a distribution centered about the Q value of interest. For 10 < KQ < 50 the calculated D is nearly constant for all Q values. Above KQ = 50, the values of D again increase for Q > 0.7. Based on these data, we concluded that KQ = 50 will provide reliable values for the position-dependent diffusion.
Diffusion coefficient dependence on Q
To understand the origins of the Q-dependence of the diffusion coefficient, one must consider the fluctuations in Q and the decay time of these fluctuations τQ. As our calculated values of D are not sensitive to KQ at KQ ∼ 50, all further values are reported for simulations performed at the folding temperature of the unrestrained simulations Tf0 with KQ = 50. Fig. 3 a shows the time autocorrelation functions of Q for a variety of Q∗ values. As Q∗ is increased from 0.2 to 0.5 the characteristic decay time, τQ, increases. At higher Q values (>0.5), the decay time decreases to a value smaller than in the unfolded ensemble (larger 1/τQ values in Fig. 3 b). The dispersion in Q (ΔQ2) also displays a nonlinear dependence on Q (Fig. 3 b). Similar to τQ, ΔQ2 initially increases with increasing Q (0.2–0.5) and then decreases as the native ensemble is reached (Q = 0.8). Fluctuations in Q, shown in Fig. 3 b, rise considerably near the transition state due to the intrinsic instability of the transition state ensemble (TSE). In other words, Q exhibits large amplitude fluctuations as it overcomes the free energy barrier. For high and low Q values (the folded and unfolded ensembles), Q is highly localized, which results in a small dispersion in Q. While ΔQ2 is roughly symmetric about the TSE, the autocorrelation time, as well as its inverse, is asymmetric. This symmetry-breaking in τQ leads to an asymmetric relationship between D and Q.
Figure 3.

(a) Normalized correlation functions of Q, CQ(t), shown on a log-log plot (time in reduced units) for different values of Q∗. Because a single exponential did not always fit well, each curve was fit to the sum of three exponentials to obtain an average decay time τQ. KQ = 50 was used and the temperature was the folding temperature of the unbiased simulations Tf0. The characteristic decay time τQ is used to calculate the diffusion coefficient D. (b)The dispersion of the reaction coordinate ΔQ2 as a function of the reaction coordinate Q (left axis), with and without energetic frustration. The inverse correlation time of Q (1/τQ) shown as a function of Q (right axis), with and without the frustration term. Calculations are shown at Tf of each εNC.
The diffusion coefficient as a function of Q, D(Q), is proportional to the product of ΔQ2 and 1/τQ, and is shown in Fig. 4. We find D has large variations as a function of the folding reaction, which is in agreement with earlier studies on lattice models (32) and analytic studies (30,31,33,43). As discussed above, D(Q) (Fig. 4) largely follows 1/τQ (Fig. 3 b). Fluctuations of the reaction coordinate ΔQ2 appear to have less influence on D(Q), as ΔQ2 changes only modestly with Q. The fact that D(Q) reaches a minimum around the TSE suggests the presence of a kinetic barrier, in addition to a thermodynamic one. After the protein moves from the TSE to the folded state, D(Q) once again increases and eventually reaches values that are 10-times larger than those corresponding to the unfolded ensemble.
Figure 4.

Comparison of the diffusion coefficients calculated without energetic frustration (black circles) and with energetic frustration (εNC = 0.2, red squares) as functions of Q. All results were calculated with a restraining potential of strength KQ = 50 and at the Tf of each εNC.
The one-dimensional position-dependent diffusion coefficient variations indicate that the ruggedness of the energy landscape is not the same over the one-dimensional configuration space. D(Q) describes the local moves over microscopic barriers that connect states with similar values of Q. If the microstate is deep, it acts like a speed bump slowing both the drift and the superimposed Brownian movement (60) (i.e., the diffusion coefficient becomes small and escape-time from traps increases (7)). Because our energetically unfrustrated model gives rise to values of D that vary with Q, our results clearly indicate that the topology of the ensemble about a particular value of Q is inextricably linked to the diffusive dynamics. In other words, each configuration of the protein has a particular set of accessible escape routes, independent of the energetic roughness, which lead to the nonconstant form of D(Q).
Energetic frustration alters the diffusive dynamics
Due to the funnel-like nature of protein-folding energy landscapes, completely unfrustrated models, such as the one employed in this study, are sufficient to capture many aspects of protein folding (7,9,59,62–73). However, there is mounting evidence that a low degree of frustration can lead to accelerated folding rates (63) and provide a more accurate description of the unfolded ensemble (74). Such findings suggest a potential influence of energetic frustration on the diffusive properties associated with protein folding. To investigate this further, we employed a modified structure-based model in which the degree of frustration may be controlled. Specifically, we used the structure-based Cα-model and added nonspecific attractive interactions between all nonnative atom pairs, where the functional form is a Gaussian with an energetic weight εNC (see Models and Methods). Accordingly, εNC = 0 corresponds to the purely structure-based model.
Thermodynamic quantities were calculated for each frustrated system (εNC > 0.0) with KQ = 0. For each parameter set, the fraction of native proteins fN(T) was defined as
| (6) |
where F(Q) is the free energy as a function of Q, the integral in the numerator is over all native conformations, and the denominator is over all possible Q values. We define the folding temperature Tf as the temperature where fN = 0.5 (dotted horizontal line in Fig. 5 a). As the degree of frustration is increased from 0, Tf initially increases and reaches its maximum at εNC = 0.2. Because Tf measures thermodynamic stability, an increase in native-state stability with increased nonnative interaction strength may be surprising. This feature has two origins. First, in the native state ensemble, proteins are constantly fluctuating (75), which allows nonnative residue pairs to fluctuate toward and away from each other and form transient nonnative interactions (10). When nonspecific interactions are stabilizing, these transient nonnative interactions increase the stability of near-native conformations. The second contribution to the increased native-state stability may be due to using a Cα representation. All nonnative interactions were given energetic minima at 6.5 Å. When coarse-graining, Cα pairs may be within that distance, but the side-chain configurations may lead to these pairs being considered not-in-contact. Thus, the noncontacting residues may stabilize these native configurations via the nonspecific interactions. Above εNC = 0.2, the energetic frustration stabilizes the unfolded ensemble more than the folded ensemble and the folding temperature decreases, as expected. These findings are consistent with experimental results indicating that weakly attractive nonspecific interactions can increase the stability of Src homology 3 domain (70). In addition to affecting native stability, these experiments also revealed variations in the thermodynamic properties of the transition state ensemble, which were manifested as increased unfolding and refolding rates.
Figure 5.

(a) Fraction of native protein fN versus temperature T for different degrees of frustration εNC. The value fN was calculated using Eq. 6. (b) Folding temperature Tf as a function of εNC for KQ = 0. The folding temperature Tf has a maximum at εNC = 0.2.
Increased levels of frustration also have direct effects on the calculated D(Q) profiles (Fig. 4). Similar to the unfrustrated simulations, the majority of the changes in D(Q) may be attributed to fluctuations in τQ (Fig. 3). When energetic frustration is introduced, ΔQ2 is only marginally perturbed while 1/τQ exhibits substantial deviations (Fig. 3). Comparison of the frustrated and unfrustrated simulations (Fig. 3) indicates that frustration has little effect on the ΔQ2 and 1/τQ values associated with the unfolded ensemble (Q < 0.5). After the protein has reached the folding transition state (Q ≈ 0.5) and moves to higher Q values, 1/τQ increases for both the unfrustrated and εNC = 0.2 simulations, although there is a larger increase in 1/τQ for the frustrated simulations than the unfrustrated ones. This finding may be counterintuitive, but it shows that a low degree of frustration can actually reduce the height of the microscopic barriers that are described by the diffusion coefficient.
Residual entropy of the native state ensemble
The fact that D(Q) reaches a maximum in the folded ensemble can be understood by analyzing the density of states as a function of Q. Fig. 6 shows the density of states as a function Q for a lattice model (32) and the presented Cα model. Although there is an increase in D(Q) as Q goes to 1, D(Q) remains on the same scale for large Q as for small Q. This is due to the ensemble nature of the native state. That is, in the Cα model, the protein may interconvert between local structures without changing the value of Q, even when all native contacts are formed (Q = 1). This leads to a degenerate native state, residual entropy, and nonzero correlation times. In contrast, in the lattice model, every possible move from the Q = 1 state results in a decrease in Q. This nondegenerate native state leads to very low correlation times, and hence very large diffusion coefficients for the native state. Additionally, in the lattice model, single rearrangements can result in multiple contacts being formed or broken simultaneously. This lack of residual entropy in the lattice model has prevented previous evaluation of D(Q = 1). Here, by using an off-lattice Cα model, we are able to calculate D(Q) for the full range of Q.
Figure 6.

Density of states n as a function of Q for (a) the Cα model and (b) a lattice model (32). High Q represents the folded ensemble and low Q is the unfolded ensemble. Panel a shows the density of states for the unfrustrated (εNC = 0.0) and frustrated (εNC = 0.2) systems. The Cα model has a highly degenerate folded state, indicating the presence of residual entropy which allows for an increase in D after the protein passes through the TSE. For the lattice model there is a rapid decrease in the density of states with a nondegenerate folded state (n(Efolded) = n(Qfolded) = 1) and monotonically decreasing values of D (32).
Folding mechanism and φ-values analysis
The introduction of attractive nonnative interactions, or energetic frustration, changes the folding energy landscape (62,63,76) and can alter the structural content of the transition state ensemble. The ε-values are commonly used experimentally to measure the degree of native structural content in the TSE about each residue. Computationally, φ-values can also be determined, where a value of 0 indicates no native structural content and 1 indicates full structural content in the TSE. Fig. 7 shows φi (φ-value for each residue i) obtained from simulations with no frustration (εNC = 0.0) and a low degree of frustration (εNC = 0.2). When εNC = 0.2, there is a shift in structural content from the C-terminus to the N-terminus. Specifically, when εNC is increased from 0.0 to 0.2 the φ-values for residues 0–20 increase and residues 55–65 decrease. Additionally, other regions with low φ-values, such as residues 42–45, increase when frustration is introduced.
Figure 7.
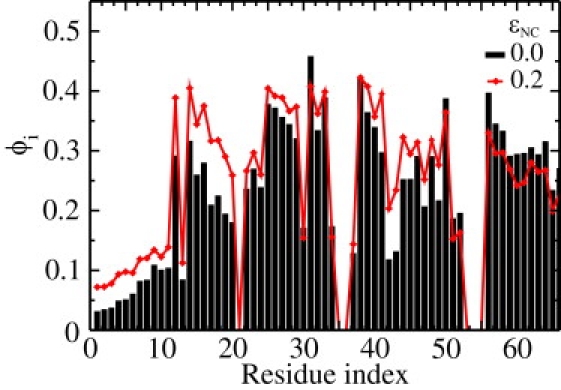
The φ-values calculated for the unfrustrated simulations (εNC = 0.0, black bars) and a weakly-frustrated system (εNC = 0.2, red diamonds). Many residues with lower φi-values increase, and high values decrease, upon the addition of frustration. This indicates a more homogeneous TSE when a low level of frustration is introduced. Simulations were performed without a restraining potential (KQ = 0) and at Tf(εNC).
Overall, introducing a low-degree of frustration appears to (partially) homogenize the φ-values. Because residues that are less native (low φ-values) are not surrounded by formed native interactions, they are more exposed to nonnative interactions. Accordingly, nonspecific stabilizing interactions are more accessible to less-native residues than highly-native ones. These nonspecific attractive interactions can then localize the residues involved in native-contacts, which results in additional native structure formation and a shift in the φ-values.
To characterize the effects of frustration on the unfolded and folded basins, in addition to the TSE, we calculated the probability of contacts being formed with each residue, as functions of Q (Fig. 8). The probabilities for the unfrustrated case are shown in Fig. 8 a. For low Q, the probabilities are not homogeneously distributed, but are high around residues 22, 53, and 56, and nearly zero for all other residues. At approximately the transition state (Q = 0.5), the probabilities follow the φ-values, and have peaks around residues 22, 35, and 55. After passing the transition state, these regions may be considered nucleation sites, about which the rest of the protein's native structure is formed. Fig. 8 b shows the changes in the probabilities when frustration is introduced. Blue corresponds to decreased structure and red indicates increased structure formation. Similar to the φ-values, in the TSE there is a shift in probabilities from the C-terminal residues to the N-terminal residues. Surprisingly, the effects of the energetic frustration appear to be isolated to the TSE. One explanation for this feature is that frustration in the unfolded ensemble may not be well described by Gaussian potentials, as we have employed here. Instead, longer-range, screened-electrostatic interactions may be a larger contributor to frustration in the unfolded ensemble (74). In contrast, using a coarse-grained structure-based model, Das et al. (77) showed that introducing nonnative interactions and energetic heterogeneity has a large effect on the TSE, and improves agreement between experimental and theoretical φ-values for Src homology 3 domain. Although our finding suggest short-range frustration is most important in the TSE, real proteins likely exhibit a combination of short-range and long-range nonnative interactions. Further investigation will be necessary to untangle the relationship among different types of frustration, the folding mechanism, and the diffusive dynamics of the folding process.
Figure 8.

Probability of contacts being formed for each residue P(i, Q, εNC) as a function of the reaction coordinate Q, for the unfrustrated and weakly frustrated system. (a) P(i, Q, 0) increases (blue to red) as the protein folds. (b) Difference between the probabilities for the frustrated and unfrustrated simulations, P(i, Q, εNC) – P(i, Q, 0.0), where εNC = 0.2. The simulations were performed at T = Tf . (Open bars) Residues lacking any native contacts.
Perl et al. (78) explored the role of the chain termini residues on the folding stability by comparing the cold shock proteins BcCSP from the thermophile Bacillus caldolyticus with its homolog BsCSPB Bacillus subtilis. These two cold shock proteins have nativelike activated states of folding, similar to that of the hyperthermophilic Thermotoga maritima TmCSP (50) studied in this work. Their studies illustrate that major contributors to the difference in stability are residue 3 (which takes on nativelike structure in the TSE) and the C-terminal residue 66 (which forms late in the folding process) (78). Despite the fact that the C-terminal residues have high φ-values in experiments and low φ-values for the unfrustrated model, as discussed above, the φ-values of the termini increase with increased energetic roughness. As suggested by our analysis of stability as a function of roughness, this comparison also demonstrates that cold shock protein likely has a modest degree of energetic roughness, though the exact degree, and type, of frustration cannot be unambiguously determined from the presented simulations.
Conclusions
In this work, we have studied the folding of TmCSP using a coarse-grained structure-based model and we calculated the diffusion coefficient as a function of a reaction coordinate Q. Our main results can be outlined as follows: The diffusion coefficient displays nonmonotonic behavior as a function of Q, which can be attributed to a residual entropy of the native state ensemble. A role of residual entropy has been suggested previously (33), though here we explicitly calculate it and show its relationship to the diffusive dynamics. By introducing varied degrees of energetic roughness, we have shown that for low levels of frustration, TmCSP displays increased thermal stability and diffusion coefficients, relative to the unfrustrated regime, which agrees with previous findings (62,63). As frustration is increased, the stability reaches a maximum, after which increased frustration leads to a less stable protein. At this optimum degree of frustration, the transition state is characterized by a more homogeneous distribution of φ-values, relative to the unfrustrated case. In addition to changes in the structural content of the TSE, the diffusion coefficient is also affected by a low-degree of energetic frustration.
This work has shown that the diffusive dynamics are intimately linked to the topological and energetic aspects of a protein, and lays a foundation for understanding the diffusive properties of protein folding. Many examples can be found where the diffusion coefficient provides a nontrivial contribution to the folding dynamics. For example, as the presence of additional small free-energy barriers can actually accelerate folding rates (79,80), there must be a balance between folding barriers and diffusion along the reaction coordinate. The folding of proteins with smaller free-energy barriers, such as BBL (81), will also depend more on the precise structure of the diffusion coefficient (44,41,42), such that the nonmonotonic behavior of the diffusion may be the limiting factor that determines folding rates. With the presented framework, further investigation will explore the details of how the diffusive dynamics contributes to the folding of these and other systems.
Uncited reference
61.
Supporting Material
Additional text and one reference is available at http://www.biophysj.org/biophysj/supplemental/S0006-3495(10)00539-4.
Supporting Material
Acknowledgments
We thank the Center for Theoretical Biological Physics for use of its computing facilities.
This work was supported by the Center for Theoretical Biological Physics sponsored by the National Science Foundation (grant No. PHY-0822283, with additional support from NSF grant No. MCB-0543906). R.J.O., J.C., and V.B.P.L. were supported by Fundação de Amparo à Pesquisa do Estado dãe So Paulo and Conselho Nacional de Desnvolvimento Científico e Tecnológico, Brazil. R.J.O. and J.C. have also been supported by the Fundacao Coordenação de Aperfeiçoamento de Pessoal de Nivel Superior, Brazilian Ministry of Education. P.C.W. thanks the U. S. National Science Foundation for its I2CAM International Materials Institute Award (grant No. DMR-0645461) to fund this international collaboration. J.W. thanks the National Science Foundation for its Career Award.
Contributor Information
Paul C. Whitford, Email: whitford@lanl.gov.
Vitor B.P. Leite, Email: vleite@sjrp.unesp.br.
References
- 1.Leopold P.E., Montal M., Onuchic J.N. Protein folding funnels—a kinetic approach to the sequence structure relationship. Proc. Natl. Acad. Sci. USA. 1992;18:8721–8725. doi: 10.1073/pnas.89.18.8721. [DOI] [PMC free article] [PubMed] [Google Scholar]
- 2.Bryngelson J.D., Onuchic J.N., Wolynes P.G. Funnels, pathways, and the energy landscape of protein folding: a synthesis. Proteins. 1995;21:167–195. doi: 10.1002/prot.340210302. [DOI] [PubMed] [Google Scholar]
- 3.Bryngelson J.D., Wolynes P.G. Spin glasses and the statistical mechanics of protein folding. Proc. Natl. Acad. Sci. USA. 1987;84:7524–7528. doi: 10.1073/pnas.84.21.7524. [DOI] [PMC free article] [PubMed] [Google Scholar]
- 4.Onuchic J.N., Wolynes P.G. Theory of protein folding. Curr. Opin. Struct. Biol. 2004;14:70–75. doi: 10.1016/j.sbi.2004.01.009. [DOI] [PubMed] [Google Scholar]
- 5.Wang J., Onuchic J.N., Wolynes P.G. Statistics of kinetic pathways on biased rough energy landscapes with applications to protein folding. Phys. Rev. Lett. 1996;76:4861–4864. doi: 10.1103/PhysRevLett.76.4861. [DOI] [PubMed] [Google Scholar]
- 6.Shoemaker B.A., Wang J., Wolynes P.G. Structural correlations in protein folding funnels. Proc. Natl. Acad. Sci. USA. 1997;94:777–782. doi: 10.1073/pnas.94.3.777. [DOI] [PMC free article] [PubMed] [Google Scholar]
- 7.Nymeyer H., García A.E., Onuchic J.N. Folding funnels and frustration in off-lattice minimalist protein landscapes. Proc. Natl. Acad. Sci. USA. 1998;95:5921–5928. doi: 10.1073/pnas.95.11.5921. [DOI] [PMC free article] [PubMed] [Google Scholar]
- 8.Clementi C., Nymeyer H., Onuchic J.N. Topological and energetic factors: what determines the structural details of the transition state ensemble and “en-route” intermediates for protein folding? An investigation for small globular proteins. J. Mol. Biol. 2000;298:937–953. doi: 10.1006/jmbi.2000.3693. [DOI] [PubMed] [Google Scholar]
- 9.Gosavi S., Chavez L.L., Onuchic J.N. Topological frustration and the folding of interleukin-1 β. J. Mol. Biol. 2006;357:986–996. doi: 10.1016/j.jmb.2005.11.074. [DOI] [PubMed] [Google Scholar]
- 10.Whitford P.C., Noel J.K., Onuchic J.N. An all-atom structure-based potential for proteins: bridging minimal models with all-atom empirical forcefields. Proteins Struct. Funct. Bioinf. 2009;75:430–441. doi: 10.1002/prot.22253. [DOI] [PMC free article] [PubMed] [Google Scholar]
- 11.Levy Y., Onuchic J.N. Mechanisms of protein assembly: lessons from minimalist models. Acc. Chem. Res. 2006;39:135–142. doi: 10.1021/ar040204a. [DOI] [PubMed] [Google Scholar]
- 12.Yang S.C., Cho S.S., Onuchic J.N. Domain swapping is a consequence of minimal frustration. Proc. Natl. Acad. Sci. USA. 2004;101:13786–13791. doi: 10.1073/pnas.0403724101. [DOI] [PMC free article] [PubMed] [Google Scholar]
- 13.Lu Q., Lu H.P., Wang J. Exploring the mechanism of flexible biomolecular recognition with single molecule dynamics. Phys. Rev. Lett. 2007;98:128105. doi: 10.1103/PhysRevLett.98.128105. [DOI] [PubMed] [Google Scholar]
- 14.Whitford P.C., Miyashita O., Onuchic J.N. Conformational transitions of adenylate kinase: switching by cracking. J. Mol. Biol. 2007;366:1661–1671. doi: 10.1016/j.jmb.2006.11.085. [DOI] [PMC free article] [PubMed] [Google Scholar]
- 15.Schug A., Whitford P.C., Onuchic J.N. Mutations as trapdoors to two competing native conformations of the Rop-dimer. Proc. Natl. Acad. Sci. USA. 2007;104:17674–17679. doi: 10.1073/pnas.0706077104. [DOI] [PMC free article] [PubMed] [Google Scholar]
- 16.Best R.B., Chen Y.G., Hummer G. Slow protein conformational dynamics from multiple experimental structures: the helix/sheet transition of arc repressor. Structure. 2005;13:1755–1763. doi: 10.1016/j.str.2005.08.009. [DOI] [PubMed] [Google Scholar]
- 17.Zuckerman D.M. Simulation of an ensemble of conformational transitions in a united-residue model of calmodulin. J. Phys. Chem. B. 2004;108:5127–5137. [Google Scholar]
- 18.Lu Q., Wang J. Single molecule conformational dynamics of adenylate kinase: energy landscape, structural correlations, and transition state ensembles. J. Am. Chem. Soc. 2008;130:4772–4783. doi: 10.1021/ja0780481. [DOI] [PubMed] [Google Scholar]
- 19.Pincus D.L., Cho S.S., Thirumalai D. Molecular Biology of Protein Folding, Pt B, Vol. 84, Progress in Molecular Biology and Translational Science. Elsevier/Academic Press; Amsterdam, The Netherlands: 2008. Minimal models for proteins and RNA: from folding to function. [DOI] [PubMed] [Google Scholar]
- 20.Mickler M., Dima R.I., Rief M. Revealing the bifurcation in the unfolding pathways of GFP by using single-molecule experiments and simulations. Proc. Natl. Acad. Sci. USA. 2007;104:20268–20273. doi: 10.1073/pnas.0705458104. [DOI] [PMC free article] [PubMed] [Google Scholar]
- 21.Hills R.D., Brooks C.L. Insights from coarse-grained Gō models for protein folding and dynamics. Int. J. Mol. Sci. 2009;10:889–905. doi: 10.3390/ijms10030889. [DOI] [PMC free article] [PubMed] [Google Scholar]
- 22.Karanicolas J., Brooks C.L. Improved Gō-like models demonstrate the robustness of protein folding mechanisms towards non-native interactions. J. Mol. Biol. 2003;334:309–325. doi: 10.1016/j.jmb.2003.09.047. [DOI] [PubMed] [Google Scholar]
- 23.Ueda Y., Taketomi H., Gō N. Studies on protein folding, unfolding and fluctuations by computer simulation. I. The effects of specific amino acid sequence represented by specific inter-unit interactions. Int. J. Peptide Res. 1975;7:445–459. [PubMed] [Google Scholar]
- 24.Chavez L.L., Onuchic J.N., Clementi C. Quantifying the roughness on the free energy landscape: entropic bottlenecks and protein folding rates. J. Am. Chem. Soc. 2004;126:8426–8432. doi: 10.1021/ja049510+. [DOI] [PubMed] [Google Scholar]
- 25.Socci N.D., Onuchic J.N., Wolynes P.G. Diffusive dynamics of the reaction coordinate for protein folding funnels. J. Chem. Phys. 1996;104:5860–5868. [Google Scholar]
- 26.Baumketner A., Hiwatari Y. Diffusive dynamics of protein folding studied by molecular dynamics simulations of an off-lattice model. Phys. Rev. E Stat. Nonlin. Soft Matter Phys. 2002;66:011905. doi: 10.1103/PhysRevE.66.011905. [DOI] [PubMed] [Google Scholar]
- 27.Pande V.S., Grosberg A.Y., Tanaka T. On the theory of folding kinetics for short proteins. Fold. Des. 1997;2:109–114. doi: 10.1016/s1359-0278(97)00015-1. [DOI] [PubMed] [Google Scholar]
- 28.Du R., Pande V.S., Shakhnovich E.S. On the transition coordinate for protein folding. J. Chem. Phys. 1998;108:334–350. [Google Scholar]
- 29.Pande V.S., Rokhsar D.S. Molecular dynamics simulations of unfolding and refolding of a β-hairpin fragment of protein G. Proc. Natl. Acad. Sci. USA. 1999;96:9062–9067. doi: 10.1073/pnas.96.16.9062. [DOI] [PMC free article] [PubMed] [Google Scholar]
- 30.Lee C.L., Stell G., Wang J. First-passage time distribution and non-Markovian diffusion dynamics of protein folding. J. Chem. Phys. 2003;118:959–968. doi: 10.1103/PhysRevE.67.041905. [DOI] [PubMed] [Google Scholar]
- 31.Lee C.L., Lin C.T., Wang J. Diffusion dynamics, moments, and distribution of first-passage time on the protein-folding energy landscape, with applications to single molecules. Phys. Rev. E Stat. Nonlin. Soft Matter Phys. 2003;67:041905. doi: 10.1103/PhysRevE.67.041905. [DOI] [PubMed] [Google Scholar]
- 32.Chahine J., Oliveira R.J., Wang J. Configuration-dependent diffusion can shift the kinetic transition state and barrier height of protein folding. Proc. Natl. Acad. Sci. USA. 2007;104:14646–14651. doi: 10.1073/pnas.0606506104. [DOI] [PMC free article] [PubMed] [Google Scholar]
- 33.Yang S., Onuchic J.N., Levine H. Effective stochastic dynamics on a protein folding energy landscape. J. Chem. Phys. 2006;125:054910–054918. doi: 10.1063/1.2229206. [DOI] [PubMed] [Google Scholar]
- 34.Yang S., Onuchic J.N., Levine H. Folding time predictions from all-atom replica exchange simulations. J. Mol. Biol. 2007;372:756–763. doi: 10.1016/j.jmb.2007.07.010. [DOI] [PubMed] [Google Scholar]
- 35.Cho S.S., Levy Y., Wolynes P.G. P versus Q: structural reaction coordinates capture protein folding on smooth landscapes. Proc. Natl. Acad. Sci. USA. 2006;103:586–591. doi: 10.1073/pnas.0509768103. [DOI] [PMC free article] [PubMed] [Google Scholar]
- 36.Kremer W., Schuler B., Kalbitzer H.R. Solution NMR structure of the cold-shock protein from the hyperthermophilic bacterium Thermotoga maritima. Eur. J. Biochem. 2001;268:2527–2539. doi: 10.1046/j.1432-1327.2001.02127.x. [DOI] [PubMed] [Google Scholar]
- 37.Nettels D., Gopich I.V., Schuler B. Ultrafast dynamics of protein collapse from single-molecule photon statistics. Proc. Natl. Acad. Sci. USA. 2007;104:2655–2660. doi: 10.1073/pnas.0611093104. [DOI] [PMC free article] [PubMed] [Google Scholar]
- 38.Hoffmann A., Kane A., Schuler B. Mapping protein collapse with single-molecule fluorescence and kinetic synchrotron radiation circular dichroism spectroscopy. Proc. Natl. Acad. Sci. USA. 2007;104:105–110. doi: 10.1073/pnas.0604353104. [DOI] [PMC free article] [PubMed] [Google Scholar]
- 39.Nettels D., Gopich I.V., Schuler B. Unfolded protein and peptide dynamics investigated with single-molecule FRET and correlation spectroscopy from picoseconds to seconds. J. Phys. Chem. 2008;112:6137–6146. doi: 10.1021/jp076971j. [DOI] [PubMed] [Google Scholar]
- 40.Karplus M., Weaver D.L. Protein folding dynamics: the diffusion-collision model and experimental data. Protein Sci. 1994;3:650–668. doi: 10.1002/pro.5560030413. [DOI] [PMC free article] [PubMed] [Google Scholar]
- 41.Kubelka J., Chiu T.K., Hofrichter J. Sub-microsecond protein folding. J. Mol. Biol. 2006;359:546–553. doi: 10.1016/j.jmb.2006.03.034. [DOI] [PubMed] [Google Scholar]
- 42.Gruebele M. Downhill protein folding: evolution meets physics. C. R. Biol. 2005;328:701–712. doi: 10.1016/j.crvi.2005.02.007. [DOI] [PubMed] [Google Scholar]
- 43.Bryngelson J.D., Wolynes P.G. Intermediates and barrier crossing in a random energy-model (with applications to protein folding) J. Phys. Chem. 1989;93:6902–6915. [Google Scholar]
- 44.Kubelka J., Hofrichter J., Eaton W.A. The protein folding ‘speed limit’. Curr. Opin. Struct. Biol. 2004;14:76–88. doi: 10.1016/j.sbi.2004.01.013. [DOI] [PubMed] [Google Scholar]
- 45.Oliveberg M., Wolynes P.G. The experimental survey of protein-folding energy landscapes. Q. Rev. Biophys. 2005;38:245–288. doi: 10.1017/S0033583506004185. [DOI] [PubMed] [Google Scholar]
- 46.Hummer G. Position-dependent diffusion coefficients and free energies from Bayesian analysis of equilibrium and replica molecular dynamics simulations. N. J. Phys. 2005;7:34–48. [Google Scholar]
- 47.Best R.B., Hummer G. Coordinate-dependent diffusion in protein folding. Proc. Natl. Acad. Sci. USA. 2010;107:1088–1093. doi: 10.1073/pnas.0910390107. [DOI] [PMC free article] [PubMed] [Google Scholar]
- 48.Nettels D., Müller-Späth S., Schuler B. Single-molecule spectroscopy of the temperature-induced collapse of unfolded proteins. Proc. Natl. Acad. Sci. USA. 2009;106:20740–20745. doi: 10.1073/pnas.0900622106. [DOI] [PMC free article] [PubMed] [Google Scholar]
- 49.Krivov S.V., Karplus M. Diffusive reaction dynamics on invariant free energy profiles. Proc. Natl. Acad. Sci. USA. 2008;105:13841–13846. doi: 10.1073/pnas.0800228105. [DOI] [PMC free article] [PubMed] [Google Scholar]
- 50.Perl D., Welker C., Schmid F.X. Conservation of rapid two-state folding in mesophilic, thermophilic and hyperthermophilic cold shock proteins. Nat. Struct. Biol. 1998;5:229–235. doi: 10.1038/nsb0398-229. [DOI] [PubMed] [Google Scholar]
- 51.Wassenberg D., Welker C., Jaenicke R. Thermodynamics of the unfolding of the cold-shock protein from Thermotoga maritima. J. Mol. Biol. 1999;289:187–193. doi: 10.1006/jmbi.1999.2772. [DOI] [PubMed] [Google Scholar]
- 52.Schuler B., Kremer W., Jaenicke R. Role of entropy in protein thermostability: folding kinetics of a hyperthermophilic cold shock protein at high temperatures using 19F NMR. Biochemistry. 2002;41:11670–11680. doi: 10.1021/bi026293l. [DOI] [PubMed] [Google Scholar]
- 53.Schuler B., Lipman E.A., Eaton W.A. Probing the free-energy surface for protein folding with single-molecule fluorescence spectroscopy. Nature. 2002;429:743–747. doi: 10.1038/nature01060. [DOI] [PubMed] [Google Scholar]
- 54.Sobolev V., Wade R., Edelman M. Molecular docking using surface complementarity. Proteins Struct. Funct. Genet. 1996;25:120–129. doi: 10.1002/(SICI)1097-0134(199605)25:1<120::AID-PROT10>3.0.CO;2-M. [DOI] [PubMed] [Google Scholar]
- 55.Torrie G.M., Valleau J.P. Nonphysical sampling distributions in Monte Carlo free-energy estimation—umbrella sampling. J. Comput. Phys. 1977;23:187–199. [Google Scholar]
- 56.Bartels C., Karplus M. Multidimensional adaptive umbrella sampling: applications to main chain and side chain peptide conformations. J. Comput. Phys. 1997;18:1450–1462. [Google Scholar]
- 57.Matouschek A., Kellis J.T., Fersht A.R. Mapping the transition state and pathway of protein folding by protein engineering. Nature. 1989;340:122–126. doi: 10.1038/340122a0. [DOI] [PubMed] [Google Scholar]
- 58.Fersht A.R. Characterizing transition states in protein folding: an essential step in the puzzle. Curr. Opin. Struct. Biol. 1995;5:79–84. doi: 10.1016/0959-440x(95)80012-p. [DOI] [PubMed] [Google Scholar]
- 59.Nymeyer H., Socci N.D., Onuchic J.N. Landscape approaches for determining the ensemble of folding transition states: success and failure hinge on the degree of frustration. Proc. Natl. Acad. Sci. USA. 2000;97:634–639. doi: 10.1073/pnas.97.2.634. [DOI] [PMC free article] [PubMed] [Google Scholar]
- 60.Onuchic J.N., Luthey-Schulten Z., Wolynes P.G. Theory of protein folding: the energy landscape perspective. Annu. Rev. Phys. Chem. 1997;48:545–600. doi: 10.1146/annurev.physchem.48.1.545. [DOI] [PubMed] [Google Scholar]
- 61.Reference deleted in proof.
- 62.Plotkin S.S. Speeding protein folding beyond the Gō model: how a little frustration sometimes helps. Proteins Struct. Funct. Genet. 2001;45:337–345. doi: 10.1002/prot.1154. [DOI] [PubMed] [Google Scholar]
- 63.Clementi C., Plotkin S.S. The effects of nonnative interactions on protein folding rates: theory and simulation. Protein Sci. 2004;13:1750–1766. doi: 10.1110/ps.03580104. [DOI] [PMC free article] [PubMed] [Google Scholar]
- 64.Fan K., Wang J., Wang W. Folding of lattice protein chains with modified Gō potential. Eur. Phys. J. B. 2002;30:381–391. [Google Scholar]
- 65.Li L., Mirny L.A., Shakhnovich E.I. Kinetics, thermodynamics and evolution of non-native interactions in a protein folding nucleus. Nature. 2000;7:336–342. doi: 10.1038/74111. [DOI] [PubMed] [Google Scholar]
- 66.Treptow W.L., Barbosa M.A.A., de Araújo A.F.P. Non-native interactions, effective contact order, and protein folding: a mutational investigation with the energetically frustrated hydrophobic model. Proteins Struct. Funct. Bioinf. 2002;49:167–180. doi: 10.1002/prot.10166. [DOI] [PubMed] [Google Scholar]
- 67.Garcia L.G., de Araújo A.F.P. Folding pathway dependence on energetic frustration and interaction heterogeneity for a three-dimensional hydrophobic protein model. Proteins Struct. Funct. Bioinf. 2006;62:46–63. doi: 10.1002/prot.20711. [DOI] [PubMed] [Google Scholar]
- 68.Morton V.L., Friel C.T., Radford S.E. The effect of increasing the stability of non-native interactions on the folding landscape of the bacterial immunity protein Im9. J. Mol. Biol. 2007;371:554–568. doi: 10.1016/j.jmb.2007.05.010. [DOI] [PubMed] [Google Scholar]
- 69.Hamada D., Goto Y. The equilibrium intermediate of β-lactoglobulin with non-native α-helical structure. J. Mol. Biol. 1997;269:479–487. doi: 10.1006/jmbi.1997.1055. [DOI] [PubMed] [Google Scholar]
- 70.Viguera A.R., Vega C., Serrano L. Unspecific hydrophobic stabilization of folding transition states. Proc. Natl. Acad. Sci. USA. 2002;99:5349–5354. doi: 10.1073/pnas.072387799. [DOI] [PMC free article] [PubMed] [Google Scholar]
- 71.Di Nardo A.A., Korzhnev D.M., Davidson A.R. Dramatic acceleration of protein folding by stabilization of a nonnative backbone conformation. Proc. Natl. Acad. Sci. USA. 2004;101:7954–7959. doi: 10.1073/pnas.0400550101. [DOI] [PMC free article] [PubMed] [Google Scholar]
- 72.Neudecker P., Zarrine-Afsar A., Kay L.E. Identification of a collapsed intermediate with non-native long-range interactions on the folding pathway of a pair of Fyn SH3 domain mutants by NMR relaxation dispersion spectroscopy. J. Mol. Biol. 2006;363:958–976. doi: 10.1016/j.jmb.2006.08.047. [DOI] [PubMed] [Google Scholar]
- 73.Shan B., Eliezer D., Raleigh D.P. The unfolded state of the C-terminal domain of the ribosomal protein L9 contains both native and non-native structure. Biochemistry. 2009;48:4707–4719. doi: 10.1021/bi802299j. [DOI] [PMC free article] [PubMed] [Google Scholar]
- 74.Weinkam P., Pletneva E.V., Wolynes P.G. Electrostatic effects on funneled landscapes and structural diversity in denatured protein ensembles. Proc. Natl. Acad. Sci. USA. 2009;106:1796–1801. doi: 10.1073/pnas.0813120106. [DOI] [PMC free article] [PubMed] [Google Scholar]
- 75.Frauenfelder H., Sligar S.G., Wolynes P.G. The energy landscapes and motions of proteins. Science. 1991;254:1598–1603. doi: 10.1126/science.1749933. [DOI] [PubMed] [Google Scholar]
- 76.Paci E., Vendruscolo M., Karplus M. Native and non-native interactions along protein folding and unfolding pathways. Proteins Struct. Funct. Genet. 2002;47:379–392. doi: 10.1002/prot.10089. [DOI] [PubMed] [Google Scholar]
- 77.Das P., Matysiak S., Clementi C. Balancing energy and entropy: a minimalist model for the characterization of protein folding landscapes. Proc. Natl. Acad. Sci. USA. 2005;102:10141–10146. doi: 10.1073/pnas.0409471102. [DOI] [PMC free article] [PubMed] [Google Scholar]
- 78.Perl D., Holtermann G., Schmid F.X. Role of the chain termini for the folding transition state of the cold shock protein. Biochemistry. 2001;40:15501–15511. doi: 10.1021/bi011378s. [DOI] [PubMed] [Google Scholar]
- 79.Wagner C., Kiefhaber T. Intermediates can accelerate protein folding. Proc. Natl. Acad. Sci. USA. 1999;96:6716–6721. doi: 10.1073/pnas.96.12.6716. [DOI] [PMC free article] [PubMed] [Google Scholar]
- 80.Sinha K.K., Udgaonkar J.B. Barrierless evolution of structure during the submillisecond refolding reaction of a small protein. Proc. Natl. Acad. Sci. USA. 2008;105:7998–8003. doi: 10.1073/pnas.0803193105. [DOI] [PMC free article] [PubMed] [Google Scholar]
- 81.Cho S.S., Weinkam P., Wolynes P.G. Origins of barriers and barrierless folding in BBL. Proc. Natl. Acad. Sci. USA. 2008;105:118–123. doi: 10.1073/pnas.0709376104. [DOI] [PMC free article] [PubMed] [Google Scholar]
- 82.Humphrey W., Dalke A., Schulten K. VMD: visual molecular dynamics. J. Mol. Graph. 1996;14:33–38. doi: 10.1016/0263-7855(96)00018-5. 27–28. [DOI] [PubMed] [Google Scholar]
Associated Data
This section collects any data citations, data availability statements, or supplementary materials included in this article.