Abstract
A longstanding question in biology is whether there is an intrinsic mechanism for coordinating growth and cell cycle in metazoan cells. We have examined cell size distributions in populations of lymphoblasts and applied a novel mathematical analysis to calculate accurately how growth rates vary with both cell size and the cell cycle. Our results show that growth rate is size-dependent throughout the cell cycle. After initial growth suppression there is a rapid increase in growth rate in G1, followed by a constant exponential growth phase. The probability of cell division varies independently with cell size and cell age. We conclude that proliferating mammalian cells have an intrinsic mechanism that maintains cell size.
A cell’s growth may have a complex relationship to milestones in its life, specifically to its position in the cell cycle. In one model, growth rate is proportional to cell size at any time during the cell cycle (in whatever terms size is measured, e.g. volume, mass, or protein content); this constitutes exponential growth for an individual cell. Alternatively, the growth rate might be constant, producing a linear increase in size (1, 2). These alternative models have important implications for how cell size is regulated. Specifically, at division the size of the daughter cells is variable. If the larger daughter grows more rapidly than the smaller, as in the exponential model, cell size variation in the population would increase in each generation. Because this does not occur, we know that if growth is exponential, or more generally, if it increases with cell size, some mechanism must limit size variation in cells (3–5).
In budding yeast there is evidence for both a size dependent growth rate (6) and for a process that coordinates growth with division in a way that potentially limits size variation (1, 7–9). Whether there are similar growth controls in bacteria remains controversial (10–12). In metazoan cells, it is unclear whether such regulation exists at all. Since somatic cells do not grow as isolated cells, their size regulation might simply be the result of separate growth and mitogenic signals from the environment. Studies on primary Schwann cells suggest such a model; here there is evidence for a constant rate of growth independent of cell size (13–15). Yet, these conclusions are also controversial (16, 17), and other measurements of growth in mammalian cells have suggested that growth rate is proportional to size (18); suggesting a cell-sizing mechanism (19).
Attempts to measure growth during the cell cycle from time series measurements confront major challenges: First, to obtain this information requires accuracy that is presently unattainable (2). Distinguishing between exponential and linear growth would need a resolution of <6% in volume (see supplementary online material (SOM); Mathematical Appendix). Even careful interferometric measurements in the classic experiments by A. Zetterberg and D. Killander failed to reach clear conclusions regarding the kinetics of cell growth (20, 21).
Attempts to reduce errors by measuring large populations of cells to improve statistical accuracy foundered on the need to synchronize cells without affecting growth. Cell cycle inhibitors induce synchrony by blocking the nuclear cycle, but their effects on growth are unclear. Other perturbations, such as trypsinization, elutriation, and mitotic shake-off can also perturb the population in ways that are hard to evaluate (22). In the 1960s elegant mathematical approaches for extracting the dependence of the rate of cell growth versus cell size were developed (12, 23). These depend on isolating pure populations of both newborn and dividing cells, which was difficult to achieve. Moreover, even with perfect data the analysis is ambiguous and incorrect, as we shall demonstrate. We have now overcome these difficulties by combining a new gentle cell synchronization technique (24) with a novel mathematical analysis to determine accurately the growth function for lymphoblastoid leukemia cells.
Measuring the size dependency of growth in asynchronous populations
To calculate the dependence of growth rate on size, we applied a method that analyzes an asynchronous population at steady-state, proposed by Collins and Richmond in 1962 (12). Specifically, at steady state the number of cells smaller than size s increases only when cells larger than s divide and decreases only when cells smaller than s grow in size. Since, the proportion of cells of any given size does not change with time, these two numbers must be equal (see Fig. S1 in SOM).
Despite its mathematical simplicity, the Collins-Richmond method has been traditionally difficult to implement. In addition to the readily obtainable asynchronous size distribution, the method requires the size distribution of both the newborn subpopulation and the distribution of cells just before they divide; both of which are difficult to obtain. Using assumptions of unknown validity, the method has been used to suggest an exponential cell growth rate for bacteria (12) and for mammalian cells (18).
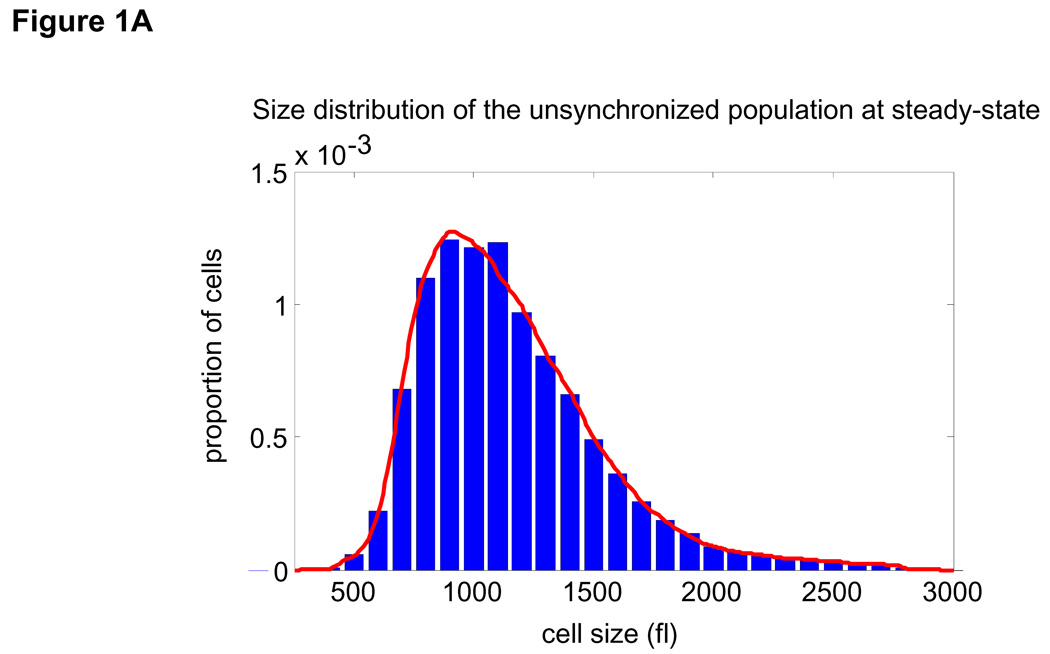
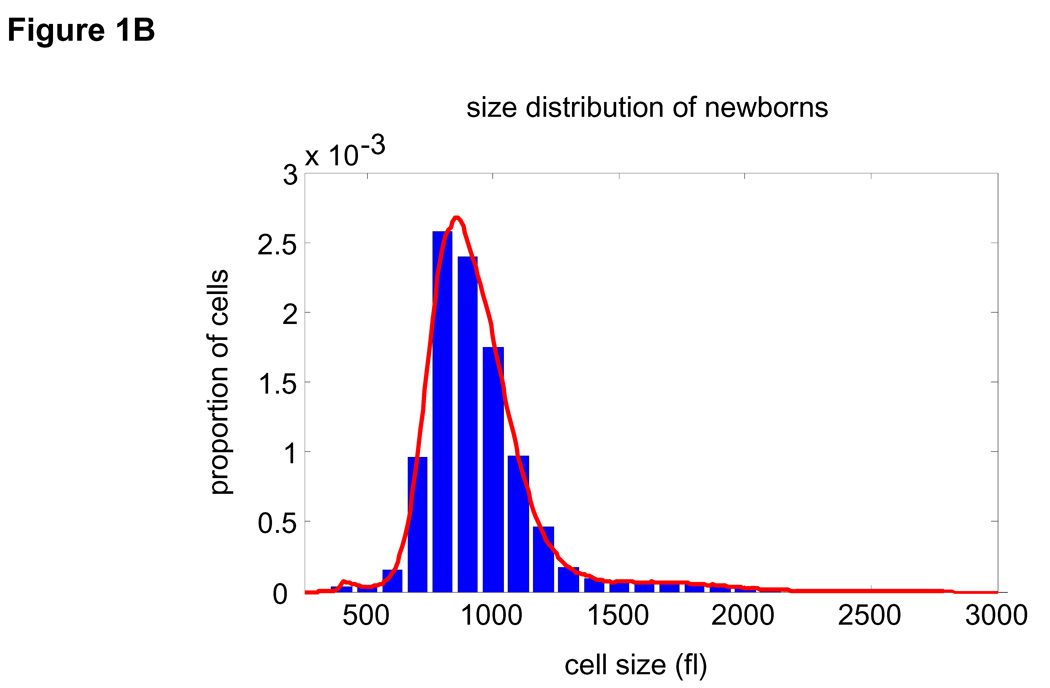
We can now obtain these distributions without unproven assumptions. To obtain the subpopulation of newborns, mouse lymphoblasts, (L1210) were grown on a coated nitrocellulose membrane, constantly bathed in a closed system (24). As cells divide, one of the two daughters detaches from the membrane and the newborn cells are gently eluted. The remaining daughters can grow and divide, continually providing newborn cells. Two of the three needed size distributions are thus readily measured by Coulter Counter®: those for the unsynchronized (Fig. 1A) and the newborn populations (Fig. 1B).
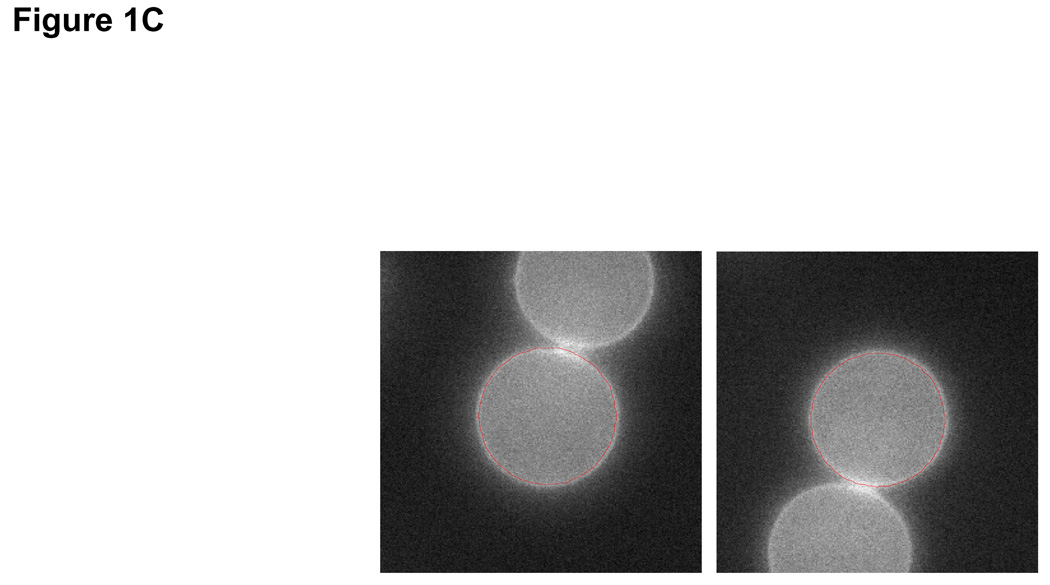
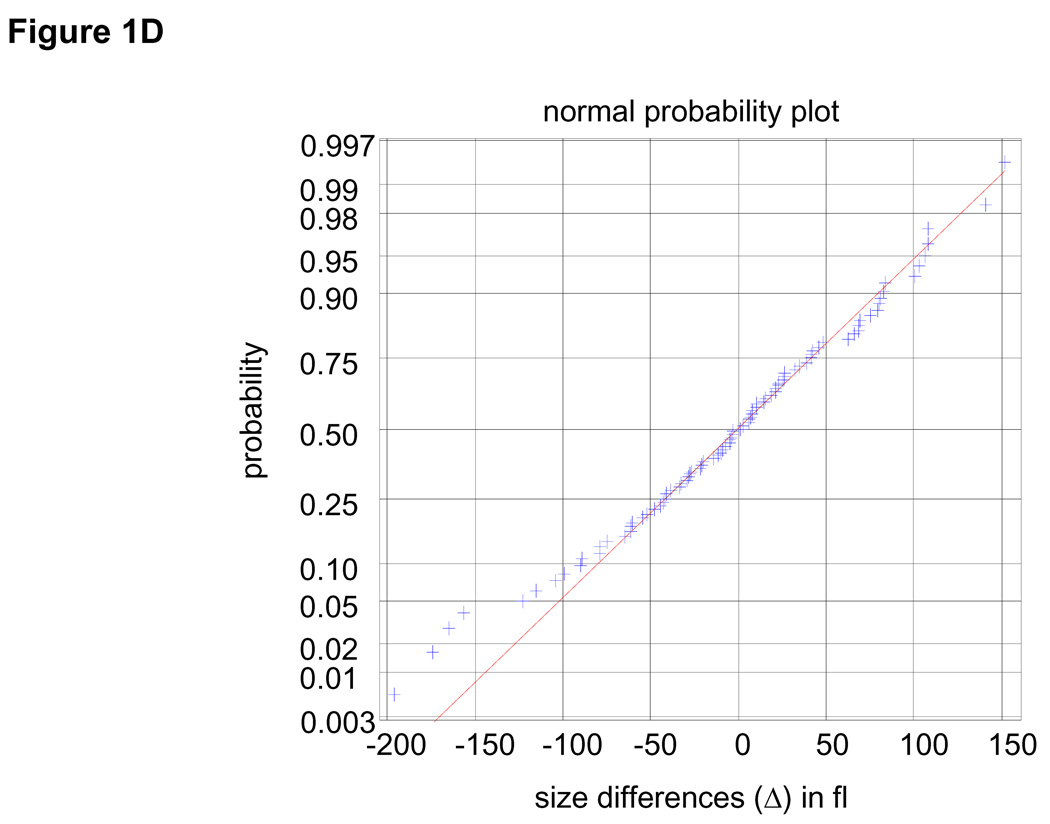
Figure 1. Extracting parameters for calculating the size-dependency of cell growth rate.
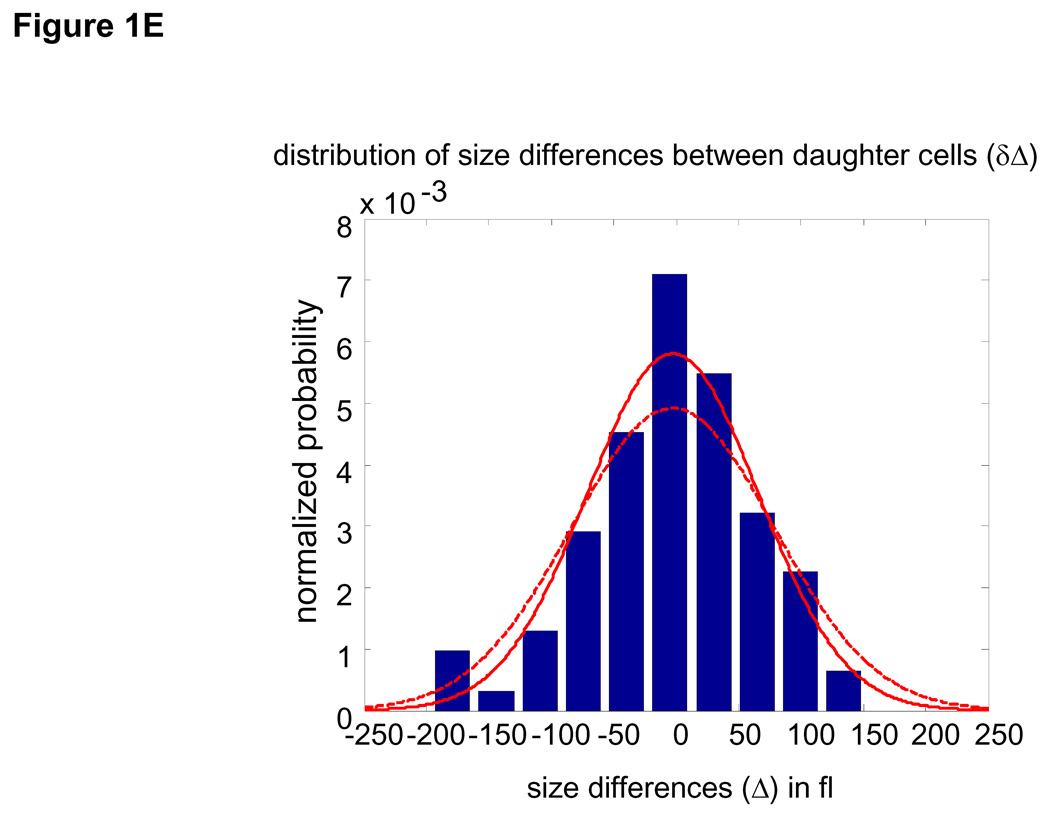
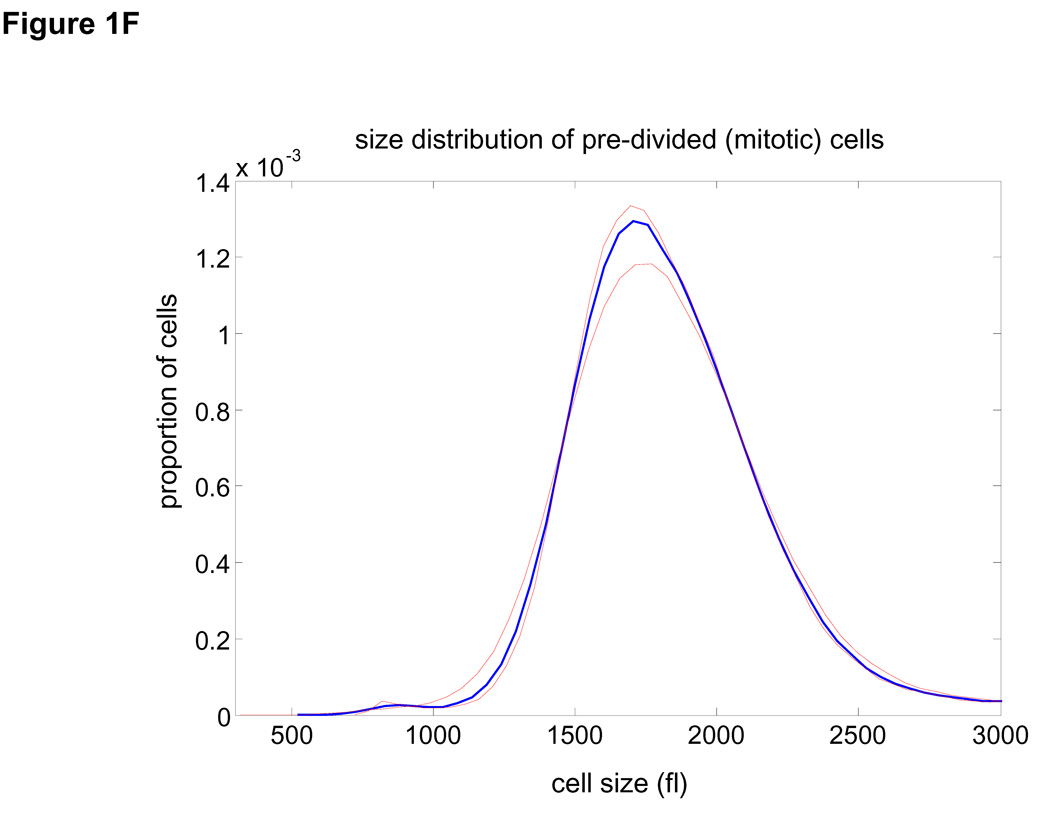
Size distribution of (A) asynchronous steady-state and (B) newborns populations are shown by histograms (blue) and kernel density estimates (red). (C) L1210 cells, membrane labeled with GFP were imaged while exiting mitosis. Each cell was fitted a circle at maximum diameter. See SOM for details and error (D) A quantile normal plot showing the normality of the daughter cell volume differences, Δ. (E) A single parameter for the variance, σ2, of the Gaussian estimate (red) for the distribution, δ(Δ). Also shown is the distribution corresponding to the upper confidence interval of the Gaussian estimate (dashed red). (F) Mitotic size distribution calculated by convolving newborn size distribution with δ(Δ). Confidence intervals of δ(Δ) distribution were utilized to generate the confidence of the mitotic size distribution (shown in red). See SOM for details.
It is very difficult to isolate a uniform population of cells just before they divide. Instead, we calculate the mitotic (pre-division) size distribution by combining the size distribution of newborns (Fig. 1B) with an experimentally determined size correlation between two daughter cells (Fig. 1C–E). Specifically, the mitotic size distribution, fm(s) (Fig. 1F), was extracted from the convolution fm(s) = (f0 * δ)(s) where δ(Δ) is the distribution of the difference, Δ, in size between daughter cells emerging from mitosis (subtraction directionality is random) and f0 is the size distribution of newborns. This calculation is only valid to the extent that Δ is independent of cell size, which we confirm experimentally (See Statistics and Fig. S9 in SOM). Volume differences between daughter cells closely follow a Gaussian distribution (σ=66.8 fl±10) and correspond to 7% of mean newborn volume. Comparing this value with the size variation of unrelated newborns (20.4%) demonstrates the remarkable accuracy of cytokinesis.
We thus have the data needed for the Collins-Richmond method without unproven assumptions. Eq. 1 expresses the cell growth rate, υ, as a function of cell size, s, from the three measurements: i) the asynchronous size probability distribution, fa(s) (or Fa(s) in its cumulative form); ii) the newborn cumulative size probability distribution, F0(s) and iii) the distribution of differences between newborns, δ(Δ). Here, α is the fraction of dividing cells per unit time.
| (1) |
The three terms represent the fact that the actual increase of cell number in a steady-state population (see ‘population increase’ in Eq. 1) must be balanced by cell growth rate (υ) on one hand and division rate, i.e. ‘newborns’ and ‘mitotics’ on the other hand (see Fig. S1).
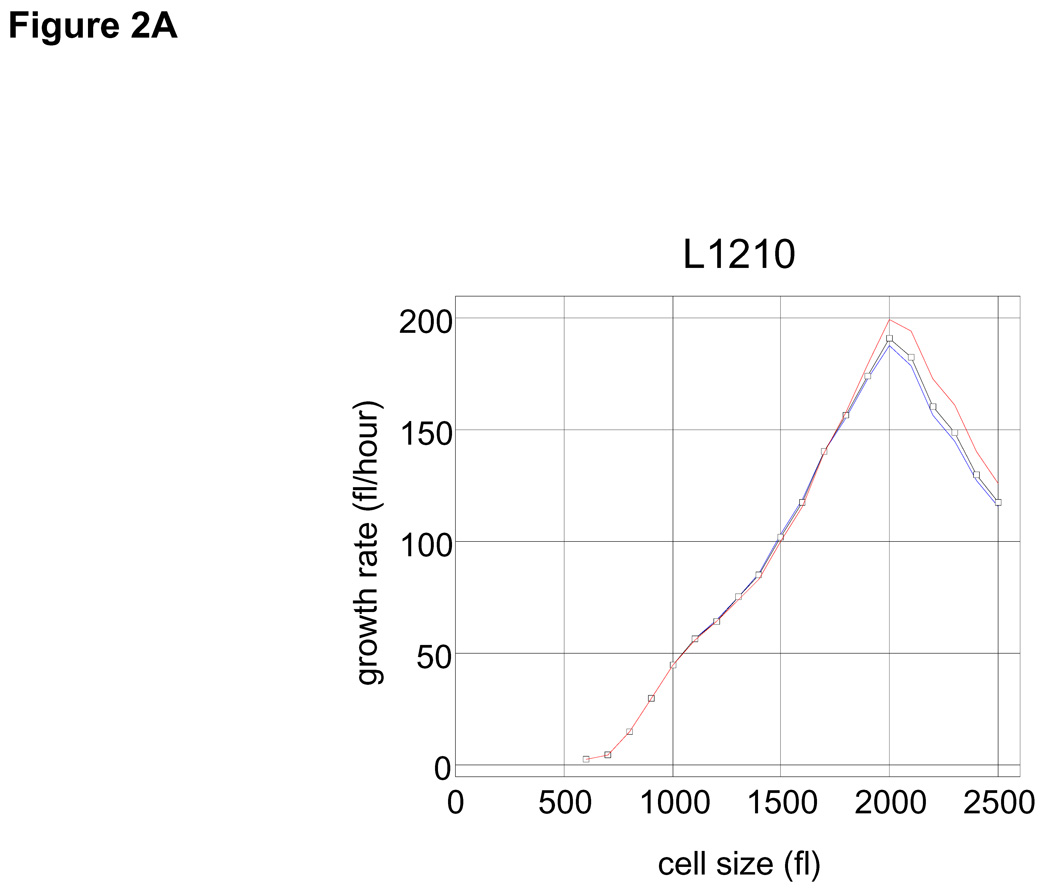
Applying Eq. 1 to our datasets shows how the growth rate varies with cell size in the asynchronous population. Plots for L1210 mouse lymphoblasts (Fig. 2A) and human lymphoblasts MOLT4 (SOM; Fig. S2) show similar relationships of growth rate and size. In both cell lines, larger cells are observed to have higher growth rates throughout the most of the cell size range. However, beyond a critical size (2000 fl for L1210, 2500 fl for MOLT4) the trend is reversed and growth rates decline with increased size (Fig. 2A and Fig. S2). It should be noted that 65% of the L1210 population would have divided before reaching this size.
Figure 2. Growth rate as a function of cell size.
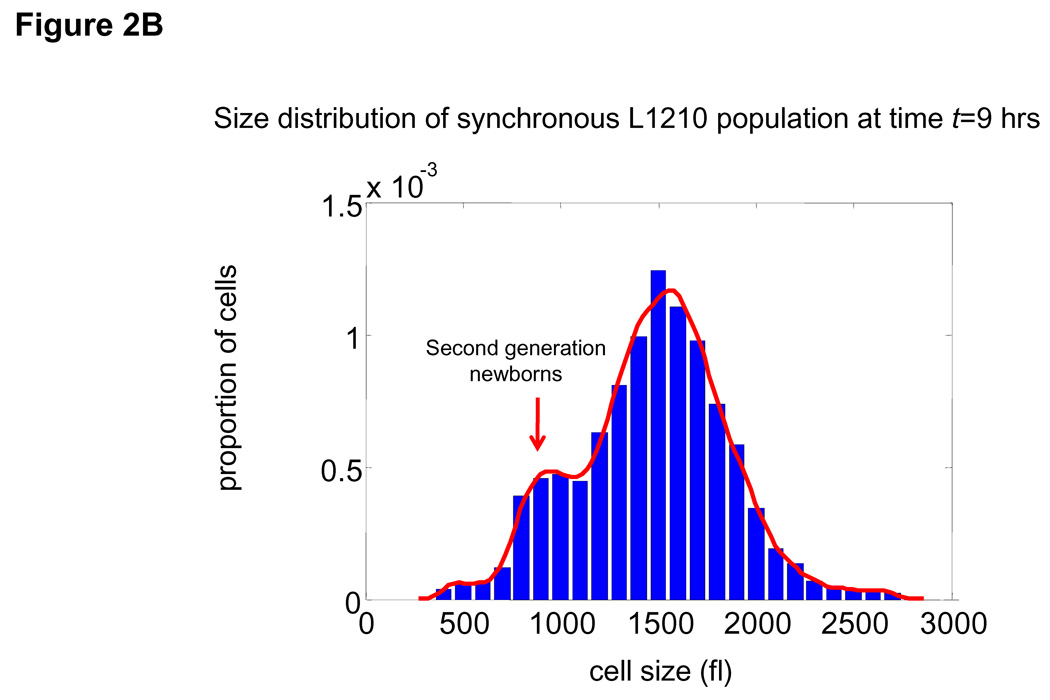
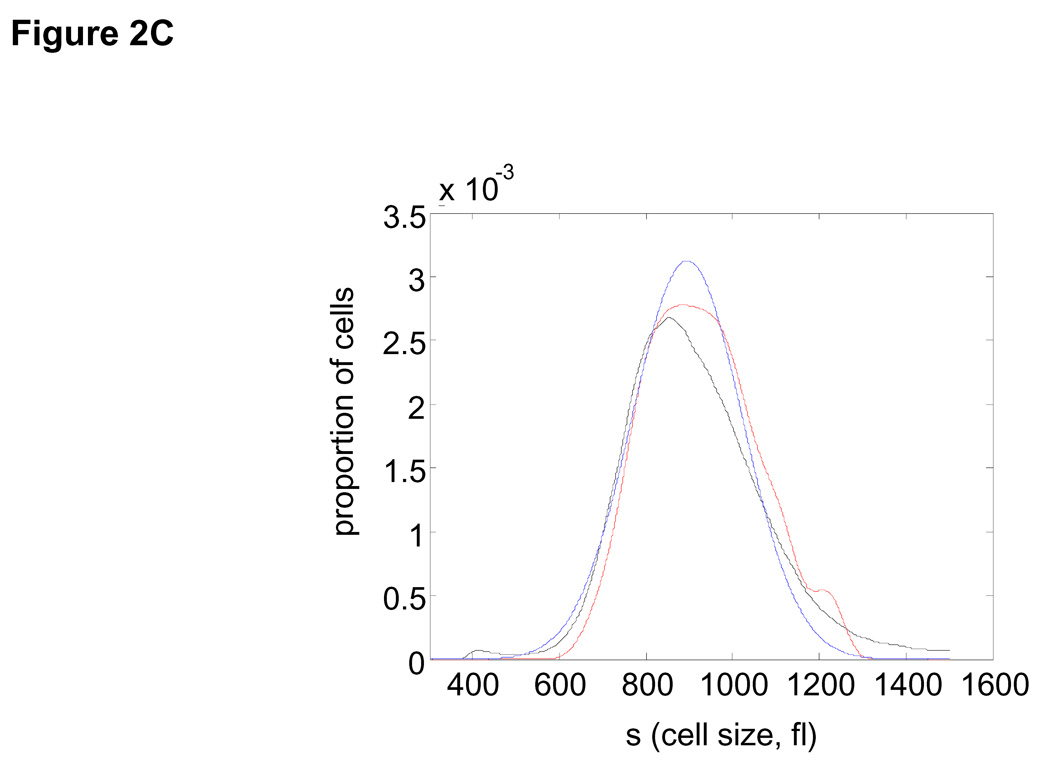
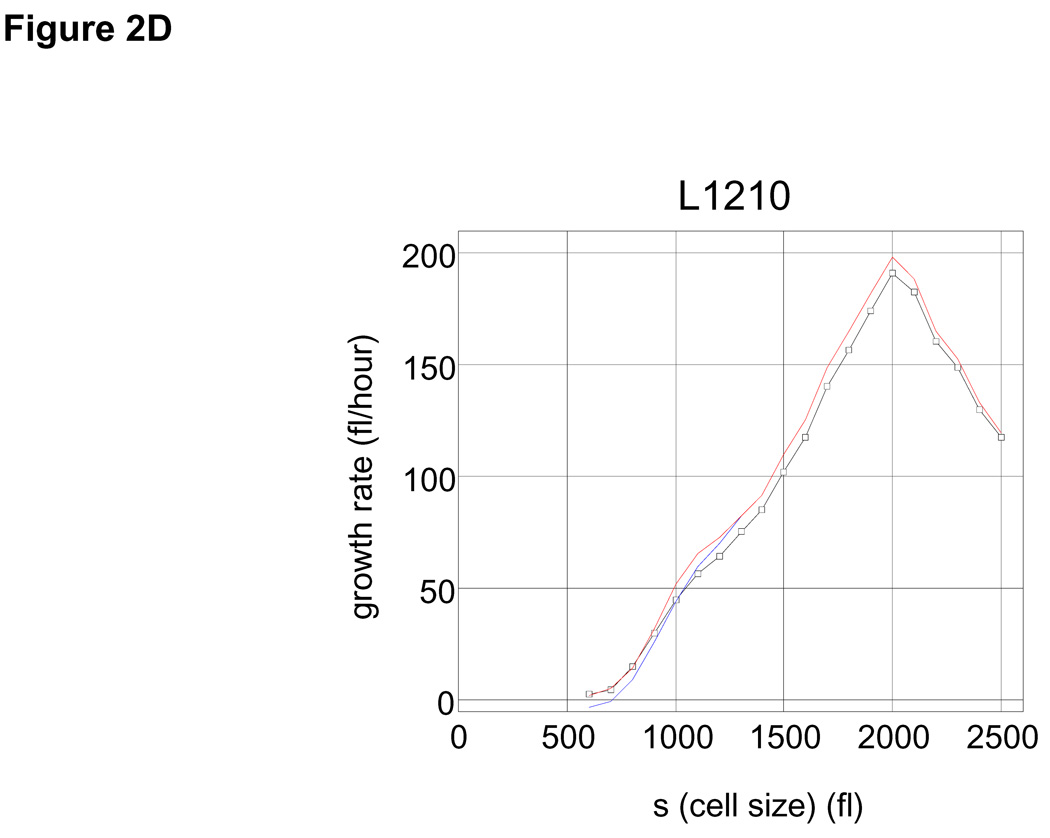
(A) Mean growth rate (fl/hour) is shown as a function of cell size (fl) for L1210 cells. Curve (black) was calculated from the Coulter Counter® measurements of asynchronous size distribution (106 cells), and the size distribution of newborns (105 cells) together with the daughter cell correlation (see Fig. 1) using the Collins-Richmond method. Also shown are the curves based on the assumption of symmetric division (blue) and on a variance for daughter cell differences that is 2 times higher than the measured value (red). Due to the large numbers of cells in the datasets, errors in growth rate obtained from this calculation are less than 1 fl/hour (see SOM). (B) Bimodal size distribution of synchronous L1210 population at time t = 9 hrs. The left mode represents second generation newborns generated completely in suspension. (C) The similarity in the size distribution of the newborns freshly eluted from membrane compared to the size distribution of newborns generated in suspension. The black line corresponds to the size distribution of eluted newborns. We calculate the size distribution of the second generation newborns (blue). The two size modes at t=9 hrs were separated using a Gaussian extrapolation. In red is an alternative extrapolation of the same distribution obtained by a method used later in the study to calculate the probabilities of cell division (see text). (D) Collins-Richmond growth plot (black) was recalculated using second generation newborns. Red and blue curves represent the different methods of extrapolating newborns.
Though release of the unattached daughter cell would appear to be a gentle and unperturbing, there is still concern that the daughter cell size distribution could be affected by the membrane. To test for this we examined the size distribution of newborns produced completely in suspension, at the start of the second cell cycle (Fig. 2B). As shown in Fig. 2C this estimated newborn distribution is very similar to that of the newborns obtained directly by elution and when integrated into the Collins-Richmond equation the plot is nearly identical to that calculated from the eluted newborns (Fig. 2D).
Although growth rate appears to depend on size, growth rate heterogeneity in the population for each cell size can weaken this conclusion (See SOM). Thus, even with a complete data set, such as the one we have obtained, the Collins-Richmond method is inadequate to portray the growth of an individual cell over time. Resolution requires additional information that we obtain from an analysis of growth as a function of time.
Time dependency of growth
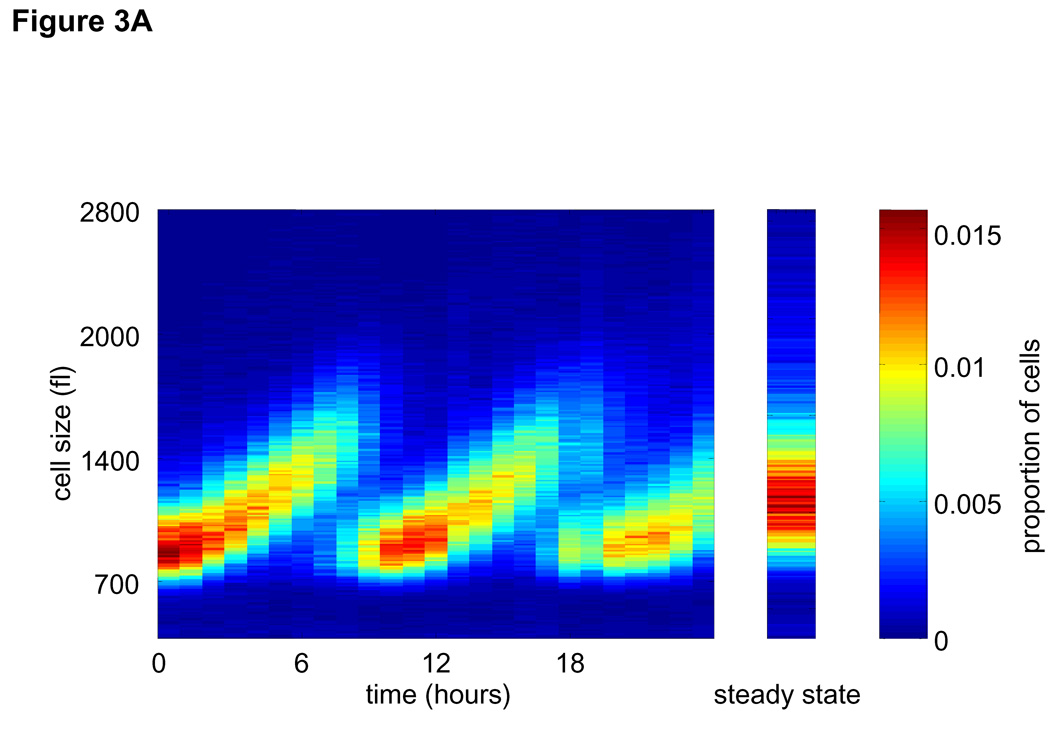
The synchrony of newborns eluted from the membrane allowed us to follow the change in the distribution of cell size with time (Fig. 3A). Specifically, we compared pairs of size distributions, fn and fn+1, sampled from the synchronized population at one hour intervals, Δt = tn+1 − tn = 1 hour. Within such short time intervals growth of any single cell, i, can be accurately estimated by a simple linear function, , regardless of the underlying complexity of the ‘real’ growth function (see SOM; pp, 13–22). Here, is the growth constant of cell i in time interval n, i.e. time interval (tn, tn+1). Cell to cell variation in growth rates is captured by the distribution of values in each of the time intervals. Our aim is to calculate the average rate, βn, at which cells grow in each time interval, as well as provide an estimate for the cell-to-cell variation. We use βn to denote the average of all values in time interval n, i.e.
Figure 3. Growth rate as a function of cell cycle.
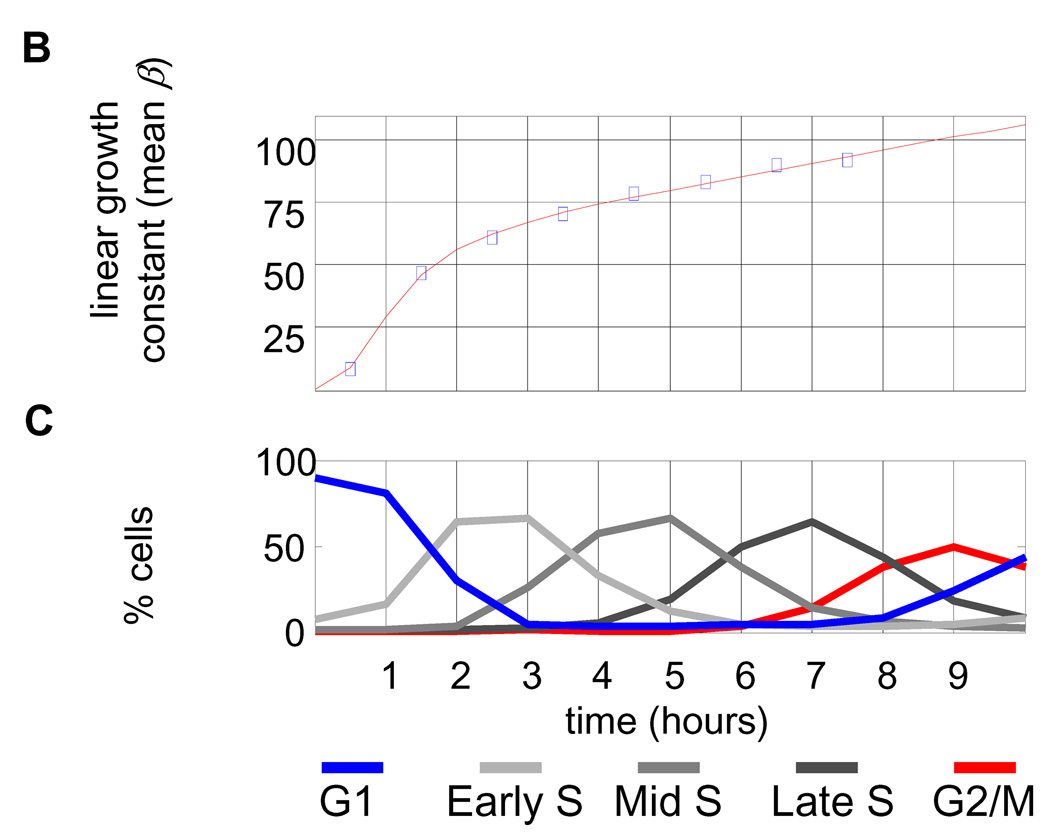
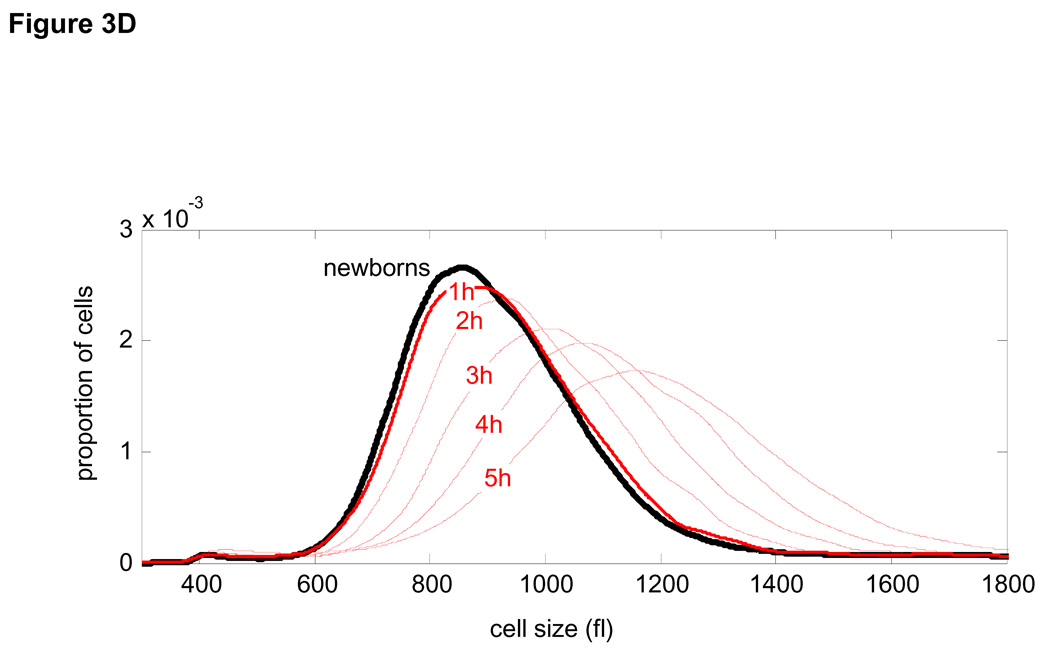
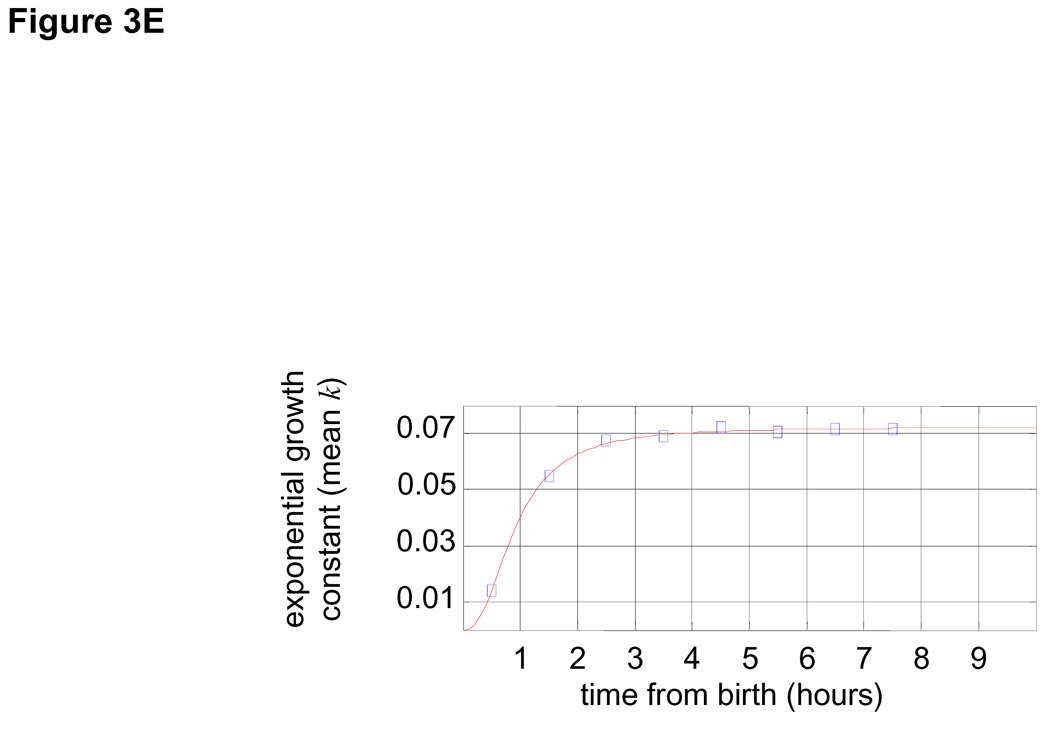
(A) Newborn L1210 cells were incubated at 37°C. Aliquots of cells were taken every hour from zero to 24 hours to measure the size distribution of the synchronous population as it progress through 2.5 cycles. Proportions of cells at any given size are visualized by color (see color bar at the right). Also shown the time-invariant steady-state distribution of the asynchronous population (right panel). (B) The mean linear ,βn , growth constants for each of the time intervals were calculated from Eq. 2 and are expressed in fl/hour. Also shown is the distribution of cell cycle stages (C). (D) Growth repression visualized from raw size distribution measurements. Size distributions of the synchronized L1210 population are shown for early times in cell cycle just after release from the membrane, The size distribution of newborns (black) is compared with distributions from times t=1 hour (red, solid) and times t = 2 – 5 hours (red , dashed). There is very little change from time t = 0 to time t = 1, indicative of the growth repression during the first hour. The larger shifts in the size distribution for later times indicates faster growth later in the cell cycle. (E) The mean exponential, kn, growth constants for each of the time intervals were calculated from Eq. 2 and are expressed in hour−1
Implementation of our method requires an assumption about the initial conditions of the time course. Specifically, we must specify how growth rates, , are to be paired with the measured sizes, , in the newborn population. The simplest possibility is that for newborn subpopulation, growth rate and size are independent. To test this assumption we repeated the calculation with a different assumption, namely that growth rates are proportional to, rather than independent of the cells’ birth size. This latter simplification is employed by using exponential, , rather than linear functions to estimate growth in the separate time intervals. Here is the exponential growth constant of cell i at time interval n. Specifically, using the linear estimates, , the growth rate, v, of any single newborn cell is equal its growth constant, . In contrast, using the exponential functions, growth rate is given by . With the exponential estimates it is, , rather than the actual growth rates that is independent of cell size in the newborn population. As shown in Fig 3B and E, our method yields the same result regardless of whether linear or exponential estimates were used. This shows the power of our data to produce a single conclusion regardless of the specifics of the simplifying assumptions. Note that the assumption of growth constants (β or k) that are independent of cell size is invoked only for newborns; at the later time points, cells with larger growth constants will have accumulated more mass and volume than cells with smaller growth constants and will inevitably be larger.
With the linear estimates, we calculate growth rates by representing the size of a cell at time n, , as a sum of its newborn size, , together with a size difference , i.e. , (every size is compared to the initial newborn size). With this notation, relying on the simplifying assumption described above, we search for the set of values that when randomly paired with and added to the measured sizes from the newborn population would produce a set of values, , that have the same probability distribution as the measured cell sizes, , from time interval n.
In more conventional statistical language we describe the probability distribution of with φn(c) and use cn to denote the mean c value at time t = n. We express the measured distribution fn, from time n, as a convolution of the measured distribution of newborn sizes, f0, with , and solve for φn(c) by numerical deconvolution. From φn(c) we calculate the mean value, cn, for each time point by cn = ∫ cφn(c)dc and then relate the calculated cn values to the mean growth rates, βn, by . Since Δt = 1, . This procedure is summarized in Eq. 2A and B (see SOM for details).
| (2A) |
| (2B) |
Where
In Eq. 2A, f0 and fn are experimentally measured distributions so, by numerical deconvolution, we solve Eq. 2A for the probability distribution φn(c). We can then, recursively calculate mean growth values for each time interval by plugging the calculated cn into Eq. 2B, where cn is simply the average of the probability distribution φn(c). After independently calculating the growth estimates for each of the one hour segments throughout the cell cycle, the true functional form of the growth function was reconstituted by linking the successive 1 hour segments (See SOM for details). Thus, Eq. 2, and its more general formulation in the SOM (Eq. S9 to S11), provides a means of calculating the average growth rate between any two times if the size distributions at these time points and the size distribution of newborns are known.
Fig. 3B shows the results of applying Eq. 2 to the synchronized population of L1210 mouse lymphoblasts. It reveals that the average rate of cell growth (βn), calculated by the linear segmental estimates, increases rapidly at the early stages of cell cycle and is then followed by a slower linear increase until cell division starts (see Fig. 3C relating Fig. 3B to cell cycle stages). The suppression of growth in G1, shown in Fig. 3B, can be directly observed from the experimental size distribution curves for the synchronous L1210 populations (Fig. 3D).
Using the exponential growth model for Eq. 2, the post-G1 period is seen to be described precisely with a constant exponential growth rate constant of k=0.07hr−1 or a growth rate of 0.07 × s (s being cell size) (Fig. 3E). Fig. 3B and Fig. 3E are equivalent. The former is expressed as a linear growth constant, β (fl/hr), which in the post-G1 period increases with time, whereas the latter is expressed as an exponential constant, k (hr−1), which in that same period does not change.
From the resulting distributions, φn(c), we calculate that the total variation in growth rates in the population is (CV=49%). This variation is the result of the size variation (CV=32%) and a variation in exponential constants (CV=18%).
This analysis allows us to interpret the Collins-Richmond plot, which we presented earlier in Fig. 2A, in terms of growth rate changes during the cell cycle. In Fig. 3B, the growth rate, β, increases from 10 fl/hour during G1 to 90 fl/hour as cells progress towards division. From Fig. 3 we now realize that this 9-fold increase is largely localized to the early G1 phase, an age dependency that is lost in the Collins-Richmond representation, due to a poor correlation between cell size and age. (See more details in SOM; Fig. S3, S4).
Dependence of cell division on time and size
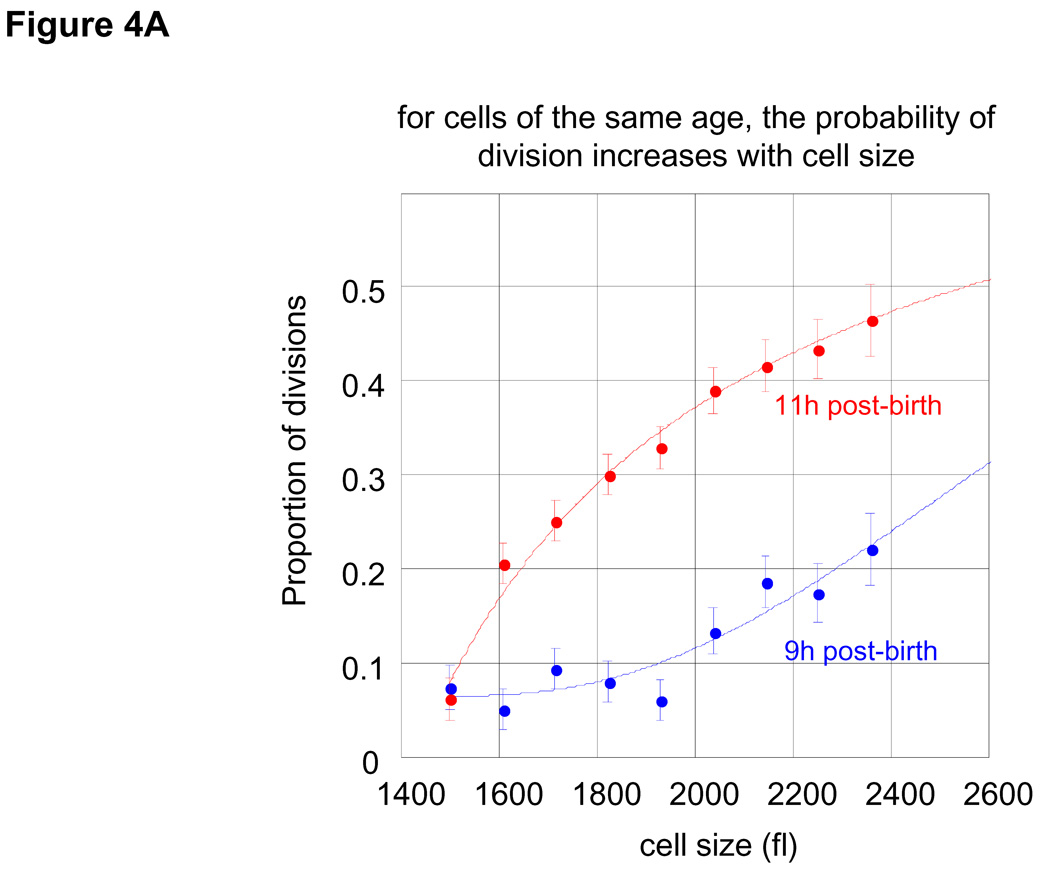
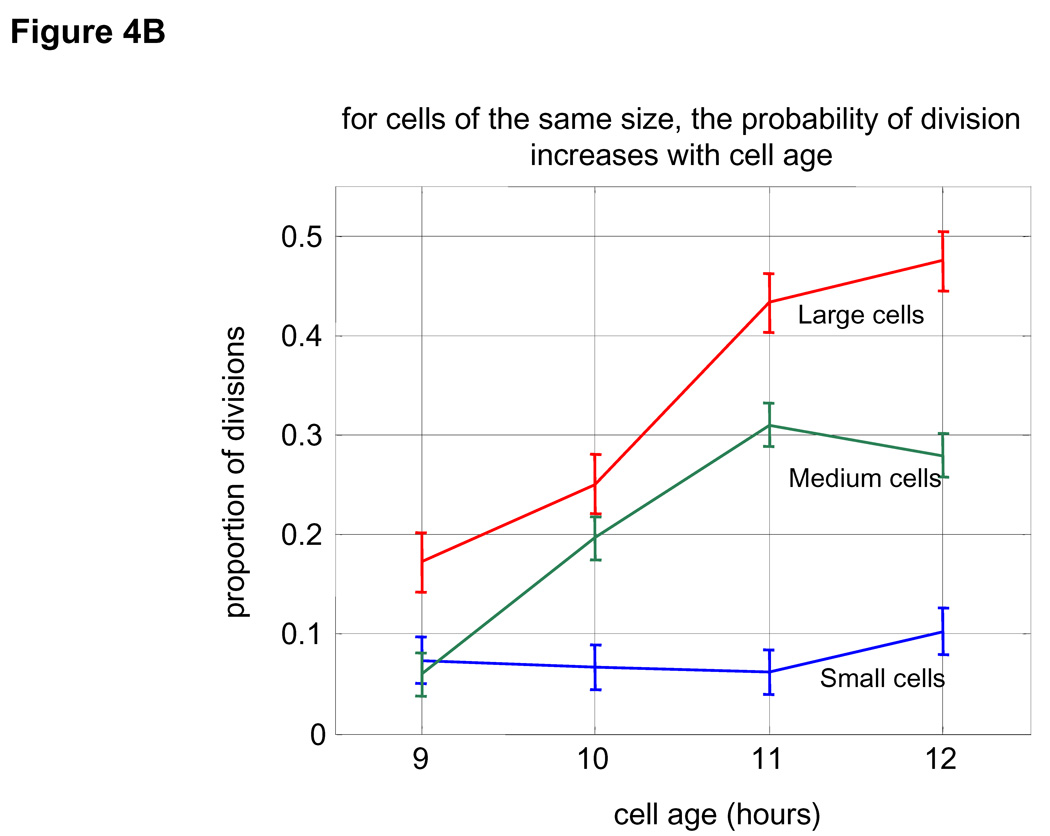
These results require some size control mechanism to limit the dispersion in cell sizes. To test for the possibility that there is a size gate that shortens the cell cycle for large cells, we examined the interval in which most cells divide (9 to 12 hours after birth; see Fig. 3A). By using the growth constants that we determined in Fig. 3E and comparing the measured size distributions from two consecutive times, we can calculate the frequency of cell divisions in this population as a function of cell cycle time (Fig. 4A, B). To take one example, consider the number of cells that at age 8 hours is contained in the size interval (s1, s2) (cells larger than s1 and smaller than s2). Given a value of k = 0.07 hrs−1 (see Fig 3E), at time 9 hours these same cells will be contained by the interval {s1e0.07, s2e0.07}. Any deviation from this equivalence can only occur by division. To avoid confusion with newborn cells, we calculate the division frequencies using cells of size 1500fl or larger, where the proportion of newborns is negligible (see Fig. 1B).
Figure 4. Frequency of cell division as a function of cell size and age.
(A) Proportion of cells that have divided at any specified size are shown for cells at 9 hours after birth (blue) and 11 hours after birth (red). For example, it is seen that at 11 hour post-birth about 20% of all cells with size 1600 fl divide. Size distributions were calculated based on a Gaussian kernel. B. Division frequencies as a function of age (each time point represents a one hour interval starting at the indicated times) for cells with size ranging from 1500 to 1850 fl (blue), from 1850 to 2200 fl (green) and from 2250 to 2500 fl (red).
We find that for cells of the same age, the likelihood of division increases with cell size (Fig. 4A). Also for cells of the same size, older cells have a greater chance to divide than younger cells (Fig. 4B). Thus, the likelihood of cell division, ψ, is governed by both cell age, τ, and cell size, s. More explicitly, the probability for cell division follows the differential form given by Eq. 3:
| (3) |
where the dependency of cell division on cell size and age is captured by the partial derivatives, , where size is held constant, and , where age is held constant.
Our current measurements lack the accuracy to obtain these partial derivatives to high precision. Nevertheless, by relying on linear fit estimates we can obtain approximations for their magnitudes: roughly at 9 hours after birth and 4×10⁻⁴ fl −1 ± 1×10⁻⁴ at 12 hours after birth, and for cells of volume 1500fl and 0.1 hr −1 ± 0.02 for cells of volume 2400fl.
Discussion
The size of a cell reflects the relationship between its growth rate and division frequency. It has been difficult to study in metazoan cells, due primarily to the lack of sufficiently accurate, sensitive, and reliable means of measurement. We have addressed these deficiencies with new mathematical and experimental methods that allow us to describe the growth of individual cells during the cell cycle from measurements made on very large samples. Although we are measuring the cell volume, other studies have shown that the buoyant density of cells remains constant through the cell cycle, implying that volume can be used as a surrogate for mass (25, 26).
For mouse lymphoblastoid cells, we find an accelerative growth phase in G1 (where an exponential rate constant is itself time dependent), followed by period of stable exponential growth during the rest of the cell cycle. Thus, at least for this cell type, our results settle a long-standing controversy of whether mammalian cell growth can be described by linear or exponential kinetics. The true growth function across the cell cycle is neither a simple exponential nor a linear function, and it is size dependent. Therefore mammalian cells must possess a cell autonomous intrinsic size regulator that couples cell growth to the cell cycle.
In fission yeast entry into mitosis has been shown to be size dependent while in budding yeast division is set by a “timer” activated at the start point (1). For lymphoblasts, we find that growth and division are independently determined by cell size and age. The correlation between size and division in mammalian cells thus cannot be a simple consequence of either size-independent processes that govern cell cycle duration or a size gate that feeds back on the timing of the cell cycle.
Our data contrasts with the data from Raff and colleagues on adherent Schwann cell cultures, where a linear dependence of growth on size was suggested. This might reflect differences between adherent and suspension cell populations, their use of drugs to induce synchrony, or the difference in the type of cell studied. In addition, their Schwann cells were allowed to grow without division, reaching an extreme size (13). From our results we learned that very large cells above a critical cell size (2000 fl for L1210 cells; a size never attained by most of the growing cells in the culture) had a different growth behavior from the cells that divided at smaller size. In this regime growth is no longer proportional to size and could appear linear.
Although a great deal of progress has been made recently on growth and cell division in mammalian cells, the circuits that coordinate these processes have not yet been investigated. The analytical tools presented here should facilitate the study of the biochemical circuitry responsible for setting the size and maintaining the limits of cell size variation, despite the potentially disruptive consequences of size dependence of growth. Given the very large size differences of different somatic cell types, the processes governing cell size would be expected to be deeply enmeshed in developmental mechanisms and subject to physiological constraints
Our experimental and mathematical methods are available as supporting material on Science Online.
Supplementary Material
Acknowledgments
We are indebted to Charles Helmstetter and Jim Horn for sharing plans and construction of the newborn cell device and for Stephen Cooper for suggesting we consider that device for cell cycle studies. We are grateful to Jason Levy for discussions and for advice with the mathematical analyses. We thank Jennifer Waters and the Nikon Imaging Centre for help with the microscopy, and to Caroline Mock for cell sorting. We also thank Guillaume Charras and Tamas Balla for reagents and Shay Tal, Jared Toettcher, Pedro Bordalo, Ron Milo, Tim Mitchison, Paul Jorgensen, Guillaume Charras, Eitan Zlotorynski, Sophie Dumont, Noam Shoresh, and Mike Springer for advice and critical reading. This research was partially supported by NIH grant GM083303 to G.L. and by NIH grant GM.026875. R.K was supported by fellowship from HSFP.
References
- 1.Jorgensen P, Tyers M. Curr Biol. 2004 Dec 14;14:R1014. doi: 10.1016/j.cub.2004.11.027. [DOI] [PubMed] [Google Scholar]
- 2.Mitchison JM. International Review of Cytology. 2003;226:94. doi: 10.1016/s0074-7696(03)01004-0. [DOI] [PubMed] [Google Scholar]
- 3.Trucco E. Bull Math Biophys. 1970 Dec;32:459. doi: 10.1007/BF02476765. [DOI] [PubMed] [Google Scholar]
- 4.Trucco E, Bell GI. Bull Math Biophys. 1970 Dec;32:475. doi: 10.1007/BF02476766. [DOI] [PubMed] [Google Scholar]
- 5.Tyson JJ, Hannsgen KB. J Math Biol. 1985;22:61. doi: 10.1007/BF00276546. [DOI] [PubMed] [Google Scholar]
- 6.Elliott SG, McLaughlin CS. Proc Natl Acad Sci U S A. 1978 Sep;75:4384. doi: 10.1073/pnas.75.9.4384. [DOI] [PMC free article] [PubMed] [Google Scholar]
- 7.Jorgensen P, Nishikawa JL, Breitkreutz BJ, Tyers M. Science. 2002 Jul 19;297:395. doi: 10.1126/science.1070850. [DOI] [PubMed] [Google Scholar]
- 8.Kellogg DR. J Cell Sci. 2003 Dec 15;116:4883. doi: 10.1242/jcs.00908. [DOI] [PubMed] [Google Scholar]
- 9.Di Talia S, Skotheim JM, Bean JM, Siggia ED, Cross FR. Nature. 2007 Aug 23;448:947. doi: 10.1038/nature06072. [DOI] [PubMed] [Google Scholar]
- 10.Kubitschek HE. Biophys J. 1968 Dec;8:1401. doi: 10.1016/S0006-3495(68)86562-2. [DOI] [PMC free article] [PubMed] [Google Scholar]
- 11.Kubitschek HE. J Bacteriol. 1986 Nov;168:613. doi: 10.1128/jb.168.2.613-618.1986. [DOI] [PMC free article] [PubMed] [Google Scholar]
- 12.Collins JF, Richmond MH. J Gen Microbiol. 1962 Apr;28:15. doi: 10.1099/00221287-28-1-15. [DOI] [PubMed] [Google Scholar]
- 13.Conlon I, Raff M. J Biol. 2003;2:7. doi: 10.1186/1475-4924-2-7. [DOI] [PMC free article] [PubMed] [Google Scholar]
- 14.Conlon IJ, Dunn GA, Mudge AW, Raff MC. Nat Cell Biol. 2001 Oct;3:918. doi: 10.1038/ncb1001-918. [DOI] [PubMed] [Google Scholar]
- 15.Echave P, Conlon IJ, Lloyd AC. Cell Cycle. 2007 Jan 15;6:218. doi: 10.4161/cc.6.2.3744. [DOI] [PubMed] [Google Scholar]
- 16.Cooper S. BMC Cell Biol. 2004 Sep 29;5:35. doi: 10.1186/1471-2121-5-35. [DOI] [PMC free article] [PubMed] [Google Scholar]
- 17.Sveiczer A, Novak B, Mitchison JM. Theor Biol Med Model. 2004;1:12. doi: 10.1186/1742-4682-1-12. [DOI] [PMC free article] [PubMed] [Google Scholar]
- 18.Anderson EC, Bell GI, Petersen DF, Tobey RA. Biophys J. 1969 Feb;9:246. doi: 10.1016/S0006-3495(69)86383-6. [DOI] [PMC free article] [PubMed] [Google Scholar]
- 19.Dolznig H, Grebien F, Sauer T, Beug H, Mullner EW. Nat Cell Biol. 2004 Sep;6:899. doi: 10.1038/ncb1166. [DOI] [PubMed] [Google Scholar]
- 20.Killander D, Zetterberg A. Exp Cell Res. 1965 May;38:272. doi: 10.1016/0014-4827(65)90403-9. [DOI] [PubMed] [Google Scholar]
- 21.Zetterberg A, Killander D. Exp Cell Res. 1965 Aug;39:22. doi: 10.1016/0014-4827(65)90003-0. [DOI] [PubMed] [Google Scholar]
- 22.Cooper S. Cell Mol Life Sci. 2003 Jun;60:1099. doi: 10.1007/s00018-003-2253-2. [DOI] [PMC free article] [PubMed] [Google Scholar]
- 23.Bell GI, Anderson EC. Biophys J. 1967 Jul;7:329. doi: 10.1016/S0006-3495(67)86592-5. [DOI] [PMC free article] [PubMed] [Google Scholar]
- 24.LeBleu VS, Thornton M, Gonda RG, Helmstetter CE. Cytothechnology. 2006 Jul;51:149. doi: 10.1007/s10616-006-9024-5. [DOI] [PMC free article] [PubMed] [Google Scholar]
- 25.Anderson EC, Petersen DF, Tobey RA. Biophys J. 1970 Jul;10:630. doi: 10.1016/S0006-3495(70)86325-1. [DOI] [PMC free article] [PubMed] [Google Scholar]
- 26.Loken MR, Kubitschek HE. J Cell Physiol. 1984 Jan;118:22. doi: 10.1002/jcp.1041180106. [DOI] [PubMed] [Google Scholar]
Associated Data
This section collects any data citations, data availability statements, or supplementary materials included in this article.


