Abstract
Quantitative techniques based on ultrasound backscatter are promising tools for ultrasonic tissue characterization. There is a need for fast and accurate processing strategies to obtain consistent estimates. An improved parameter estimation algorithm for the homodyned K distribution was developed based on SNR, skewness, and kurtosis of fractional-order moments. From the homodyned K distribution, estimates of the number of scatterers per resolution cell (μ parameter) and estimates of the ratio of coherent to incoherent backscatter signal energy (k parameter) were obtained. Furthermore, angular compounding was used to reduce estimate variance while maintaining spatial resolution of subsequent parameter images. Estimate bias and variance from Monte Carlo simulations were used to quantify the improvement using the new estimation algorithm compared to existing techniques. Improvements due to angular compounding were quantified by the decrease in estimate variance in both simulations and measurements from tissue-mimicking phantoms and by the increase in target contrast. Finally, the new algorithm was used to derive estimates from two kinds of mouse mammary tumors for tissue characterization. The new estimation algorithm yielded estimates with lower bias and variance than existing techniques. For a typical pair of parameters (μ=5 and k=1), the bias and variance were reduced 67% and 16%, respectively, for the μ parameter estimates and 79% and 37%, respectively, for the k parameter estimates. The use of angular compounding further reduced the estimate variance, e.g., the variance of estimates for the μ parameter from measurements was reduced by a factor of approximately 90 when using 120 angles of view. Finally, statistically significant differences were observed in parameter estimates from two kinds of mouse mammary tumors using the new algorithm. These improvements suggest estimating parameters from the backscattered envelope can enhance the diagnostic capabilities of ultrasonic imaging.
Index Terms: Envelope statistics, homodyned K distribution, quantitative ultrasound, ultrasound backscatter
I. Introduction
The envelope of backscattered ultrasound can be modeled as the superposition of the scattered signals from individual scatterers in the medium being interrogated. As such, the envelope signal is statistical in nature. By applying a model to the amplitude distribution of the envelope, information about the sub-resolution material properties such as the scatterer number density and parameters describing the organizational structure can be estimated.
Statistical analysis of the envelope of backscattered ultrasound has been used to characterize tissues and may be useful for improving the diagnostic capabilities of ultrasound. Shankar et al. [1] demonstrated the potential efficacy of envelope-based statistics in distinguishing benign and malignant breast masses. Hao et al. [2] used the homodyned K distribution to differentiate normal and abnormal myocardium. Sommer et al. [3] observed statistically significant differences in the mean and variance of the amplitude distribution of the envelope signal from normal and cirrhotic livers.
A number of different models for the amplitude distribution of the envelope signal have been proposed over the past few decades with applications to sea echo [4], medical ultrasound [5], and laser speckle [6]. The homodyned K distribution is a particularly versatile but analytically complex model. Because of this complexity, its use has been somewhat limited and other, more analytically tractable models such as the Nakagami distribution [7], [8], Weibull distribution [9], Rician inverse Gaussian distribution [10], and generalized gamma distribution [9] have been used instead. However, by applying an improved parameter estimation algorithm, estimates of parameters of the homodyned K distribution can be obtained in a relatively simple way.
Most parameter estimation algorithms for the homodyned K distribution somehow involve the use of moments of the envelope data; however, the choice of moment order has been investigated with varied results. Due to the analytical convenience, Dutt [11] used even integer moments to estimate parameters of the homodyned K distribution. However, it has been reported [12], [13] that the use of fractional moment orders yields more robust estimates for the simpler, but related, K distribution. Prager et al. [14] found moment order 1.8 to be optimal for speckle discrimination using the homodyned K distribution; however, it has been reported that this claim may not be justifiable and that a simple optimum moment order for parameter estimation does not exist [15]. Based on the lack of consensus in the literature for what constitutes the optimal moment orders, the framework for an improved estimation algorithm should allow the use of arbitrary moment orders.
Until recently, parameter estimation based on fractional order moments was rarely used with the homodyned K distribution but more often with the more tractable K distribution. Martín-Fernández et al. [16] originally developed a mathematically tractable implementation of a parameter estimation algorithm for the homodyned K distribution based on arbitrary fractional order moments. The estimation algorithm presented here is an extension of this original idea.
Even with improved estimation algorithms, the utility of envelope statistics for improving diagnostic ultrasound imaging depends on the variance of estimates. A large variance in parameter estimates can reduce the ability to distinguish between tissues whose parameters have values close to one another. To provide a more robust diagnostic capability, the variance of parameter estimates must be minimized. When constructing parameter images from estimates of the envelope statistics, the spatial resolution of these images depends on the size of the regions-of-interest (ROIs) used to sample the envelope. A larger ROI results in improved bias and variance of estimates. Therefore, a fundamental engineering tradeoff exists between the spatial resolution of parameter images and the variance of estimates.
One mechanism to reduce the variance of parameter estimates based on the envelope of backscattered ultrasound is through angular compounding. Angular compounding is typically used to improve the SNR in B-mode images, although angular compounding has also been applied to the estimation of scatterer size [17], [18]. To the authors’ knowledge, no other work deals with the use of angular compounding to reduce the variance of estimates based on envelope statistics. To perform angular compounding, data is acquired from different angles of view. Parameter estimates from registered ROIs are then averaged together. Angular compounding is particularly applicable to breast tissue characterization because data can be readily acquired over a wide range of angles [19].
This remainder of this manuscript is organized as follows: Section II briefly reviews a few envelope statistics models, Section III presents the homodyned K distribution parameter estimation algorithm, and Section IV deals with angular compounding to reduce estimate variance. Section V discusses the results of analysis of animal tumor models using the homodyned K distribution. The final section discusses some conclusions regarding the study.
II. Envelope Statistics Models
In this section, three models for the amplitude distribution of the envelope of backscattered ultrasound are briefly reviewed.
A. Rayleigh Distribution
The Rayleigh distribution arises when a large number of randomly located scatterers contribute to the echo signal [20]. The probability density function (pdf) is given by
| (1) |
where A (which is assumed to be positive) represents the envelope amplitude and σ2 is the variance of the Gaussian distributed in-phase and quadrature components of the complex echo envelope [21].
B. K Distribution
Jakeman and Pusey [4] introduced the use of the K distribution, a generalization of the Rayleigh distribution, in the context of microwave sea echo to model situations where the number of scatterers is not assumed to be large. The pdf is given by [20]
| (2) |
where Γ(·) is the Gamma function, Kn(·) is the modified Bessel function of the second kind, n-th order, and μ is a measure of the effective number of scatterers per resolution cell. In ultrasound, the resolution cell volume can be defined as the volume of the point spread function of the imaging system [22], i.e., the volume of the insonifed medium that contributes to any given point in the echo signal. In (2), the b parameter can be expressed as
| (3) |
where E[·] is the expectation operator. The K distribution is a more general model that approaches the Rayleigh distribution in the limit μ→ ∞ [20].
C. Homodyned K Distribution
The homodyned K distribution was first introduced by Jakeman [23]. Besides incorporating the capability of the K distribution to model situations with low effective scatterer number densities, the homodyned K distribution can also model situations where a coherent signal component exists due to periodically located scatterers [24]. This makes the homodyned K distribution the most versatile of the three models discussed, but also the most complicated. The pdf of the homodyned K distribution does not have a closed-form expression; however, it can be expressed in terms of an improper integral as [20]
| (4) |
where J0(·) is the zeroth order Bessel function of the first kind, s2 is the coherent signal energy, σ2 is the diffuse signal energy, and μ is the same parameter as defined in the K distribution. The derived parameter k = s/σ is the ratio of the coherent to diffuse signal and can be used to describe the level of structure or periodicity in scatterer locations.
III. Parameter Estimation
Martín-Fernández et al. [16] observed that the SNR of arbitrary moments of the echo envelope predicted by the homodyned K distribution was a function of only the two independent parameters (the k and μ parameters). This allowed an estimator to be implemented based on crossing level curves derived using different fractional-order moments in the Cartesian plane of the parameters (k, μ). By first calculating theoretical values for the SNR for a range of parameter values, an efficient estimator was developed. The SNR was calculated by estimating the SNR of independent identically distributed (i.i.d.) samples of the homodyned K distribution generated with the desired parameters.
This original idea has been extended to calculate the SNR algebraically. Furthermore, in a previous study, the square of SNR was used to estimate the scatterer number density [25]. The conclusions of that study indicated that the square of SNR was most sensitive to scattering conditions with one or two scatterers per resolution cell. Therefore, skewness and kurtosis functions have been included in the proposed algorithm to increase the sensitivity to larger scatterer number densities (i.e., up to 10 scatterers per resolution cell). For completeness, the revised algorithm is presented in detail.
A. Arbitrary Moments of the Homodyned K Distribution
Moments of arbitrary order ν of the homodyned K distribution can be expressed as [16]
| (5) |
where 1F1(a;b;x) is the confluent hypergeometric function of the first kind. By substituting k = s/σ in the argument of the hypergeometric function, defining the improper integral as a function of three variables,
| (6) |
and pulling constants out of the integral, (5) can be written as
| (7) |
Performing the integration in (6) and simplifying,
| (8) |
where 1F2(a;b,c;x) is a hypergeometric function and, for convenience, the definition
| (9) |
is used. Thus, moments of the homodyned K distribution of arbitrary order can be evaluated numerically in a relatively simple way using (6) and (7). Equation (8) is convergent except when η is an integer. To evaluate (8) when η is an integer, linear interpolation can be applied, i.e.,
| (10) |
B. SNR, Skewness, and Kurtosis
The SNR, skewness, and kurtosis of samples of the echo envelope raised to an arbitrary positive power ν can be expressed as [14], [26]
| (11) |
| (12) |
| (13) |
Substituting (7) into (11) and simplifying yields
| (14) |
Following [16], the subscript ν indicates the dependence on the moment order ν. Note that (14) is a function of only two model parameters: k and μ. It is straightforward to substitute (7) into (12) and (13) to determine expressions for Sν and Kν that are also functions of only the two independent model parameters. Parameter estimation is performed by equating estimates of SNR, skewness, and kurtosis from the envelope signal with the theoretical values predicted by the homodyned K distribution. By using these functions, parameter estimates can be obtained by finding level curves in the two-dimensional parameter space as in [16].
Parameter estimates are obtained by finding the point in (k, μ) space where the L2-norm of the distances from the level curves is minimized. Fig. 1 shows two examples, each using three level curves. In this example, moment order ν = 1 is used. The generally vertical orientation in the curves derived from skewness and kurtosis suggests that the algorithm is more sensitive to changes in the μ parameter than the algorithm based on SNR alone and will result in improved variance of estimates over SNR curves alone. Note that the parameter space shown in Fig. 1 was deliberately chosen to extend beyond the reasonable range of parameter values expected.
Fig. 1.
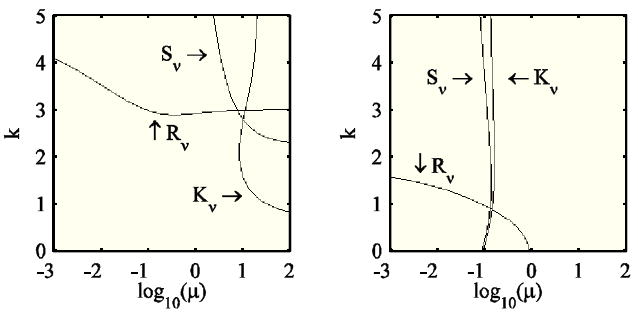
Level curves based on moment order ν = 1. Intended parameters: k = 3, log10(μ) = 1 (left panel) and k = 1, log10(μ) = −1 (right panel).
Estimates that fall outside a reasonable parameter range for a particular situation can be removed from the analysis if necessary.
C. Choice of Moment Order
Although true optimal moment orders may not exist [15], the choice of moment order may affect the performance of the parameter estimation algorithm. Therefore, an effort was made to select moments that were in some sense optimal.
The SNR, skewness, and kurtosis functions were sampled on a 501 × 501 point grid with k uniformly spaced on the interval [0, 5] and log10(μ) uniformly spaced on the interval [-3, 2]. These functions were sampled for moments ν ∈ {0.02, 0.04, …, 1.00}.
The goal of the optimization was to select two moment orders such that the six intersecting level curves (SNR, skewness, and kurtosis for each of the two moment orders) would represent a system as well-conditioned as possible for the largest possible range of parameter values. Geometrically, when level curves are nearly parallel at the point of intersection, the system is ill-conditioned as the intersection point is sensitive to small perturbations in the input data. Conversely, level curves that intersect perpendicularly correspond to a well-conditioned system. Based on these observations, moment orders were selected to produce the best possible conditioning.
The gradients of the SNR, skewness, and kurtosis functions were evaluated numerically at each point where they were sampled. From the gradient, the angle of the level curve passing through each point (k1, μ1) was determined as
| (15) |
where gμ and gk are the components of the gradient in the μ and k directions, respectively. Considering two moments at a time, the sum of the angles between all pairs of level curves was calculated for each point where the functions were sampled. An average value was obtained over the entire (k, μ) space examined. The pair of moments that maximized this sum was selected for estimation, i.e., the pair of moments that resulted in level curves less likely to be parallel at their intersection over the range of μ and k parameters examined. A plot of the sum-of-all-angles metric as a function of the two moments orders used is shown in Fig. 2.
Fig. 2.
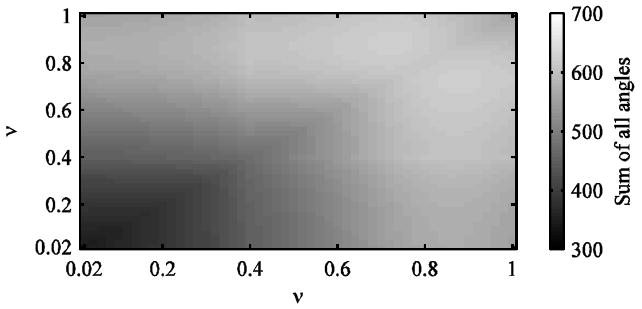
The sum of all angles between level curves (averaged over the space of parameters (k, μ)) versus two moment orders ν.
The “optimal” pair of moments was found to be ν ∈ {0.72, 0.88}. These moments will be used throughout the rest of this work.
D. Validation
1) Comparison with an Existing Algorithm
Following [16] and [27], the estimation algorithm was tested through Monte Carlo simulations by generating sets of i.i.d. samples of the homodyned K distribution with known parameters. Parameter estimation was then performed on these sets of samples and compared with the intended values.
The i.i.d. samples were calculated using the approach in [16]. For completeness, the algorithm is briefly restated here. Each i.i.d. sample, ai, drawn from the homodyned K distribution with parameters μ, s, and σ is obtained as
| (16) |
where X and Y are i.i.d. samples of the unit Gaussian distribution and z is a sample of the gamma distribution with shape parameter μ and scale parameter unity.
Sets of samples were generated for k ∈ {0.0, 0.1,…, 1.0} and μ ∈ {1, 2,…, 10}. This area of the parameter space was chosen to represent typical parameter values that would be expected experimentally. For each combination of model parameters, 1000 independent sets, each of 1000 samples, were generated. The σ parameter was set to unity such that k = s.
Parameter estimation was performed on each set of samples using the SNR, skewness, and kurtosis algorithm. For comparison, estimation was also performed on each set of samples by solving the closed form equations for the even moments of the homodyned K distribution [2], [20]
| (17) |
| (18) |
| (19) |
for the parameters μ and k = s/σ.
The quality of the estimates was quantified by calculating the relative bias and the normalized standard deviation (SD) for each set of samples,
| (20) |
| (21) |
where y represents the true parameter value (either k or μ) used to generate the sets of i.i.d. samples, ŷ represents the estimates from the 1000 independent sets, and Var[·] is the sample variance. Because the estimates obtained using the SNR, skewness, and kurtosis approach are limited to the range in (k, μ) space where the level curves are formed, any estimates obtained using the even moments algorithm that fell outside that range were discarded to make the comparison of the two algorithms valid. The two performance metrics are plotted in Figs. 3 and 4 as functions of the parameter values.
Fig. 3.
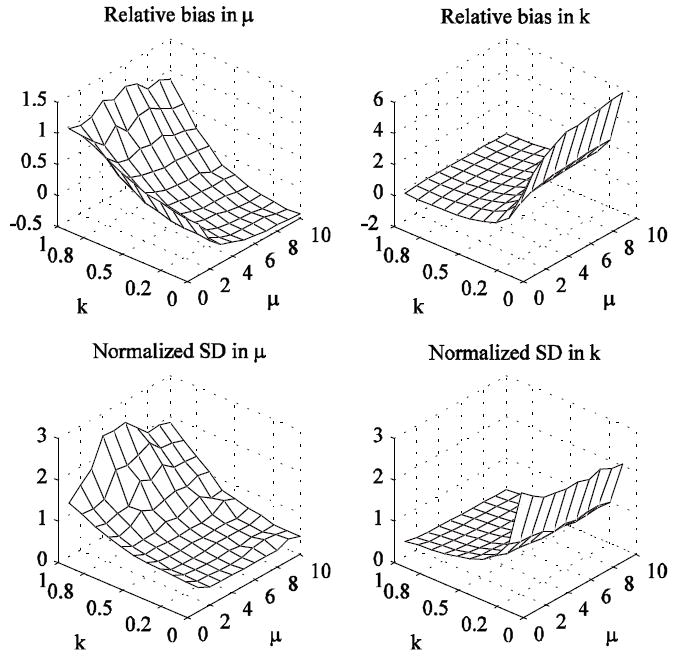
Relative bias and normalized standard deviation (SD) of model parameter estimates versus the model parameters (even moments algorithm).
Fig. 4.
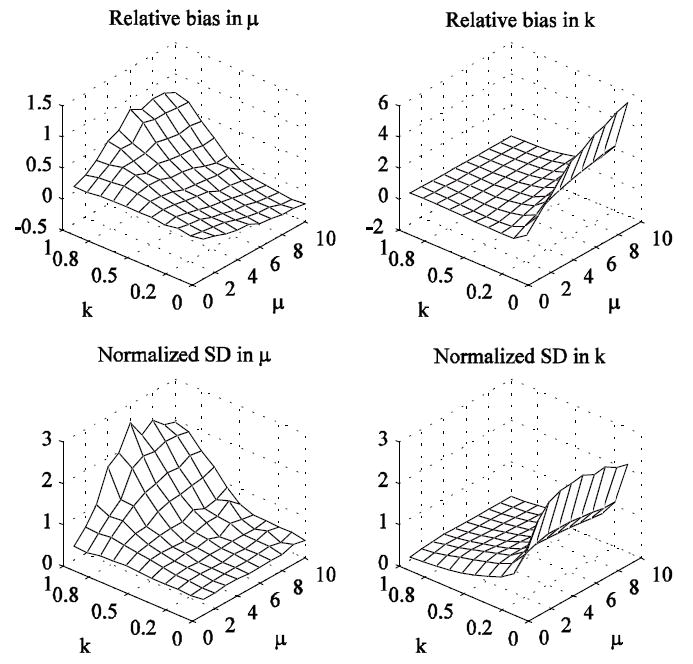
Relative bias and normalized standard deviation (SD) of model parameter estimates versus the model parameters (algorithm using the SNR, skewness, and kurtosis).
Comparison of Figs. 3 and 4 suggests that, overall, the proposed algorithm is capable of estimating parameters with lower bias and variance than an existing algorithm based on even moments of the homodyned K distribution. The absolute values of each of the quantities plotted in Figs. 3 and 4 were summed over the range of parameters examined to further compare the two estimation algorithms. These sums are listed in Table I which shows that the SNR, skewness, and kurtosis algorithm yielded estimates with overall lower bias and variance compared to the even moments algorithm over the range of parameters examined.
TABLE I.
Improvements in Estimate Bias and Variance
| Even moments algorithm | SNR, skewness, and kurtosis algorithm | |
|---|---|---|
| Total absolute bias: μ | 42 | 25 |
| Total absolute bias: k | 92 | 61 |
| Total standard deviation: μ | 95 | 86 |
| Total standard deviation: k | 69 | 62 |
2) Simulations with a Large Coherent Signal Component
Computer simulations were performed to test the modeling and estimation of parameters from backscattered signals with a large coherent signal component (manifested through the k parameter). Independent validation of estimation of the μ parameter is presented in subsequent sections. That is, one model (the homodyned K distribution) and estimation algorithm are used for different scattering cases, demonstrating the generality of the model and estimation algorithm.
Each computational phantom was a volume of height 17.2 mm, length 20.7 mm, and width 1.72 mm containing point scatterers. The height was chosen to correspond to the approximate -6 dB depth of focus of the transducer, the length was chosen to be 24 beamwidths, and the width was chosen to be two beamwidths. The center of the volume was placed at the geometric focus of the transducer.
RF data were simulated using the Field II ultrasound simulation program [28], [29]. RF data were acquired from scan lines separated by 0.43 mm (i.e., half the -12-dB beamwidth). Simulations were performed using a single-element focused (f/4) transducer with a center frequency of 10 MHz. The ideal transducer had a geometrical focal length of 50.8 mm and was excited with a Gaussian windowed sinusoidal pulse with a 50% fractional bandwidth at -6 dB. The echo signals received from the phantom were sampled at 200 MHz. No noise was added in the simulations. A constant speed of sound of 1540 m/s was assumed.
Coherent scattering was created by using periodically spaced scatterers. The periodically located scatterers were created by first dividing the extent of the phantom along the axial direction into 100 bands of height 73.5 μm that were spaced 99.0 μm apart. Scatterers were then placed in these bands. Scatterers were also placed in the phantoms in random spatial locations. Eleven sets of phantoms were created by varying the ratio of periodically and randomly located scatterers. For each of the 11 ratios examined, 10 independent phantoms were created to establish statistics (mean and standard deviation) of the estimates.
The analysis of the image was divided into regions of interest (ROIs) sized approximately 2 mm × 2 mm and overlapped by 75% both laterally and axially. Envelope statistics model parameters were estimated for each ROI using the SNR, skewness, and kurtosis algorithm. For ROIs for which the estimates of the SNR, skewness, and kurtosis did not map to regions in (k, μ) space, the ROI was discarded and not considered in the analysis. For each simulated image, the estimates from all ROIs for which estimates were successfully obtained were averaged together to produce a single k parameter estimate. The mean and SD of these average values were calculated from the 10 independent phantoms for each of the 11 ratios of randomly located and periodically located scatterers. The k parameter estimates are plotted in Fig 5.
Fig. 5.
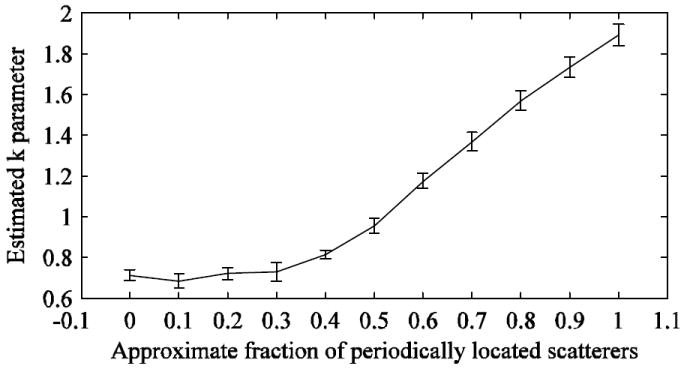
Estimated parameter versus the approximate fraction of periodically located scatterers for simulated phantoms. The error bars are two standard deviations long.
It should be noted that the size of the ROIs affects the bias and variance of the resulting estimates. Previous work [30] has found that estimates of SNR, skewness, and kurtosis are biased for insufficiently large ROIs. These biased estimates in turn affect the final estimates of the envelope statistics parameters. Finding the optimal tradeoff between bias, variance, and ROI size is a subject for future study.
IV. Angular Compounding
A. Introduction
Simulations and experiments were performed to evaluate the feasibility of using angular compounding to reduce the variance of estimates derived from envelope statistics. Furthermore, the improvement in target visibility was assessed.
B. Simulations
A computational phantom was constructed to evaluate the effects of angular compounding on estimate bias and variance and the contrast between regions with different scattering properties. The phantom was shaped as a cylinder with a diameter of 17.2 mm and height of 1.72 mm. The diameter was chosen to correspond to the approximate -6-dB depth of focus of the transducer used in the simulations. The height was chosen as twice the -12-dB beamwidth of the transducer.
Point scatterers were spatially distributed at random throughout the volume of the phantom with an average scatterer number density of two scatterers per resolution cell, except for a circular target region in the phantom with a diameter of 8.6 mm which contained an average of four scatterers per resolution cell. A diagram of the phantom is shown in Fig 6. The resolution cell volume was estimated by scanning a single point scatterer located at the focus of the transducer. Following Dutt and Greenleaf [20], the resolution cell was defined by the -20-dB contour of the envelope. Due to the circular symmetry of the beam pattern, the three-dimensional resolution cell was determined by the volume of revolution of the two-dimensional resolution cell about the axis of the transducer. The resolution cell volume was calculated to be 0.184 mm3.
Fig. 6.
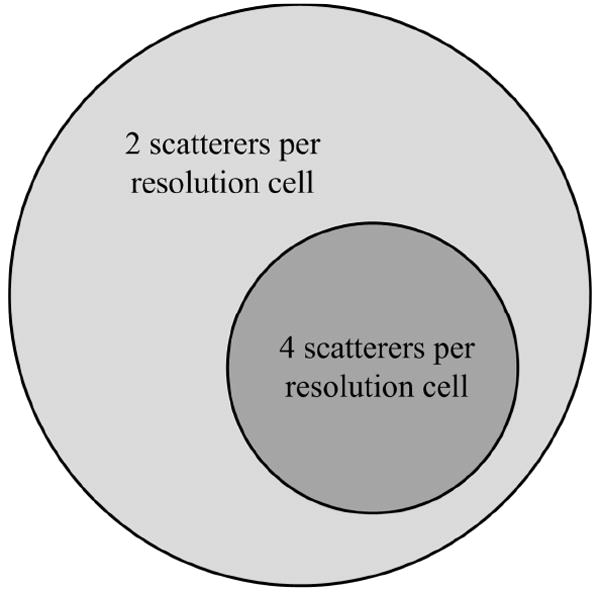
Diagram depicting the average number of scatterers per resolution cell for different regions in the simulated phantom.
The phantom was scanned from 128 different angles uniformly distributed around the phantom on the interval [0°, 180°). Data were not acquired using a full 360° range of view because , in the simulations , signals acquired from diametrically opposed positions were time reversed but otherwise identical because the imaging pulse was symmetric. A diagram of the simulated setup is shown in Fig. 7.
Fig. 7.
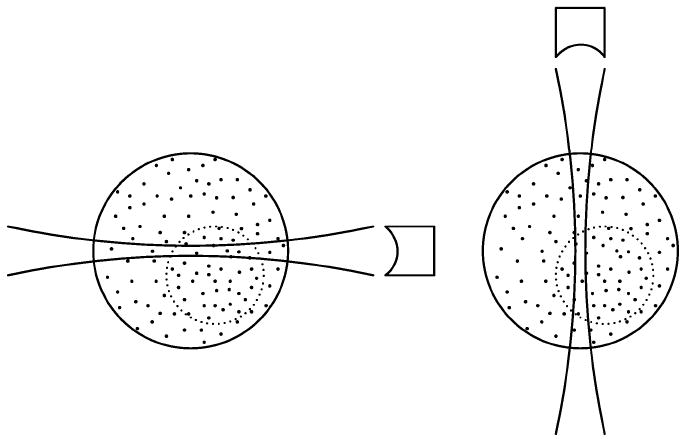
Placement of the transducer and phantom containing point scatterers for scanning at 0° (left) and 90° (right).
From the homodyned K distribution model, parameters were estimated using small overlapping ROIs in each of the 128 images. The use of the homodyned K distribution over simpler distributions (such as the K distribution) is justified for these simulations because, even though the scatterers are randomly distributed, the number of scatterers is finite. Therefore, some coherent signal component will be present and modeled by the homodyned K distribution [20]. The ROIs were circles with a radius of approximately 1.2 mm. Estimates from ROIs corresponding to the same location in each phantom were averaged together to produce compounded parametric quantitative ultrasound (QUS) images. Fig. 8 shows parametric images using the μ parameter. Note that the k parameter reflects the coherent signal energy present in the backscattered signals which may be due to anisotropy in the scatterer locations. Therefore, it is not appropriate to apply angular compounding to this parameter because the estimates could be validly different from different angles of view.
Fig. 8.
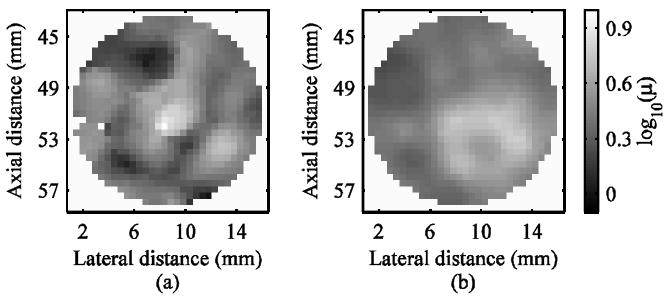
Parametric QUS images illustrating the effects of compounding on parameter estimates. Left panel: one angle of view; right panel: 128 angles of view.
Examination of the images indicates that the estimate variance decreased with compounding, improving the contrast between the background and the target. Quantitatively, a simple contrast metric was used [31]: C = ∣Starget − Sbackground∣ where Starget and Sbackground are the mean estimates of the μ parameter in the target and the background, respectively. For a single angle of view, C = 1.11 while C = 2.31 when 128 images were averaged together.
For a single angle of view, the standard deviation of the μ parameter estimates was 0.68 for the background region and 1.5 for the target region. By averaging together estimates from 128 angles of view, the standard deviation was reduced to 0.35 for the background and 0.65 for the target region. Previous studies [17], [18] have suggested that the standard deviation of parameter estimates should decrease with the square root of the number of independent images averaged together. The reduction in the standard deviation falls short of this ideal, suggesting that all 128 angles of view were not statistically independent.
Some variation in the parameter estimates is expected due to the underlying inhomogeneities of the scatterer locations in the phantom. Also, a blurring effect is expected on the region between the target and the background. To further quantify these effects and demonstrate the robustness provided by angular compounding in estimating the scatterer number density, a parametric QUS image corresponding to the μ parameter was obtained independently by counting the number of scatterers in each ROI. Because the volume of the resolution cell and the volume of each ROI were known, this allowed a predicted μ parameter value to be obtained for each ROI. These predictions were compared to the estimates as shown in Fig. 9.
Fig. 9.
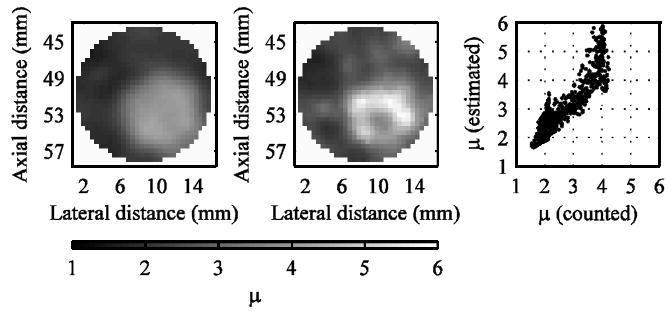
Comparison of the scatterer number density obtained by counting the number of scatterers in each ROI (left) and through estimates based on the envelope statistics model (middle). The scatter plot (right) shows a comparison of the μ parameter values on an ROI-by-ROI basis.
While there is a bias in the estimates of the effective scatterer number density, the theoretical predictions and the estimates are highly correlated. Indeed, a correlation coefficient of 0.905 was observed.
C. Experiment
A homogenous phantom containing glass bead scatterers of mean radius 90 μm was constructed to experimentally demonstrate the reduction in estimate variance of the μ parameter with angular compounding. The phantom was constructed with a 15% (by mass) concentration of gelatin in distilled water. A scatterer concentration of 8.92 beads per cubic millimeter was used. The glass beads were assumed to be uniformly distributed throughout the phantom with random spatial locations.
The phantom was scanned with a focused (f/3) transducer with a center frequency of 5 MHz. A wire target technique [32] was used to estimate the resolution cell volume. As in the simulations, the -20-dB contour was used to determine the resolution cell volume which was estimated to be 0.505 mm3. Based on the resolution cell volume and the scatterer concentration, a scatterer number density of 4.50 scatterers per resolution cell was predicted. Data were acquired from 120 angles uniformly distributed around the phantom on the interval [0°, 360°). In contrast with the simulations, full 360° data were useful in the experiment because the pulse was not symmetric. Therefore, data acquired from diametrically opposed positions should yield partially decorrelated signals.
Because the axis of rotation of the phantom was not perfectly concentric with the center of the phantom, the images obtained from different angles of view were not registered. B-mode images obtained from different angles of view were displayed and the coordinates of the center of the phantom were manually estimated. The equation of a circle describing the relative position of the center of the phantom as a function of the angle of rotation was derived as the best fit to the estimates of the center of the phantom. Each image was registered by translating it by the opposite of the amount of translation predicted by the equation for the circle.
The reduction in the standard deviation of the μ parameter estimates was greater than that obtained in the simulation study. For a single angle of view, the standard deviation of the μ parameter estimates was 2.1. By averaging together estimates from 120 angles of view, the standard deviation was reduced to 0.22. Based on the averaging of estimates from 120 angles of view, reduction in the standard deviation of the estimates by a factor of about 11 were expected. Compared to the simulations, the reduction in estimate variance was greater for the experimental data. This could be partially attributed to the imperfect registration of the images acquired from different angles of view for the experimental scans. QUS images illustrating the reductions in estimate variances are shown in Fig. 10.
Fig. 10.
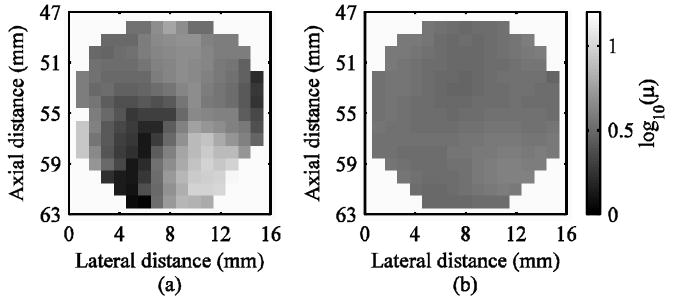
Parametric QUS images illustrating the effects of compounding on parameter estimates. Left panel: one angle of view; right panel: 120 angles of view.
The standard deviation versus the number of compounded images (i.e., the number of angles of view) of the μ parameter estimates for both the simulation and the experiment are plotted in Fig. 11.
Fig. 11.
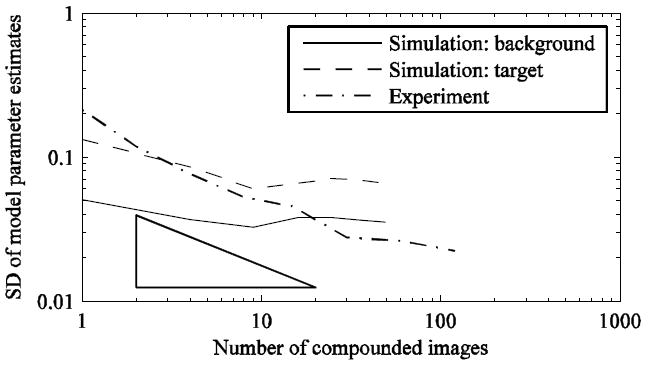
Standard deviation (SD) of μ parameter estimates versus the number of compounded images for simulated data and experimental data. The hypotenuses of the triangle has a slope which corresponds to a decrease in the standard deviation of parameter estimates as the square root of the number of compounded images.
The standard deviation curves in Fig. 11 do not follow the predicted slope exactly. When a small number (i.e., less than about 10) of images are compounded, the angular separations of the images are large enough that the QUS parameter estimates from each angle of view are statistically independent. As more angles of view are considered, the angular separation decreases. Once the point is reached where images are no longer statistically independent, little improvement in estimate variance is expected. This effect was further quantified by examining the correlation between parameter estimates. Figure 12 shows the average correlation coefficient between parameter estimates versus the angular separation. This was determined by calculating the correlation coefficient between estimates for corresponding ROIs for all pairs of images separated by a given angular separation. The average was taken over all pairs. The correlation coefficient increased dramatically for an angular separation of less than about 9°.
Fig. 12.
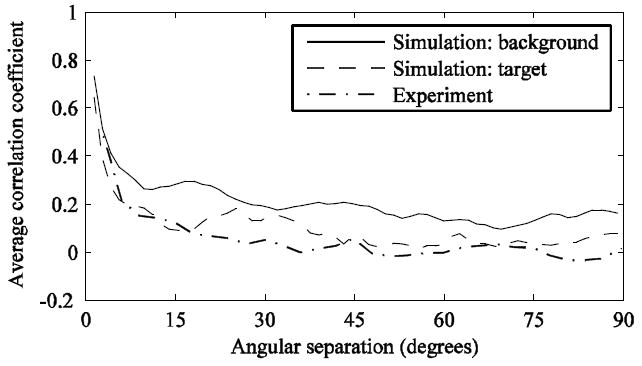
Average correlation coefficient for μ parameter estimates versus the angular separation for simulated and experimental data.
V. Animal Model Results
The experimental protocol was approved by the Institutional Animal Care and Use Committee of the University of Illinois and satisfied all campus and National Institutes of Health rules for the humane use of laboratory animals.
A previous study [33] examined the use of the parameters from the normalized backscattered power spectrum, i.e., effective scatterer diameter and effective acoustic concentration, to characterize two rodent models of breast cancer (a mouse mammary carcinoma and a mouse mammary sarcoma). Small but statistically significant differences were observed between the carcinomas and sarcomas based on estimates of the effective scatterer diameter and effective acoustic concentration values. The tumors were scanned using a single-element weakly-focused (f/3) 20-MHz transducer. Scanning procedures and animal preparation are outlined in detail in the previous study [33]. The same RF data used in the previous study were also used to examine the envelope statistics by means of the homodyned K distribution.
Ten of each kind of tumor were analyzed by estimating the k and μ parameters for ROIs sized approximately 1 mm × 1 mm in each tumor image. A single pair of parameter values (k, μ) was obtained for each of the 20 tumors by averaging together the estimates from all the ROIs i n each tumor. Examples of parametric QUS images of each of the two kinds of tumors are shown in Fig. 13. Fig. 14 shows a feature analysis plot for the tumors. The ability to classify the tumors can be assessed qualitatively by noting that it is possible to draw a line that separates the two kinds of tumors in the feature analysis plot.
Fig. 13.
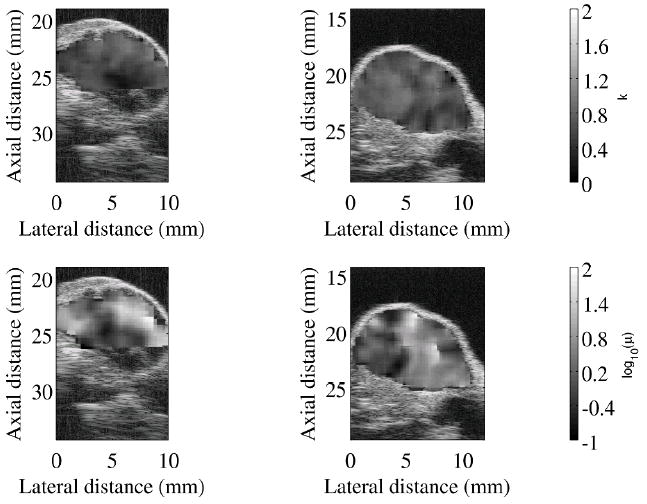
Parametric QUS images of carcinoma (left panels) and sarcoma (right panels) tumors.
Fig. 14.
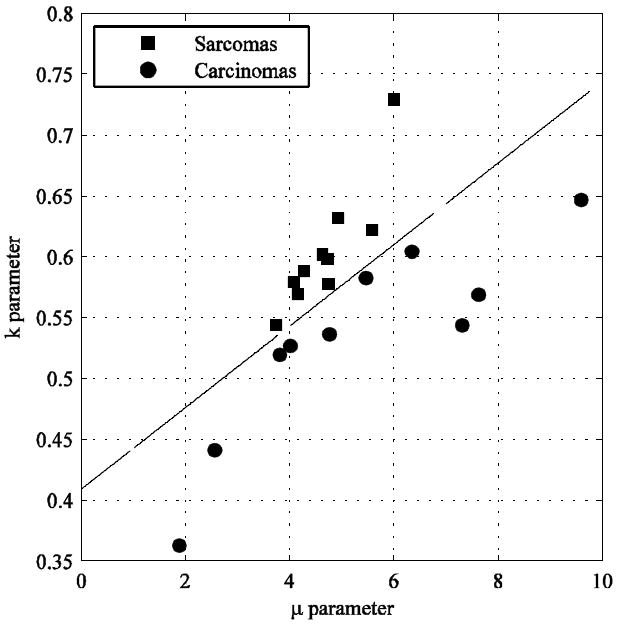
Feature analysis plot of average envelope-statistics parameter estimates for carcinoma and sarcoma tumors.
For the sarcomas and carcinomas, the k parameter estimates were 0.604 ± 0.051 and 0.533 ± 0.081, respectively while the μ parameter estimates were 4.69 ± 0.69 and 5.34 ± 2.4, respectively. Based on one-way ANOVA analysis, a statistically significant difference was observed between the k parameter estimates (p < 0.05) of the carcinomas and sarcomas, but not in the μ parameter estimates (p = 0.42).
While the μ parameter estimates are not statistically significant by themselves, a linear combination of the two model parameter estimates yields a smaller p-value than the k parameter alone. This derived parameter was 0.447±0.032 for the sarcomas and 0.354±0.041 for the carcinomas (p < 0.0001). The derived parameter was determined from the line separating the two kinds of tumors. Denoting the equation of the line as k=mμ+b, the derived parameter values were defined as the linear combination ki-mμi for i=1…10 where (μi , ki) is the coordinate of the i-th tumor. The parameters of the line were m=0.0335 and b=0.409.
VI. Conclusions
Angular compounding and an improved estimation algorithm based on SNR, skewness, and kurtosis of fractional-order moments were used to reduce the variance of envelope-based parameter estimates. The improved algorithm was observed to more accurately estimate parameters of the homodyned K distribution than an existing algorithm based on the even moments of the distribution. Computer simulations demonstrated that it was possible to create images of the scatterer number density through angular compounding with reduced estimate variance and, therefore, better image quality. This capability is important for being able to detect small differences in tissue microstructure and may result in an improved diagnostic capability.
The new estimation algorithm was applied to ultrasound backscatter measurements from rodent tumor models and statistically significant differences in estimates of the k parameter were observed. A previous study examining these rodent tumors used parameters based on the normalized backscattered power spectrum (i.e., the effective scatterer diameter and the effective acoustic concentration) to successfully classify the tumors [33]. The addition of two parameters based on the envelope statistics will double the feature space for QUS characterization of tissues and may lead to improved classification.
This is one of the few works dealing with the application of angular compounding to QUS techniques. The improved algorithm presented for parameter estimation is both fast and accurate and outperforms existing methods. While statistically significant differences using the envelope parameters were observed between the two kinds of tumors, angular compounding could improve the capability in distinguishing different kinds of tumors. A logical extension of this work would be the implementation of envelope-based analysis on a tomographic breast scanner with access to full 360° views [19].
Acknowledgments
The authors would like to thank William D. O’Brien Jr., for his helpful insights and Roberto Lavarello for his assistance in constructing the phantom used in this work.
This work was supported in part by the National Institutes of Health Grants CA111289 and EB008992.
References
- 1.Shankar PM, Dumane VA, George T, Piccoli CW, Reid JM, Forsberg F, Goldberg BB. Classification of breast masses in ultrasonic B scans using Nakagami and K distributions. Physics in Medicine and Biology. 2003;48:2229–2240. doi: 10.1088/0031-9155/48/14/313. [DOI] [PubMed] [Google Scholar]
- 2.Hao X, Bruce CJ, Pislaru C, Greenleaf JF. Characterization of reperfused infarcted myocardium from high-frequency intracardiac ultrasound imaging using homodyned K distribution. IEEE Transactions on Ultrasonics, Ferroelectrics, and Frequency Control. 2002;49:1530–1542. doi: 10.1109/tuffc.2002.1049735. [DOI] [PubMed] [Google Scholar]
- 3.Sommer FG, Joynt LF, Carroll BA, Macovski A. Ultrasonic characterization of abdominal tissues via digital analysis of backscattered waveforms. Radiology. 1981;141:811–817. doi: 10.1148/radiology.141.3.7302239. [DOI] [PubMed] [Google Scholar]
- 4.Jakeman E, Pusey PN. A model for non-Rayleigh sea echo. IEEE Transactions on Antennas and Propagation. 1976;24:806–814. [Google Scholar]
- 5.Wagner RF, Smith SW, Sandrik JM, Lopez H. Statistics of speckle in ultrasound B-scans. IEEE Transactions on Sonics and Ultrasonics. 1983;30:156–163. [Google Scholar]
- 6.Barakat R. First-order statistics of combined random sinusoidal waves with applications to laser speckle patterns. Optica Acta. 1974;21:903–921. [Google Scholar]
- 7.Shankar PM. A general statistical model for ultrasonic backscattering from tissues. IEEE Transactions on Ultrasonics, Ferroelectrics, and Frequency Control. 2000;47:727–736. doi: 10.1109/58.842062. [DOI] [PubMed] [Google Scholar]
- 8.Tsui PH, Chang CC. Imaging local scatterer concentrations by the Nakagami statistical model. Ultrasound in Medicine & Biology. 2007;33:608–619. doi: 10.1016/j.ultrasmedbio.2006.10.005. [DOI] [PubMed] [Google Scholar]
- 9.Raju BI, Srinivasan MA. Statistics of envelope of high-frequency ultrasonic backscatter from human skin in vivo. IEEE Transactions on Ultrasonics, Ferroelectrics and Frequency Control. 2002;49:871–882. doi: 10.1109/tuffc.2002.1020157. [DOI] [PubMed] [Google Scholar]
- 10.Eltoft T. The Rician inverse Gaussian distribution: A new model for non-Rayleigh signal amplitude statistics. IEEE Transactions on Image Processing. 2005;14:1722–1735. doi: 10.1109/tip.2005.857281. [DOI] [PubMed] [Google Scholar]
- 11.Dutt V. Ph D dissertation. Mayo Graduate School; Rochester, MN: 1995. Statistical analysis of ultrasound echo envelope. [Google Scholar]
- 12.Dutt V, Greenleaf JF. Speckle analysis using signal to noise ratios based on fractional order moments. Ultrasonic Imaging. 1995;17:251–268. doi: 10.1177/016173469501700401. [DOI] [PubMed] [Google Scholar]
- 13.Ossant F, Patat F, Lebertre M, Teriierooiterai M-L, Pourcelot L. Effective density estimators based on the K distribution: Interest of low and fractional order moments. Ultrasonic Imaging. 1998;20:243–259. doi: 10.1177/016173469802000402. [DOI] [PubMed] [Google Scholar]
- 14.Prager RW, Gee AH, Treece GM, Berman LH. Analysis of speckle in ultrasound images using fractional order statistics and the homodyned k distribution. Ultrasonics. 2002;40:133–137. doi: 10.1016/s0041-624x(02)00104-x. [DOI] [PubMed] [Google Scholar]
- 15.Martín-Fernández M, Alberola-López C. On low order moments of the homodyned-k distribution. Ultrasonics. 2005;43:283–290. doi: 10.1016/j.ultras.2004.06.003. [DOI] [PubMed] [Google Scholar]
- 16.Martín-Fernández M, Cárdenes R, Alberola-López C. Parameter estimation of the homodyned K distribution based on signal to noise ratio. Proceedings of the IEEE Ultrasonics Symposium. 2007:158–161. [Google Scholar]
- 17.Gerig AL, Varghese T, Zagzebski JA. Improved parametric imaging of scatterer size estimates using angular compounding. IEEE Transactions on Ultrasonics, Ferroelectrics, and Frequency Control. 2004;51:708–715. [PubMed] [Google Scholar]
- 18.Lavarello R, Sanchez JR, Oelze ML. Improving the quality of QUS imaging using full angular spatial compounding. Proceedings of the IEEE International Ultrasonics Symposium. 2008:32–35. [Google Scholar]
- 19.Johnson SA, Abbott T, Bell R, Berggren M, Borup D, Robinson D, Wiskin J, Olsen S, Hanover B. Non-invasive breast tissue characterization using ultrasound speed and attenuation. Acoustical Imaging. 2007;28:147–154. [Google Scholar]
- 20.Dutt V, Greenleaf JF. Ultrasound echo envelope analysis using a homodyned K distribution signal model. Ultrasonic Imaging. 1994;16:265–287. doi: 10.1177/016173469401600404. [DOI] [PubMed] [Google Scholar]
- 21.Eltoft T. Modeling the amplitude statistics of ultrasonic images. IEEE Transactions on Medical Imaging. 2006;25:229–240. doi: 10.1109/TMI.2005.862664. [DOI] [PubMed] [Google Scholar]
- 22.Sleefe GE, Lele PP. Tissue characterization based on scatterer number density estimation. IEEE Transactions on Ultrasonics, Ferroelectrics, and Frequency Control. 1988;35:749–757. doi: 10.1109/58.9332. [DOI] [PubMed] [Google Scholar]
- 23.Jakeman E. On the statistics of K distributed noise. Journal of Physics A: Mathematical and General. 1980;13:31–48. [Google Scholar]
- 24.Smolíková R. Ph D dissertation. University of Louisville; Louisville, KY: 2002. Neural and statistical modeling of ultrasound backscatter. [Google Scholar]
- 25.Wear KA, Wagner RF, Brown DG, Insana MF. Statistical properties of estimates of signal-to-noise ratio and number of scatterers per resolution cell. Journal of the Acoustical Society of America. 1997;102:635–641. doi: 10.1121/1.419738. [DOI] [PubMed] [Google Scholar]
- 26.Bulmer MG. Principles of Statistics. Cambridge, MA: The M.I.T Press; 1965. [Google Scholar]
- 27.Abdi A, Kaveh M. Performance comparison of three different estimators for the Nakagami m parameter using Monte Carlo simulation. IEEE Communications Letters. 2000;4:119–121. [Google Scholar]
- 28.Jensen JA. Field: A program for simulating ultrasound systems. Medical & Biological Engineering & Computing. 1996;34(supplement 1, part 1):351–353. [Google Scholar]
- 29.Jensen JA, Svendsen NB. Calculation of pressure fields from arbitrarily shaped, apodized, and excited ultrasound transducers. IEEE Transactions on Ultrasonics, Ferroelectrics, and Frequency Control. 1992;39:262–267. doi: 10.1109/58.139123. [DOI] [PubMed] [Google Scholar]
- 30.Wear KA, Popp RL. Methods for estimation of statistical properties of envelopes of ultrasonic echoes from myocardium. IEEE Transactions on Medical Imaging. 1987;MI-6:281–291. doi: 10.1109/TMI.1987.4307844. [DOI] [PubMed] [Google Scholar]
- 31.Webb A. Introduction to Biomedical Imaging. John Wiley & Sons, Inc; Hoboken, New Jersey: 2003. [Google Scholar]
- 32.Raum K, O’Brien WD., Jr Pulse-echo field distribution measurement technique for high-frequency ultrasound sources. IEEE Transactions on Ultrasonics, Ferroelectrics, and Frequency Control. 1997;44:810–815. [Google Scholar]
- 33.Oelze ML, Zachary JF. Examination of cancer in mouse models using high-frequency quantitative ultrasound. Ultrasound in Medicine and Biology. 2006;32:1639–1648. doi: 10.1016/j.ultrasmedbio.2006.05.006. [DOI] [PubMed] [Google Scholar]


