

Abstract
Objective
ATP released from human erythrocytes in response to reduced oxygen tension (pO2) participates in the matching of oxygen (O2) supply with need in skeletal muscle by stimulating increases in blood flow to areas with increased O2 demand. Here we investigated the hypothesis that hyperinsulinemia inhibits ATP release from erythrocytes and impairs their ability to stimulate dilation of isolated arterioles exposed to decreased extra-luminal pO2.
Methods
Erythrocyte ATP release was stimulated pharmacologically (mastoparan 7) and physiologically (reduced pO2) in the absence or presence of insulin. We also examined the ability of isolated skeletal muscle arterioles perfused with buffer containing erythrocytes treated with insulin or its vehicle (saline) to dilate in response to decreased extra-luminal pO2.
Results
Insulin significantly attenuated mastoparan 7– and reduced pO2–induced ATP release. In vessels perfused with untreated erythrocytes, low extra-luminal pO2 resulted in an increase in vessel diameter. In contrast, when erythrocytes were treated with insulin, no vasodilation occurred.
Conclusions
These studies demonstrate that insulin inhibits ATP release from erythrocytes in response to reduced pO2 and impairs their ability to stimulate dilation of skeletal muscle arterioles. These results suggest that hyperinsulinemia could hinder the matching of O2 supply with need in skeletal muscle.
Keywords: erythrocyte, ATP, insulin, hyperinsulinemia, prediabetes
Introduction
The oxygen (O2) required to meet the metabolic needs of all tissues is delivered by the erythrocyte. In addition to this basic physiological function, erythrocytes can also participate in the regulation of vascular resistance via the release of ATP (6, 12, 33, 35). When exposed to reduced O2 tension (pO2), erythrocytes release both O2 and ATP, the latter a stimulus for the production of endothelium-derived vasodilators (6, 12, 25). These findings led to the hypothesis that the erythrocyte not only carries and delivers O2, but also plays a critical role in the matching of O2 delivery with O2 need by increasing vascular caliber in areas of increased O2 utilitization (11). In support of this hypothesis, it was demonstrated that reducing the extra-luminal pO2 of isolated cerebral arterioles perfused with physiological buffer did not produce a significant change in vessel diameter (8). In contrast, when the same vessels were perfused with buffer containing rat erythrocytes, cells known to release ATP in response to reduced pO2 (19), a similar decrease in extra-luminal pO2 was associated with a significant increase in vessel diameter and an increase in ATP in the vessel effluent. One interpretation of these results is that ATP released from erythrocytes in response to the reduction in extra-luminal pO2 resulted in the increase in vessel diameter. Therefore, not only does the erythrocyte deliver O2, but the controlled release of ATP from this cell allows it to increase vascular caliber to ensure that the delivered O2 adequately meets demand. Failure of this mechanism could lead to impaired matching of O2 delivery with metabolic need and, thereby, contribute to vascular disease.
Inadequate O2 supply to muscle has been suggested to play a role in the development of peripheral vascular disease in type II diabetes (3, 22, 45). However, it is important to recognize that vascular dysfunction has been reported to be present at the time of diagnosis of type II diabetes suggesting that altered vascular reactivity arises during the prediabetic period (27, 29, 41, 44). Prediabetes is defined as insulin resistance in the absence of pathological increases in fasting blood glucose (30, 44). Individuals with prediabetes have normal pancreatic β cell function that compensate for insulin resistance by secreting supra–physiological levels of insulin resulting in marked hyperinsulinemia (5, 30, 44). It is only when β cell function declines and insulin levels fall that blood glucose rises to levels that are of the magnitude required for the clinical diagnosis of type II diabetes (4). It was demonstrated that the hyperemic response of individuals with impaired glucose tolerance, i.e., prediabetes, was significantly attenuated when compared to healthy subjects (17, 18). Importantly, the extent of this dysfunction correlates with plasma insulin levels suggesting a potential pathophysiological consequence of sustained increases in plasma insulin (18).
Here we designed studies to demonstrate that insulin attenuates ATP release from erythrocytes in response to exposure to reduced pO2. A signal transduction pathway that relates erythrocyte ATP release to this physiological stimulus as been described (31). This ATP release requires activation of the heterotrimeric G protein Gi and increases in intracellular cAMP (24, 34). We report that insulin does indeed attenuate ATP release from erythrocytes stimulated by mastoparan 7, a direct activator of Gi (16, 24), as well as exposure to reduced pO2. Moreover, we investigated the hypothesis that treatment of erythrocytes with insulin impairs this cell’s ability to stimulate dilation of skeletal muscle resistance vessels exposed to reduced extra-luminal pO2.
Materials and Methods
Isolation of human erythrocytes
Human blood was obtained by venipuncture using a syringe containing heparin (500 units). Blood was collected from 6 females and 9 males with an average age of 35 years (range 26-59 years).
After collection, whole blood was centrifuged at 500 × g at 4 °C for 10 minutes and the plasma, buffy coat, and uppermost erythrocytes were removed by aspiration and discarded. The remaining erythrocytes were washed three times in wash buffer containing 21.0 mM tris(hydroxymethyl)aminomethane, 4.7 mM KCl, 2.0 mM CaCl2, 140.5 mM NaCl, 1.2 mM MgSO4, 5.5 mM glucose, and 0.5% bovine albumin fraction V, final pH 7.4. Wright stains of erythrocytes prepared in this fashion revealed less than 1 leukocyte per 50 high power fields (approximately 8–10 leukocytes per mm3). Previous studies demonstrate that these erythrocyte preparations are also devoid of platelet contamination (14). Cells were prepared on the day of use.
Measurement of ATP
ATP was measured by the luciferin–luciferase technique (39). A 200 μL sample of erythrocyte suspension (0.04% hematocrit) was injected into a cuvette containing 100 μL of firefly lantern extract (10 mg/mL distilled water, FLE 250; Sigma) and 100 μL of a solution of synthetic D–luciferin (50 mg/100 mL distilled water; Sigma). The light emitted was detected using a luminometer (Turner Designs). A standard curve was obtained for each experiment. Cell counts were obtained from the suspension of erythrocytes and amounts of ATP measured were normalized to 4×10⁸ cells/mL.
Determination of ATP release from erythrocytes in response to incubation with pharmacological agents in the absence and presence of insulin
Washed erythrocytes diluted to a 20% hematocrit were incubated with 10 μM mastoparan 7 (Mas 7, Genscript), a direct activator of the G protein Gi (16), or 100 μM SpcAMPS (Biomol), a direct activator of protein kinase A (PKA) (26, 28), following a 20 minute pretreatment with 1 nM insulin (Humalog U 100®, Eli Lilly) or its vehicle, saline. The ATP concentration was determined at 5, 10, and 15 minutes after the addition of Mas 7 or at 10, 20, and 30 minutes after the addition of SpcAMPS. These time periods were chosen based on preliminary studies. The maximal response to Mas 7 or SpcAMPS in the absence or presence of insulin is reported.
Measurement of Total Intracellular ATP of Erythrocytes
A known number of erythrocytes were lysed in distilled water and diluted 8,000 fold. ATP was measursed as described above and the values were normalized to ATP concentration per erythrocyte.
Measurement of Free Hemoglobin
To exclude the presence of significant hemolysis in studies where the release of ATP was measured, samples were centrifuged at 500×g at 4°C for 10 minutes and the presence of free hemoglobin in the supernatant was determined by light absorption at a wavelength of 405 nm. If any free hemoglobin was detected, the studies were not included to ensure that hemolysis was not influencing the ATP levels.
Determination of ATP release from erythrocytes in response to exposure to reduced O2 tension in the absence and presence of insulin
Washed erythrocytes were diluted to a 20% hematocrit in a Ringers buffer containing bicarbonate (4.7 KCl, 2.0 mM CaCl2, 140.5 mM NaCl, 1.2 mM MgSO4, 11 mM glucose, 23.8 mM NaHCO3, 0.2% dextrose, 0.5% BSA, pH 7.4) at 37 °C. In the presence of 1 nM insulin or its vehicle (saline), erythrocytes were equilibrated for 20 minutes in a tonometer (model 237, Instrumentation Laboratory) with a gas mixture containing 15% O2, 6% CO2, balance N2 (mean pO2 = 100 ± 4 mm Hg, normoxia). The gas mixture was then changed to one containing 0% O2, 6% CO2, balance N2 (mean pO2 = 13 ± 1 mm Hg). The concentration of ATP release from erythrocytes was determined during normoxia and following a 10 minute exposure of erythrocytes to reduced pO2. The maximal response to reduced pO2 is reported. The pH, pO2, and pCO2 were determined during exposure to each gas mixture using a blood gas analyzer (model pHOx, Nova Biomedical).
Isolation, Cannulation and Perfusion of Arterioles from Hamster Skeletal Muscle
Male golden hamsters (93 ± 5 gm) were anesthetized with pentobarbital sodium (6.5 mg/100g, intraperitoneally). The trachea was cannulated to ensure a patent airway for spontaneous breathing. The right cheek pouch retractor muscle was surgically exteriorized as described by Sullivan and Pittman (40). In brief, the muscle was separated from underlying back muscles and a clip was used to secure two ligatures to the muscle. The muscle was then cut at its spinal end and placed ventral side up, at its in situ dimensions on a Plexiglas platform and covered with plastic film (Saran, Dow Corning) to prevent desiccation of the tissue. Unbranched segments of first and second order arterioles, approximately 1000 μm in length, were surgically removed from the muscle. The vessel was trimmed and cleared of connective tissue while immersed in cold (4 °C) modified Ringers buffer containing: 144.0 NaCl mM, 3.0 KCl mM, 2.5 CaCl2 mM, 1.5 MgSO4 mM, 5.0 mM glucose, 2.0 pyruvate mM, 0.02 mM ethylenediaminetetraacetic acid (EDTA), 2.0 mM 3-[N-morpholino]-propanesulfonic acid (MOPS), 1.21 mM NaH2PO4 and 1% bovine serum albumin (dialyzed for 48 hours against distilled water and 48 hours against MOPS-Ringer) with pH adjusted to 7.4. The vessel was then transferred to an organ bath (2.5 mL) mounted on a microscope stage containing the Ringers buffer described above but without albumin.
Isolated arterioles were cannulated using concentric glass pipettes (constructed on a Stoelting microforge) and assembled with a larger outer holding pipette and a smaller inner perfusion pipette. The pipette assembly was mounted on micromanipulators attached to the microscope base. Each end of the vessel was, in turn, aspirated into the holding pipette using a controlled vacuum and cannulated with the perfusion pipette filled with the albumin containing Ringers buffer described above. The vessel was held in place suspended between the two pipettes. Following stabilization, intraluminal pressure was increased to 60 mm Hg while the bath temperature was increased to 37 °C. The vessel was allowed to develop spontaneous tone over the next 30-45 minutes. The vessel was viewed using a Zeiss Axiovert 100 inverted microscope with long working distance objectives (10X and 20X). The microscope image was recorded using a high resolution, closed circuit video system consisting of a CCD video camera (model 72, Dage-MTI), video monitor (PVM-137, Sony), DV HDD DVD Recorder (JVC SR-DVM600) and a time-date generator (WJ-810, Panasonic). Vessel diameter was determined off-line using both an automated system (Diamtrax, version 3.5) and direct measurement using a video caliper (model 308, Colorado Video).
Following the development of spontaneous tone, viability of the vessel was determined by the demonstration of constriction in response to alkaline pH (7.65) and dilation to an acidic pH (6.80). Vessels were subsequently perfused with the same albumin containing Ringers buffer at 3 μl/min using a 3-syringe microinjection pump (model CMA/100, CMA/Microdialysis). The pump was configured in such a way that the perfusate could be instantly switched by means of a microswitch. Initially, the buffer surrounding the vessel was equilibrated with room air (pO2 = 147 ± 2 mm Hg). The pO2 in the microscope chamber was measured using an oxygen microelectrode (MI 730, Microelectrodes Inc.) polarized to -0.7V and a Chemical microsensor (Diamond Electro-Tech Inc.). After stability was achieved and vessel diameter recorded, the buffer in the vessel chamber was replaced with buffer equilibrated with 100% nitrogen (pO2 = 12 ± 1 mm Hg). Vessel diameter was again recorded. The chamber buffer was then returned to one equilibrated with room air. Following stabilization, the perfusate was switched to albumin containing buffer to which 1 nM insulin, washed human erythrocytes (hematocrit 17.5%), or washed human erythrocytes treated with 1 nM insulin were added. Care was taken to ensure that the erythrocytes were well distributed within the syringe. Again, the vessel was allowed to stabilize and the sequence of normal and low pO2 exposures repeated. In some experiments, an extra-luminal application of 50 nM acetylcholine was applied to arterioles perfused with buffer alone or buffer containing 1 nM insulin to determine if insulin affected an endothelial-mediated vasodilation. The integrity of the vessel was confirmed by a second pH test.
Data Analysis
Statistical significance between groups was determined using an analysis of variance (ANOVA). In the event that the F ratio indicated that a change had occurred, a Fisher’s LSD test was performed to identify individual differences. Results were reported as means ± the standard error (SE).
Institutional Approval
The protocol used to obtain blood from humans was approved by the Institutional Review Board of Saint Louis University. The protocol describing the use of hamsters was approved by the Institutional Animal Care and Use Committee of Saint Louis University.
Results
Effect of Insulin on Mas 7– Induced ATP Release From Human Erythrocytes
Erythrocytes possess the heterotrimeric G protein Gi and this protein is a critical component of a signal transduction pathway that stimulates the release of ATP from these cells (24, 31). Indeed, incubation of human and rabbit erythrocytes with Mas 7, a direct activator of Gi (16), has been previously shown to stimulate ATP release from these cells (24, 31, 36). To determine the effect of insulin on Mas 7–induced ATP release from human erythrocytes, cells were incubated with 10 μM Mas 7 in the presence or absence of 1 nM insulin. As depicted in figure 1, 1 nM insulin attenuated Mas 7-induced ATP release from these cells. Importantly, insulin had no effect on either baseline ATP release or total intracellular ATP levels (1.39 ± 0.32 and 1.29 ± 0.25 mM for control and insulin treated, respectively) ensuring that the decreased ATP release did not reflect a depletion of intracellular ATP by insulin.
Figure 1. Effect of insulin on mastoparan 7(Mas 7)–induced ATP release from erythrocytes.
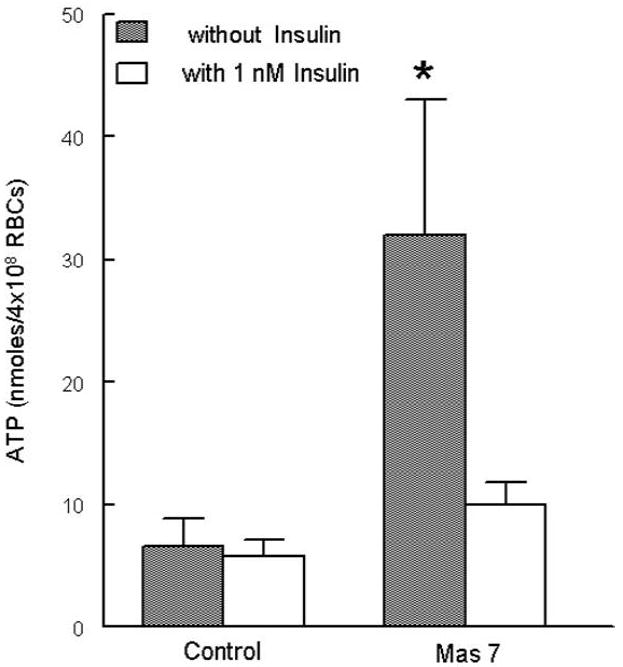
Washed erythrocytes were incubated with Mas 7 (10 μM) 20 minutes after the addition of either insulin (1 nM) or its vehicle (saline) (n=5). ATP release was determined 15 minutes after the addition of Mas 7. Values are the means ± SE. * = greater than all other values (p < 0.05).
Effect of Insulin on SpcAMPS – Induced ATP Release from Human Erythrocytes
Activation of protein kinase A (PKA) is required for ATP to be released from rabbit and human erythrocytes (34). SpcAMPS, a specific activator of PKA (26, 28), stimulates ATP release from these cells (34). To determine if insulin has an effect on SpcAMPS–induced ATP release, erythrocytes were pretreated with 1 nM insulin or its vehicle for 20 minutes followed by treatment with 100 μM SpcAMPS. Insulin did not inhibit erythrocyte ATP release stimulated by SpcAMPS (Fig. 2). These results suggest that insulin affects a component of the signal transduction pathway related to ATP release from erythrocytes that is upstream of the activation of PKA.
Figure 2. Effect of insulin on SpcAMPS–induced ATP release from erythrocytes.
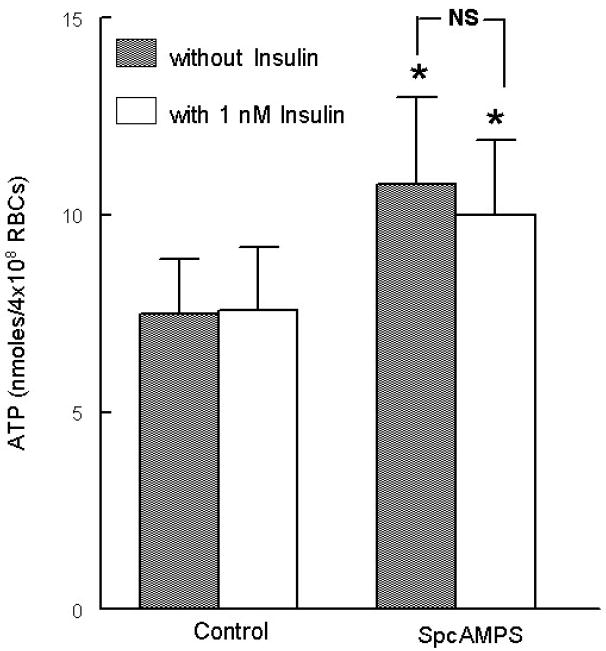
Washed erythrocytes were incubated with SpcAMPS (100 μM) 20 minutes after the addition of either insulin (1 nM) or its vehicle (saline) (n=6). ATP release was determined 30 minutes after the addition of SpcAMPS. Values are the means ± SE. * = greater than control values (p < 0.05), NS = no significant difference between values.
Effect of Insulin on ATP Release from Erythrocytes Induced by Reduced Oxygen Tension
Erythrocytes release ATP in response to reduced oxygen tension (pO2) (6, 12, 25). This ATP release is inhibited by pertussis toxin, an inhibitor of the heterotrimeric G protein Gi (25), demonstrating that ATP release from erythrocytes in response to reduced pO2 requires Gi activation. Since insulin attenuated ATP release induced by a direct activator of Gi (Mas 7), we hypothesized that insulin would also inhibit ATP release in response to the exposure of erythrocytes to reduced pO2 (pO2= 13 ± 1 mm Hg). ATP release stimulated by this physiological stimulus was determined in the absence and presence of 1 nM insulin. Pretreatment of erythrocytes with insulin prevented the increase in ATP release in response to low pO2 (n= 6, p<0.05) (Fig. 3).
Figure 3. Effect of insulin on reduced oxygen tension–induced ATP release from erythrocytes.
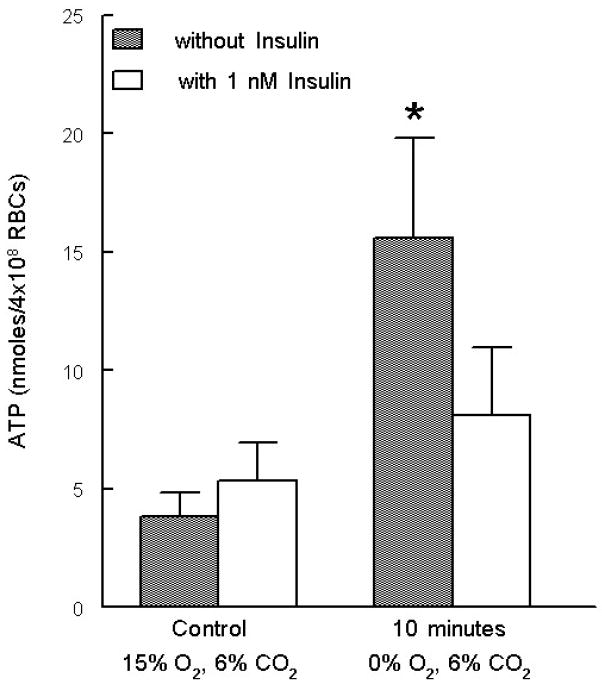
Washed erythrocytes pretreated with insulin or saline for 20 minutes. The cells were then exposed to a gas mixture containing 15% O2, 6% CO2, balance N2 followed by exposure to 0% O2, 6% CO2, balance N2 (n=6). ATP release was determined after a 10 minute exposure to 0% O2. Values are the means ± SE. * = greater than all other values (p < 0.05).
Effect of Insulin on the Response of Isolated, Perfused Arterioles to Reduced Oxygen Tension
Isolated skeletal muscle arterioles (tone diameter = 53 ± 4 μm) were perfused with either buffer alone or with buffer containing washed human erythrocytes in the presence or absence of 1 nM insulin. When arterioles perfused with buffer alone or buffer containing insulin were exposed to a reduced extra-luminal pO2, intra-luminal diameter did not change (n=6, Fig. 4B). In contrast, when these vessels were perfused with buffer containing erythrocytes in the absence of insulin, intra-luminal diameter increased by 18 ± 8% in response to reduced extra-luminal pO2 (n=9, p<0.05) (Fig. 4A). Importantly, when the same vessels were perfused with insulin-treated erythrocytes, exposure to low extra-luminal pO2 did not induce a change in vessel diameter (n=9, Fig. 4A). These results are consistent with the hypothesis that insulin, via inhibition of ATP release from erythrocytes, prevented vasodilation in response to reduced extra-luminal pO2. To demonstrate that the failure of vessels to respond to this stimulus was not a direct effect of insulin on the vessel, buffer–perfused arterioles were treated with acetylcholine in the absence and presence of insulin (1 nM). There was no difference in the vasodilation produced by extra–luminal application of 50 nM acetylcholine to arterioles perfused with buffer alone or buffer containing insulin (Table 1, n=4).
Figure 4. Effect of insulin on the response of isolated arterioles perfused with erythrocytes to reduced oxygen tension.
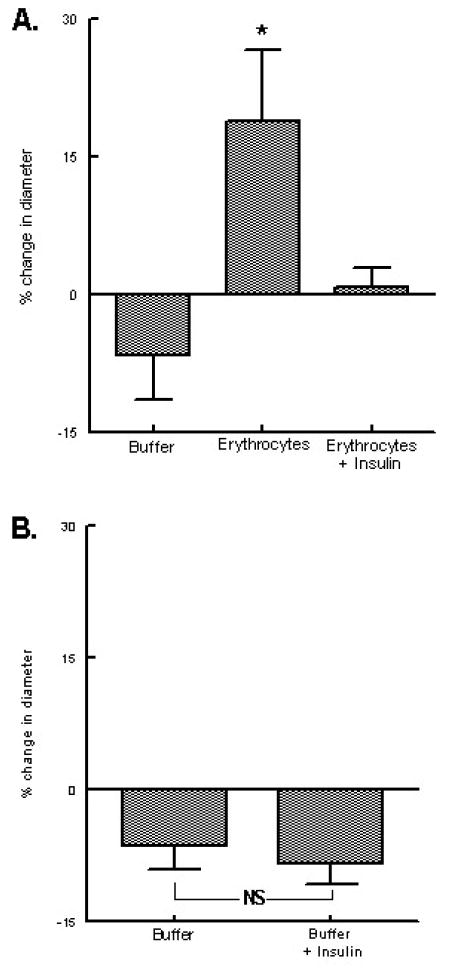
A. Isolated arterioles were exposed to either extra–luminal normoxia or reduced oxygen tension and perfused with buffer, erythrocytes, or erythrocytes treated with 1 nM insulin (n=9). Values are the means ± SE. * = greater than all other values (p < 0.05). B. Isolated arterioles were exposed to either extra luminal normoxia or reduced oxygen tension and perfused with buffer or buffer plus 1 nM insulin (n=6). Values are the means ± SE. NS = no significant difference between values.
Table 1.
Response of Isolated Arterioles to 50 nM Acetylcholine when Perfused with Buffer Alone or Buffer + 1 nM Insulin
| Vessel Diameter (μm) | ||
|---|---|---|
| Buffer Alone | Buffer + Insulin | |
| Control | 51.1 ± 7.1 | 52.4 ± 5.4 |
| 50 nM Acetylcholine | 61.4 ± 5.2* | 60.0 ± 4.5* |
Values are the means ± SE.
= greater than corresponding control values (n=4, p < 0.05).
Discussion
It is clear that, in skeletal muscle, a mechanism exists to ensure that oxygen (O2) supply is matched with O2 demand. Such a mechanism must include a means to both sense O2 need and regulate blood flow, not indiscriminately, but rather in a highly selective fashion to improve O2 delivery to areas of increased O2 need. Although several mechanisms have been proposed to explain this physiologically important mechanism, none fully explain the observed sensitivity of the precise matching of blood flow (O2 supply) with tissue O2 requirements (9, 10, 15, 37).
Recently, it has been suggested that erythrocytes serve to regulate O2 delivery to meet metabolic need in skeletal muscle (11, 19, 37). As erythrocytes traverse the microvasculature, their O2 content declines as O2 is released from hemoglobin to supply tissue needs. This decrease in erythrocyte O2 content initiates the release of ATP from the cell, which in turn stimulates the synthesis of endothelial–derived vasodilators (8, 12, 33). Therefore, ATP release from the erythrocyte enables this cell to deliver O2 adequately to skeletal muscle by increasing blood flow and O2 supply to areas of O2 demand.
In support of such a role for erythrocytes, a signal transduction pathway relating exposure of these cells to reduced O2 tension with ATP release has been defined (31). This pathway includes the heterotrimeric G protein Gi (24, 25), adenylyl cyclase (31, 34), protein kinase A (PKA) (34), and the cystic fibrosis transmembrane conductance regulator (CFTR) (32). This pathway can be stimulated pharmacologically by Mas 7, a direct activator of Gi (16), and physiologically by reduced pO2 (24, 25, 36). Treatment of erythrocytes with pertussis toxin, an inhibitor of Gi, prevents ATP release in response to reduced pO2 (25), demonstrating that activation of Gi is required to elicit this physiological response.
Humans with type II diabetes demonstrate both macro- and microvascular dysfunction resulting in inadequate O2 supply to muscle (3, 7, 21, 41). Importantly, this vascular dysfunction is present in both prediabetes and established type II diabetes (27, 41, 44). Though both endothelium-dependent and -independent vasodilation are reported to be impaired in type II diabetes (22, 45), the mechanisms responsible for vascular dysfunction in prediabetes are less well investigated. Some reports suggest that hyperinsulinemia may play a role in the development of the vascular dysfunction of prediabetes (17, 18). Humans with prediabetes are insulin resistant, but are able to maintain near normal blood glucose levels because of markedly increased insulin secretion by pancreatic β cells resulting in hyperinsulinemia (30, 44). Importantly, increased insulin levels have been associated with impaired vascular function. It was demonstrated that the hyperemic response of individuals with impaired glucose tolerance, i.e. prediabetes, correlated negatively with plasma insulin levels, suggesting a potential pathophysiological consequence of sustained increases in plasma insulin (18). Intriguingly, even plasma insulin levels within the normal range were shown to negatively correlate with the hyperemic response of healthy individuals (1). Insulin has been reported to have direct effects on the vasculature, depending on the state of the endothelium. In normal blood vessels, insulin reportedly stimulates the phosphorylation of endothelial nitric oxide synthase resulting in increased production of nitric oxide and vasodilation (23, 38, 42). In contrast, in the face of endothelial injury, insulin was reported to increase endothelin–1 production resulting in vasoconstriction (2, 13, 20). While the negative correlation of plasma insulin levels and the hyperemic response of individuals with prediabetes could be the result of endothelial injury, this does not explain the observation that insulin levels also negatively correlate with the hyperemic response of healthy individuals. Clearly, insulin can influence vascular reactivity, yet the effects of insulin on ATP release from erythrocytes and matching O2 supply with demand in skeletal muscle have not been previously studied.
Here we investigated the hypothesis that elevated levels of insulin impair ATP release from human erythrocytes. This action of insulin would attenuate a critical signal for the dilation of blood vessels in response to an increase in local O2 tissue need. We report that insulin attenuates ATP release from erythrocytes stimulated via direct activation of the G protein Gi by mastoparan 7 (Mas 7) (16) (Fig. 1). This approach was chosen because activation of Gi is required to stimulate ATP release from erythrocytes in response to reduced pO2 (25). Insulin had no effect on total erythrocyte ATP levels demonstrating that inhibition of ATP release cannot be explained by impaired synthesis.
In addition to activation of Gi, it has been shown that ATP release from erythrocytes requires the activation of protein kinase A (PKA) (34). PKA is activated by the cyclic nucleotide cyclic adenosine monophosphate (cAMP) (43). To determine if insulin inhibits the activation of PKA, preventing ATP release, we incubated erythrocytes with the active non-hydrolysable cAMP analog, SpcAMPS (26, 28, 34). Insulin had no effect on SpcAMPS–induced ATP release (Fig. 2) establishing that insulin induced inhibition of erythrocyte ATP release occurs upstream of PKA activation in the proposed signaling pathway.
If insulin–induced inhibition of ATP release from erythrocytes is of pathophysiological importance, insulin should attenuate ATP release from erythrocytes stimulated by a physiological stimulus such as reduced pO2. Figure 3 illustrates that insulin inhibits ATP release from erythrocytes in response to exposure to this physiological stimulus.
To establish that insulin–induced inhibition of ATP release contributes to vascular dysfunction, we performed a series of experiments to determine if insulin impairs the ability of erythrocytes to stimulate dilation of skeletal muscle resistance vessels exposed to reduced extra-luminal pO2. Isolated arterioles from the hamster cheek pouch retractor muscle were perfused with erythrocytes in the absence or presence of insulin (Fig. 4). Consistent with studies in isolated cerebral vessels (8), isolated skeletal muscle arterioles perfused with erythrocytes dilated when extra-luminal pO2 was reduced. However, when the same vessels were perfused with erythrocytes pretreated with insulin, vessel diameter did not change in response to a similar reduction in extra-luminal pO2. One interpretation of this result is that insulin prevents ATP release from the erythrocyte when extra-luminal pO2 is reduced leading to a decreased stimulus for the production of endothelium-derived vasodilators. Importantly, insulin did not directly impair endothelial-dependent vasodilation as buffer-perfused vessels responded to acetylcholine similarly in the absence or presence of insulin. These results are consistent with the hypothesis that insulin’s ability to inhibit low O2-induced vasodilation of isolated arterioles perfused with erythrocytes is due to its effects on the erythrocytes and not on the vessels themselves.
These results demonstrate, for the first time, that: 1) insulin attenuates ATP release from erythrocytes in response to both pharmacological and physiological activation of the heterotrimeric G protein Gi, 2) insulin impairs the ability of erythrocytes to stimulate dilation of skeletal muscle resistance vessels exposed to reduced extra-luminal pO2, and 3) insulin does not directly inhibit endothelial-dependent dilation of skeletal muscle arterioles.
The results of these studies provide additional support for the hypothesis that the erythrocyte participates in the maintenance of O2 delivery to areas of skeletal muscle under O2 demand by releasing ATP in response to exposure to reduced pO2 (11, 37). The finding that insulin attenuates reduced O2-induced ATP release from human erythrocytes suggests that the impairment in vascular reactivity observed in humans with prediabetes where hyperinsulinemia exists may result, at least in part, from insulin induced inhibition of ATP release from erythrocytes exposed to reduced pO2. Thus, here we describe a novel mechanism by which hyperinsulinemia, associated with prediabetes, could impair the matching of O2 supply with need in skeletal muscle.
Acknowledgments
The authors would like to that J. L. Sprague for inspiration.
This work was supported by National Institutes of Health grants HL-64180 and HL-89094, American Diabetes Association grant RA-133, and an Amercian Heart Association Fellowship (MSH).
Bibliography
- 1.Ardigo D, Franzini L, Valtuena S, Monti LD, Reaven GM, Zavaroni I. Relation of plasma insulin levels to forearm flow-mediated dilatation in healthy volunteers. Am J Cardiol. 2006;97:1250–4. doi: 10.1016/j.amjcard.2005.11.047. [DOI] [PubMed] [Google Scholar]
- 2.Bakker W, Sipkema P, Stehouwer CD, Serne EH, Smulders YM, et al. Protein kinase C theta activation induces insulin-mediated constriction of muscle resistance arteries. Diabetes. 2008;57:706–13. doi: 10.2337/db07-0792. [DOI] [PubMed] [Google Scholar]
- 3.Baldi JC, Aoina JL, Oxenham HC, Bagg W, Doughty RN. Reduced exercise arteriovenous O2 difference in Type 2 diabetes. J Appl Physiol. 2003;94:1033–8. doi: 10.1152/japplphysiol.00879.2002. [DOI] [PubMed] [Google Scholar]
- 4.Bartels DW, Davidson MH, Gong WC. Type 2 diabetes and cardiovascular disease: reducing the risk. J Manag Care Pharm. 2007;13:S2–15. doi: 10.18553/jmcp.2007.13.s2-a.1. quiz S6-7. [DOI] [PMC free article] [PubMed] [Google Scholar]
- 5.Benjamin SM, Valdez R, Geiss LS, Rolka DB, Narayan KM. Estimated number of adults with prediabetes in the US in 2000: opportunities for prevention. Diabetes Care. 2003;26:645–9. doi: 10.2337/diacare.26.3.645. [DOI] [PubMed] [Google Scholar]
- 6.Bergfeld GR, Forrester T. Release of ATP from human erythrocytes in response to a brief period of hypoxia and hypercapnia. Cardiovasc Res. 1992;26:40–7. doi: 10.1093/cvr/26.1.40. [DOI] [PubMed] [Google Scholar]
- 7.Boyle PJ. Diabetes mellitus and macrovascular disease: mechanisms and mediators. Am J Med. 2007;120:S12–7. doi: 10.1016/j.amjmed.2007.07.003. [DOI] [PubMed] [Google Scholar]
- 8.Dietrich HH, Ellsworth ML, Sprague RS, Dacey RG., Jr Red blood cell regulation of microvascular tone through adenosine triphosphate. Am J Physiol Heart Circ Physiol. 2000;278:H1294–8. doi: 10.1152/ajpheart.2000.278.4.H1294. [DOI] [PubMed] [Google Scholar]
- 9.Duling BR. Oxygen sensitivity of vascular smooth muscle. II. In vivo studies. Am J Physiol. 1974;227:42–9. doi: 10.1152/ajplegacy.1974.227.1.42. [DOI] [PubMed] [Google Scholar]
- 10.Ellsworth ML. The red blood cell as an oxygen sensor: what is the evidence? Acta Physiol Scand. 2000;168:551–9. doi: 10.1046/j.1365-201x.2000.00708.x. [DOI] [PubMed] [Google Scholar]
- 11.Ellsworth ML. Red blood cell-derived ATP as a regulator of skeletal muscle perfusion. Med Sci Sports Exerc. 2004;36:35–41. doi: 10.1249/01.MSS.0000106284.80300.B2. [DOI] [PubMed] [Google Scholar]
- 12.Ellsworth ML, Forrester T, Ellis CG, Dietrich HH. The erythrocyte as a regulator of vascular tone. Am J Physiol. 1995;269:H2155–61. doi: 10.1152/ajpheart.1995.269.6.H2155. [DOI] [PubMed] [Google Scholar]
- 13.Eringa EC, Stehouwer CD, van Nieuw Amerongen GP, Ouwehand L, Westerhof N, Sipkema P. Vasoconstrictor effects of insulin in skeletal muscle arterioles are mediated by ERK1/2 activation in endothelium. Am J Physiol Heart Circ Physiol. 2004;287:H2043–8. doi: 10.1152/ajpheart.00067.2004. [DOI] [PubMed] [Google Scholar]
- 14.Hanson MS, Stephenson AH, Bowles EA, Sridharan M, Adderley S, Sprague RS. Phosphodiesterase 3 is present in rabbit and human erythrocytes and its inhibition potentiates iloprost-induced increases in cAMP. Am J Physiol Heart Circ Physiol. 2008;295:H786–93. doi: 10.1152/ajpheart.00349.2008. [DOI] [PMC free article] [PubMed] [Google Scholar]
- 15.Hester RL. Uptake of metabolites by postcapillary venules: mechanism for the control of arteriolar diameter. Microvasc Res. 1993;46:254–61. doi: 10.1006/mvre.1993.1050. [DOI] [PubMed] [Google Scholar]
- 16.Higashijima T, Burnier J, Ross EM. Regulation of Gi and Go by mastoparan, related amphiphilic peptides, and hydrophobic amines. Mechanism and structural determinants of activity. J Biol Chem. 1990;265:14176–86. [PubMed] [Google Scholar]
- 17.Jaap AJ, Hammersley MS, Shore AC, Tooke JE. Reduced microvascular hyperaemia in subjects at risk of developing type 2 (non-insulin-dependent) diabetes mellitus. Diabetologia. 1994;37:214–6. doi: 10.1007/s001250050096. [DOI] [PubMed] [Google Scholar]
- 18.Jaap AJ, Shore AC, Tooke JE. Relationship of insulin resistance to microvascular dysfunction in subjects with fasting hyperglycaemia. Diabetologia. 1997;40:238–43. doi: 10.1007/s001250050669. [DOI] [PubMed] [Google Scholar]
- 19.Jagger JE, Bateman RM, Ellsworth ML, Ellis CG. Role of erythrocyte in regulating local O2 delivery mediated by hemoglobin oxygenation. Am J Physiol Heart Circ Physiol. 2001;280:H2833–9. doi: 10.1152/ajpheart.2001.280.6.H2833. [DOI] [PubMed] [Google Scholar]
- 20.Kolka CM, Rattigan S, Richards S, Clark MG. Metabolic and vascular actions of endothelin-1 are inhibited by insulin-mediated vasodilation in perfused rat hindlimb muscle. Br J Pharmacol. 2005;145:992–1000. doi: 10.1038/sj.bjp.0706263. [DOI] [PMC free article] [PubMed] [Google Scholar]
- 21.Lalande S, Gusso S, Hofman PL, Baldi JC. Reduced leg blood flow during submaximal exercise in type 2 diabetes. Med Sci Sports Exerc. 2008;40:612–7. doi: 10.1249/MSS.0b013e318161aa99. [DOI] [PubMed] [Google Scholar]
- 22.McVeigh GE, Brennan GM, Johnston GD, McDermott BJ, McGrath LT, et al. Impaired endothelium-dependent and independent vasodilation in patients with type 2 (non-insulin-dependent) diabetes mellitus. Diabetologia. 1992;35:771–6. doi: 10.1007/BF00429099. [DOI] [PubMed] [Google Scholar]
- 23.Montagnani M, Chen H, Barr VA, Quon MJ. Insulin-stimulated activation of eNOS is independent of Ca2+ but requires phosphorylation by Akt at Ser(1179) J Biol Chem. 2001;276:30392–8. doi: 10.1074/jbc.M103702200. [DOI] [PubMed] [Google Scholar]
- 24.Olearczyk JJ, Stephenson AH, Lonigro AJ, Sprague RS. Heterotrimeric G protein Gi is involved in a signal transduction pathway for ATP release from erythrocytes. Am J Physiol Heart Circ Physiol. 2004;286:H940–5. doi: 10.1152/ajpheart.00677.2003. [DOI] [PubMed] [Google Scholar]
- 25.Olearczyk JJ, Stephenson AH, Lonigro AJ, Sprague RS. NO inhibits signal transduction pathway for ATP release from erythrocytes via its action on heterotrimeric G protein Gi. Am J Physiol Heart Circ Physiol. 2004;287:H748–54. doi: 10.1152/ajpheart.00161.2004. [DOI] [PubMed] [Google Scholar]
- 26.Rothermel JD, Parker Botelho LH. A mechanistic and kinetic analysis of the interactions of the diastereoisomers of adenosine 3’,5’-(cyclic)phosphorothioate with purified cyclic AMP-dependent protein kinase. Biochem J. 1988;251:757–62. doi: 10.1042/bj2510757. [DOI] [PMC free article] [PubMed] [Google Scholar]
- 27.Sandeman DD, Pym CA, Green EM, Seamark C, Shore AC, Tooke JE. Microvascular vasodilatation in feet of newly diagnosed non-insulin dependent diabetic patients. Bmj. 1991;302:1122–3. doi: 10.1136/bmj.302.6785.1122. [DOI] [PMC free article] [PubMed] [Google Scholar]
- 28.Schaap P, van Ments-Cohen M, Soede RD, Brandt R, Firtel RA, et al. Cell-permeable non-hydrolyzable cAMP derivatives as tools for analysis of signaling pathways controlling gene regulation in Dictyostelium. J Biol Chem. 1993;268:6323–31. [PubMed] [Google Scholar]
- 29.Segura J, Campo C, Ruilope LM, Rodicio JL. Do we need to target ‘prediabetic’ hypertensive patients? J Hypertens. 2005;23:2119–25. doi: 10.1097/01.hjh.0000191907.11606.cc. [DOI] [PubMed] [Google Scholar]
- 30.Shrot P, Sahebzamani FM, Brownlee HJ., Jr Case Study: Screening and Treatment of Pre-Diabetes in Primary Care. Clinical Diabetes. 2004;22:98–100. [Google Scholar]
- 31.Sprague R, Bowles E, Stumpf M, Ricketts G, Freidman A, et al. Rabbit erythrocytes possess adenylyl cyclase type II that is activated by the heterotrimeric G proteins Gs and Gi. Pharmacol Rep. 2005;57(Suppl):222–8. [PubMed] [Google Scholar]
- 32.Sprague RS, Ellsworth ML, Stephenson AH, Kleinhenz ME, Lonigro AJ. Deformation-induced ATP release from red blood cells requires CFTR activity. Am J Physiol. 1998;275:H1726–32. doi: 10.1152/ajpheart.1998.275.5.H1726. [DOI] [PubMed] [Google Scholar]
- 33.Sprague RS, Ellsworth ML, Stephenson AH, Lonigro AJ. ATP: the red blood cell link to NO and local control of the pulmonary circulation. Am J Physiol. 1996;271:H2717–22. doi: 10.1152/ajpheart.1996.271.6.H2717. [DOI] [PubMed] [Google Scholar]
- 34.Sprague RS, Ellsworth ML, Stephenson AH, Lonigro AJ. Participation of cAMP in a signal-transduction pathway relating erythrocyte deformation to ATP release. Am J Physiol Cell Physiol. 2001;281:C1158–64. doi: 10.1152/ajpcell.2001.281.4.C1158. [DOI] [PubMed] [Google Scholar]
- 35.Sprague RS, Olearczyk JJ, Spence DM, Stephenson AH, Sprung RW, Lonigro AJ. Extracellular ATP signaling in the rabbit lung: erythrocytes as determinants of vascular resistance. Am J Physiol Heart Circ Physiol. 2003;285:H693–700. doi: 10.1152/ajpheart.01026.2002. [DOI] [PubMed] [Google Scholar]
- 36.Sprague RS, Stephenson AH, Bowles EA, Stumpf MS, Lonigro AJ. Reduced expression of G(i) in erythrocytes of humans with type 2 diabetes is associated with impairment of both cAMP generation and ATP release. Diabetes. 2006;55:3588–93. doi: 10.2337/db06-0555. [DOI] [PubMed] [Google Scholar]
- 37.Sprague RS, Stephenson AH, Ellsworth ML. Red not dead: signaling in and from erythrocytes. Trends Endocrinol Metab. 2007;18:350–5. doi: 10.1016/j.tem.2007.08.008. [DOI] [PubMed] [Google Scholar]
- 38.Steinberg HO, Brechtel G, Johnson A, Fineberg N, Baron AD. Insulin-mediated skeletal muscle vasodilation is nitric oxide dependent. A novel action of insulin to increase nitric oxide release. J Clin Invest. 1994;94:1172–9. doi: 10.1172/JCI117433. [DOI] [PMC free article] [PubMed] [Google Scholar]
- 39.Strehler B, McElroy W. Assay of adenosine triphosphate. In: Colowick S, Kaplan N, editors. Methods in Ezymology. New York: Academic Press; 1957. pp. 871–3. [Google Scholar]
- 40.Sullivan SM, Pittman RN. Hamster retractor muscle: a new preparation for intravital microscopy. Microvasc Res. 1982;23:329–35. doi: 10.1016/s0026-2862(82)80005-8. [DOI] [PubMed] [Google Scholar]
- 41.Tooke JE. Microvascular function in human diabetes. A physiological perspective. Diabetes. 1995;44:721–6. doi: 10.2337/diab.44.7.721. [DOI] [PubMed] [Google Scholar]
- 42.Vincent MA, Barrett EJ, Lindner JR, Clark MG, Rattigan S. Inhibiting NOS blocks microvascular recruitment and blunts muscle glucose uptake in response to insulin. Am J Physiol Endocrinol Metab. 2003;285:E123–9. doi: 10.1152/ajpendo.00021.2003. [DOI] [PubMed] [Google Scholar]
- 43.Walsh DA. Role of the cAMP-dependent protein kinase as the transducer of cAMP action. Biochem Pharmacol. 1978;27:1801–4. doi: 10.1016/0006-2952(78)90022-9. [DOI] [PubMed] [Google Scholar]
- 44.Wiernsperger N. Defects in microvascular haemodynamics during prediabetes: contributor or epiphenomenon? Diabetologia. 2000;43:1439–48. doi: 10.1007/s001250051552. [DOI] [PubMed] [Google Scholar]
- 45.Williams SB, Cusco JA, Roddy MA, Johnstone MT, Creager MA. Impaired nitric oxide-mediated vasodilation in patients with non-insulin-dependent diabetes mellitus. J Am Coll Cardiol. 1996;27:567–74. doi: 10.1016/0735-1097(95)00522-6. [DOI] [PubMed] [Google Scholar]