

Abstract
Diabetic nephropathy manifests aberrant activation of TORC1, which senses key signals to modulate protein synthesis and renal hypertrophy. PRAS40 has recently been identified as a raptor-interacting protein and is a component and a constitutive inhibitor of TORC1. The mechanism by which high glucose stimulates TORC1 activity is not known. PRAS40 was identified in the mesangial cells in renal glomeruli and in tubulointerstitium of rat kidney. Streptozotocin-induced diabetic renal hypertrophy was associated with phosphorylation of PRAS40 in the cortex and glomeruli. In vitro, high glucose concentration increased PRAS40 phosphorylation in a PI 3 kinase- and Akt-dependent manner, resulting in dissociation of raptor-PRAS40 complex in mesangial cells. High glucose augmented the inactivating and activating phosphorylation of 4EBP-1 and S6 kinase, respectively with concomitant induction of protein synthesis and hypertrophy. Expression of TORC1-nonphosphorylatable mutant of 4EBP-1 and dominant negative S6 kinase significantly inhibited high glucose-induced protein synthesis and hypertrophy. PRAS40 knockdown mimicked the effect of high glucose on phosphorylation of 4EBP-1 and S6 kinase, protein synthesis and hypertrophy. To elucidate the role of PRAS40 phosphorylation, we used phosphorylation-deficient mutant of PRAS40, which in contrast to PRAS40 knockdown inhibited phosphorylation of 4EBP-1 and S6 kinase, leading to reduced mesangial cell hypertrophy. Thus our data identify high glucose-induced phosphorylation and inactivation of PRAS40 as a central node for mesangial cell hypertrophy in diabetic nephropathy.
Keywords: Renal hypertrophy, PI 3 kinase, Akt, PRAS40, TORC1
INTRODUCTION
The pathophysiology of diabetic nephropathy includes changes in the both tubulo-interstitial and glomerular compartments (Kanwar et al., 2008). Kidney hypertrophy including glomerular hypertrophy is among the earliest changes in the kidney in diabetes; this is associated with high glomerular filtration rate, subsequently leading to microalbuminuria, frank proteinuria and fibrosis, resulting in renal failure (Hostetter, 1995; Huang and Preisig, 2000; Lehmann and Schleicher, 2000; Satriano, 2007; Wolf and Ziyadeh, 1999). Podocytes have become the focus of central targets for the development and progression of diabetic albuminuria (Ziyadeh and Wolf, 2008). However, albuminuria regresses in 50% patients, while amassing of mesangial matrix clearly correlates with the progression of nephropathy, suggesting a central role for mesangial cells in this pathology (Caramori et al., 2000; Perkins et al., 2003). Mice genetically deficient in p27Kip1 fail to develop mesangial hypertrophy; they are protected from progressive glomerular injury in diabetes, further demonstrating the critical role played by mesangial cells in diabetic nephropathy (Awazu et al., 2003). In renal hypertrophy, increased fractional volume of the mesangium significantly correlates with mesangial cell hypertrophy, which is characterized by augmented protein and RNA synthesis per cell with no or very little change in DNA synthesis (Mauer et al., 1984). Hyperglycemia increases expression of many hormones and growth factors including angiotensin II, vascular endothelial growth factor (VEGF), insulin-like growth factor and transforming growth factorβ (TGFβ), which contribute to the pathophysiology of diabetic mesangial cell hypertrophy (Kasinath et al., 2009; Kasinath et al., 2006). Mesangial and as such glomerular hypertrophy may contribute to epithelial cell (podocyte) injury and the progressive loss of renal function in diabetic nephropathy (Hostetter, 1995; Hostetter, 2003).
Many recent studies have established a pivotal role of mammalian target of rapamycin (mTOR) in hypertrophy of kidney seen in physiologic states such as compensatory hypertrophy and in disease states such as diabetes (Chen et al., 2005; Lee et al., 2007a). Others and we have demonstrated that hyperglycemia-induced activation of mTOR is partly due to hyperglycemia-induced Akt activation and AMP-activated protein kinase inhibition in the diabetic milieu (Fraenkel et al., 2008; Inoki, 2008; Kasinath et al., 2009; Lee et al., 2007b; Sakaguchi et al., 2006; Sataranatarajan et al., 2007). The mammalian genome codes for a single TOR kinase. The catalytic domain located in the carboxy terminal half of mTOR has sequence similarity with other phosphatidylinositol (PI) kinase related kinases (PIKK) such as DNA-PK, ATM and ATR (Huang and Manning, 2008; Ma and Blenis, 2009; Wullschleger et al., 2006). The FRB domain is located immediately upstream of catalytic domain and is responsible for binding to FKBP12-rapamycin complex. Multiple tandem HEAT repeats, which interact with other proteins, are present in the N-terminus of mTOR. The carboxy terminal half of the kinase contains two FAT domains, a large one upstream of FRB domain and one at the C-terminus (FATC), which is required for the catalytic activity of mTOR (Takahashi et al., 2000).
mTOR is present in two functionally distinct multiprotein complexes (Loewith et al., 2002). TORC1 contains four proteins, raptor, PRAS40, deptor and mLST8/GβL, with mTOR catalytic subunit (Guertin and Sabatini, 2007; Sancak et al., 2007). TORC2 comprises of mTOR, rictor, mLST8/GβL, SIN1, protor and deptor (Guertin and Sabatini, 2007; Peterson et al., 2009; Sarbassov et al., 2004; Woo et al., 2007; Wullschleger et al.,2006). The common subunit mLS8/GβL was found to be dispensable for TORC1 activity but it is required for TORC2 function (Guertin et al., 2006). On the other hand deptor acts as an inhibitor for both TORC1 and TORC2 (Peterson et al., 2009). Raptor in TORC1 complex is essential for its activity and contains docking site for TORC1 substrates such as S6 kinase and 4EBP-1 (Fingar and Blenis, 2004; Wullschleger et al., 2006). Rictor, SIN1 and mLST8/GβL regulate the integrity of the TORC2 complex and deficiency of any of these proteins abrogates TORC2 activity, which phosphorylates Akt at serine-473 residue to increase its kinase activity (Guertin et al., 2006; Sarbassov et al., 2004). However, others and we have recently shown that TORC2 determines the substrate specificity of Akt rather than absolute activity (Das et al., 2008a; Frias et al., 2006; Jacinto et al., 2006; Shiota et al., 2006).
The TORC1 component PRAS40 was originally identified as an Akt substrate, although Akt-independent phosphorylation has been reported (Huang and Porter, 2005; Kovacina et al., 2003; Zhang et al., 2009). PRAS40 acts as an endogenous negative regulator of TORC1 activity and thus it blocks the biological activity downstream of TORC1 (Sancak et al., 2007). Insulin-induced phosphorylation of PRAS40 inactivates its inhibitory function on TORC1 activity (Sancak et al., 2007). TORC1 regulates protein synthesis necessary for hypertrophy in diabetic kidney disease (Sataranatarajan et al., 2007). However, the mechanism by which high glucose may induce protein synthesis and in turn mesangial cell hypertrophy is not known. In the present study, we demonstrate that hyperglycemia in vivo and high glucose in vitro increase phosphorylation of PRAS40, which maintains interplay between Akt kinase and TORC1 to inactivate 4EBP-1 and activate S6 kinase, resulting in glomerular mesangial cell hypertrophy. Our results provide novel insights into the role of PRAS40 in the induction of glomerular specially mesangial cell hypertrophy during the development of diabetic nephropathy.
MATERIALS AND METHODS
Antibodies and Reagents
Streptozotocin, D-glucose, D-mannitol, anti-actin antibody, phenylmethylsulfonylfluoride, Na3VO4, NP-40 and protease inhibitor cocktail were purchased from Sigma, St. Louis, MO. Ly294002 and Annexin V-FITC Apoptosis Detection Kit were obtained from Calbiochem, San Diego, CA. Phospho-PRAS40, PRAS40, phospho-Akt (Ser-473), Akt, phospho-S6 kinase (Thr-389), S6 kinase, phospho-mTOR (Ser 2448), mTOR, phospho-4EBP-1 (Thr 37/46), 4EBP-1, raptor and phospho-p85 (Tyr-458) antibodies were purchased from Cell Signaling, Boston, MA. PTEN and p85 antibodies were obtained from Santa Cruz, Delaware, CA. Anti-HA tag antibody was obtained from Covance, Princeton, NJ. Anti-phospho-tyrosine, clone 4G10 antibody was purchased from Upstate, Lake Placid, NY. PRAS40 antibody for immunohistochemistry was purchased from Santa Cruz. Biotin-labeled donkey anti-rabbit IgG and avidin-biotin complex were obtained from Chemicon and Vector Laboratories, respectively. Fugene-HD transfection reagents were purchased from Roche Molecular Biology, Indianapolis, IN. Phospho-defective mutant PRAS40T246A expression plasmid was obtained from Addgene Inc, Cambridge, MA (www.addgene.org). This plasmid was submitted to Addgene by Dr. David M. Sabatini. PRAS40 shRNA and scrambled RNA expression plasmids were kind gifts from Dr. D. M. Sabatini, Whitehead Institute for Biomedical Research (Sancak et al., 2007). The adenovirus vectors expressing a deletion mutant of p85 regulatory subunit of PI 3 kinase rendering the dominant negative effect, wild type PTEN and dominant negative Akt were described previously (Choudhury, 2001; Das et al., 2008a; Ghosh-Choudhury et al., 2002; Mahimainathan et al., 2006). Construction of adenovirus vector containing the 4EBP-1 mutant with TORC1 phosphorylation sites (T35A, T45A, T69A and S64A) using the AdEassy cloning system was described previously (Das et al., 2008a).
Animal protocol
Male Sprague-Dawley rats weighing 200–250 g were used. In one group, five to six rats were injected intravenously through the tail vein with 55 mg/kg body weight streptozotocin in sodium citrate buffer (pH 4.5). The control group received sodium citrate buffer alone. Blood glucose concentrations were monitored starting at 24 h post-injection, using a LifeScan One Touch glucometer (Johnson and Johnson). A third group of animals after streptozotocin injection was used for insulin treatment. On second day, 4–8 units of insulin were administered (based on morning glucose levels) to maintain normoglycemia. Three units of insulin was injected thereafter every morning. All rats were maintained in accordance with institutional animal care and use committee–approved procedures and had unrestricted access to food and water. At the end of the experiment, 5 days after injection of streptozotocin, rats from three groups were euthanatized, and both kidneys were removed and weighed. Cortical sections of both kidneys from each rat were pooled. Glomeruli were isolated by differential sieving as previously described (Shultz et al., 1988). Also, a slice of cortical tissue from each rat was frozen for biochemical analysis.
Immunohistochemical localization of PRAS40
Localization of PRAS40 in the kidney was assessed by immunoperoxidase histochemistry as previously described (Barnes et al., 1999). Acetone fixed frozen sections (6 μm) were incubated with nonimmune IgG of the same species as the second antibody to block nonspecific binding. The sections were then incubated with rabbit antibody to PRAS40 at a concentration of 10 μg/ml followed by biotin-labeled donkey anti-rabbit IgG as second antibody. Signal was detected employing the avidin-biotin-complex according to the manufacturer’s instructions as previously described (Barnes et al., 1999). Sections were washed with PBS/BSA after all steps. Controls consisted of non-immune rabbit IgG or PBS/BSA in place of primary antibody followed by detection procedures as outlined above. Photographic images were taken using an Olympus AX70 research microscope equipped with a DP70 digital camera.
Cell Culture and adenovirus infection
Kidney glomerular mesangial cells were grown as described previously (Choudhury, 2001). Briefly, the cells were grown in DMEM with 5 mM glucose in the presence of 17% fetal bovine serum with penicillin/streptomycin. At confluency, the serum free medium was added for 48 hours. The cells were incubated with 25 mM glucose-containing DMEM for indicated times. Infection of adenovirus vector was carried out at a multiplicity of infection of 50 as described previously (Das et al., 2008a; Das et al., 2008b; Mahimainathan and Choudhury, 2004; Mahimainathan et al., 2006; Venkatesan et al., 2007; Venkatesan et al., 2006). At 48 hours post-infection, 25 mM glucose was added. As control, 5 mM glucose plus 20 mM mannitol were used (Mahimainathan et al., 2006). Ad GFP expressing green fluorescence protein was used as a control for adenovirus infection (Choudhury, 2001; Ghosh-Choudhury et al., 2002; Mahimainathan et al., 2006; Mahimainathan et al., 2005; Venkatesan et al., 2007).
Immunoblotting and Immunoprecipitation
Mesangial cells were lysed in RIPA buffer (20 mM Tris–HCl, pH 7.5, 150 mM NaCl, 5 mM EDTA, 1 mM Na3VO4, 1 mM PMSF, 0.1% protease inhibitor cocktail and 1% NP-40) at 4 °C for half an hour. The cell debri were pelleted at 10,000 xg for 30 minutes at 4 ° C. Supernatant was collected and protein was estimated using BioRad reagent. For immunoblotting, equal amounts of cell lysates were separated by SDS polyacrylamide gel electrophoresis and transferred to PVDF membrane. Proteins present in the membrane were incubated with indicated antibodies and the protein bands were developed using HRP-conjugated secondary antibody following enhanced chemiluminiscence as described previously (Das et al., 2008a; Mahimainathan and Choudhury, 2004; Mahimainathan et al., 2006; Mahimainathan et al., 2005; Venkatesan et al., 2007; Venkatesan et al., 2006). For immunoprecipitation, mesangial cells were lysed with a buffer containing 40 mM HEPES, pH 7.4, 2 mM EDTA, 10 mM pyrophosphate, 10 mM glycerophosphate, 0.3% CHAPS and 0.1% protease inhibitor cocktail at 4 °C for half an hour. Cell supernatant was used for protein estimation as described above. Equal amounts of protein were immunoprecipitated with the indicated antibodies as described (Choudhury et al., 1998; Das et al., 2008a; Das et al., 2008b; Mahimainathan and Choudhury, 2004). The immunoprecipitates were separated by SDS polyacrylamide gel electrophoresis and transferred to PVDF membrane. Proteins present in the membrane were immunoblotted with indicated antibodies as described above (Das et al., 2008a; Das et al., 2008b; Mahimainathan and Choudhury, 2004; Mahimainathan et al., 2006; Mahimainathan et al., 2005; Venkatesan et al., 2007; Venkatesan et al., 2006).
PI 3 kinase assay
RIPA lysates were immunoprecipitated with the anti-phospho-tyrosine, clone 4G10 antibody. The immunoprecipitates were suspended in 50 μl of PI 3 kinase assay buffer (20 mM Tris-HCl, pH 7.5; 0.1 M NaCl, and 0.5 mM EGTA). 0.5 μl of 20 mg/ml phosphatidylinositol was added and incubated at 25°C for 10 minutes as described previously (Choudhury et al., 1994; Choudhury et al., 1991). 1 μl of 1 M MgCl2 and 10 μCi of γ32P-ATP were added, and the incubation was continued for 10 more minutes. The reaction was stopped essentially as described previously (Choudhury et al., 1994; Choudhury et al., 1991). The reaction product was separated by thin layer chromatography (Choudhury et al., 1994; Choudhury et al., 1991). The PI 3-P spot was visualized by autoradiography.
Protein synthesis assay and measurement of hypertrophy
Mesangial cells were infected with indicated adenovirus vectors for 24 hours followed by incubation with 25 mM glucose or 5 mM glucose plus 20 mM mannitol control for 24 hours. Similarly, 24 hours post-transfection with indicated expression plasmids, the cells were treated with 25 mM glucose or control medium for 24 hours. The cells were incubated with 35S-methionine and the protein synthesis was determined essentially as described previously (Mahimainathan et al., 2006; Senthil et al., 2002). Mesangial cell hypertrophy was expressed as a measure of cellular protein content per cell. To measure hypertrophy, mesangial cells were trypsinized and counted using a hemocytometer. Cells were lysed, and the total protein content was determined using Bio-Rad Protein Assay reagent (Bio-Rad). Hypertrophy was expressed as a ratio of total protein content to cell number (Mahimainathan et al., 2006).
Determination of hypertrophy by measuring cell dimension
Mesangial cells were incubated with 25 mM glucose or 5 mM glucose plus 20 mM mannitol control for 24 hours. After completion of treatment, the cells were trypsinized and cell suspensions were fixed by dilution 1:1 in neutral buffered formalin at room temperature. The suspensions were mixed gently in a rotary shaker overnight at 4°C. The fixed cells were centrifuged and the pellets resuspended in ice-cold PBS. Cells were visualized using a 20X phase-contrast objective on an Olympus AX70 research microscope. Digital images of a minimum of 20 cells/treatment group were recorded. The two dimensional surface area of each cell was measured by tracing its circumference using the polyglonal measurement tool of Image-Pro Plus 7.0 image analysis software calibrated to a stage micrometer.
Detection of apoptosis
Apoptosis of mesangial cells in the presence of high glucose was measured using a kit, which utilizes Annexin V-FITC and propidium iodide. The cells were analyzed by flow cytometry in The University of Texas Health Science Center Core Facility, as previously described (Das et al., 2007; Ghosh Choudhury et al., 2003; Venkatesan et al., 2008).
Transfection
Mesangial cells were transfected with the expression plasmids and vectors using Fugene HD as described (Das et al., 2008a; Das et al., 2008b; Mahimainathan et al., 2009). The transfected cells were treated with 25 mM glucose as indicated as described above.
Statistics
The significance of the data was determined by paired t-test or ANOVA followed by Student–Newman–Keuls analysis as described previously (Das et al., 2008a; Mahimainathan et al., 2006; Mahimainathan et al., 2009). p value less than 0.05 was considered as significant.
RESULTS
Phosphorylation of PRAS40 in renal glomeruli in diabetes
We have characterized early renal hypertrophy using streptozotocin-induced type 1 diabetes in rats (Lee et al., 2007b; Mahimainathan et al., 2006). Blood glucose levels were significantly increased within 5 days after streptozotocin injection (Supplemental Fig. S1). At this stage, the kidneys displayed significant hypertrophy as determined by the ratio of kidney weight to both post- and pre-streptozotocin body weight of the rats (Figs. 1A and 1B). Direct measurement of the kidney weights also showed significant hypertrophy in the diabetic animals (Fig. 1C). Administration of insulin to the diabetic animals ameliorated the hyperglycemia (Supplementary Fig. S1), resulting in attenuation of renal hypertrophy (Figs. 1A – 1C). These data indicate that renal hypertrophy observed in rats was result of hyperglycemia and not due to toxic effects of streptozotocin.
Figure 1.
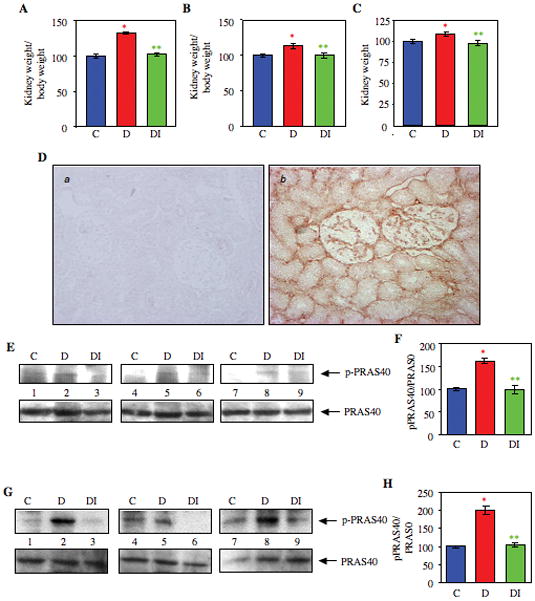
Hyperglycemia induces kidney hypertrophy and phosphorylation of PRAS40 in rats. Diabetes was induced by injecting streptozotocin into rats and kidneys were harvested as described in Materials and Methods. Three groups of animals were used, control, diabetes and diabetes with insulin treatment. (A and B) Renal hypertrophy is expressed as a ratio of kidney weight to total body weight at sacrifice (panel A) and prior to streptozotocin injection (panel B). Panel C shows the kidney weight of the animals at sacrifice. C, control: n= 5; D, diabetes; n = 6; DI, diabetes with insulin; n = 6. In panel A, *p < 0.001 vs. control, **p < 0.001 vs diabetes obtained by ANOVA. In panel B, *p < 0.05 vs. control, **p < 0.05 vs diabetes. In panel C, *p < 0.05 vs. control, **p < 0.05 vs diabetes. (D) Localization of PRAS40 in rat kidney. Acetone-fixed renal sections were stained with nonimmune rabbit IgG or PRAS40 antibody as described in the Materials and Methods. Panel a, IgG control; Panel b, PRAS40 staining. (E) Kidney cortical tissues were lysed in RIPA buffer and lysates were immunoblotted with phospho-PRAS40 (upper panel) and PRAS40 antibodies (lower panel), respectively. C, control animal; D, diabetic animal; DI, diabetic animal treated with insulin. (F) Quantification of the data presented in Fig. 1E. n = 3 animals *p < 0.001 vs. control; **p < 0.01 vs diabetes, obtained by ANOVA. (G) Glomeruli from these rats were isolated as described in the Materials and Methods. Glomerular lysates were immunoblotted with phospho-PRAS40 (upper panel) and PRAS40 antibodies (lower panel), respectively. C, control; D, diabetic. DI, diabetic animal treated with insulin. (H) Quantification of the data presented in 1G. n = 3 animals *p < 0.001 vs. control; **p < 0.001 vs diabetic, obtained by ANOVA.
A role of TORC1 in diabetic renal hypertrophy is reported (Sataranatarajan et al., 2007; Yang et al., 2007). However, the mechanism of activation of TORC1 has not been studied. PRAS40, a component of TORC1, has been shown to activate as well as inhibit TORC1 in vitro in cultured cells (Fonseca et al., 2007; Sancak et al., 2007; Thedieck et al., 2007; Wang and Huang, 2009). To examine the role of PRAS40, we first determined its localization in rat kidney sections. Immunohistochemical analysis revealed abundant expression of PRAS40 in the mesangial cells of the glomeruli (Fig. 1D, panel b). Also, significant tubulointerstitial expression of PRAS40 was evident (Fig. 1D, panel b). Next, we examined the phosphorylation of this protein in renal cortex of diabetic animals. Hyperglycemia significantly increased phosphorylation of PRAS40 in the kidney cortex (Fig. 1E, compare lanes 2, 5 and 8 with lanes 1, 4 and 7, respectively, and 1F). Diabetic nephropathy is associated with glomerular hypertrophy, particularly of mesangial cells. PRAS40 is abundantly expressed in the mesangial area of glomeruli (Fig. 1D, panel b). Therefore, we tested the PRAS40 phosphorylation in the glomerular preparation. PRAS40 phosphorylation was significantly increased in the diabetic glomeruli compared with that from the control animals (Fig. 1G, compare lanes 2, 5 and 8 with lanes 1, 4 and 7, respectively, and 1H). Furthermore, phosphorylation of PRAS40 was significantly reduced in both cortical and glomerular lysates from the diabetic animals treated with insulin (Figs. 1E and 1G, compare lanes 3, 6 and 9 with lanes 2, 5 and 8, respectively, and Figs. 1F and 1H). These results conclusively demonstrate that phosphorylation of PRAS40 is not due to the result of toxic effects of streptozotocin. Indeed hyperglycemia-induced renal hypertrophy is associated with phosphorylation of PRAS40.
PI 3 kinase/Akt signaling regulates high glucose-induced phosphorylation of PRAS40
To elucidate the mechanism of glomerular phosphorylation of PRAS40, we used cultured rat mesangial cells. Incubation of mesangial cells with 25 mM glucose rapidly and significantly increased the phosphorylation of PRAS40 at Thr-246 in a time-dependent manner compared with cells incubated with 5 mM glucose plus 20 mM mannitol (low glucose, osmotic control) (Fig. 2A, Supplemental Fig. S2A). The time course of PRAS40 phosphorylation coincided with high glucose-induced phosphorylation of Akt (Fig. 2B, Supplemental Fig. S2B). Akt phosphorylation and hence its activation is mediated by activated PI 3 kinase, which consists of 110 kD catalytic and 85 kD regulatory subunits (Cantley and Neel, 1999; Cully et al., 2006). Phosphorylation of p85 subunit at tyrosine 458 residue is associated with the activation of PI 3 kinase (Kong et al., 2000; Rush et al., 2005). High glucose increased the phosphorylation of p85 subunit of PI 3 kinase in a time-dependent manner similar to phosphorylation of Akt (Fig. 2C, Supplemental Fig. S2C). Finally, we measured the PI 3 kinase activity in the anti-phospho-tyrosine immunoprecipitates from high glucose-stimulated mesangial cells. Fig. 2D shows time-dependent increase in PI 3 kinase activity in response to high glucose (Supplemental Fig. S2D). These results demonstrate that PI 3 kinase/Akt signal transduction may regulate phosphorylation of PRAS40 by high glucose concentration.
Figure 2.

Phosphorylation of PRAS40 coincides with activation of PI 3 kinase and Akt. (A – C) Mesangial cells were incubated with 25 mM glucose for indicated periods of time. 5 mM glucose + 20 mM mannitol was used as the osmotic control (lane 1). Lysates were immunoblotted with phospho-PRAS40 (panel A), phospho-Akt (panel B) and phospho-p85 (panel C) antibodies (top panels). Middle panels show immunoblotting of the same samples with PRAS40, Akt and p85 antibodies and bottom panels show immunoblotting with actin antibody. Representative blots from four independent experiments are shown in panels A and B. Representative of two independent experiments is shown in panels C and D. Quantification of these data is shown in Supplemental Fig. S2A-S2C. (D) High glucose increases PI 3 kinase activity in mesangial cells. Anti-phospho-tyrosine immunoprecipitates of lysates of cells harvested at indicated time-points were assayed for PI 3 kinase activity as described in the Materials and Methods. Quantification of these data is shown in Supplemental Fig. S2D.
We next investigated the involvement of the lipid kinase cascade in phosphorylation of PRAS40. Ly294002, a pharmacologic inhibitor of PI 3 kinase, significantly inhibited high glucose-induced phosphorylation of PRAS40 (Fig. 3A, Supplemental Fig. S3A). To confirm this observation, we used an adenovirus vector expressing inter-SH2 domain deleted p85 subunit of PI 3 kinase. This mutant exhibits dominant negative effect of the PI 3 kinase activity (Das et al., 2008a; Ghosh-Choudhury et al., 2002; Quon et al., 1995). Expression of dominant negative PI 3 kinase significantly blocked PRAS40 phosphorylation (Fig. 3B, Supplemental Fig. S3B). The tumor suppressor protein PTEN is an endogenous inhibitor of PI 3 kinase signaling (Cantley and Neel, 1999; Cully et al., 2006). We tested the effect of PTEN expression on high glucose-induced PRAS40 phosphorylation using an adenovirus vector expressing PTEN (Das et al., 2008b; Mandal et al., 2009). Expression of PTEN inhibited high glucose-mediated phosphorylation of PRAS40 (Fig. 3C, Supplemental Fig. S3C). Since Akt is downstream of PI 3 kinase, we examined the role of Akt in PRAS40 phosphorylation. Infection of an adenovirus vector expressing dominant negative Akt kinase completely abrogated PRAS40 phosphorylation in response to high glucose (Fig. 3D, Supplemental Fig. S3D). These data demonstrate that activation of PI 3 kinase/Akt axis is necessary and sufficient to account for PRAS40 phosphorylation in high glucose-treated mesangial cells.
Figure 3.
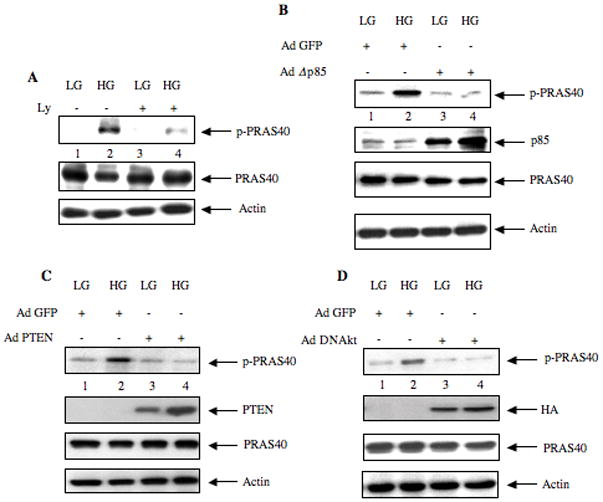
PI 3 kinase/Akt signaling regulates phosphorylation of PRAS40. (A) Mesangial cells were incubated with 25 μM of Ly294002 for 1 hour prior to incubation with high glucose (HG) for 15 minutes. (B – D) Mesangial cells were infected with 50 moi of AdΔ p85 (panel B), Ad PTEN (panel C) and Ad DN Akt (panel D) for 48 hours prior to incubation with high glucose for 15 minutes (HG). As control, infection with Ad GFP was used. Also 5 mM glucose plus 20 mM mannitol was used as control (LG). Equal amounts of cell lysates were immunoblotted with indicated antibodies. Representative of three independent experiments is shown for each panel. Quantification of the data is presented in Supplementary Fig. S3.
Phosphorylation of PRAS40 results in high glucose-induced TORC1 activation
Unphosphorylated PRAS40 binds to raptor, which is part of the TORC1 complex (Sancak et al., 2007). Phosphorylation of PRAS40 appears to dissociate it from raptor. Since high glucose increased PRAS40 phosphorylation, we tested the effect of high glucose on binding of PRAS40 with raptor. Raptor was immunoprecipitated from high glucose-treated mesangial cells; immunoblotting of the immunoprecipitates with PRAS40 antibody showed dissociation of PRAS40 from raptor (Fig. 4A, Supplemental Fig. S4A). Reciprocal immunoprecipitation-immunoblotting experiment confirmed inhibition of binding of PRAS40 with raptor in the presence of high glucose (Fig. 4B, Supplemental Fig. S4B). Next, we examined the activation of TORC1. We considered phosphorylation of 4EBP-1 and S6 kinase as indices for TORC1 activation as they are the direct substrates for this kinase (Huang and Manning, 2008; Ma and Blenis, 2009; Wullschleger et al., 2006). Incubation of mesangial cells with high glucose time-dependently increased the phosphorylation of 4EBP-1 (Fig. 4C, Supplemental Fig. S4C). Similarly, high glucose enhanced the phosphorylation of S6 kinase (Fig. 4D, Supplemental Fig. S4D). These results indicate that dissociation of PRAS40 from raptor-mTOR complex coincides with high glucose-induced activation of TORC1.
Figure 4.
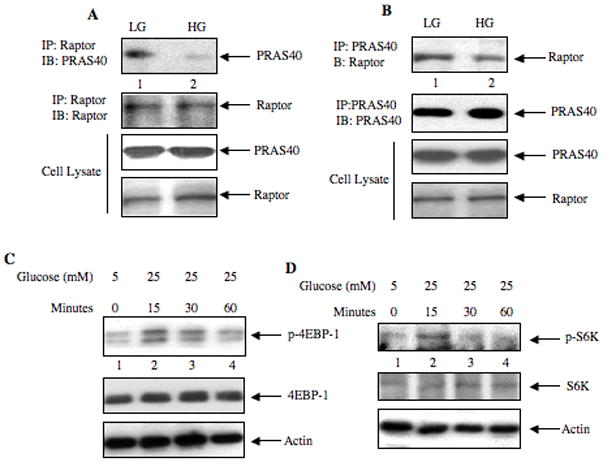
High glucose induces dissociation of PRAS40-Raptor complex and phosphorylation of 4EBP-1 and S6 kinase. (A and B) Mesangial cells were incubated with high glucose (HG, 25 mM glucose) for 15 min. LG, low glucose (5 mM glucose plus 20 mM mannitol). The cell lysates were immunoprecipitated with Raptor (panel A) and PRAS40 (panel B) antibodies respectively. The immunoprecipitates were immunoblotted with PRAS40 and Raptor antibodies as indicated (top two panels). Cell lysates were immunoblotted with PRAS40 and Raptor antibodies as indicated (bottom two panels). (C and D) Mesangial cells were incubated with high glucose as described in the Fig. 2 legends. Cell lysates were immunoblotted with phospho-4EBP-1 (p4EBP-1), 4EBP-1, phospho-S6 kinase (pS6K), S6 kinase (S6K) and actin antibodies, as indicated. Representative of four (panel A and B) and three (panels C and D) independent experiments is shown. Quantification of the data presented in each panel is shown in Supplementary Fig. S4A – S4D.
PI 3 kinase/Akt signaling regulates high glucose-stimulated TORC1 activity
We investigated the role of PI 3 kinase in TORC1 activation using the pharmacologic inhibitor Ly294002. Ly294002 significantly blocked high glucose-induced phosphorylation of 4EBP-1 and S6 kinase, two direct substrates of TORC1 (Fig. 5A, left and right panels; Supplemental Fig. S5A). Expression of dominant negative PI 3 kinase also inhibited phosphorylation of both these proteins in response to high glucose (Fig. 5B, left and right panels; Supplemental Fig. S5B). Similarly, overexpression of PTEN, an inhibitor of PI 3 kinase signaling, attenuated the phosphorylation of 4EBP-1 and S6 kinase (Fig. 5C, left and right panels; Supplemental Fig. S5C). Since Akt is a downstream target of PI 3 kinase (Cantley and Neel, 1999), we tested the effect of dominant negative Akt on TORC1 activation. Adenovirus-mediated expression of dominant negative Akt significantly inhibited the phosphorylation of 4EBP-1 and S6 kinase in response to high glucose (Fig. 5D, left and right panels; Supplemental Fig. S5D). These results indicate that PI 3 kinase/Akt cascade regulates high glucose-induced TORC1 activity in mesangial cells.
Figure 5.
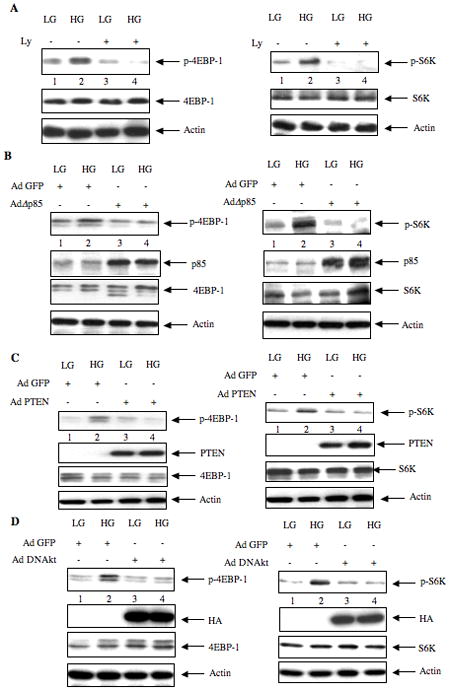
High glucose mediated phosphorylation of 4EBP-1 and S6 kinase is PI 3 Kinase- and Akt-dependent. (A) Mesangial cells were incubated with 25 μM of Ly294002 for 1 hour prior to incubation with HG for15 minutes as described in the Fig. 3A legend. (B – D) Mesangial cells were infected with 50 moi of Ad Δ p85 (panel B), Ad PTEN (panel C) and Ad DN Akt (panel D) as described in the legends of Fig. 3B-3D. Cell lysates were immunoblotted with phospho-4EBP-1 (p-4EBP-1), 4EBP-1, and other indicated antibodies (left panels). In the right panels, the cell lysates were immunoblotted with phospho-S6 kinase (p-S6K), S6 kinase (S6K) and indicated antibodies. Representative of three independent experiments is shown. Quantification of these data is shown in Supplementary Fig. S5A – S5D.
4EBP-1 and S6 kinase regulate high glucose-induced mesangial cell hypertrophy
High glucose-stimulated hypertrophy requires increased protein synthesis. Unphosphorylated 4EBP-1 is a repressor of de novo protein synthesis by a cap-dependent mechanism (Kasinath et al., 2006). TORC1-mediated phosphorylation of 4EBP-1 inactivates its inhibitory function on protein synthesis (Kasinath et al., 2006; Kasinath et al., 2008). Therefore, we examined the role of 4EBP-1 on high glucose-induced protein synthesis using an adenovirus vector expressing a mutant where the four phosphorylation sites for TORC1 were changed to alanine (4EBP-1μ). As expected, incubation of mesangial cells with high glucose increased protein synthesis (Fig. 6A). Expression of 4EBP-1μ significantly inhibited the high glucose-induced protein synthesis (Fig. 6A). Mesangial cell hypertrophy was also determined by the ratio of total protein content to cell number. High glucose induced hypertrophy of mesangial cells (Fig. 6B). 4EBP-1μ expression significantly inhibited the hypertrophy of mesangial cells induced by high glucose (Fig. 6B). To directly measure the cellular hypertrophy, we determined the two-dimensional surface area in images of fixed cells. High glucose significantly increased the size (Supplementary Fig. S6, compare panel b with panel a; indicated by arrows) and the total surface area of the cells (Fig. 6C). Expression of 4EBP-1μ significantly reduced the cell size and surface area (Supplementary Fig. S6, compare panel d with panel b and Fig. 6C), indicating that protein synthesis inhibition results in decrease in mesangial cell hypertrophy. Next, we examined the role of S6 kinase. Expression of dominant negative S6 kinase significantly attenuated the increase in protein synthesis and hypertrophy in response to high glucose (Figs. 6D and 6E). These results indicate that TORC1-phosphorylated and hence inactivated 4EBP-1 and activated S6 kinase regulate high glucose-induced mesangial cell hypertrophy.
Figure 6.
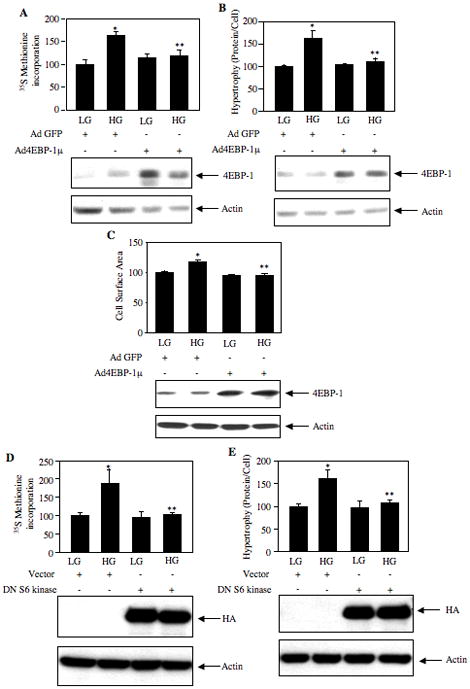
4EBP-1 and S6 kinase regulate high glucose-induced protein synthesis and hypertrophy. Mesangial cells were infected with 50 moi of Ad 4EBP-1μ (panels A, B and C) and transfected with dominant negative S6 kinase (D and E) as described in the Materials and Methods. Cells were treated with 25 mM glucose (HG) for 24 hours. Control cells were treated with 5 mM glucose + 20 mM mannitol (LG) for 24 hours. (A and D) Protein synthesis was determined by 35S Methionine incorporation as described in Materials and Methods (Mahimainathan et al., 2006; Senthil et al., 2002). Mean ± SE of three measurements is shown. *p < 0.01 vs. control; **p < 0.05 vs. HG in panel A; *p < 0.05 vs. control; **p < 0.05 vs. HG in panel D. (C) Treated cells were fixed and the surface area of a minimum of 20 cells were determined using a polygonal measurement tool as described in the Materials and Methods. *p < 0.001 vs. control; **p < 0.001 vs. HG. Bottom panels show immunoblotting of cell lysates with 4EBP-1, HA and actin antibodies to show 4EBP-1 and dominant negative S6 kinase expression levels. (B and E) Cellular hypertrophy was determined by measurement of total protein per cell as described in Materials and Methods (Mahimainathan et al., 2006). Mean ± SE of three measurements is shown. *p < 0.05 vs. control; **p < 0.01 vs. HG in panel B; *p < 0.01 vs. control; **p < 0.05 vs. HG in panel E. Bottom panels show immunoblotting of cell lysates with 4EBP-1, HA and actin antibodies to show 4EBP-1 and dominant negative S6 kinase expression levels.
PRAS40 regulates high glucose-induced TORC1 activity and mesangial cell hypertrophy
Inactivation of PRAS40 appears to regulate the mTORC1 activity (Sancak et al., 2007). To investigate the role of PRAS40 in activation of TORC1 in response to high glucose, we used shRNA-mediated downregulation of PRAS40. Expression of PRAS40 shRNA reduced the levels of PRAS40 in the mesangial cells (Fig. 7A). Fig. 7B shows that downregulation of PRAS40 increased phosphorylation of 4EBP-1 in cells incubated with 5 mM glucose, similar to the increase induced by high glucose (compare lanes 3 and 2 with lane 1; Supplemental Fig. S7A). Similarly, inhibition of PRAS40 expression significantly enhanced S6 kinase phosphorylation in cells incubated with control medium (Fig. 7C, compare lanes 3 and 2 with lane 1; Supplemental Fig. S7B). High glucose had no significant additive effect on phosphorylation of these TORC1 substrates in PRAS40-downregulated mesangial cells (Figs. 7B and 7C; Supplemental Fig. S7A and S7B). Since both these substrates of TORC1 regulate protein synthesis, we tested the involvement of PRAS40 in protein synthesis. Expression of PRAS40 shRNA itself significantly increased protein synthesis in cells incubated with 5 mM glucose (Fig. 8A). High glucose did not have any further significant effect on protein synthesis in PRAS40-downregulated mesangial cells (Fig. 8A). Next, we examined the role of PRAS40 in mesangial cell hypertrophy. Similar to the effect found in protein synthesis, inhibition of PRAS40 expression induced hypertrophy of mesangial cells (Fig. 8B). PRAS40-downregulated cells when incubated with high glucose showed no significant additive effect on hypertrophy (Fig. 8B). These data demonstrate that PRAS40 contributes markedly to high glucose-induced mesangial cell hypertrophy.
Figure 7.
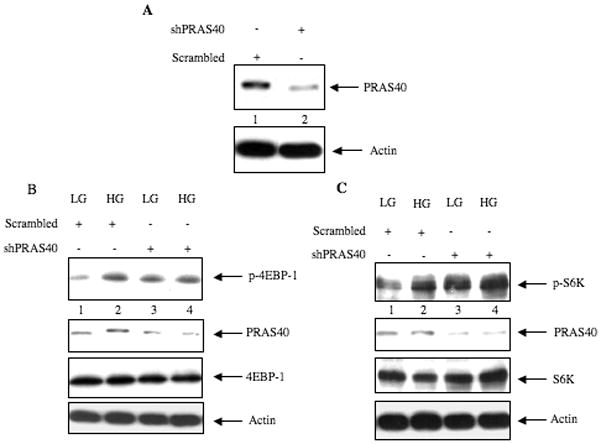
shRNA-mediated downregulation of PRAS40 increases phosphorylation of 4EBP-1 and S6 kinase. (A) Mesangial cells were transfected with a plasmid expressing PRAS40-specific shRNA (shPRAS40) or plasmid expressing scrambled RNA. Cell lysates were immunoblotted with PRAS40 and actin antibodies as indicated. (B and C) Mesangial cells were transfected with shPRAS40 or scrambled RNA expression plasmids. Transfected cells were incubated with high glucose for 15 minutes as described in the legends to the Fig. 3A and 3B. Mannitol was used as the osmotic control. Lysates were immunoblotted with phospho-4EBP-1 (p-4EBP-1), PRAS40, 4EBP-1, phospho-S6 kinase (p-S6K), S6 kinase (S6K) and actin antibodies as indicated. Representative of three independent experiments for panels B and C is shown. Quantification of these data is shown in Supplemental Fig. S7A and S7B.
Figure 8.
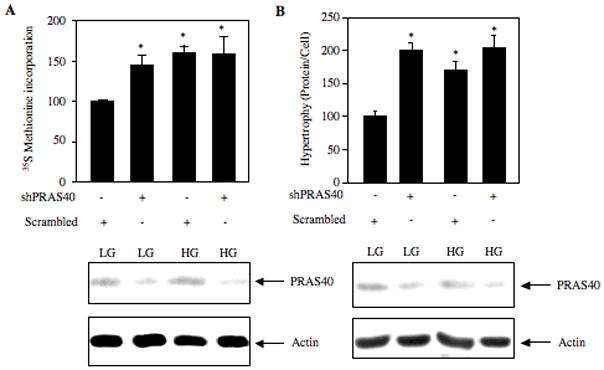
shRNA-targeted downregulation of PRAS40 increases protein synthesis and hypertrophy. Mesangial cells were transfected with shPRAS40 and scrambled RNA as described in the Fig. 7B and 7C. The transfected cells were incubated with high glucose (HG) for 24 hours as described in the legend of Fig. 6. Mannitol was used as the osmotic control as described in Fig. 6. (A) Protein synthesis was determined by 35S Methionine incorporation as described in Materials and Methods. Mean ± SE of three measurements is shown. *p < 0.05 vs. control; (B) Cellular hypertrophy was determined by measurement of total protein per cell as described in the Materials and Methods (Mahimainathan et al., 2006). Mean ± SE of three measurements is shown. *p < 0.01 vs. control. Bottom panels show immunoblotting of cell lysates with PRAS40 and actin antibodies as indicated to show expression levels.
Phosphorylation of PRAS40 at Thr-246 regulates TORC1 activity and mesangial cell hypertrophy
PRAS40 undergoes phosphorylation at multiple serine and threonine residues (Wang et al., 2008). We have shown above that high glucose increases phosphorylation of PRAS40 at Thr-246 and this phosphorylation is Akt kinase-dependent (Fig. 2 and 3D). We investigated the role of Thr-246 phosphorylation of PRAS40 on TORC1 activity. We used a mutant where Thr-246 of PRAS40 was replaced with alanine (PRAS40T246A). Expression of this mutant in mesangial cells significantly inhibited high glucose-induced phosphorylation of 4EBP-1 (Fig. 9A, Supplemental Fig. S8A). Similarly, PRAS40T246A attenuated S6 kinase phosphorylation in response to high glucose (Fig. 9B, Supplemental Fig. S8B). These results indicate that high glucose-stimulated phosphorylation of PRAS40 at threonine-246 relieves its inhibitory action on TORC1 kinase activity. Phosphorylation of mTOR at serine-2448 is concomitant with its enzymatic activity (Chiang and Abraham, 2005; Ma and Blenis, 2009). Therefore, we tested the effect of PRAS40T246A on phosphorylation of mTOR. Expression of PRAS40T246A significantly inhibited mTOR phosphorylation at serine-2448 (Fig. 9C, Supplemental Fig. S8C).
Figure 9.
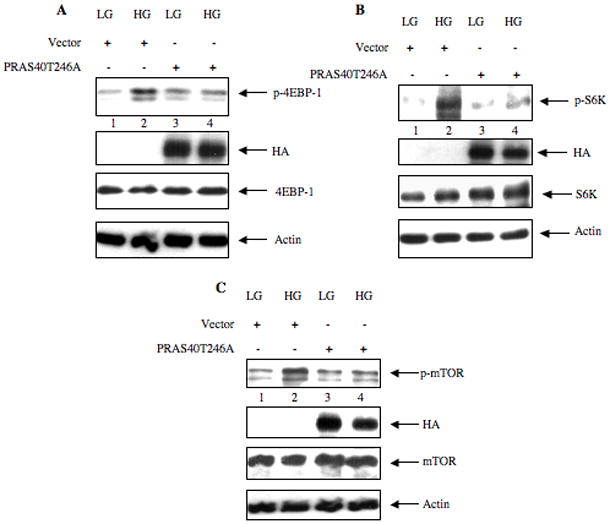
Phosphorylation of PRAS40 at Thr246 is critical for subsequent phosphorylation of 4EBP-1 (panel A), S6 kinase (panel B), and mTOR (panel C). Mesangial cells were transfected with plasmid expressing HA-tagged phosphorylation defective mutant of PRAS40 (PRAS40T246A) or vector. The transfected cells were treated with high glucose (HG) for 15 minutes as described in the legends of Fig. 3A and 3B. Mannitol was used as the osmotic control. Lysates were immunoblotted with phospho-4EBP-1 (p-4EBP-1), HA (to detect PRAS40T246A expression), 4EBP-1, phospho-S6 kinase (p-S6K), S6 kinase (S6K), phospho-mTOR (p-mTOR), mTOR and actin antibodies as indicated in each panel. Representative of three independent experiments is shown for each panel. Quantification of these data is presented in Supplementary Fig. S8A – S8C.
Threonine-246 phosphorylation of PRAS40 is necessary for TORC1 activity to phosphorylate 4EBP-1 and S6 kinase, which are required for glucose-induced mesangial cell hypertrophy. We investigated the involvement of threonine-246 phosphorylation of PRAS40 on hypertrophy of mesangial cells. Since increased protein synthesis is associated with increased cell size, we first tested the effect of PRAS40T246A on high glucose-induced protein synthesis. Expression of non-phosphorylatable mutant PRAS40T246A significantly inhibited high glucose-induced protein synthesis (Fig. 10A), supporting our observation that this mutant inhibits phosphorylation of 4EBP-1 and S6 kinase (Fig. 9A and 9B; Supplemental Fig. S8A and 8B), which are necessary for protein synthesis. Similarly, PRAS40T246A significantly attenuated hypertrophy of mesangial cells in response to high glucose (Fig. 10B). Phosphorylated and thus inactivated PRAS40 causes increased cell survival, indicating a role of this TORC1 inhibitor in apoptosis (Huang and Porter, 2005; Saito et al., 2004). However, in mesangial cells, high glucose as well as expression of nonphosphorylatable PRAS40T246A did not induce apoptosis (Fig. 10C). Together these data indicate that phosphorylation of Thr-246 residue of PRAS40 is a prerequisite for high glucose-induced hypertrophy of mesangial cells.
Figure 10.
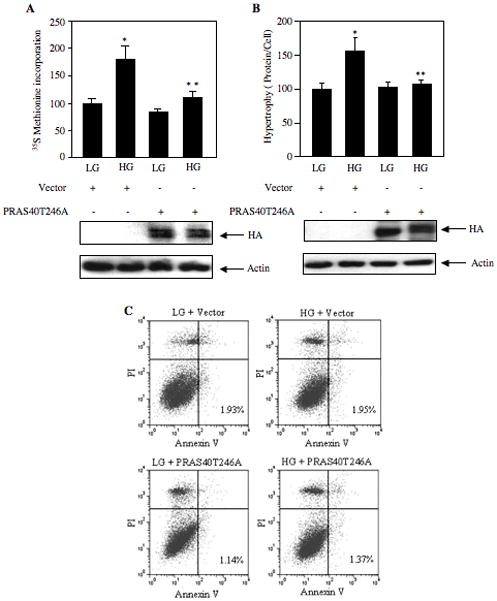
Thr246 phosphorylation of PRAS40 is critical for protein synthesis and hypertrophy in mesangial cells in the absence of apoptosis. Mesangial cells were transfected with the PRAS40T246A mutant plasmid or vector plasmid. Transfected cells were treated with high glucose (HG) for 24 hours as described in the legends to the Fig. 6. (A) Protein synthesis was determined by 35S-Methionine incorporation as described in Materials and Methods. Mean ± SE of three measurements is shown. *p < 0.01 vs. control; **p < 0.01 vs. high glucose-treated. (B) Cellular hypertrophy was determined by measurement of total protein per cell as described in Materials and Methods (Mahimainathan et al., 2006). Mean ± SE of three measurements is shown. *p < 0.05 vs. control; **p < 0.05 vs. high glucose treated. Bottom panels show immunoblotting of cell lysates with HA and actin antibodies as indicated to show expression levels. (C) Apoptosis of mesangial cells was determined using Annexin V method as described in the Materials and Methods (Das et al., 2007; Ghosh Choudhury et al., 2003; Venkatesan et al., 2008). The numbers in the bottom right quadrants show percentage of mesangial cells apoptosis.
DISCUSSION
Here we report that high glucose increases phosphorylation of PRAS40, an endogenous inhibitor of TORC1 signal transduction. This phosphorylation was mediated by PI 3 kinase-dependent Akt kinase, which regulates phosphorylation of TORC1 substrates 4EBP-1 and S6 kinase to increase hypertrophy of mesangial cells. We demonstrate that PRAS40 protein levels in mesangial cells modulate the phosphorylation status of the TORC1 substrates necessary for protein synthesis and hypertrophy of mesangial cells. Furthermore, our data provide the first evidence for a role of threonine-246 residue of PRAS40 in high glucose-induced mesangial cell hypertrophy.
Multiple signal transduction pathways including growth factor, stress, nutrients and energy regulate TORC1 activity, which involves the tuberous sclerosis complex (TSC1-TSC2) (Huang and Manning, 2008; Inoki et al., 2003). Growth factor-induced activation of Akt kinase phosphorylates TSC2, which inhibits its GAP activity toward Rheb GTPase, while energy depletion activates TSC2 GAP activity by stimulating the AMPK (Huang and Manning, 2008; Inoki et al., 2003). Rheb with very low affinity binds to mTOR and when charged with GTP increases its kinase activity (Long et al., 2005). However, Akt-independent mechanism of TORC1 activation is reported with amino acid stimulation, where Rag-GTPases and their GTP loading are essential for TORC1 activity (Sancak et al., 2008). An alternative and additional mechanism by which TORC1 can be activated involves PRAS40 (Sancak et al., 2007). Phosphorylation of PRAS40 at threonine-246 was identified in insulin signaling by Akt kinase (Kovacina et al., 2003; Sancak et al., 2007). However, Akt independent phosphorylation of PRAS40 has been reported (Fonseca et al., 2008). In fact PIM1 kinase has been shown to phosphorylate PRAS40 at threonine-246 (Zhang et al., 2009). Similar to TSC2, phosphorylation of PRAS40 at this site inactivates its inhibitory function, resulting in TORC1 activation. Furthermore, activated TORC1 phosphorylates PRAS40 at two distinct sites (Oshiro et al., 2007; Wang et al., 2008). We for the first time demonstrate phosphorylation of PRAS40 by hyperglycemia and high glucose in streptozotocin-induced diabetic rat glomeruli in vivo and in mesangial cells in vitro, respectively (Figs. 1, 2 and Supplementary Fig. S2). Moreover, we demonstrate that stimulation of PRAS40 phosphorylation by high glucose requires PI 3 kinase-dependent Akt kinase activation in mesangial cells (Fig. 3 and Supplementary Fig. S3).
The function of raptor in the TORC1 is to bind the substrates, which are then phosphorylated by the mTOR kinase (Huang and Manning, 2008; Inoki, 2008; Ma and Blenis, 2009; Wullschleger et al., 2006). TORC1 phosphorylates two distinctly unrelated protein substrates 4EBP-1 and S6 kinase with different phosphorylation sites (Inoki et al., 2003; Wullschleger et al., 2006). Both 4EBP-1 and S6 kinase contain a TOS motif in their C- and N-terminus respectively (Schalm and Blenis, 2002; Schalm et al., 2003). Mutations in TOS motif cause disruption of raptor and these substrates, leading to loss of phosphorylation by TORC1 (Choi et al., 2003; Nojima et al., 2003; Schalm and Blenis, 2002; Schalm et al., 2003). Similar to 4EBP-1 and S6 kinase, PRAS40 also contains a TOS motif by which it interacts with raptor (Oshiro et al., 2007; Sancak et al., 2007; Wang et al., 2007). Along with TOS motif, PRAS40 also binds to raptor via its KSLP region. Thus PRAS40 has stronger binding affinity for raptor than 4EBP-1 and S6 kinase (Wang et al., 2007). In the mesangial cells, we also demonstrate constitutive binding of PRAS40 with raptor (Fig. 4A, 4B and Supplementary Fig. S4A, S4B). In fact the inhibitory activity of PRAS40 on TORC1 has been ascribed to the stronger competition by this protein for raptor than 4EBP-1 and S6 kinase (Oshiro et al., 2007; Wang et al., 2007). High glucose significantly increased phosphorylation of PRAS40 resulting in dissociation of this protein from raptor, leading to enhanced phosphorylation of 4EBP-1 and S6 kinase (Fig. 4C, 4D and Supplementary Figs. S4C and S4D).
The mRNA translation repressor 4EBP-1 and S6 kinase regulate the protein synthesis from 5′-terminal oligopyrimidine (TOP)-containing mRNAs (Kasinath et al., 2009; Kasinath et al., 2006; Kasinath et al., 2008; Ma and Blenis, 2009). Actually, TORC1-mediated phosphorylation of 4EBP-1 and S6 kinase derepresses and activates the biological activity of these two proteins respectively, leading to increased protein synthesis in response to growth factors and amino acids through independent mechanisms. For example the growth factor-induced protein synthesis is PI 3 kinase/Akt-dependent where amino acids do not require the activation of Akt kinase (Wullschleger et al., 2006). In the present study, we show that rapid PI 3 kinase/Akt signaling contributes to high glucose-induced phosphorylation of PRAS40, resulting in phosphorylation of 4EBP-1 and S6 kinase, leading to increased protein synthesis and hypertrophy of mesangial cells (Figs. 2, 3, 5, and 6, and Supplementary Figs. S2, S3, S5 and S6). Although PRAS40 phosphorylation in response to high glucose was rapid (Fig. 2), at 24 hours of glucose stimulation, significant phosphorylation of PRAS40 was still evident concomitant with increase in Akt phosphorylation (Supplementary Fig. S9) and mesangial cell hypertrophy (Fig. 6 and Supplementary Fig. S6) (Mahimainathan et al., 2006). These data demonstrate sustained phosphorylation of Akt and PRAS40 induced by high glucose in mesangial cells.
Mutation in dTOR reduces the eye size in Drosophila indicating a role for this kinase in cell size regulation (Oldham et al., 2000). Drosophila Lobe protein represents the ortholog of mammalian PRAS40. Lobe mutants exhibit reduced eye size (Chern and Choi, 2002; Singh et al., 2005). Recently it has been shown that mutation of Lobe resulted in reduced eye size with hypoactive TORC1 (Wang and Huang, 2009). These results indicate that Drosophila PRAS40 positively regulates TORC1 activity. Since mammalian PRAS40 binds stably with raptor and is present in the TORC1 complex, it appears that knocking down PRAS40 may affect its downstream signaling. It would decrease the competition with different TOS motif containing proteins such as 4EBP-1 and S6 kinase for binding to raptor. Knockdown of PRAS40 in HeLa cells increased mTORC1 activity resulting in protection of these cells to apoptosis induced by TNFα and cycloheximide, suggesting that PRAS40 is proapoptotic. However, this protection was not reversed by treating the cells with rapamycin, indicating that this effect of PRAS40 is independent of its inhibitory action on TORC1 (Thedieck et al., 2007). In 293 cells, using siRNA, when levels of PRAS40 were reduced, the TORC1-dependent phosphorylation of 4EBP-1 and activation of S6 kinase were significantly attenuated (Fonseca et al., 2007). These results indicate that both in Drosophila and in HEK293 cells, PRAS40 positively regulates TORC1 activity. In contrast to these results, downregulation of PRAS40 in mesangial cells was sufficient to increase the phosphorylation of 4EBP-1 and S6 kinase, indicating a negative regulatory role of PRAS40 in activation of TORC1 in these cells (Fig. 7 and Supplementary Fig. S7). Furthermore, our results show that reduced PRAS40 levels induced increased protein synthesis, leading to hypertrophy of mesangial cells (Fig. 8). Thus, we conclude that in mesangial cells PRAS40 acts as a potent inhibitor of TORC1 signaling and maintains normal mesangial cell size.
PRAS40 undergoes phosphorylation at multiple serine and threonine residues in vivo as well as in vitro including threonine-246 (Sancak et al., 2007; Vander Haar et al., 2007; Wang et al., 2008). Phosphorylation of this site has been shown to be associated with survival of neuronal cells after stroke and that in cancer cells (Huang and Porter, 2005; Saito et al., 2004). However, in patients with glioma, where TORC1 activity correlated with increased phosphorylation of S6 kinase, significant increase in phosphorylation of PRAS40 could not be detected (McBride et al., 2009). These results indicate that phosphorylation of PRAS40 at threonine-246 may not correlate with TORC1 activity. In contrast to these data, our results using a nonphosphorylatable mutant of PRAS40 in mesangial cells show that threoninie-246 phosphorylation is necessary for high glucose-induced phosphorylation of 4EBP-1 and S6 kinase, indicating its requirement in TORC1 activity (Fig. 9 and Supplementary Fig. S8). Furthermore, we demonstrate that phosphorylation of threonine-246 contributes to the protein synthesis and hypertrophy of mesangial cells in response to high glucose (Fig. 10). In conclusion, we found PRAS40 as a central regulator for integrating PI 3 kinase/Akt signaling in hyperglycemia-induced increase in protein synthesis and mesangial cell hypertrophy.
Supplementary Material
Acknowledgments
The authors thank Dr. L. Mahimainathan for his help in animal experiments. The authors wish to acknowledge The University of Texas Health Science Center FACS Core Facility for FACS analysis provided in this manuscript. This work was supported by NIH RO1 DK50190, The Juvenile Diabetes Research Foundation 1-2008-185 and VA Research Service Merit Review grants to GGC, who is a recipient of Senior Research Career Scientist Award from the Department of Veterans Affairs. NGC is supported by NIH RO1 AR52425 and VA Merit Review grants. BSK is supported by grants from NIH, VA Research Service.
References
- Awazu M, Omori S, Ishikura K, Hida M, Fujita H. The lack of cyclin kinase inhibitor p27(Kip1) ameliorates progression of diabetic nephropathy. J Am Soc Nephrol. 2003;14(3):699–708. doi: 10.1097/01.asn.0000051726.41601.c0. [DOI] [PubMed] [Google Scholar]
- Barnes VL, Musa J, Mitchell RJ, Barnes JL. Expression of embryonic fibronectin isoform EIIIA parallels alpha-smooth muscle actin in maturing and diseased kidney. J Histochem Cytochem. 1999;47(6):787–798. doi: 10.1177/002215549904700608. [DOI] [PubMed] [Google Scholar]
- Cantley LC, Neel BG. New insights into tumor suppression: PTEN suppresses tumor formation by restraining the phosphoinositide 3-kinase/AKT pathway. Proc Natl Acad Sci U S A. 1999;96(8):4240–4245. doi: 10.1073/pnas.96.8.4240. [DOI] [PMC free article] [PubMed] [Google Scholar]
- Caramori ML, Fioretto P, Mauer M. The need for early predictors of diabetic nephropathy risk: is albumin excretion rate sufficient? Diabetes. 2000;49(9):1399–1408. doi: 10.2337/diabetes.49.9.1399. [DOI] [PubMed] [Google Scholar]
- Chen JK, Chen J, Neilson EG, Harris RC. Role of mammalian target of rapamycin signaling in compensatory renal hypertrophy. J Am Soc Nephrol. 2005;16(5):1384–1391. doi: 10.1681/ASN.2004100894. [DOI] [PubMed] [Google Scholar]
- Chern JJ, Choi KW. Lobe mediates Notch signaling to control domain-specific growth in the Drosophila eye disc. Development. 2002;129(17):4005–4013. doi: 10.1242/dev.129.17.4005. [DOI] [PubMed] [Google Scholar]
- Chiang GG, Abraham RT. Phosphorylation of mammalian target of rapamycin (mTOR) at Ser-2448 is mediated by p70S6 kinase. J Biol Chem. 2005;280(27):25485–25490. doi: 10.1074/jbc.M501707200. [DOI] [PubMed] [Google Scholar]
- Choi KM, McMahon LP, Lawrence JC., Jr Two motifs in the translational repressor PHAS-I required for efficient phosphorylation by mammalian target of rapamycin and for recognition by raptor. J Biol Chem. 2003;278(22):19667–19673. doi: 10.1074/jbc.M301142200. [DOI] [PubMed] [Google Scholar]
- Choudhury GG. Akt serine threonine kinase regulates platelet-derived growth factor-induced DNA synthesis in glomerular mesangial cells: regulation of c-fos AND p27(kip1) gene expression. J Biol Chem. 2001;276(38):35636–35643. doi: 10.1074/jbc.M100946200. [DOI] [PubMed] [Google Scholar]
- Choudhury GG, Biswas P, Grandaliano G, Fouqueray B, Harvey SA, Abboud HE. PDGF-mediated activation of phosphatidylinositol 3 kinase in human mesangial cells. Kidney Int. 1994;46(1):37–47. doi: 10.1038/ki.1994.242. [DOI] [PubMed] [Google Scholar]
- Choudhury GG, Ghosh-Choudhury N, Abboud HE. Association and direct activation of signal transducer and activator of transcription1alpha by platelet-derived growth factor receptor. J Clin Invest. 1998;101(12):2751–2760. doi: 10.1172/JCI1044. [DOI] [PMC free article] [PubMed] [Google Scholar]
- Choudhury GG, Wang LM, Pierce J, Harvey SA, Sakaguchi AY. A mutational analysis of phosphatidylinositol-3-kinase activation by human colony-stimulating factor-1 receptor. J Biol Chem. 1991;266(13):8068–8072. [PubMed] [Google Scholar]
- Cully M, You H, Levine AJ, Mak TW. Beyond PTEN mutations: the PI3K pathway as an integrator of multiple inputs during tumorigenesis. Nat Rev Cancer. 2006;6(3):184–192. doi: 10.1038/nrc1819. [DOI] [PubMed] [Google Scholar]
- Das F, Ghosh-Choudhury N, Mahimainathan L, Venkatesan B, Feliers D, Riley DJ, Kasinath BS, Choudhury GG. Raptor-rictor axis in TGFbeta-induced protein synthesis. Cell Signal. 2008a;20(2):409–423. doi: 10.1016/j.cellsig.2007.10.027. [DOI] [PubMed] [Google Scholar]
- Das F, Ghosh-Choudhury N, Venkatesan B, Li X, Mahimainathan L, Choudhury GG. Akt kinase targets association of CBP with SMAD 3 to regulate TGFbeta-induced expression of plasminogen activator inhibitor-1. J Cell Physiol. 2008b;214(2):513–527. doi: 10.1002/jcp.21236. [DOI] [PubMed] [Google Scholar]
- Das F, Mahimainathan L, Ghosh-Choudhury N, Venkatesan B, Kasinath BS, Abboud HE, Ghosh Choudhury G. TGFbeta intercepts nuclear glycogen synthase kinase 3beta to inhibit PDGF-induced DNA synthesis in mesangial cells. FEBS Lett. 2007;581(27):5259–5267. doi: 10.1016/j.febslet.2007.10.014. [DOI] [PubMed] [Google Scholar]
- Fingar DC, Blenis J. Target of rapamycin (TOR): an integrator of nutrient and growth factor signals and coordinator of cell growth and cell cycle progression. Oncogene. 2004;23(18):3151–3171. doi: 10.1038/sj.onc.1207542. [DOI] [PubMed] [Google Scholar]
- Fonseca BD, Lee VH, Proud CG. The binding of PRAS40 to 14-3-3 proteins is not required for activation of mTORC1 signalling by phorbol esters/ERK. Biochem J. 2008;411(1):141–149. doi: 10.1042/BJ20071001. [DOI] [PubMed] [Google Scholar]
- Fonseca BD, Smith EM, Lee VH, MacKintosh C, Proud CG. PRAS40 is a target for mammalian target of rapamycin complex 1 and is required for signaling downstream of this complex. J Biol Chem. 2007;282(34):24514–24524. doi: 10.1074/jbc.M704406200. [DOI] [PubMed] [Google Scholar]
- Fraenkel M, Ketzinel-Gilad M, Ariav Y, Pappo O, Karaca M, Castel J, Berthault MF, Magnan C, Cerasi E, Kaiser N, Leibowitz G. mTOR inhibition by rapamycin prevents beta-cell adaptation to hyperglycemia and exacerbates the metabolic state in type 2 diabetes. Diabetes. 2008;57(4):945–957. doi: 10.2337/db07-0922. [DOI] [PubMed] [Google Scholar]
- Frias MA, Thoreen CC, Jaffe JD, Schroder W, Sculley T, Carr SA, Sabatini DM. mSin1 is necessary for Akt/PKB phosphorylation, and its isoforms define three distinct mTORC2s. Curr Biol. 2006;16(18):1865–1870. doi: 10.1016/j.cub.2006.08.001. [DOI] [PubMed] [Google Scholar]
- Ghosh Choudhury G, Lenin M, Calhaun C, Zhang JH, Abboud HE. PDGF inactivates forkhead family transcription factor by activation of Akt in glomerular mesangial cells. Cell Signal. 2003;15(2):161–170. doi: 10.1016/s0898-6568(02)00057-8. [DOI] [PubMed] [Google Scholar]
- Ghosh-Choudhury N, Abboud SL, Nishimura R, Celeste A, Mahimainathan L, Choudhury GG. Requirement of BMP-2-induced phosphatidylinositol 3-kinase and Akt serine/threonine kinase in osteoblast differentiation and Smad-dependent BMP-2 gene transcription. J Biol Chem. 2002;277(36):33361–33368. doi: 10.1074/jbc.M205053200. [DOI] [PubMed] [Google Scholar]
- Guertin DA, Sabatini DM. Defining the role of mTOR in cancer. Cancer Cell. 2007;12(1):9–22. doi: 10.1016/j.ccr.2007.05.008. [DOI] [PubMed] [Google Scholar]
- Guertin DA, Stevens DM, Thoreen CC, Burds AA, Kalaany NY, Moffat J, Brown M, Fitzgerald KJ, Sabatini DM. Ablation in mice of the mTORC components raptor, rictor, or mLST8 reveals that mTORC2 is required for signaling to Akt-FOXO and PKCalpha, but not S6K1. Dev Cell. 2006;11(6):859–871. doi: 10.1016/j.devcel.2006.10.007. [DOI] [PubMed] [Google Scholar]
- Hostetter TH. Progression of renal disease and renal hypertrophy. Annu Rev Physiol. 1995;57:263–278. doi: 10.1146/annurev.ph.57.030195.001403. [DOI] [PubMed] [Google Scholar]
- Hostetter TH. Hyperfiltration and glomerulosclerosis. Semin Nephrol. 2003;23(2):194–199. doi: 10.1053/anep.2003.50017. [DOI] [PubMed] [Google Scholar]
- Huang B, Porter G. Expression of proline-rich Akt-substrate PRAS40 in cell survival pathway and carcinogenesis. Acta Pharmacol Sin. 2005;26(10):1253–1258. doi: 10.1111/j.1745-7254.2005.00184.x. [DOI] [PubMed] [Google Scholar]
- Huang HC, Preisig PA. G1 kinases and transforming growth factor-beta signaling are associated with a growth pattern switch in diabetes-induced renal growth. Kidney Int. 2000;58(1):162–172. doi: 10.1046/j.1523-1755.2000.00151.x. [DOI] [PubMed] [Google Scholar]
- Huang J, Manning BD. The TSC1-TSC2 complex: a molecular switchboard controlling cell growth. Biochem J. 2008;412(2):179–190. doi: 10.1042/BJ20080281. [DOI] [PMC free article] [PubMed] [Google Scholar]
- Inoki K. Role of TSC-mTOR pathway in diabetic nephropathy. Diabetes Res Clin Pract. 2008;82(Suppl 1):S59–62. doi: 10.1016/j.diabres.2008.09.028. [DOI] [PubMed] [Google Scholar]
- Inoki K, Zhu T, Guan KL. TSC2 mediates cellular energy response to control cell growth and survival. Cell. 2003;115(5):577–590. doi: 10.1016/s0092-8674(03)00929-2. [DOI] [PubMed] [Google Scholar]
- Jacinto E, Facchinetti V, Liu D, Soto N, Wei S, Jung SY, Huang Q, Qin J, Su B. SIN1/MIP1 maintains rictor-mTOR complex integrity and regulates Akt phosphorylation and substrate specificity. Cell. 2006;127(1):125–137. doi: 10.1016/j.cell.2006.08.033. [DOI] [PubMed] [Google Scholar]
- Kanwar YS, Wada J, Sun L, Xie P, Wallner EI, Chen S, Chugh S, Danesh FR. Diabetic nephropathy: mechanisms of renal disease progression. Exp Biol Med (Maywood) 2008;233(1):4–11. doi: 10.3181/0705-MR-134. [DOI] [PubMed] [Google Scholar]
- Kasinath BS, Feliers D, Sataranatarajan K, Ghosh Choudhury G, Lee MJ, Mariappan MM. Regulation of mRNA translation in renal physiology and disease. Am J Physiol Renal Physiol. 2009;297(5):F1153–1165. doi: 10.1152/ajprenal.90748.2008. [DOI] [PMC free article] [PubMed] [Google Scholar]
- Kasinath BS, Mariappan MM, Sataranatarajan K, Lee MJ, Feliers D. mRNA translation: unexplored territory in renal science. J Am Soc Nephrol. 2006;17(12):3281–3292. doi: 10.1681/ASN.2006050488. [DOI] [PubMed] [Google Scholar]
- Kasinath BS, Mariappan MM, Sataranatarajan K, Lee MJ, Ghosh Choudhury G, Feliers D. Novel mechanisms of protein synthesis in diabetic nephropathy--role of mRNA translation. Rev Endocr Metab Disord. 2008;9(4):255–266. doi: 10.1007/s11154-008-9091-3. [DOI] [PMC free article] [PubMed] [Google Scholar]
- Kong M, Mounier C, Wu J, Posner BI. Epidermal growth factor-induced phosphatidylinositol 3-kinase activation and DNA synthesis. Identification of Grb2-associated binder 2 as the major mediator in rat hepatocytes. J Biol Chem. 2000;275(46):36035–36042. doi: 10.1074/jbc.M005621200. [DOI] [PubMed] [Google Scholar]
- Kovacina KS, Park GY, Bae SS, Guzzetta AW, Schaefer E, Birnbaum MJ, Roth RA. Identification of a proline-rich Akt substrate as a 14-3-3 binding partner. J Biol Chem. 2003;278(12):10189–10194. doi: 10.1074/jbc.M210837200. [DOI] [PubMed] [Google Scholar]
- Lee CH, Inoki K, Guan KL. mTOR pathway as a target in tissue hypertrophy. Annu Rev Pharmacol Toxicol. 2007a;47:443–467. doi: 10.1146/annurev.pharmtox.47.120505.105359. [DOI] [PubMed] [Google Scholar]
- Lee MJ, Feliers D, Mariappan MM, Sataranatarajan K, Mahimainathan L, Musi N, Foretz M, Viollet B, Weinberg JM, Choudhury GG, Kasinath BS. A role for AMP-activated protein kinase in diabetes-induced renal hypertrophy. Am J Physiol Renal Physiol. 2007b;292(2):F617–627. doi: 10.1152/ajprenal.00278.2006. [DOI] [PubMed] [Google Scholar]
- Lehmann R, Schleicher ED. Molecular mechanism of diabetic nephropathy. Clin Chim Acta. 2000;297(1–2):135–144. doi: 10.1016/s0009-8981(00)00240-0. [DOI] [PubMed] [Google Scholar]
- Loewith R, Jacinto E, Wullschleger S, Lorberg A, Crespo JL, Bonenfant D, Oppliger W, Jenoe P, Hall MN. Two TOR complexes, only one of which is rapamycin sensitive, have distinct roles in cell growth control. Mol Cell. 2002;10(3):457–468. doi: 10.1016/s1097-2765(02)00636-6. [DOI] [PubMed] [Google Scholar]
- Long X, Lin Y, Ortiz-Vega S, Yonezawa K, Avruch J. Rheb binds and regulates the mTOR kinase. Curr Biol. 2005;15(8):702–713. doi: 10.1016/j.cub.2005.02.053. [DOI] [PubMed] [Google Scholar]
- Ma XM, Blenis J. Molecular mechanisms of mTOR-mediated translational control. Nat Rev Mol Cell Biol. 2009;10(5):307–318. doi: 10.1038/nrm2672. [DOI] [PubMed] [Google Scholar]
- Mahimainathan L, Choudhury GG. Inactivation of platelet-derived growth factor receptor by the tumor suppressor PTEN provides a novel mechanism of action of the phosphatase. J Biol Chem. 2004;279(15):15258–15268. doi: 10.1074/jbc.M314328200. [DOI] [PubMed] [Google Scholar]
- Mahimainathan L, Das F, Venkatesan B, Choudhury GG. Mesangial cell hypertrophy by high glucose is mediated by downregulation of the tumor suppressor PTEN. Diabetes. 2006;55(7):2115–2125. doi: 10.2337/db05-1326. [DOI] [PubMed] [Google Scholar]
- Mahimainathan L, Ghosh-Choudhury N, Venkatesan B, Das F, Mandal CC, Dey N, Habib SL, Kasinath BS, Abboud HE, Ghosh Choudhury G. TSC2 deficiency increases PTEN via HIF1alpha. J Biol Chem. 2009;284(41):27790–27798. doi: 10.1074/jbc.M109.028860. [DOI] [PMC free article] [PubMed] [Google Scholar]
- Mahimainathan L, Ghosh-Choudhury N, Venkatesan BA, Danda RS, Choudhury GG. EGF stimulates mesangial cell mitogenesis via PI3-kinase-mediated MAPK-dependent and AKT kinase-independent manner: involvement of c-fos and p27Kip1. Am J Physiol Renal Physiol. 2005;289(1):F72–82. doi: 10.1152/ajprenal.00277.2004. [DOI] [PubMed] [Google Scholar]
- Mandal CC, Ghosh Choudhury G, Ghosh-Choudhury N. Phosphatidylinositol 3 kinase/Akt signal relay cooperates with smad in bone morphogenetic protein-2-induced colony stimulating factor-1 (CSF-1) expression and osteoclast differentiation. Endocrinology. 2009;150(11):4989–4998. doi: 10.1210/en.2009-0026. [DOI] [PMC free article] [PubMed] [Google Scholar]
- Mauer SM, Steffes MW, Ellis EN, Sutherland DE, Brown DM, Goetz FC. Structural-functional relationships in diabetic nephropathy. J Clin Invest. 1984;74(4):1143–1155. doi: 10.1172/JCI111523. [DOI] [PMC free article] [PubMed] [Google Scholar]
- McBride SM, Perez DA, Polley MY, Vandenberg SR, Smith JS, Zheng S, Lamborn KR, Wiencke JK, Chang SM, Prados MD, Berger MS, Stokoe D, Haas-Kogan DA. Activation of PI3K/mTOR pathway occurs in most adult low-grade gliomas and predicts patient survival. J Neurooncol. 2009 doi: 10.1007/s11060-009-0004-4. [DOI] [PMC free article] [PubMed] [Google Scholar]
- Nojima H, Tokunaga C, Eguchi S, Oshiro N, Hidayat S, Yoshino K, Hara K, Tanaka N, Avruch J, Yonezawa K. The mammalian target of rapamycin (mTOR) partner, raptor, binds the mTOR substrates p70 S6 kinase and 4E-BP1 through their TOR signaling (TOS) motif. J Biol Chem. 2003;278(18):15461–15464. doi: 10.1074/jbc.C200665200. [DOI] [PubMed] [Google Scholar]
- Oldham S, Montagne J, Radimerski T, Thomas G, Hafen E. Genetic and biochemical characterization of dTOR, the Drosophila homolog of the target of rapamycin. Genes Dev. 2000;14(21):2689–2694. doi: 10.1101/gad.845700. [DOI] [PMC free article] [PubMed] [Google Scholar]
- Oshiro N, Takahashi R, Yoshino K, Tanimura K, Nakashima A, Eguchi S, Miyamoto T, Hara K, Takehana K, Avruch J, Kikkawa U, Yonezawa K. The proline-rich Akt substrate of 40 kDa (PRAS40) is a physiological substrate of mammalian target of rapamycin complex 1. J Biol Chem. 2007;282(28):20329–20339. doi: 10.1074/jbc.M702636200. [DOI] [PMC free article] [PubMed] [Google Scholar]
- Perkins BA, Ficociello LH, Silva KH, Finkelstein DM, Warram JH, Krolewski AS. Regression of microalbuminuria in type 1 diabetes. N Engl J Med. 2003;348(23):2285–2293. doi: 10.1056/NEJMoa021835. [DOI] [PubMed] [Google Scholar]
- Peterson TR, Laplante M, Thoreen CC, Sancak Y, Kang SA, Kuehl WM, Gray NS, Sabatini DM. DEPTOR is an mTOR inhibitor frequently overexpressed in multiple myeloma cells and required for their survival. Cell. 2009;137(5):873–886. doi: 10.1016/j.cell.2009.03.046. [DOI] [PMC free article] [PubMed] [Google Scholar]
- Quon MJ, Chen H, Ing BL, Liu ML, Zarnowski MJ, Yonezawa K, Kasuga M, Cushman SW, Taylor SI. Roles of 1-phosphatidylinositol 3-kinase and ras in regulating translocation of GLUT4 in transfected rat adipose cells. Mol Cell Biol. 1995;15(10):5403–5411. doi: 10.1128/mcb.15.10.5403. [DOI] [PMC free article] [PubMed] [Google Scholar]
- Rush J, Moritz A, Lee KA, Guo A, Goss VL, Spek EJ, Zhang H, Zha XM, Polakiewicz RD, Comb MJ. Immunoaffinity profiling of tyrosine phosphorylation in cancer cells. Nat Biotechnol. 2005;23(1):94–101. doi: 10.1038/nbt1046. [DOI] [PubMed] [Google Scholar]
- Saito A, Narasimhan P, Hayashi T, Okuno S, Ferrand-Drake M, Chan PH. Neuroprotective role of a proline-rich Akt substrate in apoptotic neuronal cell death after stroke: relationships with nerve growth factor. J Neurosci. 2004;24(7):1584–1593. doi: 10.1523/JNEUROSCI.5209-03.2004. [DOI] [PMC free article] [PubMed] [Google Scholar]
- Sakaguchi M, Isono M, Isshiki K, Sugimoto T, Koya D, Kashiwagi A. Inhibition of mTOR signaling with rapamycin attenuates renal hypertrophy in the early diabetic mice. Biochem Biophys Res Commun. 2006;340(1):296–301. doi: 10.1016/j.bbrc.2005.12.012. [DOI] [PubMed] [Google Scholar]
- Sancak Y, Peterson TR, Shaul YD, Lindquist RA, Thoreen CC, Bar-Peled L, Sabatini DM. The Rag GTPases bind raptor and mediate amino acid signaling to mTORC1. Science. 2008;320(5882):1496–1501. doi: 10.1126/science.1157535. [DOI] [PMC free article] [PubMed] [Google Scholar]
- Sancak Y, Thoreen CC, Peterson TR, Lindquist RA, Kang SA, Spooner E, Carr SA, Sabatini DM. PRAS40 is an insulin-regulated inhibitor of the mTORC1 protein kinase. Mol Cell. 2007;25(6):903–915. doi: 10.1016/j.molcel.2007.03.003. [DOI] [PubMed] [Google Scholar]
- Sarbassov DD, Ali SM, Kim DH, Guertin DA, Latek RR, Erdjument-Bromage H, Tempst P, Sabatini DM. Rictor, a novel binding partner of mTOR, defines a rapamycin-insensitive and raptor-independent pathway that regulates the cytoskeleton. Curr Biol. 2004;14(14):1296–1302. doi: 10.1016/j.cub.2004.06.054. [DOI] [PubMed] [Google Scholar]
- Sataranatarajan K, Mariappan MM, Lee MJ, Feliers D, Choudhury GG, Barnes JL, Kasinath BS. Regulation of elongation phase of mRNA translation in diabetic nephropathy: amelioration by rapamycin. Am J Pathol. 2007;171(6):1733–1742. doi: 10.2353/ajpath.2007.070412. [DOI] [PMC free article] [PubMed] [Google Scholar]
- Satriano J. Kidney growth, hypertrophy and the unifying mechanism of diabetic complications. Amino Acids. 2007;33(2):331–339. doi: 10.1007/s00726-007-0529-9. [DOI] [PubMed] [Google Scholar]
- Schalm SS, Blenis J. Identification of a conserved motif required for mTOR signaling. Curr Biol. 2002;12(8):632–639. doi: 10.1016/s0960-9822(02)00762-5. [DOI] [PubMed] [Google Scholar]
- Schalm SS, Fingar DC, Sabatini DM, Blenis J. TOS motif-mediated raptor binding regulates 4E-BP1 multisite phosphorylation and function. Curr Biol. 2003;13(10):797–806. doi: 10.1016/s0960-9822(03)00329-4. [DOI] [PubMed] [Google Scholar]
- Senthil D, Choudhury GG, Abboud HE, Sonenberg N, Kasinath BS. Regulation of protein synthesis by IGF-I in proximal tubular epithelial cells. Am J Physiol Renal Physiol. 2002;283(6):F1226–1236. doi: 10.1152/ajprenal.00109.2002. [DOI] [PubMed] [Google Scholar]
- Shiota C, Woo JT, Lindner J, Shelton KD, Magnuson MA. Multiallelic disruption of the rictor gene in mice reveals that mTOR complex 2 is essential for fetal growth and viability. Dev Cell. 2006;11(4):583–589. doi: 10.1016/j.devcel.2006.08.013. [DOI] [PubMed] [Google Scholar]
- Shultz PJ, DiCorleto PE, Silver BJ, Abboud HE. Mesangial cells express PDGF mRNAs and proliferate in response to PDGF. Am J Physiol. 1988;255(4 Pt 2):F674–684. doi: 10.1152/ajprenal.1988.255.4.F674. [DOI] [PubMed] [Google Scholar]
- Singh A, Chan J, Chern JJ, Choi KW. Genetic interaction of Lobe with its modifiers in dorsoventral patterning and growth of the Drosophila eye. Genetics. 2005;171(1):169–183. doi: 10.1534/genetics.105.044180. [DOI] [PMC free article] [PubMed] [Google Scholar]
- Takahashi T, Hara K, Inoue H, Kawa Y, Tokunaga C, Hidayat S, Yoshino K, Kuroda Y, Yonezawa K. Carboxyl-terminal region conserved among phosphoinositide-kinase-related kinases is indispensable for mTOR function in vivo and in vitro. Genes Cells. 2000;5(9):765–775. doi: 10.1046/j.1365-2443.2000.00365.x. [DOI] [PubMed] [Google Scholar]
- Thedieck K, Polak P, Kim ML, Molle KD, Cohen A, Jeno P, Arrieumerlou C, Hall MN. PRAS40 and PRR5-like protein are new mTOR interactors that regulate apoptosis. PLoS One. 2007;2(11):e1217. doi: 10.1371/journal.pone.0001217. [DOI] [PMC free article] [PubMed] [Google Scholar]
- Vander Haar E, Lee SI, Bandhakavi S, Griffin TJ, Kim DH. Insulin signalling to mTOR mediated by the Akt/PKB substrate PRAS40. Nat Cell Biol. 2007;9(3):316–323. doi: 10.1038/ncb1547. [DOI] [PubMed] [Google Scholar]
- Venkatesan B, Ghosh-Choudhury N, Das F, Mahimainathan L, Kamat A, Kasinath BS, Abboud HE, Choudhury GG. Resveratrol inhibits PDGF receptor mitogenic signaling in mesangial cells: role of PTP1B. FASEB J. 2008;22(10):3469–3482. doi: 10.1096/fj.08-109488. [DOI] [PMC free article] [PubMed] [Google Scholar]
- Venkatesan B, Mahimainathan L, Das F, Ghosh-Choudhury N, Ghosh Choudhury G. Downregulation of catalase by reactive oxygen species via PI 3 kinase/Akt signaling in mesangial cells. J Cell Physiol. 2007;211(2):457–467. doi: 10.1002/jcp.20953. [DOI] [PubMed] [Google Scholar]
- Venkatesan BA, Mahimainathan L, Ghosh-Choudhury N, Gorin Y, Bhandari B, Valente AJ, Abboud HE, Choudhury GG. PI 3 kinase-dependent Akt kinase and PKCepsilon independently regulate interferon-gamma-induced STAT1alpha serine phosphorylation to induce monocyte chemotactic protein-1 expression. Cell Signal. 2006;18(4):508–518. doi: 10.1016/j.cellsig.2005.05.022. [DOI] [PubMed] [Google Scholar]
- Wang L, Harris TE, Lawrence JC., Jr Regulation of proline-rich Akt substrate of 40 kDa (PRAS40) function by mammalian target of rapamycin complex 1 (mTORC1)-mediated phosphorylation. J Biol Chem. 2008;283(23):15619–15627. doi: 10.1074/jbc.M800723200. [DOI] [PMC free article] [PubMed] [Google Scholar]
- Wang L, Harris TE, Roth RA, Lawrence JC., Jr PRAS40 regulates mTORC1 kinase activity by functioning as a direct inhibitor of substrate binding. J Biol Chem. 2007;282(27):20036–20044. doi: 10.1074/jbc.M702376200. [DOI] [PubMed] [Google Scholar]
- Wang YH, Huang ML. Reduction of Lobe leads to TORC1 hypoactivation that induces ectopic Jak/STAT signaling to impair Drosophila eye development. Mech Dev. 2009;126(10):781–790. doi: 10.1016/j.mod.2009.08.005. [DOI] [PubMed] [Google Scholar]
- Wolf G, Ziyadeh FN. Molecular mechanisms of diabetic renal hypertrophy. Kidney Int. 1999;56(2):393–405. doi: 10.1046/j.1523-1755.1999.00590.x. [DOI] [PubMed] [Google Scholar]
- Woo SY, Kim DH, Jun CB, Kim YM, Haar EV, Lee SI, Hegg JW, Bandhakavi S, Griffin TJ, Kim DH. PRR5, a novel component of mTOR complex 2, regulates platelet-derived growth factor receptor beta expression and signaling. J Biol Chem. 2007;282(35):25604–25612. doi: 10.1074/jbc.M704343200. [DOI] [PubMed] [Google Scholar]
- Wullschleger S, Loewith R, Hall MN. TOR signaling in growth and metabolism. Cell. 2006;124(3):471–484. doi: 10.1016/j.cell.2006.01.016. [DOI] [PubMed] [Google Scholar]
- Yang Y, Wang J, Qin L, Shou Z, Zhao J, Wang H, Chen Y, Chen J. Rapamycin prevents early steps of the development of diabetic nephropathy in rats. Am J Nephrol. 2007;27(5):495–502. doi: 10.1159/000106782. [DOI] [PubMed] [Google Scholar]
- Zhang F, Beharry ZM, Harris TE, Lilly MB, Smith CD, Mahajan S, Kraft AS. PIM1 protein kinase regulates PRAS40 phosphorylation and mTOR activity in FDCP1 cells. Cancer Biol Ther. 2009;8(9):846–853. doi: 10.4161/cbt.8.9.8210. [DOI] [PubMed] [Google Scholar]
- Ziyadeh FN, Wolf G. Pathogenesis of the podocytopathy and proteinuria in diabetic glomerulopathy. Curr Diabetes Rev. 2008;4(1):39–45. doi: 10.2174/157339908783502370. [DOI] [PubMed] [Google Scholar]
Associated Data
This section collects any data citations, data availability statements, or supplementary materials included in this article.