Abstract
We extend and apply a method that we have developed for deriving high-order epistatic relationships in large biochemical networks to a published genome-scale model of human metabolism. In our analysis we compute 33 328 reaction sets whose knockout synergistically disables one or more of 43 important metabolic functions. We also design minimal knockouts that remove flux through fumarase, an enzyme that has previously been shown to play an important role in human cancer. Most of these knockout sets employ more than eight mutually buffering reactions, spanning multiple cellular compartments and metabolic subsystems. These reaction sets suggest that human metabolic pathways possess a striking degree of parallelism, inducing “deep” epistasis between diversely annotated genes. Our results prompt specific chemical and genetic perturbation follow-up experiments that could be used to query in vivo pathway redundancy. They also suggest directions for future statistical studies of epistasis in genetic variation data sets.
Small molecule metabolism mediates the most basic biochemical function of living matter: to derive energy and macromolecules from nutrients in the environment. Metabolic pathways are tied in intricate networks which in E. coli and S. cereviseae have been shown to display a great degree of buffering and epistasis. Epistasis has not been previously been examined on a genome-scale in human metabolism. We apply a novel in silico approach to sample the depth of epistasis in the human metabolic network with respect to a variety of metabolic objectives.
INTRODUCTION
Cellular metabolism provides the biochemical machinery to transform a small set of simple nutrients into the complex building blocks of life. The metabolic network of a human consists of thousands of small molecule species intricately linked by an even larger set of biochemical reactions. Dysregulation of metabolism underlies rare fatal conditions like Niemann–Pick disease and pervasive chronic illnesses like diabetes. The metabolic pathways of normal human cells are distinctly altered during carcinogenesis.
The connectivity and coupling of metabolic reactions can be most simply captured in a stoichiometric model. The first such known model was constructed by Shapiro in the 1960s, who applied mathematical formalisms from econometrics to conduct an “input-output analysis” of E. coli metabolism.1 Over the past ten years, genome-scale stoichiometric metabolic models have been built for a variety of organisms, including E. coli, S. cereviseae, H. pylori, S. aureus, and H. sapiens.2, 3, 4, 5, 6, 7, 8, 9, 10, 11, 12, 13, 14 Such models facilitate analysis of systems-level behaviors such as growth or metabolite production in the context of nutrient media and chemical∕genetic perturbations.14, 15
Part of the complexity of metabolism arises from the existence of backup pathways for a given function. Such parallelism can obscure the role of seemingly dispensable network components. The role of genes and enzymes in such robust functions can only be revealed through the knockout of multiple genes or reactions.16, 17, 18, 19, 20, 21 We refer to a set of reactions whose knockout abolishes a given function as a cut set for that function. A cut set is minimal for a given function if its knockout abolishes that function, while the knockout of none of its subsets abolishes that function. Reactions that contribute to minimal cut sets (MCSs) are “epistatically” related, since their simultaneous knockout induces a phenotype that is not seen with simpler knockout combinations.45 In previous work, we have identified over 11 000 MCSs of five or more reactions for biomass production in E. coli.19 Deutscher et al.17 employed in silico multiple knockout analysis to reveal novel essential roles for reactions in the yeast metabolic network. These results indicate the presence of robust parallelism and deep epistasis in the metabolic networks of E. coli and yeast.
Interest in metabolic epistasis is motivated by practical considerations. First, pharmaceutical manipulation of metabolism, e.g., for chemotherapy or antibiotics, can be confounded by the presence of alternative pathways supplying an unwanted function. Second, complex epistatic relationships can mask statistical genetic associations linking germline or somatic genetic variation to disease phenotypes, e.g., diabetes, cancer.22 The size of the search space for “naive” epistatic genetic models not only incurs significant computational expense but significantly reduces the statistical power to detect complex associations in genetic data sets. Systems biology and network analysis can inform statistical genetics by providing biologically grounded epistatic models that follow from basic biochemical relationships between gene products.23, 24
To detect high-order epistasis in in silico metabolic networks, one can apply a brute-force approach to exhaustively test all combinations of single, double, triple, etc. mutants. This approach, although applicable to analysis of low-order (≤4) knockout combinations, is untenable for higher-order mutant combinations.17 For example, a network of 1000 reactions would require over 1014 linear programs to exhaustively test all possible quintuple-knockout combinations. To overcome the curse of dimensionality we have recently extended the elegant approach of Klamt and Gilles for identifying complex knockouts.19, 25 Klamt and Gilles’ method exploits the pathway decomposition of a metabolic network to uncover MCSs, or minimal sets of reactions whose removal disables a particular objective reaction. Our extended approach takes advantage of a “relaxed” pathway definition that is actually computable for genome-scale networks.19
In this paper we extend our approach further and apply it to the study of human metabolism using a published network reconstruction.12 We compute MCSs for 43 important biosynthetic objectives and a metabolic enzyme known to be mutated in cancer. Our results reveal high-order epistatic relationships between diverse components of human metabolism and illuminate essential systems-level roles of reactions in highly redundant and robust metabolic subnetworks.
METHOD
Theory
Notation
R is the set of real numbers, is the set of all n-dimensional vectors with real and positive components, and Rm×n is the set of all m×n matrices with real entries. Given m,n∊N, we use the notation M={1,…,m} and N={1,…,n}. For a set C, we use |C| to denote its cardinality. If A∊Rm×n and U⊆M, then AU denotes the submatrix of A containing the rows with indices in the set U. Therefore, if x∊Rn, i∊N, and U⊂N, then xi and xU∊R|U| denote its ith component and the vector formed by taking components with indices in set U, respectively. The inequality x≥0 is interpreted componentwise, i.e., xi≥0, i=1,…,n, while the inequality x>0 is interpreted as x≥0, x≠0. Each vector x∊Rn induces a ray, rx={αx|α>0}. We denote the sparsity pattern of a ray rx⊂Rn as SP(rx)={j∊N|xj≠0}. The sparsity pattern SP(R) of a ray collection R is a collection of sets {SP(rx)|rx∊R}.
Stoichiometric metabolic model
We represent a mass-balanced metabolic network of n chemical reactions involving m metabolites with stoichiometry matrix S∊Rm×n. In addition to representing the biochemical reactions in the cell, S encodes reactions mediating exchange (uptake and secretion), growth-based dilution, and consumption of small molecule species by macromolecular processes. Each entry Sij specifies the stoichiometric coefficient for metabolite i in reaction j, which is negative for substrates and positive for products. We represent the flux distribution through the reactions of the network by v∊Rn, where a component vj corresponds to flux through reaction j. We constrain all reactions in the network to be irreversible, i.e., v≥0, and represent every reversible reaction with two irreversible reaction fluxes with opposite orientation.46 The concentrations of species in the system at time t are denoted by . Under these assumptions, the rate of change in time of species concentrations is given by
| (1) |
Metabolic reactions occur at a fast rate with respect to cell regulatory and environmental changes. When modeling at the slower time scale it is reasonable to apply the quasisteady state assumption,14 which assumes that for the overwhelming majority of time the system obeys
| (2) |
Under these assumptions, the flux states of the network lie in the polyhedral set
| (3) |
which we refer to as the feasible flux cone of S induced by stoichiometric, steady state, and irreversibility constraints.
Minimal cut sets
A cut set for a metabolic objective is a set of reactions whose knockout abolishes that function.25 The objective is generally a flux in the network to be disabled. This can represent a single reaction, the producibility of a target metabolite, or the consumption of small molecules species by macromolecular processes, e.g., biomass production.
Formally, in a stoichiometric model of metabolism S, a set of reactions C⊂N is a cut set for an objective reaction j∊N if and only if vj>0 is feasible in the wild type (i.e., ∃v∊K|vj>0) and
| (4) |
A cut set C is minimal if no proper subset of C is a cut set. MCSs are “elementary failure modes” of metabolic networks.26 High cardinality MCSs also represent fundamental units of synergistic epistasis between network components involved in robust systems-level functions.19
MCSs can be brute-force identified by exhaustively iterating through all possible reaction knockout combinations C using linear optimization [e.g., flux balance analysis (FBA)] and determining feasibility of vj>0. However, in large networks (i.e., thousands of reactions), this method is limited to the discovery of low cardinality (k≤4) MCSs.17
Alternatively, MCSs can be constructed as minimal hitting sets of extreme pathways (EPs) using the method of Klamt and Gilles.19, 25 EPs arise from a ray decomposition of the feasible flux cone K, and can be thought of as both quantitative flux states and reaction subsets (i.e., pathways) in the network. A MCS for a metabolic function is a minimal set of reactions that intersects all EPs that supply that function (e.g., biomass production). Minimal hitting sets can be enumerated using various approaches, such as the Berge algorithm.27
A major bottleneck to the elegant approach of Klamt and Gilles is EP computation, which is not usually possible for genome-scale networks.47 However, in previous work, we have overcome this bottleneck by generalizing the theoretical results of Klamt and Gilles to rays that generate overapproximations of the feasible flux cone K.19 These rays, which we call pathway fragments, emerge from the application of steady state constraints to only a subset of species in the network, yielding a relaxed flux cone K* for which K⊂K*.
Like EP, pathway fragments can be used to derive MCSs. A minimal hitting set C of a collection of pathway fragments feeding objective j is guaranteed to be a cut set for j.19 However, there are two caveats. A cut set C obtained in this manner is not guaranteed to be minimal. As a result, it may require reduction to minimality via an optimization based post processing step. Second, we are also not guaranteed to find all cut sets C through the analysis of pathway fragments. This nonminimality and incompleteness is the price of the overapproximation of K by K*, but clearly improves the more closely K* envelopes K, i.e., the more species steady state constraints are enforced.
In practice, we have shown that the analysis of pathway fragments in genome-scale metabolic networks can yield large numbers of complex MCSs. In E. coli, this approach generated more than 11 000 MCSs for biomass production.19 Most MCSs were also of high cardinality (≥5) and would have been virtually impossible to identify through brute-force approaches. These MCSs clustered into functional reaction modules that illuminated instances of robust parallelism and deep epistasis in E. coli metabolism.
In this paper we apply our MCS computation method to the network of human metabolism, which contains a much larger number of reactions and species compartments thanE. coli metabolism. Our method involves three basic stages: (1) pathway fragment generation, (2) minimal hitting set computation, and (3) reduction of cut sets to minimality. To increase our yield of MCSs, we modify the previously published method by generating multiple “extended” pathway fragment collections in stage 1 to feed into stage 2.
Genome-scale MCS computation
Basic algorithm
The first stage of our algorithm is pathway fragment generation. The feasible flux cone K of the metabolic network S is the set sum of a finite and unique collection of extreme rays E(K).2E(K) are computed iteratively by determining the extreme rays E(Ki) for a series of polyhedral cones Ki⊂Rn where and
| (5) |
where Mi⊆M, |Mi|=i, and Mi⊂Mi+1.
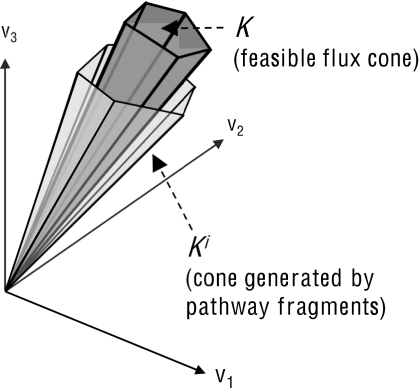
In other words, at each iteration i we determine the cone Ki of flux configurations that constrains i metabolites to steady state. Following this, we choose a new metabolite for iteration i+1. It follows directly from Eqs. 3, 5 that K⊆Ki, as shown in Fig. 1.
Figure 1.
A relaxed flux cone Ki is generated by pathway fragments that fulfill a subset of steady state requirements for metabolic network S. With each new iteration i of pathway fragment computation, Ki provides an increasingly better overapproximation to the system’s actual feasible flux cone K. Since any flux that is infeasible in Ki is guaranteed to be infeasible in K, we can use the analysis of pathway fragments generating Ki to compute cut sets for a reaction j.
The initial collection of generators E(K0) consists of rays induced by the Euclidean basis vectors ej∊Rn. At each iteration i∊M, a novel collection Etemp(Ki) is generated from positive linear combinations of rays in E(Ki−1) that are out of balance with respect to (i.e., consume or produce) metabolite i. Etemp(Ki) contains many nonextremal rays, i.e., those which lie in the positive span of two or more of their counterparts, and must be pruned to yield E(Ki).
This pruning process comprises the most computationally intensive part of each algorithm iteration. Pruning is implemented through pairwise comparison of the sparsity patterns of rays r in Etemp(Ki) and removal of any ray r for which there exists an r′ such that SP(r′)⊂SP(r). Since the size of E(Ki) can become quite large with increasing i, this step of the computation reaches memory limits (or slows to a crawl) at some iteration imax<m for most genome-scale networks. However, the difference between m and imax is usually quite small even for large networks, representing a small subset of only the most connected metabolites.
We refer to rays in each collection E(Ki) as pathway fragments for S, since the final EPs E(Km)=E(K) lie in their positive span (and thus involve a superset of their reactions). At iteration i=imax, when computational resources are exhausted, pathway fragments P=E(Ki) are collected and inputted into step 2 (minimal hitting set computation) to generate cut sets.
Our formulation is flexible with respect to the order of metabolite traversal. The choice of metabolite at each iteration i can be thus optimized with the goal of maximizing imax and producing a pathway fragment collection that captures a larger number of network constraints. As previously described, we employ a local greedy optimization strategy to achieve this purpose.19, 29
The second stage of our algorithm is minimal hitting set computation. Because the cone Kimax overapproximates K (Fig. 1), a flux configuration v that is infeasible in Kimax will also be infeasible in K. We use this property to generate cut sets for an objective j from the analysis of pathway fragments generating Kimax. Given a pathway fragment collection P=E(Kimax) and objective reaction j, we generate cut sets through the analysis of Pj, the collection of j-containing rays in P. We have previously shown that a reaction set C⊂N is a cut set for j if C intersects all j containing pathway fragments in P, i.e., if C is a hitting set of SP(Pj). Although we cannot ensure that C will be an MCS for j, we can increase the likelihood of minimality by choosing C that are minimal hitting sets of SP(Pj). Minimal hitting sets for SP(Pj) are computed using a variant of the Berge algorithm.19, 27
In the third stage, we reduce minimal hitting sets to MCSs using linear optimization. To determine whether the minimal hitting set C is an MCS it needs to be checked for minimality against the objective j in metabolic network S. This is done by determining feasibility of flux j when each of the immediate subsets of C is knocked out.19 For example, if |C|=10, one would perform ten linear optimizations to verify its minimality. Cut sets that are not minimal are pruned to minimality by recursively testing subsets with additional linear optimizations.
Increasing MCS yield by expanding the pathway fragment collection
In the first step of our previously published MCS algorithm, we carry pathway fragment computation to an iteration imax. The next iteration imax+1 fails due to the large number of vector comparisons required to remove nonextremal rays from the collection Etemp(Kimax+1). However, Etemp(Kimax+1) is usually computable, i.e., by taking positive combinations of rays in E(Kimax) to balance the metabolite at iteration imax+1, although it may not be storable in main memory. Despite containing many nonextremal rays, this collection is identical in essence to other pathway fragment collections; namely, minimal hitting sets of j-containing rays in Etemp(Kimax+1) are cut sets of reaction j. We can thus gather j-containing pathway fragments from Etemp(Kimax+1) and exploit them for MCS computation.
What is the benefit of extending pathway fragment computation a half iteration further? To explain this, we introduce the concept of a boundary setB(P)⊂M\Mi of a pathway fragment collection P=E(Ki). B(P) is the subset of metabolites that are consumed or produced by pathway fragments in P (i.e., are not in steady state). For a given objective j, B(Pj) can be large or small, depending on the connectivity of j to the remainder of the metabolic network and how well the pathway fragment computation has discovered that connectivity. At i=0 of pathway fragment computation, Pj consists of only a single reaction (i.e., the ray induced by ej) and B(Pj) will consist only of the substrates and products of reaction j. As iterations proceed and substrates∕products of reaction j are traversed, |Pj| naturally grows and both |B(Pj)| and |B(P)| are reduced.
At iteration imax, B(P) is generally equal to M\Mimax, the set of metabolites consumed or produced by one or more pathway fragments in P=E(Kimax). Because of the local greedy optimization strategy used in guiding pathway fragment computation, B(P) consists mostly of species in central pathways (e.g., glycolysis, citric acid cycle), currency molecules (ATP, NADH, CoA), and promiscuous ions (hydrogen, water, ammonia). A reaction j that is buried in the core metabolic machinery and only involves these species in B(P)=M\Mimax as substrates or products will still be represented by only a single ray ej in E(Kimax). This occurs because that pathway fragment ej is by definition balanced with respect to all previous species Mimax and thus has been able to escape engaging in positive linear combination with any ray in any other iteration. For such a reaction j, analysis of Pj would only generate a single cut set {j} (since ej is the only j containing pathway fragment).
However, if we generate the collection Etemp(Kimax+1) by deliberately choosing a metabolite in B(Pj) (i.e., in this case a species consumed or produced by reaction j), then we will derive positive linear combinations of ej with all pathway fragments in P\Pj that consume or produce this species. Although this metabolite may have been avoided by the greedy search due to its promiscuity with the existing pathway fragments, we force it to be considered with the aim of expanding Pj. The resultant rays obtained in this half iteration will connect reaction j to other reactions that use both the new metabolite and at least one species from Mimax. These reactions will now take part in cut sets for flux j, potentially dramatically increasing the yield of MCSs. This “single metabolite extension” can be applied separately to each species that is produced or consumed by flux j, further increasing the yield. In general, we can perform extensions for each species in B(Pj) given an objective j associated with pathway fragment collection Pj, even when |Pj|>1. The resulting extended pathway fragment collections can be shuttled to minimal hitting set computation to increase the yield of MCSs for any objective j in the network.
Implementation
Human metabolic network
We employed the H. sapiens Recon 1 genome-scale stoichiometric model built from 1496 ORFs (open reading frames) spanning 2004 proteins, 2766 metabolites, and 3311 metabolic reactions, including 1078 transport reactions.12 We replaced reversible reactions with two irreversible reactions, and supplemented this network with 2362 sink fluxes to capture the dilution of intracellular species via growth and their consumption by macromolecular processes.15, 30 We simulated rich media by making all extracellular species available to the network. In the interest of reducing metabolite dimensionality, we performed this by eliminating rows corresponding to extracellular metabolites (as opposed to adding additional source fluxes). The final network corresponding to S in Eq. 2 contained 2362 rows (metabolites) and 7654 columns (reactions).
Computation
All computation was carried out on MATLAB R2008a using a Dell 8 Core Precision T7400 (Intel Xeon E5430, 2.66 GHz, 4 Gbytes random access memory) running Linux and an HP 8 Core DL145 G3 (AMD Opteron, 2.7 GhZ, 32 Gbytes random access memory) running Microsoft Windows Server 2003 R2 Enterprise x64. Pathway fragment computation, minimal hitting set, and reduction routines were implemented as MATLAB scripts and can be made available upon request. We computed pathway fragments through imax=2209 of 2362 metabolites yielding 339 504 pathway fragments. During the pathway fragment extension step for objective j, we excluded extremely promiscuous metabolites [i.e., those consumed∕produced by more than 20 000–40 000 rays in Pj in B(Pj) to reduce the computational load]. For the original and each extended pathway fragment collection, we computed minimal hitting sets of the j containing pathway fragments. We limited minimal hitting set computation to sets of cardinality ≤10 in the interest of reducing computational time. We implemented flux feasibility computations within the reduction routine as previously described19 using the SeDuMi convex optimization toolbox.31
RESULTS
Deep epistasis underlies many human biosynthetic functions
To examine the robustness of the human metabolic network with respect to a variety of biosynthetic objectives, we computed MCSs for the producibility of 43 important cellular metabolites spanning four biochemical classes: this comprised 24 amino acids, five deoxyribonucleotides, ten membrane lipids, and four core metabolites (i.e., energy metabolism intermediates). For all cases we examined MCSs mediating cytoplasmic producibility of the given metabolite, with the exception of deoxyribonucleotides where we examined their producibility in the nucleus.
Before proceeding with a description of our results, we emphasize that our MCS computation approach does not guarantee the discovery of all MCSs. Therefore, the absence of certain MCSs in our results is not necessarily reflective of the (unknown) underlying distribution of MCSs for that function. However, by establishing with certainty the existence of MCSs with certain qualities, we can make some interesting assertions regarding epistasis in human metabolism.
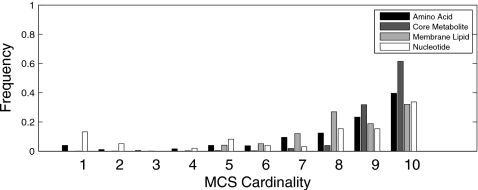
In total, we found 33 328 unique MCSs targeting one or more of 43 metabolic objectives.32 This included 650, 98, 21 187, and 11 393 unique MCSs targeting amino acid, nucleotide, membrane lipid, and core metabolite biosynthesis, respectively. Most interestingly, MCSs found using our method were almost all (99.5%) of cardinality greater than 5, with 82% having cardinality of 9–10. A similar MCS cardinality distribution was observed across all four metabolite classes studied (Fig. 2). These results suggest a striking depth of parallelism in human biosynthetic pathways, irrespective of metabolite class.
Figure 2.
Histogram showing MCS cardinalities stratified across the four metabolite classes.
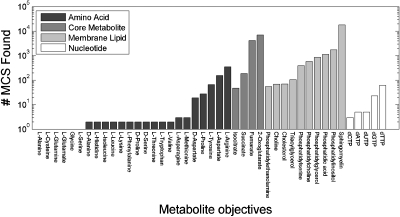
Figure 3 shows the number of MCSs we discovered for the various individual objectives, grouped by metabolite class. Among the 24 amino acids, only D-Aspartate, L-Aspartate, L-Tyrosine, L-proline, and L-arginine yielded significant numbers of MCSs. The relatively small yield of nucleotide-targeting MCSs that we discovered was directed at dGTP and dTTP biosynthesis. In contrast we found multiple MCSs for all four core metabolites tested, which included 4181 MCSs targeting fumarate synthesis and 6977 targeting oxoglutarate. Multiple membrane lipid objectives yielded large numbers of MCSs, with the most plentiful number by far associated (18 074) with sphingomyelin production.
Figure 3.
Histogram showing number of MCSs discovered for each biosynthetic objective examined in our study.
MCSs expose novel essential roles in human metabolism
MCSs enable an expanded notion of essentiality called k-essentiality.19 A reaction is k-essential for a given objective if there exists a (possibly complex) MCS containing that reaction and targeting that objective. This is in contrast to the standard notion of essentiality, which is assigned to a gene or reaction whose single knockout abolishes a phenotype. k-essential links between genes∕reactions and systems-level functions arise from synergistic epistasis between parallel pathways in the network.
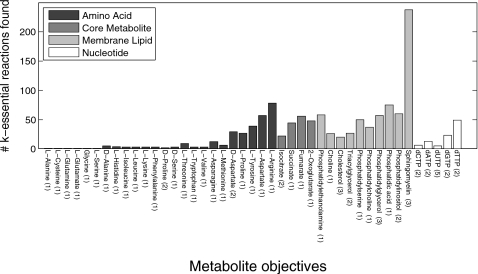
Complex MCSs found using our method yield many k-essential reactions. To quantify novel k-essential links between reactions and objectives, we compared the numbers of k-essential reactions to the number of 1-essential reactions obtained from a brute-force single knockout analysis of the human metabolic network. Figure 4 shows how many reactions were deemed k-essential for each objective, with the numbers of reactions shown to be 1-essential for the objective shown in parentheses next to the metabolite label. We found that for most objectives we were able to associate many more k-essential reactions with the production of a given metabolite than were able to be found using a single knockout analysis. In many cases, this difference was profound, such as for sphingomyelin, whose producibility we were able to epistatically link to 235 reactions in the metabolic network.
Figure 4.
Histogram showing number of k-essential reactions discovered for each biosynthetic objective tested in our study. A reaction is k-essential for an objective if it contributes to at least one MCS for that objective. The number of reactions found to be 1-essential for each objective (by brute-force optimization) is shown in parentheses next to the metabolite label.
MCSs span multiple compartments and metabolic subsystems
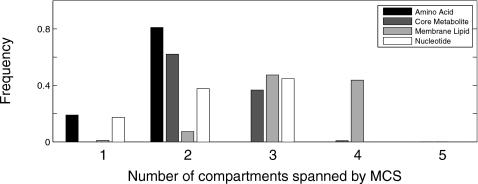
MCSs discovered by our analysis span a breadth of cellular compartments. However, the actual distributions of compartment span vary distinctly between specific metabolite classes (Fig. 5). In particular, amino acid-targeting MCSs discovered by our method employ the fewest number of compartments, drawing from cytoplasmic fluxes alone or a combination of cytoplasmic and mitochondrial reactions. MCSs targeting core metabolites span between two and three compartments, consisting of primarily cytoplasmic and mitochondrial reactions, however often also employing peroxisomal fluxes. Nucleotide-targeting MCSs sometimes employ cytoplasmic reactions only, however more often pull combinations of reactions from two or three of the following compartments: cytoplasm, mitochondria, lysosome, and nucleus. Across all metabolite classes studied, membrane-lipid-targeting MCSs are the most diverse: they harness up to five compartment combinations that employ reactions from the cytoplasm, endoplasmic reticulum, Golgi apparatus, nucleus, and peroxisome.
Figure 5.
Histogram showing number of compartments spanned by MCSs targeting the four metabolite classes. Frequencies are calibrated separately for each metabolite class.
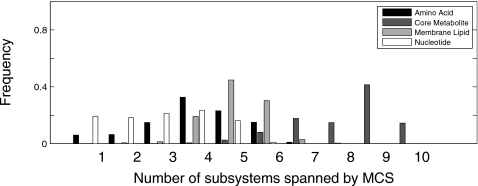
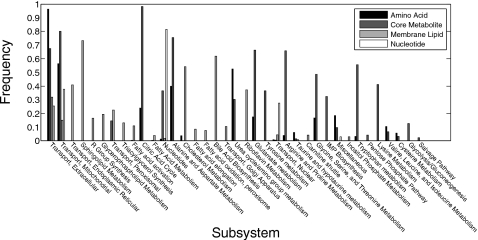
There are also metabolite class differences in the subsystem span of discovered MCSs (Fig. 6). Nucleotide and amino acid-targeting MCSs span between one and five subsystems. Meanwhile, membrane lipid and core metabolite-targeting MCSs are more functionally diverse, spanning between three and seven and between five and ten metabolic subsystems, respectively. MCSs targeting different metabolite subclasses not only differ in their functional diversity, but in the actual metabolic subsystems targeted (Fig. 7). Many of these differences are intuitive: nucleotide-targeting MCSs uses reactions from “nucleotides” and “nuclear transport” subsystems. Amino acid-targeting MCSs preferentially involve reactions in “citric acid cycle,” “alanine∕aspartate metabolism,” “urea cycle∕amino group degradation,” “glutamate metabolism,” and “glycine∕serine∕threonine metabolism.” In contrast, MCSs targeting core metabolite and membrane lipid biosynthesis employ reactions with a much larger annotated functional breadth, both spanning 26 subsystems in total. MCSs targeting core metabolites pull reactions from “IMP (inositol monophosphate) biosynthesis,” “pentose phosphate pathway,” “lysine metabolism,” “tryptophan metabolism,” and many others. MCSs targeting membrane lipid biosynthesis employ reactions from “transport, Golgi apparatus,” “R group synthesis,” “carnitine shuttle,” “fatty acid activation,” “inositol phosphate metabolism,” and “bile acid biosynthesis” subsystems, among others. Subsystems that are common to MCSs across all metabolite classes are “extracellular transport” and “mitochondrial transport.”
Figure 6.
Histogram showing frequencies of metabolic subsystems among the MCSs found for the four classes of biosynthetic objectives. Frequencies are calibrated separately for each metabolite class.
Figure 7.
Histogram showing frequencies of metabolic subsystems employed by MCSs targeting the four metabolic classes analyzed in our study. Frequencies are calibrated separately for each metabolite class.
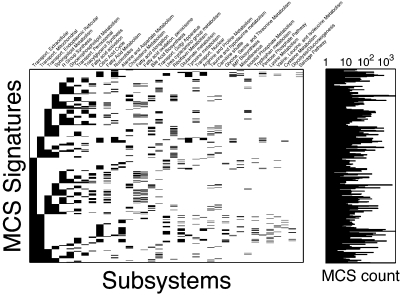
Overall, we find staggering functional complexity and diversity in the discovered MCSs, as shown in Fig. 8, which displays individual “subsystem signatures” of MCSs and their frequency across the results (Fig. 8). There are 475 unique combinations of subsystems represented across the 33 328 MCSs. As can be seen in the sparsity patterns of the plot, the majority of these MCSs combine reactions from extracellular, mitochondrial, or endoplasmic reticulum (ER) transport with reactions chosen from a diversity of 30 core metabolic subsystems. The existence of MCSs spanning such diverse functional annotation classes establishes the existence of complex buffering relationships between seemingly disparate parts of the human metabolic network.
Figure 8.
Membership map depicting subsystem signatures for MCSs identified in this study and corresponding histogram for each. The sparsity pattern of each row in the map represents a unique combination of subsystems, and the histogram on the right depicts how many MCSs exist with that given signature.
Case study: Cancer metabolism
The fumarase gene undergoes deletion and loss of function mutation in adrenal, kidney, and smooth muscle tumors.33 Fumarase mediates the conversion of fumarate to malate in the mitochondrion. It is a component of the Krebs cycle, which mediates oxidative energy metabolism and is a central hub for multiple biosynthetic pathways linked to amino acid, lipid, and DNA synthesis. Fumarase activity is thought to play an important tumor-suppressive role in normal noncancerous cells. MCSs for this flux thus represents potential alternative evolutionary targets for a dysplastic cell seeking to achieve a higher degree of malignancy. We also use this example to illustrate in more detail the composition and topologic relationships between different MCSs targeting the same function.
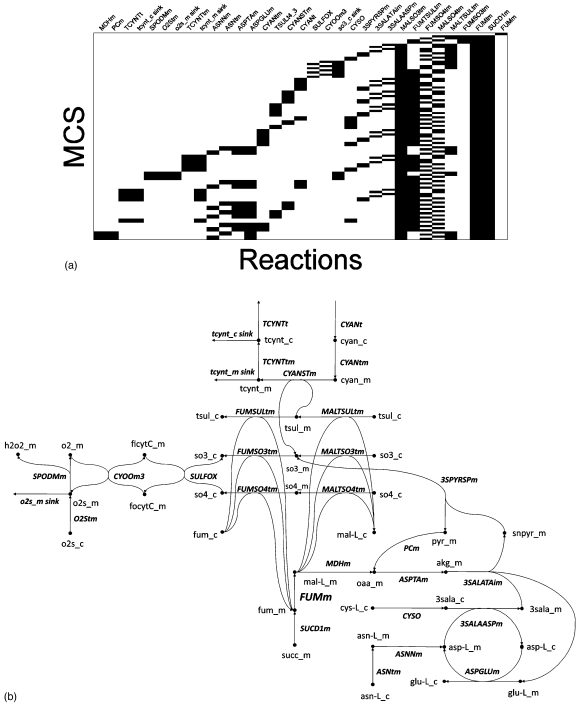
We computed 97 MCSs for mitochondrial fumarase flux (FUMm) spanning 34 reactions in the network, respectively. MCSs associated with FUMm and the network of reactions associated with them are shown in Fig. 9. Abbreviations used in this figure are shown in Table 1. These 97 MCSs contain only a single low cardinality MCS, which consists of the FUMm reaction itself (an objective reaction is by definition its own single cardinality MCS, unless it is infeasible). We call this trivial set the “identity MCS.” The remaining FUMm associated MCSs involve the simultaneous knockout of multiple reactions, as the binary heatmap in Fig. 9a shows.
Figure 9.
(a) Membership map depicting 97 MCS and corresponding network of reactions predicted to be k-essential for mitochondrial fumarase (FUMm) flux. The sparsity pattern of each row in the map represents reaction membership in a single MCS. (b) In the corresponding network diagram, round shaded nodes represent species and labeled hyperedges represent network reactions. Abbreviations used in this figure are listed in Table 1.
Table 1.
Flux and metabolite abbreviations in the fumarase MCS network. Suffixes “_c” and “_m” are added in the network diagram to denote cytoplasmic and mitochondrial compartments, respectively.
| Flux abbreviation | Name | Met abbreviation | Met name |
|---|---|---|---|
| 3SALAASPm | Cysteinesulfinate-aspartate mitochondrial shuttle | 3sala | 3-Sulfino-L-alanine |
| 3SALATAim | 3-sulfino-alanine transaminase (irreversible), mitochondrial | 3snpyr | 3-Sulfinopyruvate |
| 3SPYRSPm | 3-sulfinopyruvate hydrolase (spontaneous reaction), mitochondrial | adp | ADP |
| ASNNm | L-asparaginase (mitochondrial) | akg | 2-Oxoglutarate |
| ASNtm | L-asparagine transport, mitochondrial | asn-L | L-Asparagine |
| ASPGLUm | Aspartate-glutamate mitochondrial shuttle | asp-L | L-Aspartate |
| ASPTAm | Aspartate transaminase | atp | ATP |
| CYANSTm | Cyanide sulfurtransferase, mitochondrial | cyan | Hydrogen cyanide |
| CYANt | Cyanide transport via diffusion (extracellular to cytosol) | cys-L | L-Cysteine |
| CYANtm | Cyanide transport via diffusion (mitochondrial) | ficytC | Ferricytochrome c |
| CYOOm3 | Cytochrome c oxidase, mitochondrial complex IV | focytC | Ferrocytochrome C |
| CYSO | Cysteine oxidase | fum | Fumarate |
| FUMm | Fumarase, mitochondrial | glu-L | L-Glutamate |
| FUMSO3tm | Fumarate:sulfite antiport, mitochondrial | h2o2 | Hydrogen peroxide |
| FUMSO4tm | Fumarate:sulfate antiport, mitochondrial | hco3 | Bicarbonate |
| FUMtm | Fumarate transport, mitochondrial | mal-L | L-Malate |
| FUMTSULtm | Fumarate:thiosulfate antiport, mitochondrial | nh4 | Ammonium |
| MALSO3tm | Malate:sulfite antiport, mitochondrial | o2 | O2 |
| MALSO4tm | Malate:sulfate antiport, mitochondrial | o2s | Superoxide anion |
| MALTSULtm | Malate:thiosulfate antiport, mitochondrial | oaa | Oxaloacetate |
| MDHm | Malate dehydrogenase, mitochondrial | pyr | Pyruvate |
| O2Stm | Superoxide anion transport via diffusion (mitochondria) | so3 | Sulfite |
| PCm | Pyruvate carboxylase | so4 | Sulfate |
| SPODMm | Superoxide dismutase | succ | Succinate |
| SUCDlm | Succinate dehydrogenase | tcynt | Thiocyanate |
| SULFOX | Sulfite oxidase | tsul | Thiosulfate |
| TCYNTt | Thiocyanate transport via diffusion (cytosol to extracellular) | ||
| TCYNTtm | Thiocyanate transport via diffusion (mitochondrial) | ||
| TSULt4_3 | Thiosulfate transport via sodium symport |
Reactions contributing to FUMm MCSs cluster into a single robust metabolic network module, shown in Fig. 9b. Most of these MCSs inhibit FUMm flux by targeting the mitochondrial fumarate (fum_m) pool. This occurs most simply by simultaneously knocking out four mitochondrial fumarate transport reactions (FUMtm, FUMSO3tm, FUMSO4tm, and FUMTSULtm) and conversion from succinate (SUCD1m). We refer to this set as the “index” MCS as it can be used to understand the remaining FUMm-targeting MCSs, which indirectly inhibits mitochondrial fumarate transport by knocking out mitochondrial sulfur pools.
As shown in Fig. 9b, fumarate import into the mitochondria is coupled to the outflux of (FUMSO3tm), (FUMSO4tm), and thiosulfate (FUMTSULtm). Malate import is similarly coupled, however, to the influx of these sulfur molecules via the reactions MALSO3tm, MALSO4tm, and MALTSULtm, respectively. One variation on the index MCS is thus to disable the MALSO4tm transporter instead of FUMSO4tm. This perturbation indirectly inhibits FUMSO4tm by knocking out mitochondrial (so4_m) pools, which that fumarate transporter depends on. A similar approach swaps FUMTSULtm with MALTSULtm in the index MCS, which prevents the influx of thiosulfate into mitochondria (tsul_m) and thus inhibits thiosulfate dependent import. , unlike and thiosulfate, has three routes into the mitochondria in this model, via MALTSO3, CYANSTm, and 3SPYRSP. As a result, knockout strategies that exclude FUMSO3tm must suppress all three of these reactions or their upstream pathways. The resulting MCSs, shown toward the bottom of Fig. 9b, reach deep into sulfur metabolism pathways targeting reactions linking cysteine (a sulfur containing amino acid) degradation with arginine, aspartate, and glutamine pathways. These MCSs are of high cardinality and all employ 8–10 reactions. The most interesting of these target mitochondrial malate dehydrogenase (i.e., replace 3SPYRSP with MDHm) to indirectly prevent the formation of 3-sulfonylpyruvate (3snpyr_m). Additional MCSs target upstream pathways that generate cytoplasmic from ferricytochrome (ficytC_m).
A survey of the MCSs associated with the FUMm objective demonstrates the complexity of individual MCSs and suggests an intuitive framework with which to understand them. Although the “mechanism” of each MCS can be reconstructed with relative ease through browsing of the network topology, it must be noted that this simplicity only arises post hoc after a considerable computational effort has been applied for MCS identification.
DISCUSSION
What is the depth of epistasis in human metabolism?
Our analysis reveals a plethora of high cardinality MCSs across a variety of metabolic objectives in human metabolism. Since the knockout of all reactions in an MCS disables a given objective, while none of its subsets is predicted to, each high cardinality MCS posits a deep buffering relationship between multiple genes, mediated through the metabolic network. Our FUMm-targeting MCSs expose such interactions in multiple settings: many occur between intercompartment transporters, of which there are multiple versions for a given metabolite (e.g., fumarate, malate) that are differentially coupled to other small molecules in the network. Redundancy can also emerge from the multiple forms of elemental small molecules (e.g., , , and thiosulfate) that form distinct but interconnected pools that can be differentially exploited for targeted knockout. Our analysis of biosynthetic objectives shows that most MCSs span multiple cellular compartments and metabolic subsystems in impressively complex combinations. This pattern is largely independent of metabolite class, suggesting that epistatic interactions link many reactions in metabolism to robust systems-level functions.
The presence of large MCSs suggests that with respect to multiple objectives, parts of human metabolism resemble at least a nine or ten-lane highway. Compared to our analysis of E. coli metabolism done using similar tools, the depth of epistatic interaction that we see in the human metabolic network is comparable.19 This degree of buffering is also comparable to results obtained in yeast using random sampling.17
How faithful is our estimate of the depth of epistasis in human metabolism? Our modeling assumptions are very permissive: we allow all reactions encoded in the genome to be active and provide all nutrients for which a transporter exists. In the human body, metabolic genes are turned on and off in a cell and tissue type specific manner. Therefore, the metabolism of a specific cell in the human body may exhibit shallower buffering if it has many metabolic genes turned off and has access to poor nutrient media. One could partially evaluate this conjecture by testing MCSs generated in our study in a model equipped with additional cell type specific gene expression based constraints. The actual complexity of in vivo “nutrient media” in a human is harder to estimate; however, in most well-vascularized compartments it is reasonable to assume that extracellular fluid is quite “rich” in nutrient content.
Our estimate of epistatic depth may also be low for several reasons. First, if the metabolic model is incomplete and there exist additional unannotated reactions that introduce novel alternative pathways to a given objective, then the actual depth of epistasis will be greater than our estimate. We have also imposed a relatively arbitrary upper cardinality bound in our MCS search of ten (due to computational restrictions); however, the domination of our results by MCSs with nine or ten reactions suggests that the current network harbors higher cardinality combinations that we may detect if we increase this limit.34
The implications of redundancy in metabolism
The presence of many backup pathways in the metabolism of humans and microbes may suggest apparent “duplication” of function at the network level. This could be interpreted to provide an additional layer of redundancy on top of gene duplication, which is widespread in multiple organisms and conserved throughout evolution.35, 36 However, unlike gene duplication, systems-level redundancy is generally mediated by genetically distant proteins that provide “distributed robustness” by having one or more shared physiological functions.37 In this case, the term “redundancy” may be too strong to describe this phenomenon, since such backup pathways are rarely identical; rather, one pathway may use a different set of nutrients and produce a different set of by-products to achieve an objective. As a result, certain pathways may be more optimal or efficient in certain environments, allowing a microorganism with a high degree of distributed robustness a survival advantage in the face of changing environments. Applied to the metabolism of humans (and other higher organisms), such robustness could presumably allow for a wide spectrum of differentiation phenotypes (e.g., liver versus muscle cells) optimized for a given cell or tissue level function. The relationship of network buffering depth as a function of differentiation state in human cells (e.g., comparing embryonic stem cells with terminally differentiated liver cells) is an interesting direction for future investigation.
Applications of human metabolic MCSs
Using MCSs to guide perturbation experiments
MCSs provide precise predictions of parallelism in the metabolic network. The degree of actual parallelism in vivo depends on the actual utilization and capacity of individual pathways in the cell. If an individual pathway is able to provide the needs of a metabolic objective on its own, then it will be very difficult to detect the role of other reactions in an MCS using low-order knockouts. In the case of perfect synergistic epistasis, every member of an MCS will represent a separate pathway individually capable of sustaining an objective. In this case the role of one gene or enzyme for a given objective will only be visualizable in the context of the knockout of all other MCS components. However, in reality the utilization and capacity of various metabolic channels likely differ, and low-order knockouts may reveal marginal effects. Such questions can be pursued experimentally by chemical or genetic perturbation experiments guided by MCS predictions. One may begin such an investigation with marginal knockout experiments that chemically or genetically disable only single enzymes in the MCS. One may also pursue “pinching” experiments that knockout all but one of the members of an MCS, effectively forcing all flux to an objective through that remaining reaction.
Using MCSs to discover epistatic genetic factors
Despite several years of massive genome-wide association studies seeking links between common genetic variation and disease susceptibility, much of the heritable risk attributed to human illness (e.g., diabetes, heart disease) or traits (e.g., height) remains unexplained. Although the location of this “missing heritability” is a subject of active debate, one possibility is that it arises from complex interactions between multiple genetic variants.22, 38 Given the degree of redundancy that we observe at the metabolic network level, it would be reasonable to assume that many deleterious genetic traits require the simultaneous malfunctioning of parallel pathways. [This relationship between “functional epistasis,” which refers to the synergistic versus alleviating effects of different mutations on function, and “statistical epistasis” (e.g., in the sense of Fisher), which refers to the presence of nonadditive effects in statistical genetic models, has been previously explored.23, 24]
The discovery of such interactions through purely statistical means is limited by computational complexity and statistical power. One approach to limit the number of hypotheses is to use a functional biological framework to guide the search for interacting genetic combinations. By capturing the fundamental units of functional redundancy in a system, MCSs provide such a framework. This could be applied for the study of metabolism as well as signaling networks, which can be represented in a stoichiometric constraint-based framework.39, 40 Such models can be similarly subjected to MCS analysis to identify mutually buffering elements and provide a template upon which to capture complex epistatic effects.
Constraint-based modeling of cancer metabolism
Although it has been over 80 years since Warburg’s observation that cancer cells ferment sugar in the presence of oxygen, major interest in cancer metabolism has only recently reemerged.41, 42 Our analysis has explored alternative and complex knockout strategies that would be predicted to replicate decreases in fumarase flux observed in certain cancer cells and tumors. The MCSs we have discovered provide interesting starting points for investigating alternative mutational patterns that may achieve similar effects in other tumor types. Since cancer evolution is a dynamic and stochastic process, it is expected that tumor cells may take multiple routes to achieve the same objective. MCSs derived from a metabolic reconstruction can potentially help us infer that evolutionary route, especially when it involves the simultaneous inhibition of multiple enzymes in the network. Constraint-based models can also help us join disparate mutational patterns under the banner of a single predicted phenotype. This can be a potentially powerful framework with which to investigate marginal effects and high-order interaction patterns in somatic sequence variation data sets such as that emerging from The Cancer Genome Atlas.43
Computational directions
Although our computational approach yields a considerable number of high cardinality genome-scale MCSs, we are unable to guarantee the discovery of all MCSs below a certain cardinality for a given metabolic objective. This is in contrast to brute-force optimization and bilevel optimization approaches, which have shown efficacy in deriving complete MCS collections for a given cardinality but have only been applied to yield low-order buffering interactions (i.e., k≤5).20 The completeness of our results is limited by the ability of the pathway fragment collection to connect specific objectives to sets of reactions that provide their flux. Algorithmic improvements that yield a more complete collection of MCSs may be useful in perturbational experiment design or statistical analysis of genetic variation.
This paper provides an incremental modification to our original genome-scale MCS algorithm.19 Our approach greatly increases the yield of MCSs that we obtain for certain objectives by expanding the pathway fragment collection an iteration further in multiple metabolite directions. Our underlying metabolite selection approach during pathway fragment generation is a local greedy optimization strategy. Alternative approaches to metabolite ordering during pathway fragment generation may be more ideally adapted to generating MCSs for a given objective. These include those that differentially weigh reactions or metabolites of interest, or take into account compartment structure.
A large limiting factor of MCS yield is the quality of the pathway fragment collection, which can be roughly measured by imax or the number of balanced metabolites. Even without additional algorithmic improvements, parallel implementations of standard pathway fragment computation will serve to increase imax. Our unpublished results suggest that even small increments in imax yield substantially larger collections of more MCSs. Significant parallel computing effort applied toward generating a human metabolic pathway fragment collection may be worthwhile in creating a queryable resource from which to derive more complete and targeted collections of MCSs.
In the interest of generality, our current MCSs have not taken into account the effects of gene∕protein expression or regulation. Instead we have built MCSs from a “master network” in which all reactions are allowed to be simultaneously active. In reality, only a subset of reactions will be active due to gene expression, post-translational modifications, and feedback regulation. One computational approach to model this effect is to superimpose metabolic gene expression data from experiments on flux models as a set of on∕off constraints on reactions. Regulation can be more accurately modeled using a mixed integer linear programming framework that takes into account transcriptional and signaling circuitry.44 The addition of either set of additional constraints would yield potentially more minimal MCSs and provide more accurate predictions for experimental follow-up.
CONCLUSION
We have applied MCS analysis to reveal multiple examples of deep epistasis in human metabolism. Our ability to generate results at the size of the human metabolic network leverages an important modification to our original genome-scale MCS algorithm.19 The MCSs we generate forge novel and interesting links between multiple metabolic reactions and distinct functions of human metabolism, including metabolite biosynthesis and the maintenance of flux through a tumor suppressor enzyme. Our results also suggest a high degree of redundancy in the human metabolic network, which prompts future experimental and analytic follow-up. This includes applying MCS-guided in vivo chemical or genetic perturbation experiments to human cells and statistical genetic analyses that use MCSs as templates to probe genetic variation data sets for high-order epistatic effects.
ACKNOWLEDGMENTS
We thank the referees and editors for helpful suggestions and critical comments that helped shape this manuscript. We thank the Enterprise Research IS group at Partners Healthcare for the in-depth support and provision of the HPC facilities.
References
- Shapiro H. M., Comput. Biomed. Res. 2, 430 (1969). 10.1016/0010-4809(69)90008-1 [DOI] [PubMed] [Google Scholar]
- Schilling C. H. and Palsson B. O., Proc. Natl. Acad. Sci. U.S.A. 95, 4193 (1998). 10.1073/pnas.95.8.4193 [DOI] [PMC free article] [PubMed] [Google Scholar]
- Schilling C. H., Covert M. W., Famili I., Church G. M., Edwards J. S., and Palsson B. O., J. Bacteriol. 184, 4582 (2002). 10.1128/JB.184.16.4582-4593.2002 [DOI] [PMC free article] [PubMed] [Google Scholar]
- Famili I., Forster J., Nielsen J., and Palsson B. O., Proc. Natl. Acad. Sci. U.S.A. 100, 13134 (2003). 10.1073/pnas.2235812100 [DOI] [PMC free article] [PubMed] [Google Scholar]
- Forster J., Famili I., Fu P., Palsson B. O., and Nielsen J., Genome Res. 13, 244 (2003). 10.1101/gr.234503 [DOI] [PMC free article] [PubMed] [Google Scholar]
- Raghunathan A., Price N. D., Galperin M. Y., Makarova K. S., Purvine S., Picone A. F., Cherny T., Xie T., Reilly T. J., Munson R., Tyler R. E., Akerley B. J., Smith A. L., Palsson B. O., and Kolker E., OMICS 8, 25 (2004). 10.1089/153623104773547471 [DOI] [PubMed] [Google Scholar]
- Reed J. L., Vo T. D., Schilling C. H., and Palsson B. O., Genome Biol. 4, R54 (2003). 10.1186/gb-2003-4-9-r54 [DOI] [PMC free article] [PubMed] [Google Scholar]
- Kauffman K. J., Pajerowski J. D., Jamshidi N., Palsson B. O., and Edwards J. S., Biophys. J. 83, 646 (2002). 10.1016/S0006-3495(02)75198-9 [DOI] [PMC free article] [PubMed] [Google Scholar]
- Beard D. A. and Qian H., Am. J. Physiol. Endocrinol. Metab. 288, E633 (2005). 10.1152/ajpendo.00239.2004 [DOI] [PubMed] [Google Scholar]
- Vo T. D., Greenberg H. J., and Palsson B. O., J. Biol. Chem. 279, 39532 (2004). 10.1074/jbc.M403782200 [DOI] [PubMed] [Google Scholar]
- Thiele I., Price N. D., Vo T. D., and Palsson B. O., J. Biol. Chem. 280, 11683 (2005). 10.1074/jbc.M409072200 [DOI] [PubMed] [Google Scholar]
- Duarte N. C., Becker S. A., Jamshidi N., Thiele I., Mo M. L., Vo T. D., Srivas R., and Palsson B. Ø., Proc. Natl. Acad. Sci. U.S.A. 104, 1777 (2007). 10.1073/pnas.0610772104 [DOI] [PMC free article] [PubMed] [Google Scholar]
- Ma H., Sorokin A., Mazein A., Selkov A., Selkov E., Demin O., and Goryanin I., Mol. Syst. Biol. 3, 135 (2007). 10.1038/msb4100177 [DOI] [PMC free article] [PubMed] [Google Scholar]
- Price N. D., Reed J. L., and Palsson B. O., Nat. Rev. Microbiol. 2, 886 (2004). 10.1038/nrmicro1023 [DOI] [PubMed] [Google Scholar]
- Imielinski M., Belta C., Rubin H., and Halasz A., Biophys. J. 90, 2659 (2006). 10.1529/biophysj.105.069278 [DOI] [PMC free article] [PubMed] [Google Scholar]
- Wilhelm T., Behre J., and Schuster S., Syst. Biol. 1, 114 (2004). 10.1049/sb:20045004 [DOI] [PubMed] [Google Scholar]
- Deutscher D., Meilijson I., Kupiec M., and Ruppin E., Nat. Genet. 38, 993 (2006). 10.1038/ng1856 [DOI] [PubMed] [Google Scholar]
- Segrè D., DeLuna A., Church G. M., and Kishony R., Nat. Genet. 37, 77 (2005). [DOI] [PubMed] [Google Scholar]
- Imielinski M. and Belta C., BMC Syst. Biol. 2, 40 (2008). 10.1186/1752-0509-2-40 [DOI] [PMC free article] [PubMed] [Google Scholar]
- Suthers P. F., Zomorrodi A., and Maranas C. D., Mol. Syst. Biol. 5, 301 (2009). 10.1038/msb.2009.56 [DOI] [PMC free article] [PubMed] [Google Scholar]
- Behre J., Wilhelm T., von Kamp A., Ruppin E., and Schuster S., J. Theor. Biol. 252, 433 (2008). 10.1016/j.jtbi.2007.09.043 [DOI] [PubMed] [Google Scholar]
- Moore J. H. and Williams S. M., Am. J. Hum. Genet. 85, 309 (2009). 10.1016/j.ajhg.2009.08.006 [DOI] [PMC free article] [PubMed] [Google Scholar]
- Moore J. H., Nat. Genet. 37, 13 (2005). 10.1038/ng0105-13 [DOI] [PubMed] [Google Scholar]
- Tyler A. L., Asselbergs F. W., Williams S. M., and Moore J. H., BioEssays 31, 220 (2009). 10.1002/bies.200800022 [DOI] [PMC free article] [PubMed] [Google Scholar]
- Klamt S. and Gilles E. D., Bioinformatics 20, 226 (2004). 10.1093/bioinformatics/btg395 [DOI] [PubMed] [Google Scholar]
- Klamt S., BioSystems 83, 233 (2006). 10.1016/j.biosystems.2005.04.009 [DOI] [PubMed] [Google Scholar]
- Berge C., Hypergraphs, North Holland Mathematical Library, Vol. 45 (North-Holland, Amsterdam, 1989). 10.1016/S0924-6509(08)70096-5 [DOI] [Google Scholar]
- Klamt S. and Stelling J., Trends Biotechnol. 21, 64 (2003). 10.1016/S0167-7799(02)00034-3 [DOI] [PubMed] [Google Scholar]
- Bell S. L. and Palsson B. O., Bioinformatics 21, 1739 (2005). 10.1093/bioinformatics/bti228 [DOI] [PubMed] [Google Scholar]
- Imieliński M., Belta C., Halász A., and Rubin H., Bioinformatics 21, 2008 (2005). 10.1093/bioinformatics/bti245 [DOI] [PubMed] [Google Scholar]
- “Sedumi,” http://sedumi.mcmaster.ca/.
- See supplementary material at http://dx.doi.org/10.1063/1.3456056 for the full MCS data set.
- Gottlieb E. and Tomlinson I. P. M., Nat. Rev. Cancer 5, 857 (2005). 10.1038/nrc1737 [DOI] [PubMed] [Google Scholar]
- Deutscher D., Meilijson I., Schuster S., and Ruppin E., BMC Syst. Biol. 2, 50 (2008). 10.1186/1752-0509-2-50 [DOI] [PMC free article] [PubMed] [Google Scholar]
- Kafri R., Springer M., and Pilpel Y., Cell 136, 389 (2009). 10.1016/j.cell.2009.01.027 [DOI] [PubMed] [Google Scholar]
- Vavouri T., Semple J. I., and Lehner B., Trends Genet. 24, 485 (2008) 10.1016/j.tig.2008.08.005 [DOI] [PubMed] [Google Scholar]
- Wagner A., BioEssays 27, 176 (2005). 10.1002/bies.20170 [DOI] [PubMed] [Google Scholar]
- Manolio T. A., Collins F. S., Cox N. J., Goldstein D. B., Hindorff L. A., Hunter D. J., Mccarthy M. I., Ramos E. M., Cardon L. R., Chakravarti A., Cho J. H., Guttmacher A. E., Kong A., Kruglyak L., Mardis E., Rotimi C. N., Slatkin M., Valle D., Whittemore A. S., Boehnke M., Clark A. G., Eichler E. E., Gibson G., Haines J. L., Mackay T. F. C., Mccarroll S. A., and Visscher P. M., Nature (London) 461, 747 (2009). 10.1038/nature08494 [DOI] [PMC free article] [PubMed] [Google Scholar]
- Klamt S., Saez-Rodriguez J., Lindquist J. A., Simeoni L., and Gilles E. D., BMC Bioinf. 7, 56 (2006). 10.1186/1471-2105-7-56 [DOI] [PMC free article] [PubMed] [Google Scholar]
- Li F., Thiele I., Jamshidi N., and Palsson B. Ø., PLOS Comput. Biol. 5, e1000292 (2009). 10.1371/journal.pcbi.1000292 [DOI] [PMC free article] [PubMed] [Google Scholar]
- Hsu P. P. and Sabatini D. M., Cell 134, 703 (2008). 10.1016/j.cell.2008.08.021 [DOI] [PubMed] [Google Scholar]
- Vander Heiden M. G., Cantley L. C., and Thompson C. B., Science 324, 1029 (2009). 10.1126/science.1160809 [DOI] [PMC free article] [PubMed] [Google Scholar]
- The Cancer Genome Atlas Research Network, Nature 455, 1061 (2008).18772890 [Google Scholar]
- Shlomi T., Eisenberg Y., Sharan R., and Ruppin E., Mol. Syst. Biol. 3, 101 (2007). 10.1038/msb4100141 [DOI] [PMC free article] [PubMed] [Google Scholar]
- This particular type of interaction is more technically referred to as “synergistic” or “aggravating” epistasis.
- This commonly used formulation does not result in any loss of generality; however, the constraint of all fluxes to be non-negative simplifies the geometry of our solution space.
- In practice, Klamt and Gilles do not compute EP, but elementary flux modes (EFMs), which are a related pathway decomposition. Although EFMs are thought to be a more compact representation of pathway structure (Ref. ) we use EP in our formulation due to their mathematical simplicity. However, we obtained similar results (and limitations) with either formalism.


