

We showed that intrinsic angiogenesis (total hemoglobin concentration) contrast holds promise as an adjunct to diagnostic mammography and US for distinguishing early-stage invasive breast cancers from benign lesions.
Abstract
Purpose:
To investigate the potential role of optical tomography in the near-infrared (NIR) spectrum with ultrasonographic (US) localization as a means of differentiating early-stage cancers from benign lesions of the breast.
Materials and Methods:
The protocol was approved by the institutional review boards and was HIPAA compliant; all participants signed an informed consent. One hundred seventy-eight consecutive women (mean age, 52 years; range, 21–89 years) who underwent US-guided biopsy were imaged with a hand-held probe consisting of a coregistered US transducer and an NIR imager. The lesion location provided by coregistered US was used to guide optical imaging. Light absorption was measured at two optical wavelengths. From this measurement, tumor angiogenesis was assessed on the basis of calculated total hemoglobin concentration (tHb) and was correlated with core biopsy results. For patients diagnosed with carcinomas and followed up with subsequent excision, the tHb was correlated with pathologic parameters.
Results:
There were two in situ carcinomas (Tis), 35 T1 carcinomas, 24 T2–T4 carcinomas, and 114 benign lesions. The mean maximum and mean average tHb of the Tis–T1 group were 102.0 μmol/L ± 28.5 (standard deviation) and 71.9 μmol/L ± 18.8, and those of the T2–T4 group were 100.3 μmol/L ± 26.4 and 67.0 μmol/L ± 18.3, respectively. The mean maximum and mean average tHb of the benign group were 55.1 μmol/L ± 22.7 and 39.1 μmol/L ± 14.9, respectively. Both mean maximum and mean average tHb levels were significantly higher in the malignant groups than they were in the benign group (P < .001). The sensitivity, specificity, positive predictive value, and negative predictive value for Tis–T1 cancers were 92%, 93%, 81%, and 97%. The corresponding values for T2–T4 tumors were 75%, 93%, 69%, and 95%.
Conclusion:
The angiogenesis (tHb) contrast imaged by using the NIR technique with US holds promise as an adjunct to mammography and US for distinguishing early-stage invasive breast cancers from benign lesions.
© RSNA, 2010
Supplemental material: http://radiology.rsna.org/lookup/suppl/doi:10.1148/radiol.10091237/-/DC1
Introduction
The increased use of breast cancer screening has resulted in more patients with small lesions being identified in mammographic screening programs (1–3). To further characterize solid lesions, ultrasonography (US) of the breast is more commonly being used as an adjunct to mammography (4,5). In addition, US may have a role in the screening of women with dense breasts (6,7). However, the correct diagnosis of a suspicious lesion at US may be difficult because of the overlap between features of malignant and benign breast lesions, especially when the lesions are small (8,9). Consequently, diagnostic confirmation often requires an image-guided biopsy procedure. In current clinical practice, 70%–80% of biopsies yield benign lesions (10).
Diffuse optical tomography in the near-infrared (NIR) region is an emerging modality with potential applications in radiology and oncology (11–28). Diffuse optical tomography provides functional quantification of tumor hemoglobin content, which is directly related to tumor angiogenesis (29) and tumor hypoxia (30). Thus, it is crucial to determine the optical properties of a lesion as accurately as possible to take advantage of these recognized attributes.
Most studies that are based on pure optical measurements have fundamental limitations owing to the intense light scattering in tissue. In general, localization or imaging that is based on tomographic inverse scattering approaches suffers from location uncertainty and imprecise target qualification. Many research groups have investigated the use of a priori lesion structure information provided by other imaging modalities, such as US (27,28), magnetic resonance (MR) imaging (24,25), and mammography (26) to improve the localization of optical tomography. A flexible light guide with the use of optical fibers makes optical imaging compatible with many other imaging modalities and allows for simultaneous imaging with identical geometric conditions. Furthermore, the lesion structure information provided by other modalities can be used to assist optical imaging reconstruction, therefore reducing the location uncertainty and improving the quantification accuracy of light.
Our initial clinical results obtained from US-guided optical tomography have shown that early-stage invasive cancers may be distinguished from benign lesions with an average of a twofold higher total hemoglobin concentration (tHb) contrast (hereafter referred to as tHb contrast) than that of benign lesions (27,28). However, breast cancer is a heterogeneous disease with different subtypes, grades, and metabolic rates that result in a wide range of functional differences. The purpose of our study was to investigate the potential role of optical tomography in the NIR spectrum with US localization as a means of differentiating early-stage cancers from benign lesions of the breast.
Materials and Methods
Patients
The study was performed at the Department Radiology, University of Connecticut Health Center (Farmington, Conn), from September 1, 2004, to September 30, 2008, and at the Department of Radiology, Hartford Hospital (Hartford, Conn), from September 1, 2007, to September 30, 2008. The study protocol was approved by the institutional review boards of both institutions and was Health Insurance Portability and Accountability Act compliant. Written informed consent was obtained from all patients. The eligible patients were initially referred for US-guided biopsy with requisitions indicating solid masses, and their lesions were identified by using US at the time of the study. Individuals with lesions that were not identifiable by using US were not specifically examined; however, four such patients were used as control subjects. For these four patients, data were acquired at a different quadrant away from the questionable areas. Control data also included data from an additional 11 study patients whose data were acquired from quadrants away from reference lesions at presentation. These 11 study patients had large breasts and small lesions, and the control data were not affected in any way by the lesions. The final study group consisted of 178 consecutive women whose ages ranged from 21 to 89 years (mean age, 52 years). Of the 178 patients in the study, 16 were excluded from analysis. Data in four patients were not recorded appropriately owing to data acquisition problems. Four patients had small dense breasts with the chest wall about 1 cm deep to the skin surface. The poor probe-tissue contact and the heterogeneous chest wall caused substantial image artifacts. Data in six patients were from one breast each, and thus reference data from the contralateral breast was not available. Two patients had lesions in the dark nipple–areolar complex region that were not imaged correctly because of the high absorption of the dark nipple–areolar complex.
Pathologic Assessment
All core biopsy and surgical specimens were initially reviewed by an attending pathologist. Two breast pathologists (A.R., 25 years of experience; P.U.H., 8 years of experience), who were blinded to optical imaging results, retrospectively reviewed all the hematoxylin-eosin–stained slides to validate the information about primary tumor size with gross and/or microscopic measurements, tumor type, tumor grade (Nottingham score), as well as histologic evidence of carcinoma in situ, if any, for cases in patients from each corresponding hospital. For patients who underwent neoadjuvant chemotherapy (n = 16), the initial diagnostic core biopsy reports and the hematoxylin-eosin–stained slides, as well as the pretreatment clinical staging that was based on imaging results, were used to obtain tumor information.
Benign lesions were similarly handled. They were initially reviewed by attending pathologists from the participating hospitals. The two pathologists mentioned above further retrospectively reviewed all the hematoxylin-eosin–stained slides and classified benign lesions as proliferative with atypia, proliferative without atypia, and nonproliferative lesions. The proliferative lesions without atypia included adenosis variants, moderate to florid degrees of hyperplasia, sclerosing lesions, papilloma, radial scars or complex sclerosing lesions, and fibroadenoma with complex proliferative features (31). The nonproliferative lesions were fibrocystic changes, including mild hyperplasia, fibroadenoma without complex features, fat necrosis and/or other inflammatory changes, cysts, intramammary lymph nodes, and normal or physiologic breast tissue.
US and NIR Systems
US examinations were performed with a linear transducer (L12; Philips Medical Systems, Bothell, Wash) of the US unit (IU22; Philips Medical Systems) at University of Connecticut Health Center and a linear transducer of the US unit (15L8 Sequoia; Acuson, Mountain View, Calif) at Hartford Hospital. US lesions in patients who were referred for core biopsy were evaluated by two radiologists (M.K. and E.B.C., with 11 and 21 years of experience, respectively) and attending radiologists from the participating hospitals. Two NIR systems with identical electronic and optical designs were used at the two hospitals (Fig 1, Appendix E1 [online]). The probe consists of a commercial US transducer located in the middle, with optical source and detector fibers distributed at the periphery (32). Two optical wavelengths, 780 and 830 nm, were used, and optical absorptions at these two wavelengths were used to calculate the tHb of the lesion, which was used to assess tumor angiogenesis. The entire NIR data acquisition interval was less than 5 seconds. For each patient, US images and optical measurements were acquired simultaneously before biopsy procedures at multiple locations, including the lesion region and a normal region of the contralateral breast in the same quadrant as that in which the lesion was located. The optical data acquired from the normal contralateral breast were used as reference for calculating the background optical absorption and reduced scattering coefficients that were used in image reconstruction of the lesions. Mammograms and US images obtained before the NIR image were reviewed by attending radiologists, and all contralateral measurements were taken at normal areas on the basis of the available information.
Figure 1:

Combined US and NIR systems and a handheld probe with a centrally located US linear array and NIR source-detector fibers distributed at the periphery of the probe.
NIR Imaging
The details of our dual-zone mesh optical imaging reconstruction algorithm have been described previously (28,33). Briefly, the reconstruction takes advantage of US localization of lesions and segments the imaging volume into the US-identified region of interest (ROI) and background nonlesion regions. Because the spatial resolution of diffused light is poorer than that of US, the ROI used for optical reconstruction is chosen to be at least two to three times larger than that seen by using US in the x-y dimensions. In addition, because the depth localization of diffused light is very poor, a tighter ROI in-depth dimension is mainly set by using coregistered US and, therefore, depends on margins seen by using US. Once the ROI is chosen, the optical imaging reconstruction is repeatable for each NIR data set and does not depend on operators. One author (Q.Z., 10 years of experience) performed optical imaging. In all optical images, a finer 0.25 × 0.25 × 0.5-cm imaging grid is used for the ROI, and a coarse 1.5 × 1.5 × 1.0-cm grid is used for the background. This scheme effectively aids in reducing the total number of voxels with unknown optical absorption to the same order of total measurements. In addition, the total absorption is reconstructed, and the total is divided by the different voxel sizes of the lesion and background to obtain the absorption distribution. This scheme further conditions the inversion (28). As a result, the inversion is stable and converges quickly in three to four iterations. Furthermore, because the voxel size of the coarse grid is 72 times larger than that of the finer grid, the lesion-to-background tissue contrast is substantially improved. The tHb distribution is then computed from absorption maps (28,34). Maximum lesion tHb was measured, and the average was computed inside the lesion, with the tHb within 50% of the maximum value (ie, within the full width at half maximum [FWHM] region). To compute the sensitivity, specificity, and positive and negative predictive values that were based on all data obtained from this large patient pool at the end of the study, a tHb threshold level was retrospectively selected to separate most of the tumors from the benign lesions. False-negative cases were malignant tumors with tHb content lower than the threshold level and false-positive cases were benign lesions with tHb content higher than the threshold level.
Because these quantitative measurements do not account for tHb pattern distribution differences as observed in large malignant cancers, we used three qualitative features previously described in other imaging techniques to assign a score to the large cancer tHb distribution at the time of imaging as heterogeneous peripheral enhancement, posterior shadowing, and uniform patterns. Peripheral enhancement and uniform patterns are frequently used in MR imaging to further differentiate benign from malignant lesions (35,36), whereas posterior acoustic shadowing is a finding used in US to suggest malignancy (5).
We acquired multiple coregistered US and NIR data sets at the lesion location and reconstructed the corresponding optical absorption maps, as well as the tHb distribution with coregistered US guidance. The NIR data sets with patient motion, as evaluated by using two coregistered US images acquired before and after each NIR data set, were excluded from averaging. The data for each patient were an average value that was obtained from three to four quality NIR images.
Statistical Analysis
A two-sample t test was used to calculate significance for comparisons between groups and the 95% confidence interval (CI). A difference with a P value of .05 was considered to be significant. Binomial 95% confidence limits of sensitivity, specificity, positive predictive value, and negative predictive value were computed. Software (Minitab 15; Minitab, State College, Pa) was used for statistical calculation.
Results
The numbers of malignant lesions were as follows: Tis–T1a (n = 4), T1b (n = 10), T1c (n = 23), and T2–T4 (n = 24) tumors (Tables E1, E2 [online]; Appendix E1 [online]). Benign lesions were proliferative lesions with and without atypia (n = 24), nonproliferative fibrocystic changes (n = 28), fibroadenoma (n = 33), fat necrosis and/or inflammatory and reactive changes (n = 8), complex or simple cysts (n = 16), normal breast tissue (n = 3), lymph node (n = 2), and control cases (n = 15) (Table 1).
Table 1.
Mean Values of Tis–T1, T2–T4, and Benign Groups
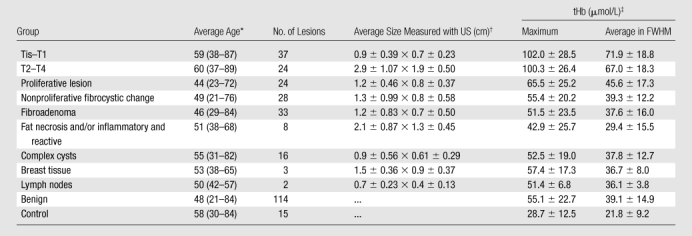
Numbers in parentheses are ranges.
Data are the mean ± standard deviation. Data are lateral × depth measurements.
Data are the mean ± standard deviation.
A twofold higher tHb was found in malignant groups (for the Tis–T1 group, the mean maximum was 102.0 μmol/L ± 28.5 [standard deviation] and the mean average was 71.9 μmol/L ± 18.8; for the T2–T4 group, the mean maximum was 100.3 μmol/L ± 26.4 and the mean average was 67.0 μmol/L ± 18.3) than in all benign groups (mean maximum, 55.1 μmol/L ± 22.7; mean average, 39.1 μmol/L ± 14.9 [P < .001]) (Fig 2). The mean differences of maximum and average were 47.2 μmol/L (95% CI: 38 μmol/L, 56 μmol/L) and 33.1 μmol/L (95% CI: 27 μmol/L, 39 μmol/L) between the Tis–T1 and benign groups, and the mean differences of maximum and average were 45.2 μmol/L (95% CI: 35 μmol/L, 56 μmol/L) and 27.9 μmol/L (95% CI: 21 μmol/L, 35 μmol/L) between the T2–T4 and benign groups. The proliferative lesion group showed a higher tHb content (mean maximum, 65.5 μmol/L ± 25.2; mean average, 45.6 μmol/L ± 17.3) than the other benign lesion groups (mean maximum, 52.3 μmol/L ± 21.3; mean average, 37.4 μmol/L ± 13.8) (P < .04). Both maximum and average tHb levels of malignant groups, the proliferative lesion group, and the other benign lesion group were significantly higher than those in the control group (mean maximum, 28.7 μmol/L ± 12.5; mean average, 21.8 μmol/L ± 9.2) (P < .001).
Figure 2:

Maximum tHb in micromoles per liter in three patient groups. NPBL = nonproliferative benign lesions, PBL = proliferative benign lesions.
Multiple NIR data sets were obtained at the lesion site, and average values of tHb were used to characterize each lesion. The mean standard deviations of maximum tHb of Tis–T1, T2–T4, and benign lesions were 6.2, 5.7, and 5.3 μmol/L, respectively; the mean standard deviations of average tHb were 4.2, 3.9, and 3.3 μmol/L, respectively, for the corresponding groups. Thus, on average, about a 5 μmol/L change could be encountered in repeated imaging, and the change is independent of lesion type.
If 82 μmol/L was chosen as a threshold level to distinguish between malignant and benign lesions, the sensitivity, specificity, positive predictive value, and negative predictive value for Tis–T1 tumors were 92% (34 of 37 lesions [95% CI: 78%, 98%]), 93% (106 of 114 lesions [95% CI: 87%, 97%]), 81% (34 of 42 lesions [95% CI: 66%, 91%]), and 97% (106 of 109 lesions [95% CI: 92%, 99%]) (Fig 3). The corresponding values for T2–T4 tumors were 75% (18 of 24 lesions [95% CI: 53%, 90%]), 93% (106 of 114 lesions [95% CI: 87%, 97%), 69% (18 of 26 lesions [95% CI: 48%, 86%]), and 95% (106 of 112 lesions [95% CI: 89%, 98%).
Figure 3:

Scatterplot of reconstructed maximum tHb in micromoles per liter in 10 patient groups. The Tis–T1 group included ductal carcinoma in situ and lobular carcinoma in situ and stage I tumors. FA = fibroadenoma, FN-INF = fat necrosis and/or inflammatory and reactive changes, PBL = proliferative benign lesion, NPFCC = nonproliferative fibrocystic changes, ≥T2 = T2–T4 tumors.
Typical examples of a benign lesion and T1 and T2–T4 malignant lesions are given in Figures 4–9.
Figure 4a:

(a) US image of a suspicious lesion (arrow) located at 3-o’clock position in the left breast in 37-year-old woman. The lesion was 7 mm by using US measurement. (b) tHb map shows low and diffused distribution of maximum of 35.3 μmol/L and average of 24.7 μmol/L within FWHM region at the corresponding location of section 4. Core biopsy revealed a fibroadenoma. In NIR image, the first section was 0.3 cm from the skin surface and the last section was 3.3 cm toward the chest wall. Each section is an x-y spatial image of 9 × 9 cm, with x and y directions marked on the image. The spacing between the sections is 0.5 cm in depth. The vertical scale is the tHb concentration in micromoles per liter, ranging from 0 to 100 μmol/L. In the following NIR images, the spacing between the sections is kept at 0.5 cm, and the vertical scale is kept from 0 to 100 μmol/L. The spatial dimensions of each section were 9 × 9 cm. Slice = section (also in Figs 5–9).
Figure 9a:

(a) US image of a suspicious lesion (bottom arrow) located at 1-o’clock position in the left breast in 76-year-old woman. The patient had a prior cancer (top arrow) removed 10 years previously, and the new lesion grew at the prior surgical site. The exact size could not be measured because of scar tissue. (b) tHb map showed a much higher concentration at the top of the tumor (section 3) than that at the bottom (section 4). The first section was 0.5 cm from the skin surface. The vertical scale is the same as that on Figure 4. Core biopsy sampled from both scar and new lesion areas revealed a high-grade infiltrating lobular carcinoma. The patient was treated with neoadjuvant chemotherapy.
Figure 4b:

(a) US image of a suspicious lesion (arrow) located at 3-o’clock position in the left breast in 37-year-old woman. The lesion was 7 mm by using US measurement. (b) tHb map shows low and diffused distribution of maximum of 35.3 μmol/L and average of 24.7 μmol/L within FWHM region at the corresponding location of section 4. Core biopsy revealed a fibroadenoma. In NIR image, the first section was 0.3 cm from the skin surface and the last section was 3.3 cm toward the chest wall. Each section is an x-y spatial image of 9 × 9 cm, with x and y directions marked on the image. The spacing between the sections is 0.5 cm in depth. The vertical scale is the tHb concentration in micromoles per liter, ranging from 0 to 100 μmol/L. In the following NIR images, the spacing between the sections is kept at 0.5 cm, and the vertical scale is kept from 0 to 100 μmol/L. The spatial dimensions of each section were 9 × 9 cm. Slice = section (also in Figs 5–9).
Figure 5a:

(a) US image of a suspicious lesion (arrow) located at 8-o’clock position in the right breast in 65-year-old woman. The lesion was 9 mm by using US measurement. (b) tHb map showed an isolated, well-defined mass with high tHb of maximum of 112.3 μmol/L and average of 75.8 μmol/L at the corresponding location of section 3. The first section was 0.5 cm from the skin surface. The vertical scale is the same as on Figure 4. Biopsy revealed an invasive carcinoma with ductal and lobular features, and the pathologic stage was T1b (size, 1.0 cm).
Figure 5b:

(a) US image of a suspicious lesion (arrow) located at 8-o’clock position in the right breast in 65-year-old woman. The lesion was 9 mm by using US measurement. (b) tHb map showed an isolated, well-defined mass with high tHb of maximum of 112.3 μmol/L and average of 75.8 μmol/L at the corresponding location of section 3. The first section was 0.5 cm from the skin surface. The vertical scale is the same as on Figure 4. Biopsy revealed an invasive carcinoma with ductal and lobular features, and the pathologic stage was T1b (size, 1.0 cm).
Figure 6a:

(a) US image of a suspicious tubular-like lesion (arrow) located at12-o’clock position in the right breast in 71-year-old woman. The lesion was 7 mm by using US measurement. (b) tHb map showed an isolated, well-defined mass with high tHb of maximum of 97.8 μmol/L and average of 65.7 μmol/L at the corresponding location of section 3. The first section was 0.7 cm from the skin surface. The vertical scale is the same as that on Figure 4. Biopsy revealed an invasive ductal carcinoma, and pathologic tumor stage was T1c (size, 1.2 cm).
Figure 6b:

(a) US image of a suspicious tubular-like lesion (arrow) located at12-o’clock position in the right breast in 71-year-old woman. The lesion was 7 mm by using US measurement. (b) tHb map showed an isolated, well-defined mass with high tHb of maximum of 97.8 μmol/L and average of 65.7 μmol/L at the corresponding location of section 3. The first section was 0.7 cm from the skin surface. The vertical scale is the same as that on Figure 4. Biopsy revealed an invasive ductal carcinoma, and pathologic tumor stage was T1c (size, 1.2 cm).
Figure 7a:

(a) US image of a suspicious lesion (arrow) located at 6-o’clock position in the left breast in 51-year-old woman. The lesion was 9 mm by using US measurement. (b) tHb map showed an isolated and distinct mass with high tHb of maximum of 108.4 μmol/L and average of 77.3 μmol/L at the corresponding location of section 3. The first section was 0.5 cm from the skin surface. The vertical scale is the same as that on Figure 4. Biopsy revealed an invasive carcinoma with ductal and lobular features, and the pathologic tumor stage was T1c (size, 1.5 cm).
Figure 7b:

(a) US image of a suspicious lesion (arrow) located at 6-o’clock position in the left breast in 51-year-old woman. The lesion was 9 mm by using US measurement. (b) tHb map showed an isolated and distinct mass with high tHb of maximum of 108.4 μmol/L and average of 77.3 μmol/L at the corresponding location of section 3. The first section was 0.5 cm from the skin surface. The vertical scale is the same as that on Figure 4. Biopsy revealed an invasive carcinoma with ductal and lobular features, and the pathologic tumor stage was T1c (size, 1.5 cm).
Figure 8a:

(a) US image of a suspicious lesion (arrows) located at 11-o’clock position in the right breast in 63-year-old woman. The lesion was 3 cm by using US measurement. (b) tHb map showed heterogeneous distribution with a higher concentration located at the periphery. The first section was 0.2 cm from the skin surface. The vertical scale is the same as that on Figure 4. Biopsy revealed an invasive ductal carcinoma, and the pathologic tumor stage was T2 (size, 2.2 cm).
Figure 8b:

(a) US image of a suspicious lesion (arrows) located at 11-o’clock position in the right breast in 63-year-old woman. The lesion was 3 cm by using US measurement. (b) tHb map showed heterogeneous distribution with a higher concentration located at the periphery. The first section was 0.2 cm from the skin surface. The vertical scale is the same as that on Figure 4. Biopsy revealed an invasive ductal carcinoma, and the pathologic tumor stage was T2 (size, 2.2 cm).
Figure 9b:

(a) US image of a suspicious lesion (bottom arrow) located at 1-o’clock position in the left breast in 76-year-old woman. The patient had a prior cancer (top arrow) removed 10 years previously, and the new lesion grew at the prior surgical site. The exact size could not be measured because of scar tissue. (b) tHb map showed a much higher concentration at the top of the tumor (section 3) than that at the bottom (section 4). The first section was 0.5 cm from the skin surface. The vertical scale is the same as that on Figure 4. Core biopsy sampled from both scar and new lesion areas revealed a high-grade infiltrating lobular carcinoma. The patient was treated with neoadjuvant chemotherapy.
Three false-negative cases were observed in the Tis–T1 group: a 0.11-cm microinvasive T1a ductal carcinoma, a 1.0-cm T1b lobular carcinoma, and a 1.3-cm T1c invasive ductal carcinoma (Table E1 [online], Appendix E1 [online]). The patient with T1c tumor had two lesions located 1.5 cm apart at depths of 1.3 and 2.4 cm. Tumor sizes were 1.3 and 2.0 cm measured from the pathologic specimen, respectively. The NIR image reconstructed at 2.4-cm depth showed one isolated tumor of a much higher tHb, whereas the NIR image reconstructed at 1.3 cm showed two lesions of similar but lower tHb. Because NIR light does not have good depth resolution, signals from the deeper and larger 2-cm tumor produced some interference to the signals originating from the smaller tumor located at 1.3-cm depth. This resulted in the lower light quantification of the smaller tumor.
Thirty-eight percent (nine of 24) of the T2–T4 tumors showed heterogeneous peripheral enhancement, which was not observed in benign solid lesions. Interestingly, these tumors were all high grade. In addition, 33% (eight of 24) of the T2–T4 tumors showed posterior shadowing. This was caused by the substantial light absorption of a highly vascularized tumor, which causes the dramatic reduction of the reflected light from the deeper portion of the tumor. Four (17%) tumors in the T2–T4 group had a uniform tHb distribution with a lower tHb level, which made them indistinguishable from large benign lesions of a similar size (Table 2, Appendix E1 [online]).
Table 2.
False-Negative Cases with Low tHb and Uniform Distribution
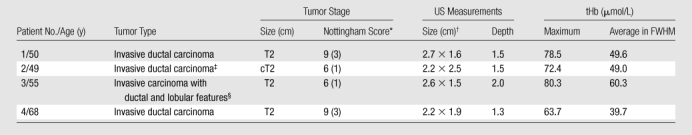
Numbers in parentheses are mitotic scores.
Data are lateral × depth measurements.
Mitotic counts were 0–1 per 10 high-power fields.
Mitotic counts were 1 per 10 high-power fields.
The NIR data for tHb of four proliferative lesions (two each, with and without atypia), one hamartoma in the nonproliferative fibrocystic change category, one fibroadenoma, one fat necrosis with inflammation and reactive changes, and one complex cyst were above the 82 μmol/L threshold level. These lesions were considered as false-positive cases (Table 3, Appendix E1 [online]).
Table 3.
False-Positive Cases
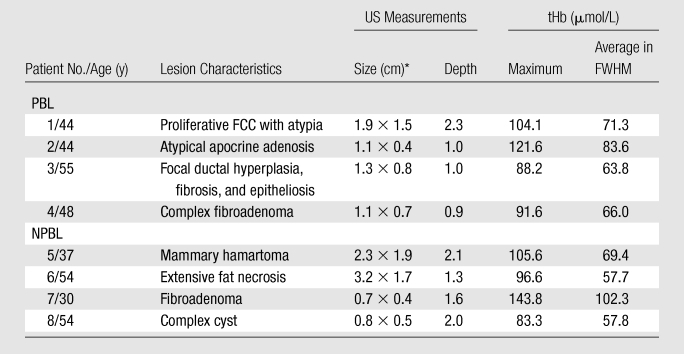
Note.—FCC = fibrocystic changes, NPBL = nonproliferative benign lesions, PBL = proliferative benign lesions.
Data are lateral × depth measurements.
Discussion
Optical tomography has tremendous potential to provide clinically useful functional information about tumor angiogenesis and tumor hypoxia (12). When targeted contrast agents are used, molecular information can also be revealed. Our previously published results obtained from 10 early-stage invasive cancers with size estimated from US and 90 benign lesions showed that malignant lesions presented a twofold higher tHb contrast compared with that in the benign group (27,28). This study, with 37 pathologically staged early-stage cancers and 114 benign lesions, further demonstrates the diagnostic potential of this technique. The tHb threshold level of 82 μmol/L used to distinguish most of the Tis–T1 tumors from benign lesions was based on the data generated by this large patient pool. In our earlier pilot studies (27,28), a tHb threshold level of 95 μmol/L was used to distinguish between the 10 early-stage invasive cancers and the 90 benign lesions. Because the prior data included data from a limited number of malignant tumors, we believe that the current threshold level better represents the separation between diverse types of earlier-stage malignant cancers and benign lesions, and the data may be used as a training set for future large-scale prospective clinical trials.
Our technique is best suited to characterizing US-visible lesions, and it may prove to be valuable in investigating lesions that are small and considered indeterminate on the basis of mammographic and US results. When our technique is used as an adjunct to mammography and US in screening, the additional tumor angiogenesis information may yield a more accurate preoperative diagnosis. For large US-visible lesions, this technique can provide some tHb distribution features, such as heterogeneous peripheral enhancement and/or posterior shadowing, that can add diagnostic value to US. In addition, the tHb distribution can be monitored and used to assess response in patients who have locally advanced cancers and who are undergoing neoadjuvant chemotherapy (15,37–39).
In patients with benign disease who were examined, two proliferative lesions with atypia and two lesions with radial scar and fibroadenoma with complex features showed high tHb (Table 3). With regard to the breast cancer risk, there is clinicopathologic consensus that, among women who have had a benign breast biopsy, the subsequent breast cancer risk varies according to the histopathologic category of benign breast disease, with a moderately increased risk among women who have proliferative lesions without atypia and a substantially increased risk among women who have atypical hyperplasia (40–42). With regard to the vascular transformation of proliferative lesions, Viacava et al (43) measured angiogenesis by using immunohistochemical techniques in a spectrum of normal lobules and proliferative, atypical, and malignant breast lesions. Vascular proliferative parameters were higher in all breast lesions, as compared with normal lobules, and increased with lesion severity. This could account for the increasing tHb levels from benign nonproliferative lesions, to proliferative and atypical lesions, to malignant cancers.
The perturbations used to calculate absorption maps were the normalized difference between the measurements obtained at the lesion region and the normal region of the contralateral breast in the same quadrant as that in which the lesion was identified. In this procedure, we used the optical properties of the patient’s own background tissue as a reference or a control, and this background tissue is thus insensitive to the patient’s background optical property changes. However, this procedure is sensitive to contralateral site selection. We evaluated possible bilateral disease by reviewing mammograms and US images obtained before the NIR images, and we did not perform measurements in any sites near areas of potential disease. All contralateral measurements were taken at normal areas on the basis of the available information. Multiple NIR data sets were obtained at the lesion site, and average values of tHb were used to characterize each lesion. On average, about a 5 μmol/L variation could be encountered in repeated imaging by using the handheld probe. Further technology development on real-time NIR data acquisition could reduce this variation.
This technology has limitations. First, when the chest wall is present within a 1.0- to 1.5-cm depth, the chest wall underneath the breast tissue affects NIR measurements. In our clinical studies, we use real-time coregistered US to position the handheld probe at the lesion site and the contralateral reference site of the same quadrant by matching the probe position and the chest wall depth. This effort minimizes the difference in chest wall positions at both sites and produces the best imaging results (44). Therefore, the operator’s knowledge and skills are important, and guidelines have to be provided for future multi-institutional studies.
Second, the dual-zone mesh reconstruction method is based on a linear approximation to the photon density waves measured at the surface. This algorithm is robust and converges quickly. For a higher optical contrast phantom target or tumor of 1 cm in size, we typically achieve about 80% and 70% accuracy when the maximum and the average values of a reconstructed absorption map are used, respectively (32,45). For a lower optical contrast phantom target or a benign lesion of the same size, about 100%–120% and 100%–140% accuracy can be achieved by using the same quantification criteria, respectively. However, for a larger phantom target of 3 cm in size, about 65%–70% and 55%–60% accuracy for the higher optical contrast one are achieved by using the same quantification criteria, respectively, and about 100%–130% accuracy for the lower optical contrast target (32,45). The results of the controlled phantom studies suggest that the in vivo malignant-benign lesion contrast for early-stage cancers versus benign lesions could be higher than the twofold higher contrast reported because a small cancer could be 20% underreconstructed and a small benign lesion could be 20% overreconstructed. Further technology developments by using nonlinear approximation to the measured diffusive waves and improving system dynamic range are warranted to advance this technology.
Third, because NIR light measures light absorption, a bruise or a hematoma caused by injury or prior biopsy could appear as a false-positive case. In this study, coregistered NIR and US data for all patients were taken before their biopsies, and the potential issue related to the angiogenesis change after biopsy can be ruled out. In addition, a dark nipple–areolar complex could have higher absorption in the shallow depth near the skin surface. If the examined lesion was more than 1 cm deeper or 2 cm away from a dark nipple, the nipple–areolar complex did not appear to cause a problem. Lighter-colored nipple–areolar complex skin did not cause a problem. Another potential problem is the poor probe-tissue contact in the examination of small dense breasts. By developing probes of different sizes suitable for different breast sizes, good probe-tissue contact should be achieved.
A final limitation was that we used data from the current study population to retrospectively set our threshold level for tHb. This level likely leads to an overestimation of the values of sensitivity, specificity, and accuracy that would be obtained in a different patient population. A large prospective clinical trial is needed to further validate these results.
We showed that intrinsic tHb contrast holds promise as an adjunct to diagnostic mammography and US for distinguishing early-stage invasive breast cancers from benign lesions. The tHb contrast may also help to distinguish some high-risk proliferative lesions from nonproliferative lesions. For advanced cancers, some tHb distribution features, such as heterogeneous peripheral enhancement and/or posterior shadowing, can add diagnostic value to US.
Advances in Knowledge.
With the use of optical tomography, a twofold higher total hemoglobin concentration (tHb) was found in malignant invasive breast cancer lesions (for Tis–T1 group, mean maximum was 102.0 μmol/L ± 28.5 [standard deviation] and mean average was 71.9 μmol/L ± 18.8; for T2–T4 group, mean maximum was 100.3 μmol/L ± 26.4 and mean average was 67.0 μmol/L ± 18.3) than in benign lesions (mean maximum, 55.1 μmol/L ± 22.7; mean average, 39.1 μmol/L ± 14.9), with P < .001.
With the use of near-infrared (NIR) data with US location and a threshold level of tHb of 82 μmol/L, the sensitivity, specificity, positive predictive value, and negative predictive value for Tis–T1 cancers were 92%, 93%, 81%, and 97%, respectively.
Implication for Patient Care.
The NIR technique with US can provide a safe, quick, noninvasive method that may aid US in accurate diagnosis of small indeterminate breast lesions.
Supplementary Material
Acknowledgments
We thank the following: US technologists of the Department of Radiology, University of Connecticut Health Center (Farmington, Conn) and Hartford Hospital (Hartford, Conn) for assistance in US data acquisition and patient imaging; staff of the Cancer Center, University of Connecticut Health Center, for assistance in patient recruiting; Kimberly Sokol, BS, Coordinator, Department of Radiology, University of Connecticut Health Center, for help in complex patient scheduling issues; and Sandra Trifiro, RN, Coordinator, Clinical Research Office, Hartford Hospital, is thanked for consenting patients recruited at the hospital.
Received July 11, 2009; revision requested August 31; final revision received January 7, 2010; accepted January 19; final version accepted February 15.
Supported by the Donaghue Medical Research Foundation.
Funding: This research was supported by the National Institutes of Health (grant R01EB002136).
Authors stated no financial relationship to disclose.
Abbreviations:
- CI
- confidence interval
- FWHM
- full width at half maximum
- NIR
- near-infrared
- ROI
- region of interest
- tHb
- total hemoglobin concentration
References
- 1.Cady B, Stone MD, Schuler JG, Thakur R, Wanner MA, Lavin PT. The new era in breast cancer: invasion, size, and nodal involvement dramatically decreasing as a result of mammographic screening. Arch Surg 1996;131(3):301–308 [DOI] [PubMed] [Google Scholar]
- 2.Roubidoux MA, Bailey JE, Wray LA, Helvie MA. Invasive cancers detected after breast cancer screening yielded a negative result: relationship of mammographic density to tumor prognostic factors. Radiology 2004;230(1):42–48 [DOI] [PubMed] [Google Scholar]
- 3.Roubidoux MA, Sabel MS, Bailey JE, Kleer CG, Klein KA, Helvie MA. Small (< 2.0-cm) breast cancers: mammographic and US findings at US-guided cryoablation—initial experience. Radiology 2004;233(3):857–867 [DOI] [PubMed] [Google Scholar]
- 4.Taylor KJ, Merritt C, Piccoli C, et al. Ultrasound as a complement to mammography and breast examination to characterize breast masses. Ultrasound Med Biol 2002;28(1):19–26 [DOI] [PubMed] [Google Scholar]
- 5.Stavros AT, Thickman D, Rapp CL, Dennis MA, Parker SH, Sisney GA. Solid breast nodules: use of sonography to distinguish between benign and malignant lesions. Radiology 1995;196(1):123–134 [DOI] [PubMed] [Google Scholar]
- 6.Corsetti V, Houssami N, Ferrari A, et al. Breast screening with ultrasound in women with mammography-negative dense breasts: evidence on incremental cancer detection and false positives, and associated cost. Eur J Cancer 2008;44(4):539–544 [DOI] [PubMed] [Google Scholar]
- 7.Corsetti V, Ferrari A, Ghirardi M, et al. Role of ultrasonography in detecting mammographically occult breast carcinoma in women with dense breasts. Radiol Med (Torino) 2006;111(3):440–448 [DOI] [PubMed] [Google Scholar]
- 8.Abdullah N, Mesurolle B, El-Khoury M, Kao E. Breast imaging reporting and data system lexicon for US: interobserver agreement for assessment of breast masses. Radiology 2009;252(3):665–672 [DOI] [PubMed] [Google Scholar]
- 9.Lamb PM, Perry NM, Vinnicombe SJ, Wells CA. Correlation between ultrasound characteristics, mammographic findings and histological grade in patients with invasive ductal carcinoma of the breast. Clin Radiol 2000;55(1):40–44 [DOI] [PubMed] [Google Scholar]
- 10.Gur D, Wallace LP, Klym AH, et al. Trends in recall, biopsy, and positive biopsy rates for screening mammography in an academic practice. Radiology 2005;235(2):396–401 [DOI] [PubMed] [Google Scholar]
- 11.Tromberg BJ, Cerussi A, Shah N, et al. Imaging in breast cancer: diffuse optics in breast cancer—detecting tumors in pre-menopausal women and monitoring neoadjuvant chemotherapy. Breast Cancer Res 2005;7(6):279–285 [DOI] [PMC free article] [PubMed] [Google Scholar]
- 12.Leff DR, Warren OJ, Enfield LC, et al. Diffuse optical imaging of the healthy and diseased breast: a systematic review. Breast Cancer Res Treat 2008;108(1):9–22 [DOI] [PubMed] [Google Scholar]
- 13.Chance B, Nioka S, Zhang J, et al. Breast cancer detection based on incremental biochemical and physiological properties of breast cancers: a six-year, two-site study. Acad Radiol 2005;12(8):925–933 [DOI] [PubMed] [Google Scholar]
- 14.Poplack SP, Tosteson TD, Wells WA, et al. Electromagnetic breast imaging: results of a pilot study in women with abnormal mammograms. Radiology 2007;243(2):350–359 [DOI] [PubMed] [Google Scholar]
- 15.Choe R, Corlu A, Lee K, et al. Diffuse optical tomography of breast cancer during neoadjuvant chemotherapy: a case study with comparison to MRI. Med Phys 2005;32(4):1128–1139 [DOI] [PubMed] [Google Scholar]
- 16.Heffer E, Pera V, Schütz O, Siebold H, Fantini S. Near-infrared imaging of the human breast: complementing hemoglobin concentration maps with oxygenation images. J Biomed Opt 2004;9(6):1152–1160 [DOI] [PubMed] [Google Scholar]
- 17.Liang X, Zhang Q, Li C, Grobmyer SR, Fajardo LL, Jiang H. Phase-contrast diffuse optical tomography pilot results in the breast. Acad Radiol 2008;15(7):859–866 [DOI] [PubMed] [Google Scholar]
- 18.Intes X. Time-domain optical mammography SoftScan: initial results. Acad Radiol 2005;12(8):934–947 [DOI] [PubMed] [Google Scholar]
- 19.Spinelli L, Torricelli A, Pifferi A, Taroni P, Danesini G, Cubeddu R. Characterization of female breast lesions from multi-wavelength time-resolved optical mammography. Phys Med Biol 2005;50(11):2489–2502 [DOI] [PubMed] [Google Scholar]
- 20.Schmitz CH, Klemer DP, Hardin R, et al. Design and implementation of dynamic near-infrared optical tomographic imaging instrumentation for simultaneous dual-breast measurements. Appl Opt 2005;44(11):2140–2153 [DOI] [PubMed] [Google Scholar]
- 21.Athanasiou A, Vanel D, Balleyguier C, et al. Dynamic optical breast imaging: a new technique to visualise breast vessels—comparison with breast MRI and preliminary results. Eur J Radiol 2005;54(1):72–79 [DOI] [PubMed] [Google Scholar]
- 22.Floery D, Helbich TH, Riedl CC, et al. Characterization of benign and malignant breast lesions with computed tomographic laser mammography (CTLM). Invest Radiol 2005;40(6):328–335 [DOI] [PubMed] [Google Scholar]
- 23.Grosenick D, Moesta KT, Möller M, et al. Time-domain scanning optical mammography. I. Recording and assessment of mammograms of 154 patients. Phys Med Biol 2005;50(11):2429–2449 [DOI] [PubMed] [Google Scholar]
- 24.Brooksby B, Pogue BW, Jiang S, et al. Imaging breast adipose and fibroglandular tissue molecular signatures by using hybrid MRI-guided near-infrared spectral tomography. Proc Natl Acad Sci U S A 2006;103(23):8828–8833 [DOI] [PMC free article] [PubMed] [Google Scholar]
- 25.Ntziachristos V, Yodh AG, Schnall MD, Chance B. MRI-guided diffuse optical spectroscopy of malignant and benign breast lesions. Neoplasia 2002;4(4):347–354 [DOI] [PMC free article] [PubMed] [Google Scholar]
- 26.Zhang Q, Brukilacchio TJ, Li A, et al. Coregistered tomographic x-ray and optical breast imaging: initial results. J Biomed Opt 2005;10(2):024033, 1–9 [DOI] [PubMed] [Google Scholar]
- 27.Zhu Q, Huang MM, Chen NG, et al. Ultrasound-guided optical tomographic imaging of malignant and benign breast lesions: initial clinical results of 19 cases. Neoplasia 2003;5(5):379–388 [DOI] [PMC free article] [PubMed] [Google Scholar]
- 28.Zhu Q, Cronin EB, Currier AA, et al. Benign versus malignant breast masses: optical differentiation with US-guided optical imaging reconstruction. Radiology 2005;237(1):57–66 [DOI] [PMC free article] [PubMed] [Google Scholar]
- 29.Folkman J, Watson K, Ingber D, Hanahan D. Induction of angiogenesis during the transition from hyperplasia to neoplasia. Nature 1989;339(6219):58–61 [DOI] [PubMed] [Google Scholar]
- 30.Vaupel P, Kallinowski F, Okunieff P. Blood flow, oxygen and nutrient supply, and metabolic microenvironment of human tumors: a review. Cancer Res 1989;49(23):6449–6465 [PubMed] [Google Scholar]
- 31.Fitzgibbons PL, Henson DE, Hutter RV. Benign breast changes and the risk for subsequent breast cancer: an update of the 1985 consensus statement. Cancer Committee of the College of American Pathologists. Arch Pathol Lab Med 1998;122(12):1053–1055 [PubMed] [Google Scholar]
- 32.Zhu Q, Xu C, Guo P, et al. Optimal probing of optical contrast of breast lesions of different size located at different depths by US localization. Technol Cancer Res Treat 2006;5(4):365–380 [DOI] [PMC free article] [PubMed] [Google Scholar]
- 33.Zhu Q, Chen NG, Kurtzman SH. Imaging tumor angiogenesis by use of combined near-infrared diffusive light and ultrasound. Opt Lett 2003;28(5):337–339 [DOI] [PMC free article] [PubMed] [Google Scholar]
- 34.Cope M. The application of near infrared spectroscopy to non-invasive monitoring of cerebral oxygenation in the newborn infant [doctoral dissertation]. London, England: University College, 1991 [Google Scholar]
- 35.Agrawal G, Su MY, Nalcioglu O, Feig SA, Chen JH. Significance of breast lesion descriptors in the ACR BI-RADS MRI lexicon. Cancer 2009;115(7):1363–1380 [DOI] [PMC free article] [PubMed] [Google Scholar]
- 36.Matsubayashi R, Matsuo Y, Edakuni G, Satoh T, Tokunaga O, Kudo S. Breast masses with peripheral rim enhancement on dynamic contrast-enhanced MR images: correlation of MR findings with histologic features and expression of growth factors. Radiology 2000;217(3):841–848 [DOI] [PubMed] [Google Scholar]
- 37.Zhu Q, Kurtzma SH, Hegde P, et al. Utilizing optical tomography with ultrasound localization to image heterogeneous hemoglobin distribution in large breast cancers. Neoplasia 2005;7(3):263–270 [DOI] [PMC free article] [PubMed] [Google Scholar]
- 38.Zhu Q, Tannenbaum S, Hegde P, Kane M, Xu C, Kurtzman SH. Noninvasive monitoring of breast cancer during neoadjuvant chemotherapy using optical tomography with ultrasound localization. Neoplasia 2008;10(10):1028–1040 [DOI] [PMC free article] [PubMed] [Google Scholar]
- 39.Cerussi A, Hsiang D, Shah N, et al. Predicting response to breast cancer neoadjuvant chemotherapy using diffuse optical spectroscopy. Proc Natl Acad Sci U S A 2007;104(10):4014–4019 [DOI] [PMC free article] [PubMed] [Google Scholar]
- 40.Hartmann LC, Sellers TA, Frost MH, et al. Benign breast disease and the risk of breast cancer. N Engl J Med 2005;353(3):229–237 [DOI] [PubMed] [Google Scholar]
- 41.Collins LC, Baer HJ, Tamimi RM, Connolly JL, Colditz GA, Schnitt SJ. Magnitude and laterality of breast cancer risk according to histologic type of atypical hyperplasia: results from the Nurses’ Health Study. Cancer 2007;109(2):180–187 [DOI] [PubMed] [Google Scholar]
- 42.Worsham MJ, Raju U, Lu M, Kapke A, Cheng J, Wolman SR. Multiplicity of benign breast lesions is a risk factor for progression to breast cancer. Clin Cancer Res 2007;13(18 pt 1):5474–5479 [DOI] [PubMed] [Google Scholar]
- 43.Viacava P, Naccarato AG, Bocci G, et al. Angiogenesis and VEGF expression in pre-invasive lesions of the human breast. J Pathol 2004;204(2):140–146 [DOI] [PubMed] [Google Scholar]
- 44.Ardeshirpour Y, Huang M, Zhu Q. Effect of the chest wall on breast lesion reconstruction. J Biomed Opt 2009;14(4):044005 doi:101117/1.3160548. Published November 10, 2009. Accessed April 2010 [DOI] [PMC free article] [PubMed] [Google Scholar]
- 45.Xu C, Yuan B, Zhu Q. Optimal probe design for breast imaging using near-infrared diffused light. J Biomed Opt 2008;13(4):044002 doi:101117/1.2966703. Published December 8, 2008. Accessed April 2010 [DOI] [PMC free article] [PubMed] [Google Scholar]
Associated Data
This section collects any data citations, data availability statements, or supplementary materials included in this article.