Abstract
Background
Physicians tailor insulin dosing based on blood glucose goals, response to insulin, compliance, lifestyle, eating habits, daily schedule, and fear of and ability to detect hypoglycemia.
Method
We introduce a method that allows a physician to tune a fuzzy logic controller (FLC) artificial pancreas (AP) for a particular patient. It utilizes the physician’s judgment and weighing of various factors. The personalization factor (PF) is a scaling of the dose produced by the FLC and is used to customize the dosing. The PF has discrete values of 1 through 5. The proposed method was developed using a database of results from 30 University of Virginia/Padova Metabolic Simulator in silico subjects (10 adults, 10 adolescents, and 10 children). Various meal sizes and timing were used to provide the physician information on which to base an initial dosing regimen and PF. Future decisions on dosing aggressiveness using the PF would be based on the patient’s data at follow-up.
Results
Three examples of a wide variation in diabetes situations are given to illustrate the physician’s thought process when initially configuring the AP system for a specific patient.
Conclusions
Fuzzy logic controllers are developed by encoding human expertise into the design of the controller. The FLC methodology allows for the real-time scaling of doses without compromising the integrity of the dosing rules matrix. The use of the PF to individualize the AP system is enabled by the fuzzy logic development methodology.
Keywords: artificial pancreas, diabetes, fuzzy logic, personalization, physician method
Introduction
Type 1 diabetes mellitus is an autoimmune disease causing insulin deficiency. At the present time, the only treatment is the administration of insulin either by multiple shots per day or by an infusion pump. The Diabetes Control and Complications Trial studies showed that improved control of blood glucose (BG) lessens the frequency of complications of diabetes.1 Efforts to create an artificial pancreas (AP) have intensified with the commercial availability of continuous glucose sensors.2
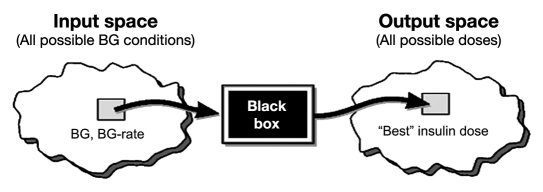
Fuzzy logic (FL) was developed at the University of California, Berkeley, in 1965 as a generalization of bivalue, true/false mathematical logic.3 Mathematically, FL can be viewed as a black box4 that maps an input space onto an output space as shown in Figure 1.
Figure 1.
Fuzzy logic as a black box mapping of an input space to an output.
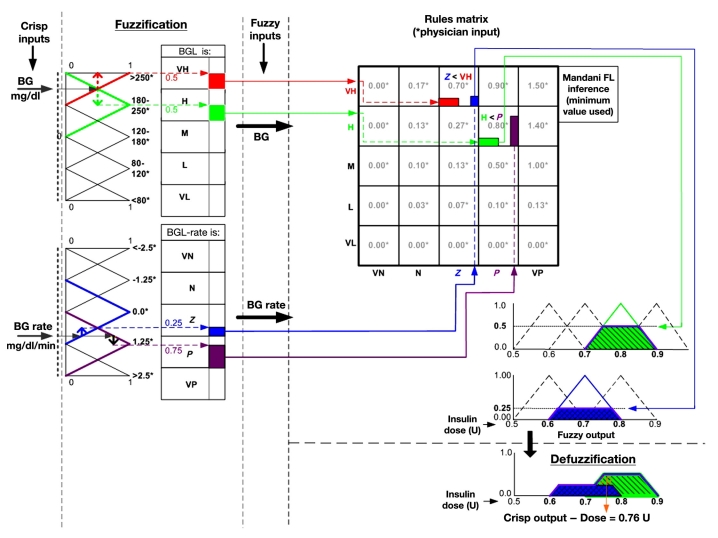
Real-world, “crisp” parameters are read into the fuzzy domain black box and are processed there, and then the solution is retransformed (defuzzified) back into real-world parameters.2 A notional diagram of this process is shown in Figure 2.
Figure 2.
Notional data flow diagram for FL process. BGL, blood glucose level; VH, very high; H, high; M, medium; L, low; VL, very low; VN, very negative; N, negative; Z, zero; P, positive; VP, very positive.
Figure 2 illustrates how FL works. For the purpose of simplicity, this diagram shows only two of the input parameters—BG and change in BG—and has excluded acceleration.
The BG input range is partitioned into five regions, representing the ranges that are meaningful to the clinician. Blood glucose regions are represented by overlapping triangles. The overlapping regions allow the BG input value to be transformed into a fuzzy variable, which intuitively is a blend of, at most, two regions. A BG value of 195 is therefore represented as a blend of high and very high, with “strength” of 50% each as indicated by the red and green boxes. The process is the same for BG, rate, and acceleration. The example input rate of 1.0 mg/dl/min is transformed into a fuzzy variable of Z and P with strengths of 0.25 and 0.75, respectively.
The two-dimensional inference engine, or decision matrix, processes the BG and rate fuzzy input variables into an output fuzzy variable by means of if–then rules predefined by the clinician. For example, if BG is very high and rate is Z, then dose is 0.7. The Mamdani defuzzification5 procedure sets the strength of the output variable to be the minimum of the inputs. Hence, the 0.7 output dose variable has strength 0.25 as represented by the blue strength of the rate variable. The larger red value is suppressed. For a given BG value and rate input value, more than one if–then dosing rule may execute, producing an output fuzzy variable that is also a blend of dosing values, as represented by blue and green truncated, overlapping triangles or trapezoids. The output dose is then calculated as the center of mass of the union of the overlapping trapezoids.
The FL process described here, when viewed as a black box, is a bounded, uniformly continuous function.6 From a safety standpoint, this is important because it means that, throughout the entire range of input values, a small change in BG, rate, or acceleration input value always results in a small change in the dose. Furthermore, the output dose can never exceed values defined by the output fuzzy variables. Algorithmically, the fuzzy logic controller (FLC) may be designed as the mathematical composition of linear table-lookup functions.
When developing a FLC, the complexity or internal structure of the process to be controlled—the human glucoregulatory system in this case—does not come into play. Instead, the expertise of the clinician—how they externally manage the glucoregulatory system—is codified within the design of the input and output regions and the if–then dosing rules making up the decision matrix. Fuzzy logic controllers are often said to embody the expertise of practitioners.
The design of this particular controller does not take into account insulin on board7,8 when calculating the dose. That feature could be incorporated as an additional input variable or as a post-processor function.9
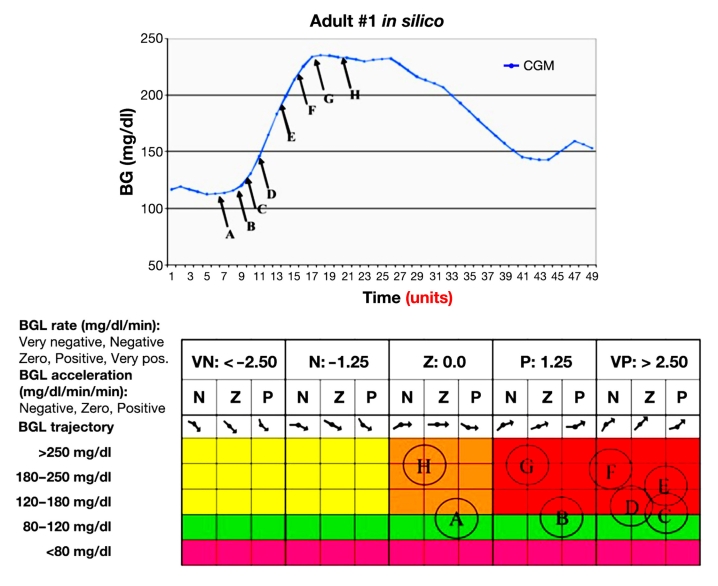
The notional FLC shown in Figure 2 may be extended to include BG acceleration as a third input. To show the mapping of BG, rate, and acceleration using a two-dimensional matrix, the acceleration inputs are repeated for each of the five rates. A notional mapping of the points A, B, …, H on the sample BG trajectory into the input-partitioned inference engine is shown in Figure 3.As demonstrated in Figure 2, each discrete input value is transformed into at most two fuzzy variables. Hence, since all possible combinations of BG, rate, and acceleration are represented in the dosing matrix, a given input vector (BG, rate, acceleration) may invoke up to eight dosing rules. The multiplicity of rules associated with each of the trajectory points is represented by the circles in the dosing matrix.
Figure 3.
Correlation of points on a BG trajectory with sets of rules in the FL dosing matrix. BGL, blood glucose level; VN, very negative; N, negative; Z, zero; P, positive; VP, very positive.
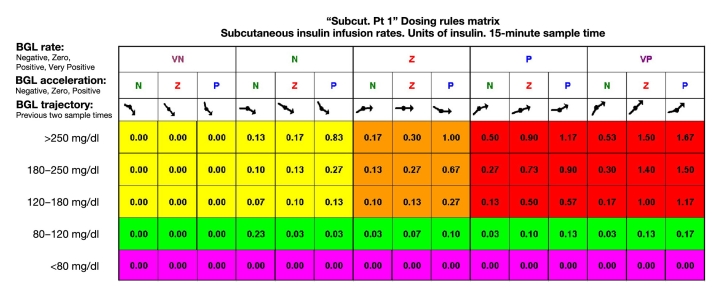
The dosing matrix (Figure 4) was developed in 2003 by Richard Mauseth in collaboration with other U.S. northwest endocrinologists. It was developed independently from any glycemic simulator.
Figure 4.
Five-minute dosing matrix. BGL, blood glucose level; VN, very negative; N, negative; Z, zero; P, positive; VP, very positive.
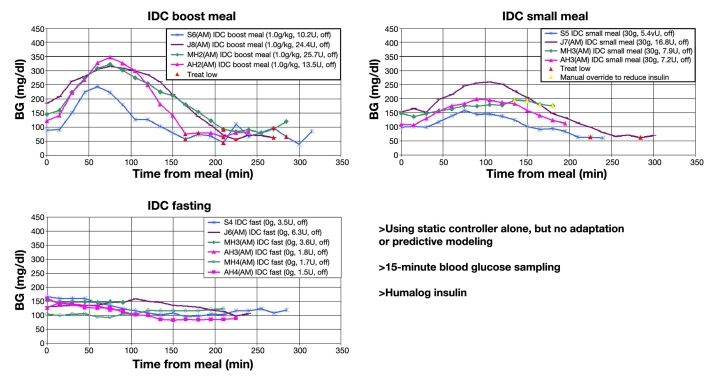
This initial controller was tested in a small clinical trial using four human subjects and produced good results for fasting and small meals. However, for large meals, the majority of the subjects had late postprandial hypoglycemia (see Figure 5).
Figure 5.
Results of four subject clinical trials using initial FLC.
We recognize that one of the shortcomings of the initial FLC was that its dosing matrix did not take into account insulin on board, the cumulative effects of past insulin doses. The original controller also provided minimal personalization, or tuning, for a particular patient. Further improvement of the controller has been made to prevent hypoglycemia following a large meal.
Improved Fuzzy Logic Controller Artificial Pancreas
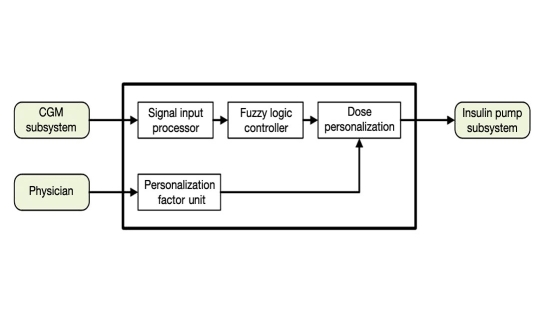
Collaboration with researchers at the University of California, Santa Barbara, and Sansum Diabetes Research Institute resulted in important improvements to the FLC, the first being the addition of the personalization factor (PF).10,11
The FLC AP v2 top-level design is shown in Figure 6. It provides for individually tailored dosing through the use of a PF. The PF is a scaling factor that is applied to the dose produced by the FL dosing matrix. Each subject’s PF is proportional to his/her total daily dose (TDD), as shown here:
Figure 6.
The system level diagram for the FLC AP controller. CGM, continuous glucose monitor.
| (1) |
where i denotes the subject index and TDD∗ is a defined standard TDD. In this study, five values for TDD∗ were compared, e.g., 30, 37.5, 45, 52.5, and 60 U/day. For convenience, PFj(i)—j = 1, ..., 5—is the PF for subject i under jth TDD∗. Clearly, the first group, PF1(×), is the most aggressive, and the fifth group, PF5(×), is the least aggressive.
As of the publication of this article, the FLC AP controller now employs an insulin governor9 that further prevents postmeal hypoglycemia.
Physician Utilization of Controller
The FLC AP allows for physician input to the dosing matrix. It also allows easy physician tuning of the dosing through the use of the PF. This article is meant to illustrate the potential use of a PF with this controller.
Results and Discussion
The proposed method was derived using 30 in silico subjects (10 adults, 10 adolescents, and 10 children) from U.S. Food and Drug Administration-accepted University of Virginia (UVa)/Padova metabolic simulator.12 Several situations were studied—a standard day, fasting, and evaluation of the effects of various meal sizes—using the five PF levels. The standard day consists of three meals: 45 g carbohydrate breakfast, 70 g carbo‑hydrate lunch, and 80 g carbohydrate dinner for all three age groups. The fasting was for 24 h, and the various meal sizes were 40, 80, 120, 160, and 200 g carbohydrate meals.
In silico testing was chosen to attempt to mimic situations that a clinician might encounter in dealing with a patient’s medical management. The physician then weighs the pros of improved glycemic control versus the cons of the possibility of adverse events. For future studies, the 300 in silico subjects for the UVa/Padova metabolic simulator may assist in the defining of the various risk/benefit analyses. The in silico testing is only meant to give a physician a starting point for different patients. A low blood glucose index (LBGI) of >5.0 is generally considered as unacceptable, while an LBGI of <2.5 would mean a hypoglycemic event would be rare. A high blood glucose index (HBGI) of >5.0 is generally considered undesirable, and <2.5 is ideal. The in silico testing results allow the physician to illustrate to the patient various aspects of their own care as a teaching and decision-making tool. Each patient will then make his or her own modifications as instructed and restricted by the physician.
Physicians treating diabetes patients tailor the insulin dosing to the patient. Goals are different for each patient. Each individual has different responses to therapy and levels of compliance as well as a unique lifestyle and eating habits. Each persons daily schedule is different and may not be consistent from one day to the next. The fear of hypoglycemia and inability to detect and treat hypoglycemia limits the physician’s aggressiveness of treatment. The PF allows the physician to customize the aggressiveness of a controller to best fit a patient’s needs. A set PF for a patient would be used most days, but the ability to change the PF could be easily utilized on special occasions, much like changing a temporary basal rate on an insulin pump.
In silico testing could give a starting point but will need to be adjusted for every patient. Several weeks after initiating the controller, the physician would meet with the patient and review their records of activity and food intake and downloads from their pump/sensor. Using their own data, and referring to the in silico data, problems could be solved. Periods of different insulin sensitivity from exercise, illness, or menses may be accommodated with temporary changes in the PF.
This paper is not meant to show specific patient outcomes but is more of an approach to individualizing a controller for a patient. Several examples of how a physician might go through the decision-making process on imaginary patients are given here. Basically, the sequence is to lower the average BG until LBGI becomes higher than desired for that specific patient, which may vary from patient to patient.
The basic process for the physician is as follows:
Using the standard day chart, establish desired control for the patient.
Select the appropriate PF using the standard day bar chart.
Evaluate the risk of hypoglycemia due to missed meals and for sleeping in using the fasting day chart.
Evaluate the consequences of varied meals using the varied meal sizes charts.
Example 1 is a 35-year-old male who is hypoglycemia aware, desires tight control, tolerates hypoglycemic episodes well, and has a very routine schedule of a desk job, with daily exercise at noon. His weekends also follow a similar routine. He never eats more than 80 g carbohydrate at a meal.
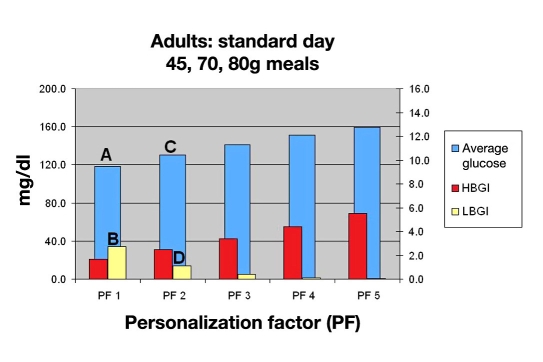
With this patient, the physician would review Figure 7 and evaluate the degree of glycemic control desired versus the risk of hypoglycemia. They evaluate their goals looking at a PF of 1, which results in an average BG of 120 mg/dl (A), which equates to a hemoglobin A1c (HbA1c) of 6.2%. They would then consider the LBGI13 of 3.0 (B) and determine that the risk was too high. They instead select a PF of 2, with an average glucose of 130 mg/dl (C) equating to a HbA1c of 6.4% and a LBGI of 1.5 (D) for the standard day.
Figure 7.
Mean BG, LBGI, and HBGI for 30 in silico adult subjects for standard day.
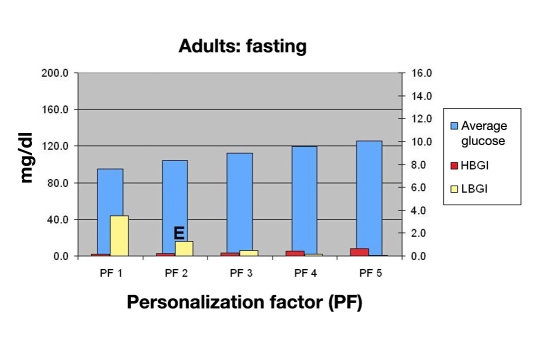
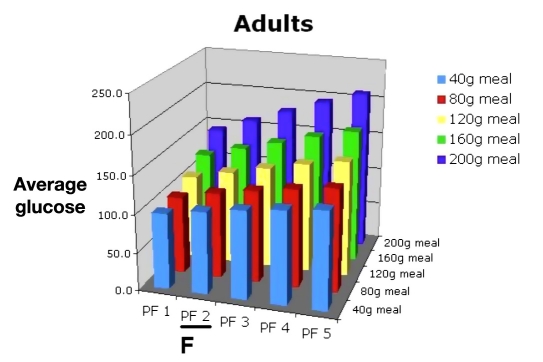
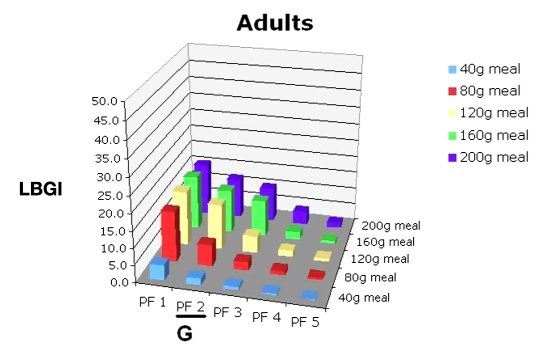
The physician would then use Figure 8 for evaluating the risk of hypoglycemia due to missing meals for this PF (E). The physician would then consult Figures 9 and 10 and discuss the potential consequences of varied meal sizes at PF 2. Using Figures 9 and 10, they examine the effects of controlling meal sizes (F) and hypoglycemia risk (G), noting the increased risk of hypoglycemia is higher with the 80 g meal.
Figure 8.
Mean BG, LBGI, and HBGI for 30 in silico adult subjects in fasting period.
Figure 9.
Mean BG for 30 in silico adult subjects, PF 1–5, range of meal sizes.
Figure 10.
LBGI for 30 in silico adult subjects, PF 1–5, range of meal sizes.
If the patient was having something irregular such as Thanksgiving dinner with a different meal size or was doing a triathlon, he might adjust the PF temporarily for only that event.
Example 2 is a six-year-old female, hypoglycemia unaware, who attends school five days per week with no school nurse. She has had one hypoglycemic seizure, and her parents are very fearful of future episodes. The patient’s eating schedule is very erratic. She has basketball and dance class on the same day, three days per week, but the times of day vary.
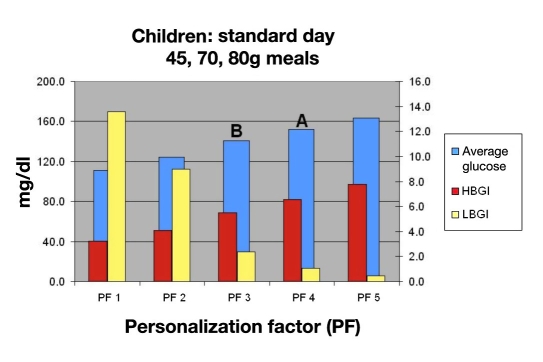
Using this information, the physician would review Figure 11 and discuss with her parents the degree of control desired. They consider a PF of 4 based on this chart, giving them an average BG of 155 mg/dl (A), which equates to a HbA1c of 7.1% and an LBGI that is 0.9, which is very acceptable. A PF of 3 (B) would lower the average BG of 145 equating to an HbA1c of 6.9%, but the LBGI would increase to 2.5, which is almost three times that of a PF of 4, which is considered unacceptable.
Figure 11.
Mean BG, LBGI, and HBGI for 30 in silico child subjects for standard day.
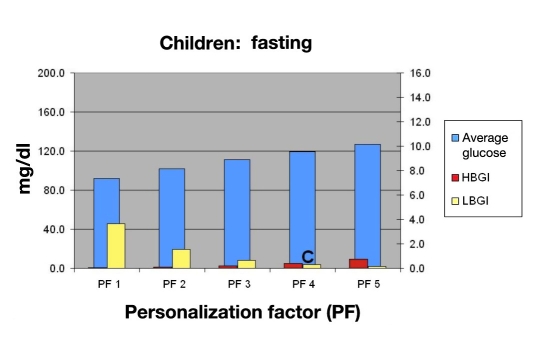
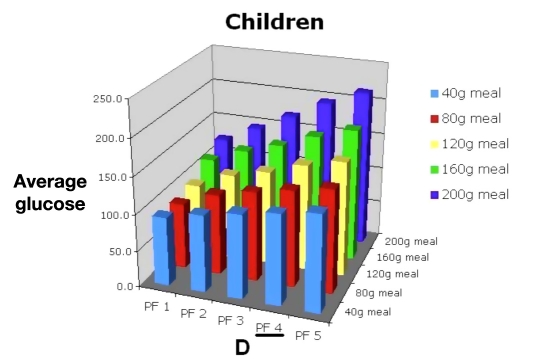
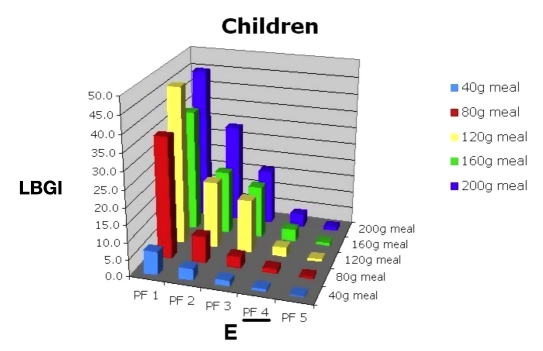
Then they would consult Figure 12 and determine the hypoglycemic risk of allowing the child to sleep in when using PF 4 (C). They would also review Figures 13 and 14 to evaluate the consequences of large meals on BG (D) and risk of hypoglycemia (E). The benefits of a more controlled carbohydrate intake could also be demonstrated.
Figure 12.
Mean BG, LBGI, and HBGI for 30 in silico child subjects in fasting period.
Figure 13.
Mean BG for 30 in silico child subjects, PF 1–5, range of meal sizes.
Figure 14.
Low blood glucose index for 30 in silico child subjects, PF 1–5, range of meal sizes.
Example 3 is a 14-year-old male with an HbA1c of 12% who is unwilling to follow any meal plan. He tests sporadically but is willing to test frequently enough to calibrate a continuous glucose monitor. The patient has absolute fear of hypoglycemia in front of his peers. He wakes up for school at 6:00 amon weekdays and sleeps until noon on weekends.
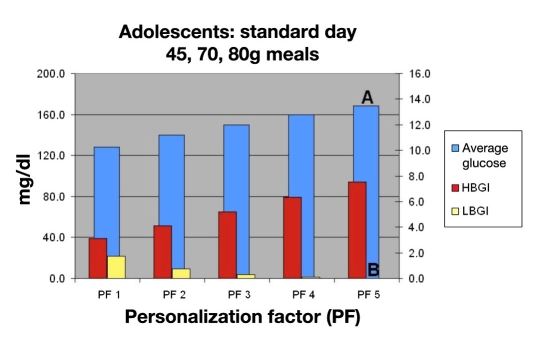
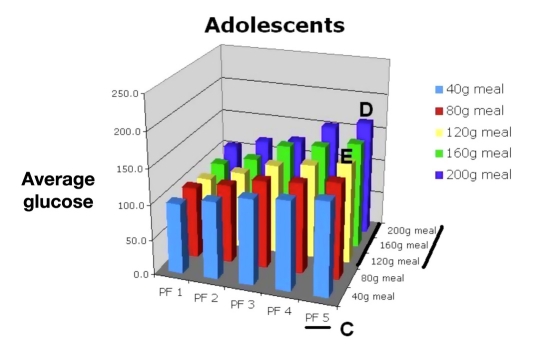
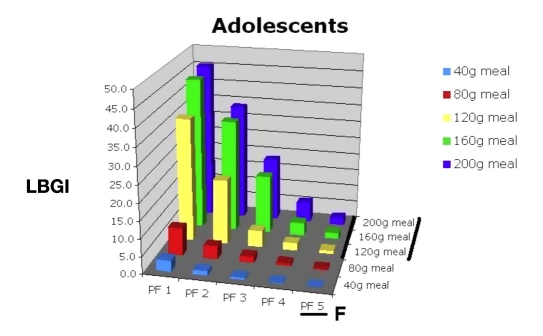
Using this information, the physician would consult Figures 15, 16, 17, and 18 to select the appropriate PF to improve this young man’s control while avoiding hypoglycemia. Figure 15 shows that a PF 5 (A), giving an average glucose of 165 mg/dl (HbA1c of 7.4%), was very acceptable. The LBGI would be almost zero (B), which would avoid almost all hypoglycemia. Evaluation of risks of hypoglycemia with varied meal sizes would be determined using Figures 17 and 18. The patient is then shown the benefit of decreasing carbohydrate intake versus the risk of hypoglycemia with extremely large meals [C, F (120 to 200 g)].
Figure 15.
Mean BG, LBGI, and HBGI for 30 in silico adolescent subjects for standard day.
Figure 16.
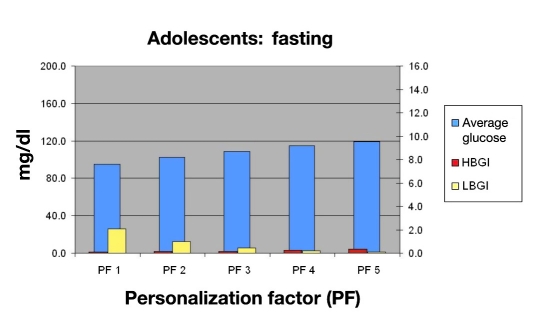
Mean BG, LBGI, and HBGI for 30 in silico adolescent subjects in fasting period.
Figure 17.
Mean BG for 30 in silico adolescent subjects, PF 1–5, range of meal sizes.
Figure 18.
Low blood glucose index for 30 in silico adolescent subjects, PF 1–5, range of meal sizes.
The patient sees that, if he can keep his carbohydrate intake less than 120 g per meal, a lower PF (e.g., PF 4/120 g meal; E) or even a PF 3 if meals are 80 g or less could be used without the increased risk of hypoglycemia as compared to a higher PF (PF 5/200 g meal) with larger meals (D). Even using the higher PF of 5, the change in average glucose would equate to a 4.6-point drop in HbA1c and lower his risks of complications by 93%.
Having the patient participate in the AP controller tuning decision making would hopefully increase their ownership, improve their understanding of their choices, and lessen their fears of hypoglycemia.
Conclusions
The use of a FLC AP system with the use of a PF allows a great deal of flexibility and input from the physician. The use of the in silico simulation results aids in patient instruction and initial decision making. We hope this method will decrease fears of hypoglycemia, improve quality of life, improve overall diabetes control, and lessen the burden of diabetes on the individual.
Abbreviations
- AP
artificial pancreas
- BG
blood glucose
- FL
fuzzy logic
- FLC
fuzzy logic controller
- HbA1c
hemoglobin A1c
- HBGI
high blood glucose index
- LBGI
low blood glucose index
- PF
personalization factor
- TDD
total daily dose
- UVa
University of Virginia
References
- 1.Diabetes Control and Complications Trial Research Group The effect of intensive treatment of diabetes on the development and progression of long-term complications in insulin-dependent diabetes mellitus. New Engl J Med. 1993;329(14):977–86. doi: 10.1056/NEJM199309303291401. [DOI] [PubMed] [Google Scholar]
- 2.Juvenile Diabetes Research Foundation Artificial Pancreas Project http://www.jdrf.org/index.cfm?page_id=104576. [DOI] [PMC free article] [PubMed]
- 3.Zadeh LA. Fuzzy sets. Inform Control. 1965;8:338–353. [Google Scholar]
- 4.The MathWorks Fuzzy inference systems. http://www.mathworks.com/access/helpdesk/help/toolbox/fuzzy/fp351dup8.html.
- 5.Mamdani EH. Application of fuzzy algorithms for control of simple dynamic plant. Proc IEE. 1974;121(12):1585–1588. [Google Scholar]
- 6.Mitsuishi T, Sawada K, Shidama Y. Continuity of defuzzification and its application to fuzzy control. Int J Comput Intel. 2009;5(3):233–237. [Google Scholar]
- 7.Ellingsen C, Dassau E, Zisser H, Grosman B, Percival MW, Jovanoviĉ L, Doyle FJ., III Safety constraints in an artificial pancreatic beta cell: an implementation of model predictive control with insulin on board. J Diabetes Sci Technol. 2009;3(3):536–544. doi: 10.1177/193229680900300319. [DOI] [PMC free article] [PubMed] [Google Scholar]
- 8.Dassau E, Zisser H, Percival MW, Grosman B, Jovanovič L, Doyle FJ., III Clinical results of automated artificial pancreatic β-cell system with unannounced meal using multi-parametric MPC and insulin-on-board. To be presented at the 70th American Diabetes Association Meeting; Orlando, FL. 2010. [Google Scholar]
- 9.Kircher R, Wang Y, Mauseth R, Matheson D, Dassau E, Zisser H, Jovanoviĉ L, Doyle FJ., III In silico evaluation of fuzzy logic controller for artificial pancreatic β-cell. To be presented at the 70th American Diabetes Association Meeting; Orlando, FL. 2010. [Google Scholar]
- 10.Kircher R, Matheson D, Mauseth R. Fuzzy logic controller for insulin dosing. Presented at the Diabetes Technology Meeting; November 13–18, 2008; Bethesda, MD. [Google Scholar]
- 11.Wang YQ, Mauseth RS, Kircher RC, Matheson DP, Dassau E, Zisser H, Jovanovic L, Doyle FJ., III In silico evaluation of fuzzy logic controller for artificial pancreatic β-cell. Diabetes. 2009;58:A114. [Google Scholar]
- 12.Kovatchev BP, Breton M, Man CD, Cobelli C. In silico preclinical trials: a proof of concept in closed-loop control of type 1 diabetes. J Diabetes Sci Technol. 2009;3(1):44–55. doi: 10.1177/193229680900300106. [DOI] [PMC free article] [PubMed] [Google Scholar]
- 13.Kovatchev BP, Cox DJ, Gonder-Frederick LA, Clarke WL. Symmetrization of the blood glucose measurement scale and its applications. Diabetes Care. 1997;20:1655–1658. doi: 10.2337/diacare.20.11.1655. [DOI] [PubMed] [Google Scholar]


