Abstract
Understanding how engineered tissue scaffold architecture affects cell morphology, metabolism, phenotypic expression, as well as predicting material mechanical behavior have recently received increased attention. In the present study, an image-based analysis approach that provides an automated tool to characterize engineered tissue fiber network topology is presented. Micro-architectural features that fully defined fiber network topology were detected and quantified, which include fiber orientation, connectivity, intersection spatial density, and diameter. Algorithm performance was tested using scanning electron microscopy (SEM) images of electrospun poly(ester urethane)urea (ES-PEUU) scaffolds. SEM images of rabbit mesenchymal stem cell (MSC) seeded collagen gel scaffolds and decellularized rat carotid arteries were also analyzed to further evaluate the ability of the algorithm to capture fiber network morphology regardless of scaffold type and the evaluated size scale. The image analysis procedure was validated qualitatively and quantitatively, comparing fiber network topology manually detected by human operators (n=5) with that automatically detected by the algorithm. Correlation values between manual detected and algorithm detected results for the fiber angle distribution and for the fiber connectivity distribution were 0.86 and 0.93 respectively. Algorithm detected fiber intersections and fiber diameter values were comparable (within the mean ± standard deviation) with those detected by human operators. This automated approach identifies and quantifies fiber network morphology as demonstrated for three relevant scaffold types and provides a means to: (1) guarantee objectivity, (2) significantly reduce analysis time, and (3) potentiate broader analysis of scaffold architecture effects on cell behavior and tissue development both in vitro and in vivo.
INTRODUCTION
Investigating how scaffold architecture affects cell morphology [1-3], predicts mechanical behaviors [4-13], and serves as a basis for improved fabrication and design strategies [14-16], have all become crucial goals in the development of engineered tissue scaffolds. A mechanistic understanding of the connection between fabrication methods, microarchitecture, and micro- and macro-mechanical behavior could lead to a generation of better performing tissue engineered constructs [17]. Objective and automated extraction of fiber architectural features such as diameter, intersections, network connectivity, and orientation distribution provide the ability to assess the influence of specific manufacturing parameters on the material geometry and to correlate scaffold structural parameters with cell morphology, metabolism and phenotypic expression [1-3]. Similarly, structural based approaches that are either statistical [18-20] or deterministic [4-12] need to be supplied with accurate descriptions of the fibrous scaffold architecture. The benefit of comparing microstructure with mechanical properties of healthy and pathological tissues using objective and automatic algorithms in place of manual procedures has been extensively demonstrated [21-22].
Current imaging techniques aiming to quantify fiber architecture of native and engineered tissues include light scattering [20, 23], scanning electron, and multi-photon microscopy and optical coherence tomography [24]. In order to process this information different image analysis paradigms such as Hough transforms, intensity gradient based texture analysis algorithms [18, 22, 25], direct tracking methods [26-28], and fast Fourier transform (FFT) based image analysis [29-31] have been successfully implemented. However, regardless of the imaging technique adopted as a data source, the totality of the mentioned image analysis methodologies share the limit of not offering a complete description of the fiber network topology. Fiber intersections and fiber connectivity, both relevant parameters for scaffold mechanical modeling [4-12] and structural characterization, are not quantified by currently available techniques. In addition, objectivity and speed of analysis are important characteristics associated with an automated algorithm that are difficult or impossible to achieve with human operator-based analysis.
In the present study an image-based analysis approach that provides an automatic tool to characterize engineered tissue fiber network topology was developed. A complete set of fiber network descriptors were collected from standard SEM images including: fiber angle distribution, connectivity, intersection spatial density, and diameter. In order to demonstrate the potential of this approach a synthetic polymer system was initially evaluated: electrospun poly(ester urethane)urea (ES-PEUU) scaffolds. Electrospun scaffolds were chosen for their recognized capability to recapitulate native soft tissue mechanical behavior [18, 32-33]. In addition, analyses on rabbit mesenchymal stem cell (MSC) seeded collagen gel scaffolds and decellularized rat carotid arteries provided further evidence of the applicability and flexibility of the presented methodology.
METHODS
Material fabrication and imaging
Detailed descriptions of the polymer synthesis, scaffold fabrication and imaging have been previously presented [18, 34-36]. Briefly, ES-PEUU scaffolds were fabricated and imaged using the procedure described previously by Courtney et al. [18]. Briefly, PEUU was synthesized from polycaprolactone diol and 1,4-diisocyanatobutane with subsequent chain extension by putrescine. Scaffolds were fabricated by dissolving PEUU in hexafluoroisopropanol at 12% (w/v) followed by electrospinning onto a cylindrical stainless steel mandrel with a diameter of 11.43 cm (solution flow 1.0 mL/h, ΔV 19kV, injector-target distance 13 cm) using three different mandrel tangential velocity velocities: 1.5, 4.5, 9.0 m/s. Next, (10-mm × 10 mm) ES-PEUU specimens were excised from intact ES-PEUU sheets with the known circumferential axis of the collection mandrel parallel to the y-axis of the device. For imaging, each ES-PEUU specimen was sputter coated with Pd/Au and imaged (grayscale, 8-bit) using a standard SEM (JEOL JSM6330F). The specimens were imaged at 3500x and 2500x magnification for the 1.5, 4.5 and 9.0 m/s scaffolds respectively. Nine images were selected from random locations of each sample. Rabbit MSC seeded collagen gel scaffolds were produced adopting a protocol described in [37] and the same imaging protocol was used for these scaffolds. Decellularized rat carotid artery SEM images were provided by Liao et al. [38].
Image analysis algorithm and image pre-processing
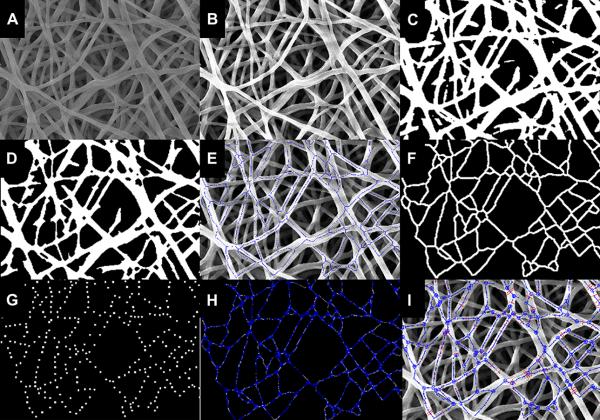
A custom image analysis algorithm was developed with MATLAB (The MathWorks, Natick, MA). Image histogram equalization followed by 3 by 3 median filtering was operated on the starting image (Fig. 1-a) to increase the contrast, reduce noise and preserve structure edges (Fig. 1-b) [39-40]. Local thresholding was performed to separate the outer fiber network from the background [28, 40-41]. The original image was divided into sub-images each with image length equal to 10 times the representative fiber diameter (RFD), which was manually identified by the operator selecting the fiber diameter borders on the original SEM image. The local thresholding approach overcame local intensity unevenness of the SEM images, which can compromise the quality of global thresholding segmentation. Approximate RFD detection was required to identify the characteristic scale length of the system and to conduct the original image subdivision. Grey level unevenness in the SEM images involved areas bigger than the sub-image size identified with the described procedure. The selection of appropriate thresholds for each sub-image was automatically determined using the Otsu method [42]. The latter assumes that the image is composed of two classes of pixels (e.g. foreground and background) then calculates the optimal thresholding value to divide those two classes so that their combined intra-class variance is minimal (Fig. 1-c) [40-42].
Figure 1.
A) Starting SEM image. B) Image histogram equalization followed by 3 by 3 median filtering. C) Local thresholding through Otsu method. D) Thinning, smoothing and removal of isolated pixel areas through a cascade of different morphological operators. E) Skeletonization. F-G) binary filters for Delaunay network refinement. H) Modified Delaunay network associated to the real fiber network. I) Final network and fiber diameters detected.
Image analysis algorithm and fiber network detection
Thinning, smoothing, and removal of isolated pixel areas not associated with scaffold fibers was performed on the thresholded image using the MATLAB function (MF) bwmorph (thin, majority, clean). A sequence of morphological operations consisting of erosion (through MFs imerode, disk element, size RFD/6), elimination of pixel areas smaller than 200xRFD (MF function bwareopen ), dilation (MF imdilate, disk element, size RFD/3), and an additional erosion (MF imerode disk element, size 1/6xRFD) operation served to refine the image, highlighting fiber edges and eliminating isolated pixel areas [40]. The sizes of the eroding/dilating elements (erode 1/6 RFD, dilate 1/3xRFD, erode 1/6xRFD) were chosen in order to not alter the size of the fibers (Fig. 1-d). The described morphological procedures were performed to improve the precision of the skeletonization (MFs bwmorph, skel) [43], which is the final step carried out to identify the main direction and shape of the fibers [28, 41, 44-46]. This cascade of image processing steps (Fig.1-a-f) produced two final outcomes: (1) a binary image of the skeletonized fiber network where every fiber has a thickness of one pixel (Fig. 1-e), (2) a binary filter (Fig. 1-f) obtained from a further operation of dilating (MF imdilate disk element, size 1/4xRFD) on the skeletonized fiber network.
In the next processing step, fiber intersections were detected within the skeletonized fiber network. For each pixel in the skeletonized image the pixel values within a circular corona (dmax 10 pixels, dmin 6 pixels) centered on a given pixel were collected at angle steps of 10°. Grey intensity values were radially summed and plotted vs. angle. The number of peaks in the polar plot corresponded to the number of fibers intersecting in proximity to the analyzed pixel. Pixels reporting more than 2 peaks were considered to belong to zones of fiber intersections. A new binary image composed of the totality of pixels associated with zones of fiber intersections was generated. Isolated pixels not representing fiber intersection zones were removed from the new image using MF bwmorph, clean, and bwareopen. Similarly, to merge fiber intersection areas that were in close proximity to each other, a further dilation was performed using MF imdilate disk element, size 2/5xRFD. The center of mass of the detected intersection areas was identified as the actual fibers intersections. An additional set of helping points (HP) were automatically detected using the Boolean intersection of two binary images: (1) the fiber network skeletonization and (2) a regular grid (grid step 3/2xRFD). Delaunay triangulation was utilized (MF delanuay) using the fiber intersections and the HPs as data points. Note that HPs are not considered as fiber intersections, they have been adopted as extra points in the Delaunay triangulation to enhance the algorithm capacity in capturing fibers shapes. An additional binary filter (Fig. 1-g) was created assigning a value of 1 to pixels within a circle of radius RFD centered in all fiber intersections and HPs. The Delanuay triangulation was consequently modified using the two binary filters described. All segments in the Delanuay network were subjected to the following condition: if the segment connecting two points (either fiber intersections or HPs) had 80% of its points within the first filter (Fig. 1-f) and if the connecting segment did not hit more than 2 non zeros circles in the second filter (Fig. 1-g), the segment was considered a fiber segment otherwise it was deleted from the Delaunay network. The two described conditions reduced the over-connection of the Delaunay network preserving only the fiber segments that corresponded to real fibers (Fig. 1-h).
Image analysis algorithm, fiber diameter detection
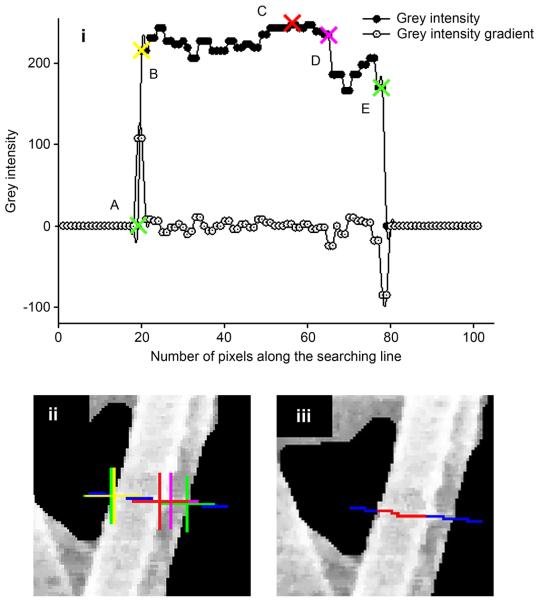
Fiber diameter was evaluated for each network segment along a direction perpendicular to the segment direction in correspondence with three points: the intermediate point, plus two additional points shifted of ± 5 pixels along the segment direction. In order to find the diameter edges, grey intensity levels of pixels were collected in an array along the described directions. A representative maximum fiber diameter was manually detected by the operator to limit the length of the analyzed segments along the direction perpendicular to the fiber. The positions of five points were identified from the detected grey levels array corresponding to: the maximum of grayscale gradient (Fig. 2, point A), the maximum of the sum of the grayscale array and its gradient (Fig. 2 point A), the maximum grayscale value (Fig. 2, point C), the minimum of the sum of the grayscale array and its gradient (Fig. 2 point D), and the minimum of the grayscale gradient (Fig. 2 point E). Points (A, E) corresponded to the edges of the fiber. The points (B, D) either coincided with point (A, E) in a single fiber or corresponded to the first/second edge of the most external fiber inside a fiber bundle. Point (C) represented the brightest point within the analyzed searching line. These positions were used to automatically select fibers where the diameter detection can be conducted without ambiguity and to identify a single fiber diameter within a fiber bundle. This condition was verified when points A-E stayed in the described order. Only the fibers respecting this condition were considered to determine the fiber diameter distribution. The maximum length value among the detected segments A-B, B-C, C-D, D-E was considered to be the fiber diameter.
Figure 2.
Fiber diameter detection. Five points are detected from detected grey levels and its gradient (i) along the searching line (blue segment in (ii)): Point A (ii) maximum of the grey levels array gradient. Point B (ii) maximum of the sum of the grey levels array and its gradient. Point C (ii) the maximum grey levels value. Point D (ii) minimum of the sum of the grey levels array and its gradient. Point E (ii) minimum of the grey levels array gradient. Searching line ((ii)-(iii) blue segment) and detected diameter ((iii) red segment).
Image analysis algorithm, extraction of architectural descriptors
To summarize, the described algorithm extracts the following data from the generated network (Fig. 1-i):
(1) the number, spatial position, and density of the fiber intersections, defined as two or more overlaying fibers;
(2) the connectivity distribution, defined as the percentage of fiber intersections vs. number of fibers crossing a fiber intersection;
(3) fiber orientation angle distribution;
(4) fiber diameter distribution.
This data enables the scaffold fiber network to be uniquely and fully described. In addition, comparisons were made using the two most adopted fiber orientation indices: the average over all fiber segments of cos2(ϑ) (COS OI), where ϑ represents the angle between a fiber segment and the direction of supposed alignment) [5, 47] and the normalized angle (NOI) that contains one-half of the total area under fiber count-angle distribution, representing 50% of the total number of fibers (OI) [48-49]. NOI it is obtained from OI using the relation (Eq. 1):
| (Eq. 1) |
so that NOI ∈ [0,100%].
Example applications and validation
The image analysis software presented in this study was evaluated on the following fibrous structures:
ES-PEUU scaffolds that were fabricated at three mandrel tangential velocities (1.5, 4.5, 9.0 m/s) providing increasing levels of structural anisotropy [18, 50];
Rabbit MSC seeded collagen gel [37];
Decellularized rat carotid arteries [38].
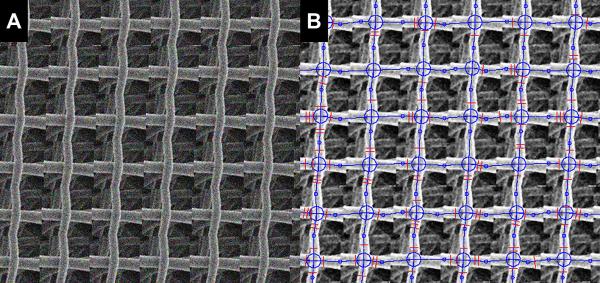
Algorithm performance was first tested using phantom images and actual sample images of ES-PEUU scaffolds [21]. Phantom images were obtained by merging together subsets of original SEM images and adding random noise (Fig. 3). In addition to the adoption of validation phantoms, scaffold architectural features were manually detected (n=5 individuals blinded from the others results).
Figure 3.
A) Phantom image obtained merging together subsets of original SEM images and adding random noise. B) Network and fiber diameters detected by the algorithm.
A custom made interactive procedure was developed for validation. Operators manually selected fiber intersections, HPs, and fiber diameters. Fiber segments were automatically generated with their orientation dictated by the fiber intersections and HP positions. The automated algorithm results and manually generated results were qualitatively and quantitatively compared. A coefficient of determination (R2 value) was calculated for fiber angle and fiber connectivity distribution. Comparison of the manually detected and algorithm detected results were presented as mean ± standard deviation. The combination of the full set of variables: (1) density of the fibers intersections, (2) connectivity distribution, (3) fiber orientation angle distribution, and (4) fiber diameter distribution gives an unambiguous representation of a straight fiber network. For this reason, the validation study was conducted over the full set of architectural descriptors.
RESULTS
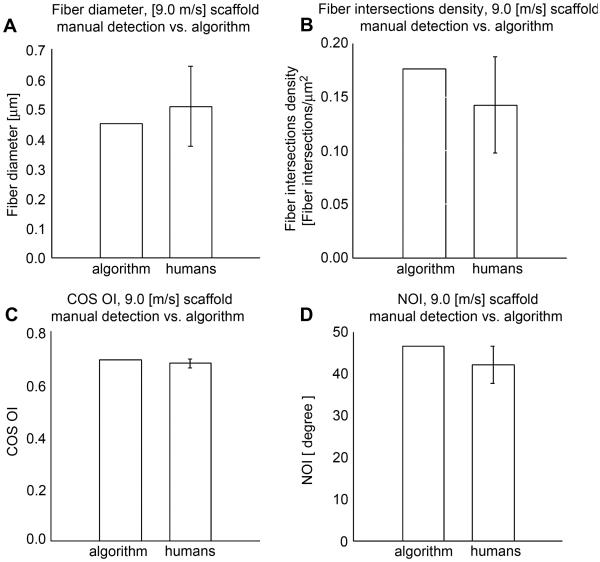
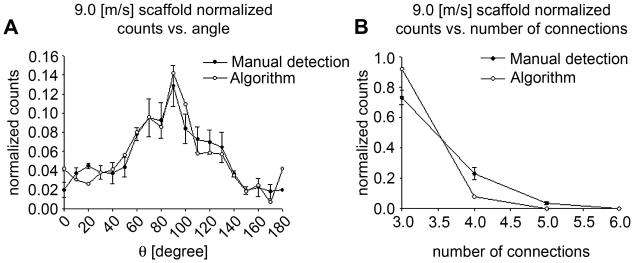
The analyses of phantom images using the presented algorithm demonstrated that fiber orientation, intersections, connectivity and diameter in the image were correctly evaluated (Fig. 3). In addition to the use of phantom images, our custom software was validated using ES-PEUU scaffold SEM images (2 images were randomly selected from the 1.5 m/s and the 9.0 m/s processed groups). The validation results demonstrated that manual and automated methods were comparable (Fig. 4-6). Coefficient of variation for the 9.0 m/s scaffold fiber angle distribution and for the connectivity distribution (Fig. 5-a-b) was 0.86 and 0.93 respectively.
Figure 4.
Fiber network and diameters detected by the algorithm, A) 1.5 m/s scaffold, B) 9.0 m/s scaffold. Fiber network and diameters manually detected, C) 1.5 m/s scaffold, D) 9.0 m/s scaffold.
Figure 6.
9.0 Manual detection vs. algorithm measurements comparison for the 9.0 [m/s] scaffold. A) Fiber diameter measurements comparison. B) Fiber intersections density measurements comparison, C) COS OI measurements comparison, D) NOI measurements comparison.
Figure 5.
A) Fiber angle distribution measurements comparison 9.0 [m/s] scaffold. B) Fiber connectivity measurements comparison 9.0 [m/s] scaffold.
Application for ES-PEUU scaffolds
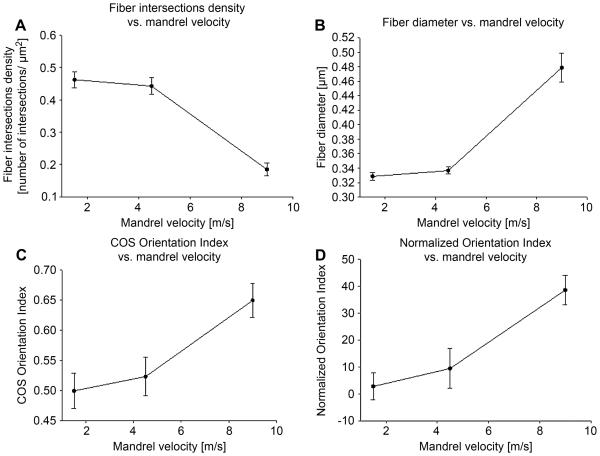
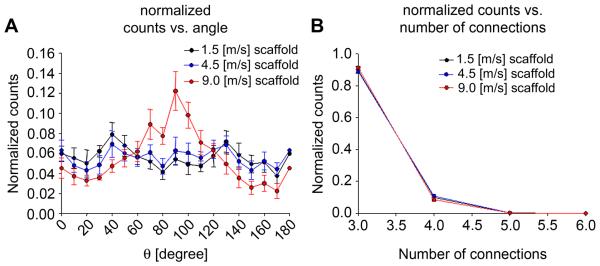
Nine randomly chosen images were selected for each of the three scaffold groups. The number of fiber intersections decreased as the mandrel velocity was raised, showing consistency with the known relationship between the mandrel velocity and the fiber alignment (Fig. 8-a) [18, 29-30]. Connectivity distribution was not affected by the mandrel velocity (Fig. 7-b). COS OI and fiber alignment along the circumferential direction increased as the mandrel velocity was raised (Fig. 8-c, Fig. 7-a). Consistent with the COS OI trend, the NOI decreased as the mandrel velocity was raised (Fig. 8-c-d). The fiber diameter followed a similar trend (Fig.8-b).
Figure 8.
A) Fiber intersections density vs. mandrel velocity. B) diameter vs. mandrel velocity. C) COS OI 1 vs. mandrel velocity. D) NOI vs. mandrel velocity.
Figure 7.
A) Fiber angle distribution for the 1.5, 4.5, 9.0 [m/s] scaffolds. B) Fiber connectivity distribution for the 1.5, 4.5, 9.0 [m/s] scaffolds.
Application to collagen gel and decellularized tissues
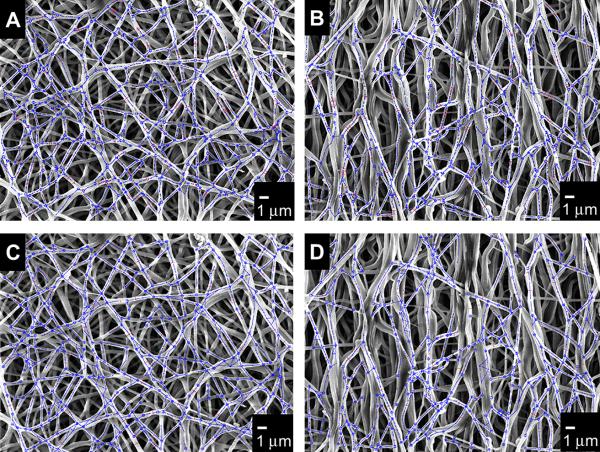
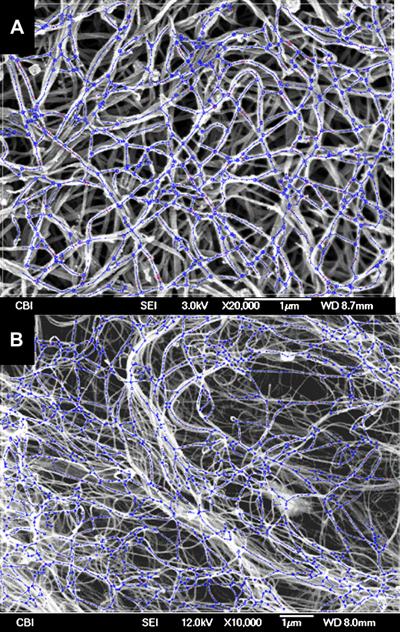
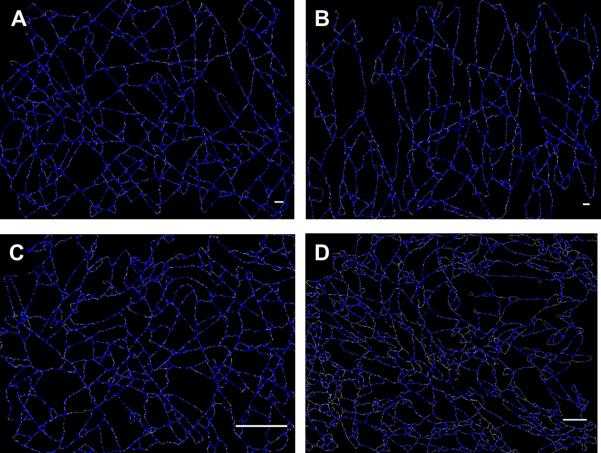
Algorithm accuracy in capturing the fiber network structure in rabbit MSC seeded collagen gel scaffolds and decellularized rat carotid arteries was demonstrated by the visual comparison between the actual fiber networks with the detected ones (Fig. 9-a-b). The presented methodology revealed key differences in network morphology between the different scaffolds typology. As expected, collagen gel and decellularized tissues showed a more tortuous fiber topology when compared with electrospun constructs (Fig. 10). The adopted collagen gel and decellularized tissues samples, both isotropic in nature, reported fiber orientation angle distribution characterized by COS OI values of 0.49 and 0.44 respectively. This result was consistent with the COS OI value found for the 1.5 m/s ES-PEUU scaffold which is a well characterized mechanically and structurally isotropic scaffold [18]. The density of the fiber intersections in the collagen gel and the decellularized tissue samples were 17.69 intersections/μm2 and 7.45 intersections/μm2 respectively, these values were greater than the correspondent values detected for the ES-PEEU scaffolds (Fig. 8-a). Differences in the determined average fiber diameter of decellularized tissue (0.045 μm), collagen gel (0.043 μm), and ES-PEUU scaffolds (0.328 - 0.479 μm, Fig.8-b) provided further evidence of the different characteristic length of the fibrous system(Fig. 10).
Figure 9.
A) Rabbit MSC seeded collagen gel analysis, detected fiber network and fiber diameters. B) Decellularized rat carotid arteries analysis, detected fiber network and fiber diameters.
Figure 10.
Detected fiber networks for A) PEUU 1.5 [m/s] scaffold, B) PEUU 9.0 [m/s] scaffold, C) Rabbit MSC seeded collagen gel, D) Decellularized rat carotid arteries.
DISCUSSION
Presented methodology
A methodology was presented to characterize the complete fiber network topology of planar fibrous scaffolds or tissues (both native and engineered). Validation results illustrated the capability of the algorithm to accurately identify fiber network morphological parameters at a level similar to that of human operators (Fig. 4). Detected fiber diameter, fiber intersections density and orientation index values matched well (Fig. 6-a, b, c, d) with human operators. Fiber connectivity distribution and fiber angle distribution coefficients of variation for the 9.0 m/s electrospun, scaffold were 0.86 and 0.93 respectively. As expected a higher degree of fiber alignment produced a smaller number of fiber intersections (Fig. 8-a). The two different orientation indices showed consistency with the known fiber alignment - mandrel velocity relationship (Fig. 8-c-d). Specifically, higher values of mandrel velocity produced fiber angle distributions more aligned along the mandrel circumferential axis (90°, Fig. 4, Fig. 7-a) and increasing fiber diameter values (Fig.8-b). All of the described measurements required less than 180 seconds per image and a minimal user interaction. In contrast, the manual detection procedure was subjective and involved up to 2 hours per image. The algorithm capability to fully capture fiber network morphology regardless of the scaffold type (Fig. 9-a-b) and structure scale (Fig. 10) was shown for electrospun constructs, gels, and decellularized tissues.
Previous methodologies
Several imaging techniques have been previously adopted to collect scaffolds and native tissue micro structural data. Small angle light scattering (SALS) [20, 23] can accurately measure fiber orientation up to a tissue thickness of 500 μm to an angle of ~ 1° and a spatial resolution of ± 254 μm. Multi-photon microscopy and optical coherence tomography are emerging, nondestructive, real- time techniques with great potential for tissue biology and tissue engineering [24]. The persisting caveat with these techniques is a lack of image resolution for micro-architecture quantification. Similarly, different image analysis methods have been developed to address the crucial issue of quantifying scaffolds and native tissue microstructure. Karlon and coauthors [22] used texture analysis algorithms based on the Hough transform [25] and intensity gradient techniques on histologic tissue sections from normal and transgenic mice. This approach was adopted [18] using scanning electron microscopy data of ES-PEUU scaffolds with different levels of fiber alignment imposed by varying the collecting mandrel tangential velocity. A different methodology based on direct tracking was successfully implemented and tested on simulated and real non-woven fabrics [26-28].
Ayres and coauthors were the first to introduce the use of the FFT to measure fiber alignment in electrospun constructs [29-31]. The method is applicable to SEM, light microscopy and confocal laser scanning microscopy. The latter imaging technique offers the clear benefit of capturing data from specific optical planes with depths of 30-40 μm in the z-direction normally achieved [31]. For example, this versatile approach was employed to assess the influence of a poly(glycerol sebacate) (PGS) scaffold microstructure on heart cell F-actin filament orientation from confocal micrographs taken at a depth of ~30 μm [51].
The summarized methodologies only quantify fiber angle distribution and do not offer a complete description of the tissue topology [21-31, 39-42, 45-46, 52]. In contrast, the relevance of fiber intersection and connectivity information for scaffold mechanical modeling has been extensively highlighted in [4-12]. Fiber diameter distribution is generally produced by subjective and time-consuming procedures where 50-100 fiber diameters are detected manually on SEM images [2-3]. Similarly, the importance of automatic and objective fiber diameter detection has been discussed [41, 45]. Although robust and easy to implement, the FTT based methods are limited by the lack of a physically meaningful relationship between the fiber alignment index and the actual fiber angle distribution. For this reason, these measurements are usually coupled with mechanical testing data [29-31].
Limitations
Reliance on SEM images, while offering high-resolution, provides limited 3D dimensional information. Employing alternative imaging techniques such as confocal or fluorescence microscopy could be adopted to investigate structural properties throughout the material thickness. Although adapting the implementation to this data source seems feasible, it should be noted that confocal microscopy based data do not provide sufficient resolution for fiber diameter determination. The representative area element (RAE) size has not been identified, however, the error produced by analyzing a portion of the sample smaller than the RAE can be quantified by the magnitude of the standard deviation. Similarly, a representative volume element (RVE) that is the three dimensional equivalent of the RAE can be defined as: a model of the material to be used to determine the corresponding effective properties for the homogenized macroscopic model. The RVE should be large enough to contain sufficient information about the microstructure in order to be representative, however it should be much smaller than the macroscopic body [53]. An analysis performed on an area size equivalent to the RAE produces a standard deviation of approximately zero, larger standard deviation values demonstrated that the analyzed area is smaller than the RAE for the specific material and variables studied [53-55]. The latter issue represents an additional limiting factor for the state of the art [21-31, 39-42, 45-46, 52].
Conclusions
The image analysis algorithm developed and validated in this study overcomes the state of the art limits in: (1) extracting physically meaningful topological information, (2) providing additional levels of detail to describe fibrous networks, and (3) circumventing reliance on human operators enabling objective, automated measurements. Critical information relevant to biomechanical modeling, scaffold fabrication optimization and the study of native/engineered construct architecture-cell interaction is provided. Fiber diameter, fiber intersection density, fiber angle distribution and connectivity all play a fundamental role in the macro - meso mechanical behavior and in the fiber network - cell interactions. Mechanical response prediction strongly relies on the capability of the model to reproduce the real material characteristics and topology. The algorithm capability to automatically identify and quantify the complete fiber network morphology regardless of the scaffold topology and of the structural scale of the system was proven by analyzing three different types of scaffolds. The presented validation showed strong consistency between the human operators and the algorithm analysis results. Moreover, the automatic procedure guarantees objectivity and a significant reduction in analysis time. This work represents an attempt to fully characterized fiber network topology, to detect fiber intersections and to quantify fiber connectivity in native and engineered tissue constructs. This method to study engineered construct morphology extends well beyond the analysis contained herein, potentially enabling the investigation of scaffold architecture effects on cell populations and resulting aspects of tissue growth and remodeling in vitro and in vivo.
ACKNOWLEDGEMENTS
This work was supported by NIH R01 HL-068816 and NIH/NHLBI R01 HL089750. The authors would like to acknowledge Ms. Kirsten Kinneberg for providing the rabbit MSC seeded collagen gel sample, Dr. Jun Liao for providing the decellularized carotid arteries SEM images, and Mr. Jonathan Franks of the Center for Biological Imaging, University of Pittsburgh for contributing to the ES-PEUU SEM data set.
Footnotes
Publisher's Disclaimer: This is a PDF file of an unedited manuscript that has been accepted for publication. As a service to our customers we are providing this early version of the manuscript. The manuscript will undergo copyediting, typesetting, and review of the resulting proof before it is published in its final citable form. Please note that during the production process errors may be discovered which could affect the content, and all legal disclaimers that apply to the journal pertain.
SELECTED BIBLIOGRAPHY
- 1.Newton D, Mahajan R, Ayres C, Bowman JR, Bowlin GL, Simpson DG. Regulation of material properties in electrospun scaffolds: Role of cross-linking and fiber tertiary structure. Acta Biomater. 2009;5(1):518–529. doi: 10.1016/j.actbio.2008.06.016. [DOI] [PMC free article] [PubMed] [Google Scholar]
- 2.Bashur CA, Dahlgren LA, Goldstein AS. Effect of fiber diameter and orientation on fibroblast morphology and proliferation on electrospun poly(d,l-lactic-co-glycolic acid) meshes. Biomaterials. 2006;27(33):5681–5688. doi: 10.1016/j.biomaterials.2006.07.005. [DOI] [PubMed] [Google Scholar]
- 3.Baker SC, Atkin N, Gunning PA, Granville N, Wilson K, Wilson D, et al. Characterisation of electrospun polystyrene scaffolds for three-dimensional in vitro biological studies. Biomaterials. 2006;27(16):3136–3146. doi: 10.1016/j.biomaterials.2006.01.026. [DOI] [PubMed] [Google Scholar]
- 4.Chandran PL, Barocas VH. Deterministic material-based averaging theory model of collagen gel micromechanics. J Biomech Eng. 2007;129(2):137–147. doi: 10.1115/1.2472369. [DOI] [PubMed] [Google Scholar]
- 5.Agoram B, Barocas VH. Coupled macroscopic and microscopic scale modeling of fibrillar tissues and tissue equivalents. J Biomech Eng. 2001;123(4):362–369. doi: 10.1115/1.1385843. [DOI] [PubMed] [Google Scholar]
- 6.Stylianopoulos A, Bashur CA, Goldstein AS, Guelcher SA, Barocas VH. Computational predictions of the tensile properties of electrospun fibre meshes: effect of fibre diameter and fibre orientation. J Mech Behav Biomed Mater. 2008;1:326–335. doi: 10.1016/j.jmbbm.2008.01.003. [DOI] [PMC free article] [PubMed] [Google Scholar]
- 7.Stylianopoulos T, Barocas VH. Volume-averaging theory for the study of the mechanics of collagen networks. Comput Methods Appl Mech Engrg. 2007;196(31-32):2981–2990. [Google Scholar]
- 8.Stylianopoulos T, Barocas VH. Multiscale, structure-based modeling for the elastic mechanical behavior of arterial walls. J Biomech Eng. 2007;129(4):611–618. doi: 10.1115/1.2746387. [DOI] [PubMed] [Google Scholar]
- 9.Burd HJ. A structural constitutive model for the human lens capsule. Biomech Model Mechanobiol. 2008;8(3):217–231. doi: 10.1007/s10237-008-0130-5. [DOI] [PubMed] [Google Scholar]
- 10.Wang CW, Berhan L, Sastry AM. Structure, mechanics and failure of stochastic fibrous networks: part I—microscale considerations. J Eng Mater-T. 2000;122(4):450–459. [Google Scholar]
- 11.Wang CW, Sastry AM. Structure, mechanics and failure of stochastic fibrous networks : Part II-Network simulations and application. J Eng Mater-T. 2000;122(4):460–468. [Google Scholar]
- 12.Wua XF, Dzenisb Y. Elasticity of planar fiber networks. J Appl Phys. 2005;98:093501–9. [Google Scholar]
- 13.Breuls RG, Sengers BG, Oomens CW, Bouten CV, Baaijens FP. Predicting local cell deformations in engineered tissue constructs: a multilevel finite element approach. J Biomech Eng. 2002;124(2):198–207. doi: 10.1115/1.1449492. [DOI] [PubMed] [Google Scholar]
- 14.Barnes CP, Sell SA, Boland ED, Simpson DG, Bowlin GL. Nanofiber technology: designing the next generation of tissue engineering scaffolds. Adv Drug Deliv Rev. 2007;59(14):1413–1433. doi: 10.1016/j.addr.2007.04.022. [DOI] [PubMed] [Google Scholar]
- 15.Pham QP, Sharma U, Mikos AG. Electrospinning of polymeric nanofibers for tissue engineering applications: a review. Tissue Eng. 2006;12(5):1197–1211. doi: 10.1089/ten.2006.12.1197. [DOI] [PubMed] [Google Scholar]
- 16.Murugan R, Ramakrishna S. Design strategies of tissue engineering scaffolds with controlled fiber orientation. Tissue Eng. 2007;13(8):1845–1866. doi: 10.1089/ten.2006.0078. [DOI] [PubMed] [Google Scholar]
- 17.Mauck RL, Baker BM, Nerurkar NL, Burdick JA, Li W-J, Tuan RS, et al. Engineering on the straight and narrow: the mechanics of nanofibrous assemblies for fiber-reinforced tissue regeneration. Tissue Eng Part B Rev. 2009;15(2):171–193. doi: 10.1089/ten.teb.2008.0652. [DOI] [PMC free article] [PubMed] [Google Scholar]
- 18.Courtney T, Sacks MS, Stankus J, Guan J, Wagner WR. Design and analysis of tissue engineering scaffolds that mimic soft tissue mechanical anisotropy. Biomaterials. 2006;27(19):3631–3638. doi: 10.1016/j.biomaterials.2006.02.024. [DOI] [PubMed] [Google Scholar]
- 19.Engelmayr GC, Sacks MS. A structural model for the flexural mechanics of nonwoven tissue engineering scaffolds. J Biomech Eng. 2006;128:610–622. doi: 10.1115/1.2205371. [DOI] [PubMed] [Google Scholar]
- 20.Sacks MS. Incorporation of experimentally-derived fiber orientation into a structural constitutive model for planar collagenous tissues. J Biomech Eng. 2003;125(2):280–287. doi: 10.1115/1.1544508. [DOI] [PubMed] [Google Scholar]
- 21.Nagatomi J, Toosi KK, Grashow JS, Chancellor MB, Sacks MS. Quantification of bladder smooth muscle orientation in normal and spinal cord injured rats. Ann Biomed Eng. 2005;33(8):1078–1089. doi: 10.1007/s10439-005-5776-x. [DOI] [PubMed] [Google Scholar]
- 22.Karlon WJ, Covell JW, McCulloch AD, Hunter JJ, Omens JH. Automated measurement of myofiber disarray in transgenic mice with ventricular expression of ras. Anat Rec. 1998;252(4):612–625. doi: 10.1002/(SICI)1097-0185(199812)252:4<612::AID-AR12>3.0.CO;2-1. [DOI] [PubMed] [Google Scholar]
- 23.Sacks MS. Bowlin Gary L., Wnek G., editors. Small-angle light scattering methods for soft connective tissue structural analysis. Encyclopedia of Biomaterials and Biomedical Engineering: Informa Healthcare. 2004 [Google Scholar]
- 24.Tan W, Sendemir-Urkmez A, Fahrner LJ, Jamison R, Leckband D, Boppart SA. Structural and functional optical imaging of three-dimensional engineered tissue development. Tissue Eng. 2004;10(11-12):1747–1756. doi: 10.1089/ten.2004.10.1747. [DOI] [PubMed] [Google Scholar]
- 25.Chauduri BB, Pulak K, Nirupam S. Detection and gradation of oriented texture. Pattern Recogn Lett. 1993;14(2):147–153. [Google Scholar]
- 26.Pourdeyhimi B, Ramanathan R, Dent R. Measuring fiber orientation in nonwovens: part I: simulation. Text Res J. 1996;66(11):713–722. [Google Scholar]
- 27.Pourdeyhimi B, Ramanathan R, Dent R. Measuring fiber orientation in nonwovens: part II: direct tracking. Text Res J. 1996;66(12):747–753. [Google Scholar]
- 28.Pourdehyhimi B, Dent R, Jerbi A, Tanaka S, Deshpande A. Measuring Fiber Orientation in Nonwovens Part V: Real Webs. Text Res J. 1999;69(3):185–192. [Google Scholar]
- 29.Ayres C, Bowlin GL, Henderson SC, Taylor L, Shultz J, Alexander J, et al. Modulation of anisotropy in electrospun tissue-engineering scaffolds: analysis of fiber alignment by the fast Fourier transform. Biomaterials. 2006;27(32):5524–5534. doi: 10.1016/j.biomaterials.2006.06.014. [DOI] [PMC free article] [PubMed] [Google Scholar]
- 30.Ayres CE, Bowlin GL, Pizinger R, Taylor LT, Keen CA, Simpson DG. Incremental changes in anisotropy induce incremental changes in the material properties of electrospun scaffolds. Acta Biomater. 2007;3(5):651–661. doi: 10.1016/j.actbio.2007.02.010. [DOI] [PMC free article] [PubMed] [Google Scholar]
- 31.Ayres CE, Jha BS, Meredith H, Bowman JR, Bowlin GL, Henderson SC, et al. Measuring fiber alignment in electrospun scaffolds: a user's guide to the 2D fast Fourier transform approach. J Biomat Sci-Polym E. 2008;19(5):603–621. doi: 10.1163/156856208784089643. [DOI] [PubMed] [Google Scholar]
- 32.Stella JA, D'Amore A, Wagner WR, Sacks MS. On the biomechanical function of scaffolds for engineering load-bearing soft tissues. Acta Biomater. 2010 doi: 10.1016/j.actbio.2010.01.001. In Press. [DOI] [PMC free article] [PubMed] [Google Scholar]
- 33.Hashizume R, Fujimoto KL, Hong Y, Amoroso NJ, Tobita K, Miki T, et al. Morphological and mechanical characteristics of the reconstructed rat abdominal wall following use of a wet electrospun biodegradable polyurethane elastomer scaffold. Biomaterials. 2010;31(12):3253–3265. doi: 10.1016/j.biomaterials.2010.01.051. [DOI] [PMC free article] [PubMed] [Google Scholar]
- 34.Guan J, Fujimoto KL, Sacks MS, Wagner WR. Preparation and characterization of highly porous, biodegradable polyurethane scaffolds for soft tissue applications. Biomaterials. 2005;26(18):3961–3971. doi: 10.1016/j.biomaterials.2004.10.018. [DOI] [PMC free article] [PubMed] [Google Scholar]
- 35.Guan J, Sacks MS, Beckman EJ, Wagner WR. Synthesis, characterization, and cytocompatibility of elastomeric, biodegradable poly(ester-urethane)ureas based on poly(caprolactone) and putrescine. J Biomed Mater Res. 2002;61(3):493–503. doi: 10.1002/jbm.10204. [DOI] [PubMed] [Google Scholar]
- 36.Guan J, Sacks MS, Beckman EJ, Wagner WR. Biodegradable poly(ether ester urethane)urea elastomers based on poly(ether ester) triblock copolymers and putrescine: synthesis, characterization and cytocompatibility. Biomaterials. 2004;25(1):85–96. doi: 10.1016/s0142-9612(03)00476-9. [DOI] [PubMed] [Google Scholar]
- 37.Nirmalanandhan VS, Rao M, Sacks MS, Haridas B, Butler DL. Effect of length of the engineered tendon construct on its structure-function relationships in culture. J Biomech. 2007;40(11):2523–2529. doi: 10.1016/j.jbiomech.2006.11.016. [DOI] [PubMed] [Google Scholar]
- 38.Williams C, Liao J, Joyce EM, Wang B, Leach JB, Sacks MS, et al. Altered structural and mechanical properties in decellularized rabbit carotid arteries. Acta Biomater. 2009;5(4):993–1005. doi: 10.1016/j.actbio.2008.11.028. [DOI] [PMC free article] [PubMed] [Google Scholar]
- 39.Jones JR, Poologasundarampillai G, Atwood RC, Bernard D, Lee PD. Non-destructive quantitative 3D analysis for the optimisation of tissue scaffolds. Biomaterials. 2007;28(7):1404–1413. doi: 10.1016/j.biomaterials.2006.11.014. [DOI] [PubMed] [Google Scholar]
- 40.Gonzalez RC, Woods RE, Eddins SL. Digital image processing using MATLAB. 2nd Ed. Prentice Hall; Upper Saddle River, NewJersey: 2001. [Google Scholar]
- 41.Ziabari M, Mottaghitalab V, Haghi AK. Application of direct tracking method for measuring electrospun nanofiber diameter. Braz J Chem Eng. 2009;26(1):53–62. [Google Scholar]
- 42.Otsu N,A. Threshold selection method from gray-level histograms. IEEE T Syst Man Cyb. 1979;9(1):62–66. [Google Scholar]
- 43.Lam L, Lee S-W, Suen CY. Thinning methodologies- a comprehensive survey. IEEE Trans Pattern Anal Mach Intell. 1992;14(9):869–885. [Google Scholar]
- 44.Anthony PL, Arnold RG, Arroyo C, Baird K, Bega K, Biesiada J, et al. Observation of parity nonconservation in moller scattering. Phys Rev Lett. 2004;92(18):181602. doi: 10.1103/PhysRevLett.92.181602. [DOI] [PubMed] [Google Scholar]
- 45.Pourdeyhimi B, Dent R. Measuring fiber diameter distribution in nonwovens. Text Res J. 1999;69(4):233–236. [Google Scholar]
- 46.Bugao Xu, Ting Y-L. Measuring structural characteristics of fiber segments in nonwoven fabrics. Text Res J. 1995;65(1):41–48. [Google Scholar]
- 47.Sacks MS, Chuong CJ. Characterization of collagen fiber architecture in the canine central tendon. J Biomech Eng. 1992;114(2):183–190. doi: 10.1115/1.2891370. [DOI] [PubMed] [Google Scholar]
- 48.Sacks MS, Smith DB, Hiester ED. A small angle light scattering device for planar connective tissue microstructural analysis. Ann Biomed Eng. 1997;25(4):678–689. doi: 10.1007/BF02684845. [DOI] [PubMed] [Google Scholar]
- 49.Sacks MS, Chuong CJ, More R. Collagen fiber architecture of bovine pericardium. Asaio J. 1994;40(3):632–637. doi: 10.1097/00002480-199407000-00075. [DOI] [PubMed] [Google Scholar]
- 50.Stankus JJ, Guan J, Wagner WR. Fabrication of biodegradable elastomeric scaffolds with sub-micron morphologies. J Biomed Mater Res-A. 2004;70(4):603–614. doi: 10.1002/jbm.a.30122. [DOI] [PMC free article] [PubMed] [Google Scholar]
- 51.Engelmayr GC, Cheng M, Bettinger CJ, Borenstein JT, Langer R, Freed LE. Accordion-like honeycombs for tissue engineering of cardiac anisotropy. Nat Mater. 2008;7(12):1003–1010. doi: 10.1038/nmat2316. [DOI] [PMC free article] [PubMed] [Google Scholar]
- 52.Ji Y, Ghosh K, Shu XZ, Li B, Sokolov JC, Prestwich GD, et al. Electrospun three-dimensional hyaluronic acid nanofibrous scaffolds. Biomaterials. 2006;27(20):3782–3792. doi: 10.1016/j.biomaterials.2006.02.037. [DOI] [PubMed] [Google Scholar]
- 53.Gitman IM, Askes H, Sluys LJ. Representative volume: existence and size determination. Eng Fract Mech. 2007;74(16):2518–2534. [Google Scholar]
- 54.Liu C. On the minimum size of representative volume element: an experimental investigation. Exp Mech. 2005;45(3):238–243. [Google Scholar]
- 55.Romero P, Masad E. Relationship between the representative volume element and mechanical properties of asphalt concrete. J Mater Civil Eng. 2001;13(1):77–84. [Google Scholar]


