Abstract
Folding is an essential shape characteristic of the human cerebral cortex. Descriptors of cortical folding patterns have been studied for decades. However, many previous studies are either based on local shape descriptors such as curvature, or based on global descriptors such as gyrification index or spherical wavelets. This paper proposes a gyrus-scale folding pattern analysis technique via cortical surface profiling. Firstly, we sample the cortical surface into 2D profiles and model them using a power function. This step provides both the flexibility of representing arbitrary shape by profiling and the compactness of representing shape by parametric modeling. Secondly, based on the estimated model parameters, we extract affine-invariant features on the cortical surface, and apply the affinity propagation clustering algorithm to parcellate the cortex into cortical regions with strict hierarchy and smooth transitions among them. Finally, a second-round surface profiling is performed on the parcellated cortical surface, and the number of hinges is detected to describe the gyral folding pattern. We have applied the surface profiling method to two normal brain datasets and a Schizophrenia patient dataset. The experimental results demonstrate that the proposed method can accurately classify human gyri into 2-hinge, 3-hinge and 4-hinge patterns. The distribution of these folding patterns on brain lobes and the relationship between fiber density and gyral folding patterns are further investigated. Results from the Schizophrenia dataset are consistent with commonly found abnormality in former studies by others, which demonstrates the potential clinical applications of the proposed technique.
1. Introduction
The cerebral cortex of the human brain is highly convoluted and folds itself into gyri and sulci during brain development. As an essential characteristic of the human cerebral cortex, the fold has shown quite different patterns on even major gyri and sulci across subjects (Talairach and Tournoux, 1988; Van Essen et al., 1998; Fischl et al., 1999; Liu et al., 2004). In spite of this great variability, the folding pattern of human cortex seems to be closely related to the architectonic, connectional and functional specialization of the cortical surface (Welker, 1990; Toro and Burnod, 2005). Evidence also has shown that the folding pattern of human cerebral cortex can predict its cytoarchitecture (Fischl et al., 2008). Therefore, quantitative descriptions of folding patterns (Zilles et al., 1988; Yu et al., 2007a; Toro et al., 2008) and understanding of the underlying mechanisms (Van Essen, 1997; Raghavan et al., 1997; Toro and Burnod, 2005; Geng et al., 2007; Geng et al., 2009; Nie et al., 2009) have emerged as important research goals.
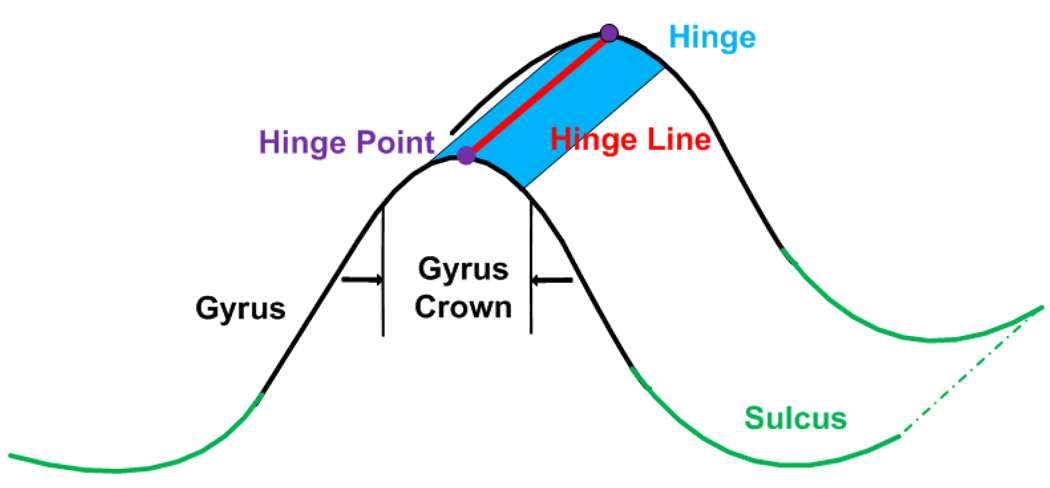
The original concepts of fold and folding were adapted from geology (Davis and Reynolds, 1996). In structural geology, folds refer to the rock layers that bend themselves under the forces acting in opposite directions, and folding is the process that forms folds. A hinge point is the point of minimum radius of curvature for a fold, and hinge points on a fold surface connect themselves to form a hinge line (Figure 1). As shown in Figure 1, the hinge of a fold is the field of marked curvature adjacent to the hinge line (Davis and Reynolds, 1996; Donath and Parker, 1964). Similarly, folds in this paper refer to regions of the convoluted human brain cortex, and folding is the convolution and gyrification process during human brain development. A hinge line and a hinge are geological counterparts defined on the human cerebral cortex.
Figure 1.
An illustration to show the concepts of hinge point (the purple point), hinge line (the red line), hinge (the blue field) and gyrus crown.
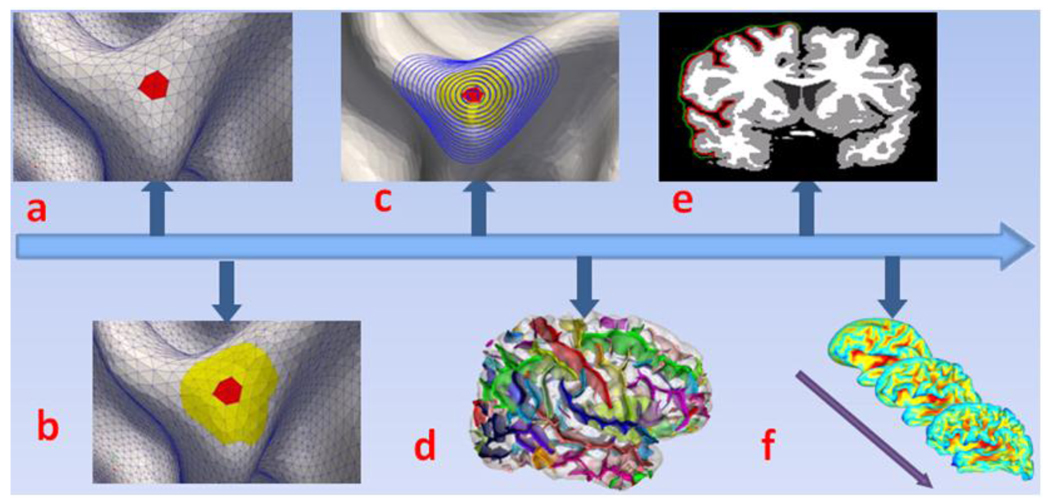
The folding pattern of human cerebral cortex is a multi-scale concept whose research scope can vary from a very small neighborhood to a whole brain cortical surface (Figure 2). There are two major streams on cortical folding pattern analysis. One is based on the descriptor of curvature and its derivations. Curvature, as show in Figure 2a, is a very local descriptor of folding pattern. Its research scope is usually a small neighborhood that is one ring away from the focused vertex. Conversely, the other mainstream is a quite global one. These studies use gyrification index (GI) (Zilles et al., 1988, Figure 2e) and spherical wavelets (Yu, 2007a and Yeo et al., 2008, Figure 2f) to analyze the folding pattern of the entire cortical surface or a certain lobe of human brain. Both of these two major stream approaches have generated many successful applications (Hardan et al., 2004; Schaer et al., 2006; Rettmann et al., 2006; Bonnici et al., 2007; Neal et al., 2007). Recently, development of cortical folding descriptors has attracted great interest in the literature. For example, Toro and colleagues proposed using surface ratio to describe local cortical folding pattern (Toro et al., 2008). This work extends the description from global scale such as GI to local scale. Zhang et al proposed a parametric representation of cortical folding patterns (Zhang et al., 2009). This method has a strong local shape representation capability via polynomial models. Awate and colleagues fused several cortical folding descriptors into a multivariate statistical framework (Awate et al., 2009). Boucher and colleagues used discrete exterior calculus and Tikhonov regularization to study the orientation of cortical folds, and applied the method to Alzheimer’s disease (Boucher et al., 2009). It is expected that these effective folding pattern descriptors will provide new insights into the mysterious cortical folding process and effective description of its patterns. Notably, cortical folding is essentially a multi-scale concept and one can obtain quite different descriptions if he/she focuses on different scales for the same cortical surface.
Figure 2.
Multi-scale description of cortical folding patterns. (a): micro-scale (red area, described by curvature); (b): meso-scale (yellow area, described by polynomial model, Zhang et al., 2009; or Bezier surface model, Zhu et al., 2009); (c): gyrus scale (blue patch, our method); (d): sulcus scale, Mangin et al., 2004; (e): lobe scale (by gyrification index, Zilles et al., 1988); (f): global scale (by spherical wavelets,Yeo et al., 2008; Yu et al., 2007a; Yu et al., 2007b).
Inspired by the methodology on folding pattern analysis of rocks in Geology, this paper proposes a method to analyze the folding pattern of cortex at the gyrus scale via surface profiling. This is a hybrid parametric method and profiling method in the sense that it combines both advantages of parametric method (achieving compact representation of shape) and profiling method (achieving flexibility of arbitrary shape representation). The basic idea is to represent the 3D shape information of a cortical surface patch with modeling parameters of a series of 2D profiles, and to cluster the cortex into regions with this shape information. Then a second-round surface profiling is performed on the gyrus crown of the parcellated cortex, and the number of hinges is detected to describe the folding pattern of the gyrus. With surface profiling on the gyri crowns, we can extend cortical folding analysis from localized parametric representation to gyrus-scale representation. We also applied this methodology to a Schizophrenia dataset and interesting results are obtained.
2. Methods
2.1 Overview
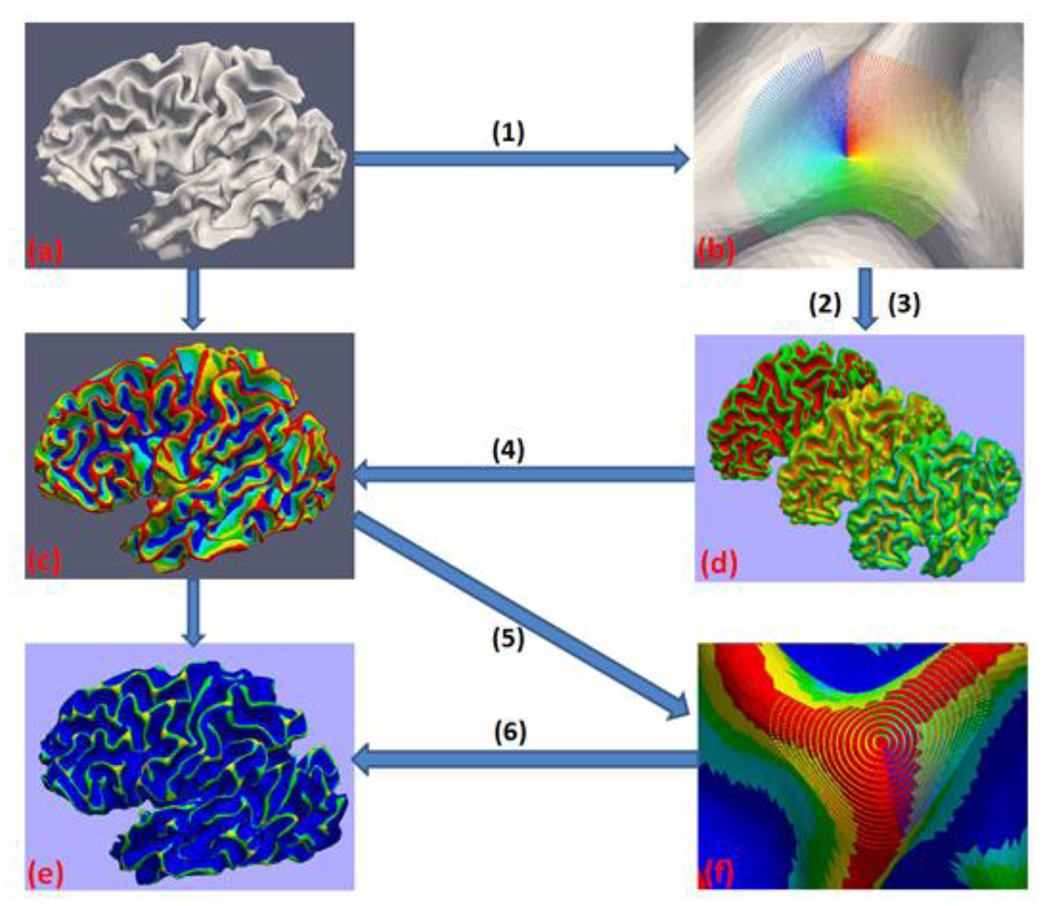
As summarized in Figure 3, the proposed method for our gyral folding pattern analysis includes the following steps. First, for each vertex of a reconstructed human brain WM/GM surface, we sample its corresponding surface patch (e.g., the color-coded area in Figure 3b) into a series of 2D profiles, and model these profiles using the power function, which is a popular model in structural geology study (Bastida et al., 1999). The shape information of the current surface patch then is encoded in the parameters of the power function. Second, based on the model parameters and profiling information, we define several affine-invariant features to represent each vertex’s folding information, and use these features to cluster the vertices of the whole cortical surface by an affinity propagation algorithm. This step segments the surface into several major classes including the gyrus crown. Finally, a second-round profiling is applied to vertices of the gyrus crown on the parcellated cortex, and the number of hinges of the current gyrus is detected to represent its folding pattern. These steps will be detailed in Section 2.2~2.5.
Figure 3.
Flowchart of the surface profiling method. (a). Original cortical surface; (b). Profiles on the original cortical surface; (c). Parcellated cortical surface; (d). Feature surfaces with shape information; (e). Gyral folding pattern surface; (f). Profiles on parcellated cortical surface. Steps: (1) Profiling; (2) Model fitting; (3) Feature extraction; (4) Affinity Propagation clustering; (5) Second round Profiling; (6) Hinge detection.
The reason why we take two rounds of profiling on the cortical surface is that direct profiling on the surface will not generate a descent hinge detection result (e.g., Fig.3e) because of the complexity of gyral folding and the imperfect reconstruction of WM/GM cortical surface. To overcome these barriers, we perform surface profiling on the parcellated cortical surface (Fig.3c). This is a critical step that makes the proposed framework robust to folding complexity and resistant to profiling noise from the imperfect cortical surface. The first round surface profiling, model fitting and clustering are all preprocessing steps to produce the parcellated cortical surface for the second round surface profiling.
2.2 Profiling of the cortical surface
Building a coordinate system for each vertex on a cortical surface is a necessary yet practically difficult issue. The difficulties are twofold. First, considering the complexity and high convolution of the human cortical surface, investigators may obtain quite different descriptions of the same fold if they look from different points of view. Second, descriptions of similar folding patterns at different locations and in different local coordinate systems should be comparable. These two contradictory facets make building a coordinate system challenging.
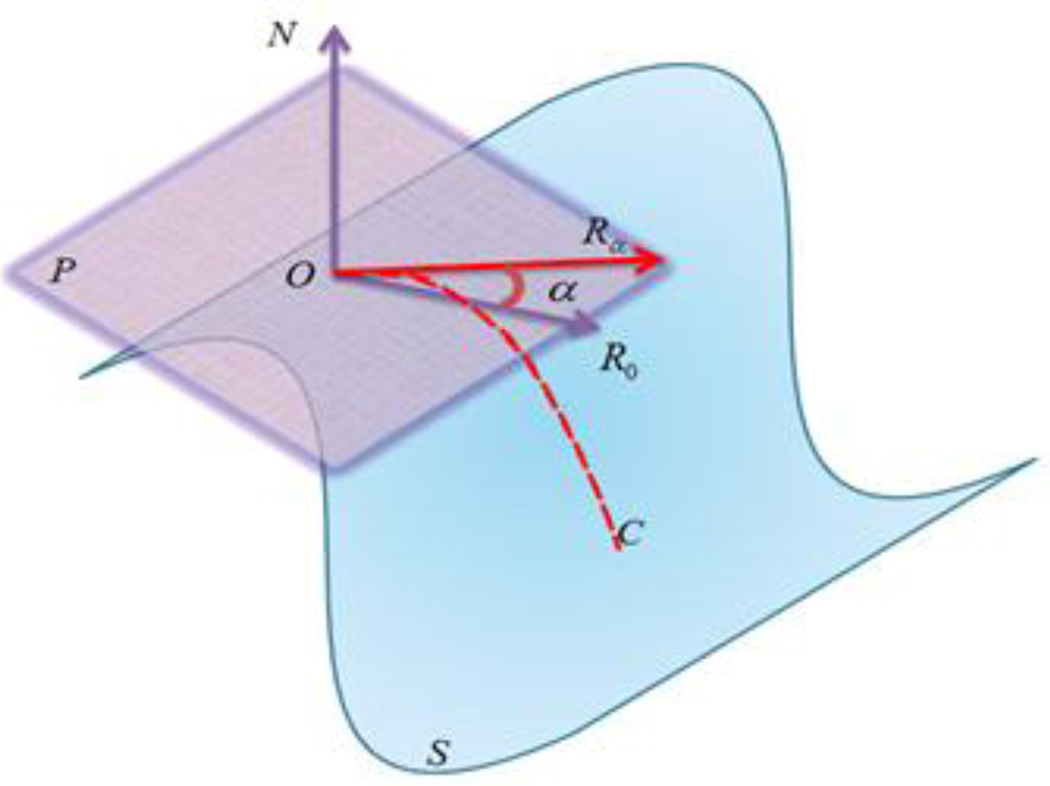
To deal with this problem, we build a 3D coordinate system that combines a 3D Cartesian coordinate system (Tao et al., 2002) and a 2D polar coordinate system, as shown in Figure 4. For any vertex O on the cortical surface S, there exists a normal direction N, as well as a tangent plane P. We establish the normal direction N as one axis (like the Z direction in a 3D Cartesian coordinate system), and build a polar coordinate system in plane P. The starting direction R0 in the 2D polar coordinate system is randomly selected. This coordinate system avoids the determination of the X axis and Y axis in a 3D Cartesian coordinate system, and makes the cortical surface easier to profile.
Figure 4.
An illustrative figure to show the coordinate system. O is any vertex on the cortical surface S; P is the tangant plane; N is the normal direction of vertex O; R0 is the starting direction of sampling; Rα is the sampling direction with α degree away from R0; C is the sampling profile at direction Rα.
After building the coordinate system, we sample the current vertex’s surface patch into profiles as follows. Without losing the generality, we denote the radial direction as Rα, here α is the angle between R0 and Rα. The profile of the current surface patch at Rα direction can be recorded as C(a, x, y), here x is the radial distance of a point on profile to the normal direction N, and y is the normal distance of the point to the plane P. The profiling process is conducted every θ degrees around the circle direction, which will generate 360/θ profiles for the current surface patch. For each profile, we discretize the profile at a radial step of r, and the discretization stops if we reach a maximum number points of M. Figure 5 shows the sampling results, as well as one profile.
Figure 5.
An example of profiles. Samping parameters: θ=5°, r = 0.1, and M = 45.
The essense of surface profiling here is to simplify a 3D profiling problem down to a collection of 2D profiling problems. This simplification is founded on the fact that the human brain is highly convoluted and a surface patch can have very complex shape. Current parametric models for 3D shape like polynomial and ellipsoid are often symmetric and may be too simple to capture such complex shapes. Thus, the advantage of such a simplification is the flexibility to describe an arbitrarily shaped cortical surface patch.
The disadvantage with the simplification is the possible loss of some 3D shape information. However, the 360 degrees of profiling still captures much 3D information, especially when we model the profiles (see the following section) and connect corresponding model parameters of all profiles together to form a circle curve.
2.3 Model fitting of profiles
The essence of model fitting for profiles is to encode their shape information into a couple of parameters, and to represent the shape information compactly. The model we use in this paper is a power function, which is a popular model in Geology because of its simplicity and intrinsic physical meaning (Bastida et al., 1999). The power function is expressed as:
| (1) |
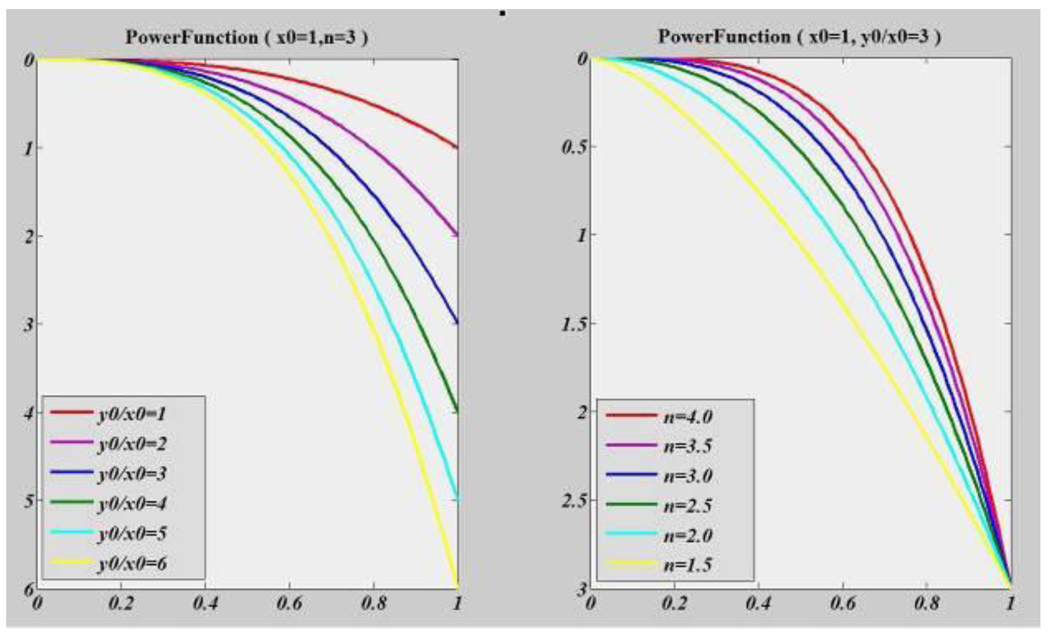
Here, (x, y) is the 2D Cartesian coordinate of a profile; x0, y0 and n are parameters to describe a profile shape; y0 ≠ 0, x0> 0 and n > 0. Figure 6 shows the power function with different parameters. As we can see from the figure, the power function is good at 2D shape representation.
Figure 6.
Power function shape changes with parameters. Left: power function shape change with ratio of y0/x0 while n holds constant; Right: power function shape change with power n while y0/x0 holds constant.
In practice, we add a translational parameter b to model the introduced translation along y direction by profile smoothing. Thus the final model will be:
| (2) |
The parameters of this model can be evaluated in a Least-square sense. Given the N sample points of the profile (xi, yi), i = 1, 2, 3,..., N; the model parameters are those that minimize the fitting residuals:
| (3) |
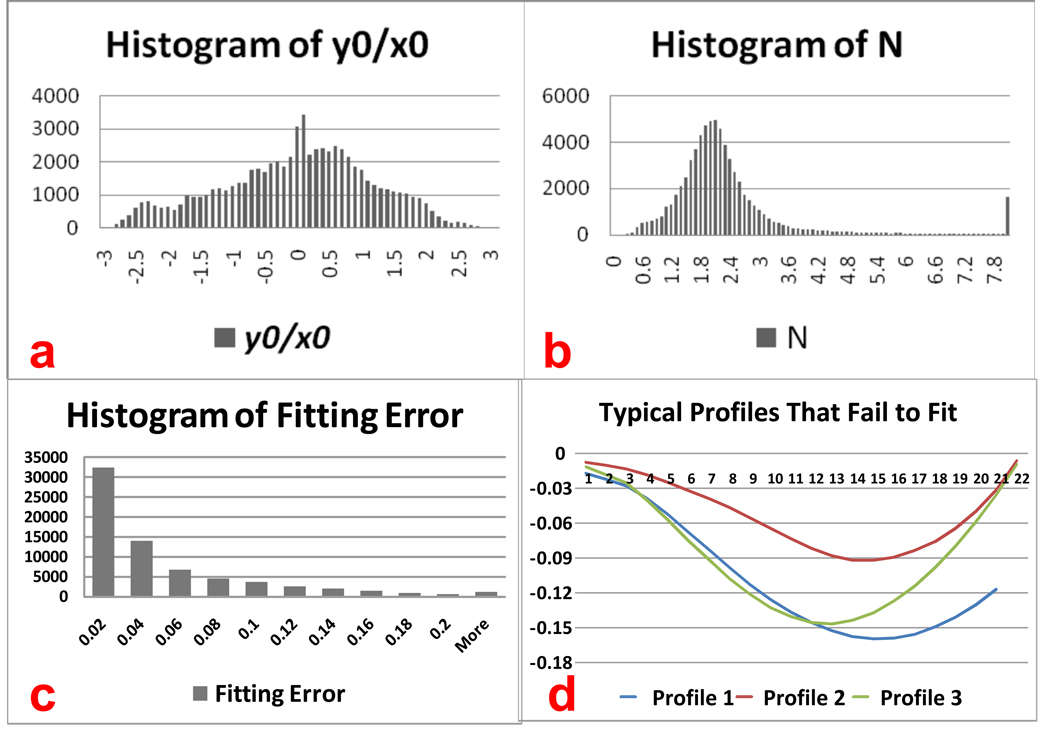
Here, P denotes the four parameters (b, x0, y0 and n) to be evaluated, ypi is the model output at xi with the four parameters known as P, and yi is profile measurement at xi. The minimization problem is known as a non-linear least square minimization problem, and there are several solutions for it. In this paper, we adopt the Levenberg-Marquardt (LM) algorithm, which has been proven to be fast and stable in many applications (See Levenberg, 1944; Marquardt, 1963 for details on the LM algorithm). Figure 7a and 7b show the histograms of model parameters for 70, 000 randomly selected profiles.
Figure 7.
Model fitting results from 70,000 profile fittings. (a): histogram of the ratio between y0 and x0 (b): histogram of N; (c): histogram of fitting error defined in Eq.(4); (d): typical profiles that the fitting algorithm doesn’t converge.
To evaluate the accuracy of model fitting, we define the fitting error of a profile as:
| (4) |
Here ypi is the model value at xi with the global optimal parameters P, whereas yi is the measurement at xi and N is the number of points used for model fitting. Figure 7c shows the histogram of fitting error for the 70,000 profiles. As can be seen from the histogram, most of the model fitting are reasonable and very accurate, and 98.28% of the profiles are fitted with an error under 0.2 mm.
There are indeed some profiles that fail in modeling fitting using a power function. Most of these failures come from profiles that are on relatively flat surfaces where small fluctuations do exist. If these fluctuations are very small (less than 0.2mm for example, see Figure 7d), corresponding profiles can be fitted with the high power parameter N. That is why we have many fittings with N comparatively high in the histogram. However, this kind of failure is not a severe problem in model fitting. The reason is twofold. For one thing, the ratio of these failure cases to all fitting cases is quite small. Table 1 shows the failures of model fitting for seven random subjects. Generally, only 6~7 profiles fail to fit the model in every 1000 profiles. For another, smoothing applied on all profiles of current vertex can be a good compensation.
Table 1.
Failures of model fitting using power function.
| Subject ID | Number of Profiles | Number of Fitting Failures | Failures Percentage |
|---|---|---|---|
| Sub1 | 11,532,960 | 70,868 | 0.61% |
| Sub2 | 11,894,904 | 84,840 | 0.71% |
| Sub3 | 11,962,800 | 90,689 | 0.76% |
| Sub4 | 12,472,704 | 76,250 | 0.61% |
| Sub5 | 11,999,736 | 67,887 | 0.57% |
| Sub6 | 11,743,560 | 81,382 | 0.69% |
| Sub7 | 11,941,704 | 83,001 | 0.70% |
| Average(Stdev) | 11,935,481(286,945) | 79,274(9.31) | 0.66% (0.07%) |
2.4 Feature extraction and clustering via affinity propagation
After the model fitting process, the shape information of the cortical surface is encoded in the parameters of the power function at each vertex. Among these parameters, the ratio R between y0 and x0 and the power n are very information-rich descriptors of profile shape. Figure 6 shows how the shape of a 2D profile changes with the two parameters. Profile shape changes dramatically with R and n. Thus most of features extracted are based on them, especially the ratio R, as this metric has proven to be more stable and change more smoothly between adjacent profiles than the power n. Table 2 shows the definitions and descriptions of features that we extract based on model parameters and profiling information.
Table 2.
The features extracted for clustering.
| Feature Name | Definition | Visualization |
|---|---|---|
| SulciOrGyri | A vertex that has more profile points above its tangent plane will be considered as a sulci vertex, and vice versa. |  |
| AverageRatio | The average R of all profiles for current vertex. |  |
| AverageMinR | Average R for all profiles that correspond to local minima at R curve. |  |
| AverageMaxR | Average R for all profiles that correspond to local maxima at R curve. |  |
| AllInflectionsDis | Sum of distances between neighboring local maxima and minima. |  |
| AverInflectionDis | Average of distances between neighboring local maxima and minima. |  |
| MaxInflectionDis | Max of distances between neighboring local maxima and minima. |  |
| AverSampleDis | Average of the first order moment of all profiles about tangent plane. |  |
| MaxSampleDis | Maximum of the first order moment of all profiles about tangent plane. |  |
| AverPower | Average of fitted parameter n of all profiles. |  |
Based on these features, we apply the unsupervised affinity propagation clustering algorithm on the cortical surface. Affinity propagation clustering has been successfully used in many applications because of its simplicity, general applicability and performance (Frey and Dueck, 2007). The idea of affinity propagation clustering is to consider all data points as potential cluster centers (exemplars), and exchange real-valued messages (responsibility and availability) between data points based on similarity until a group of data centers are found so that the net similarity is maximized.
In our application, the inputs of affinity propagation are pair-wise similarity and data point preferences. The similarity s(i,k) indicates how well the data point k can be the exemplar for data point i. The preference s(i,i) is defined such that points with high values are more likely to be chosen as exemplars. The messages passed between data points include responsibility and availability. The responsibility r(i,k), sent from data point i to candidate exemplar point k, reflects the accumulated evidence for how well-suited point k is to serve as the exemplar for point i, taking into account other potential exemplars for point i. Self-responsibility r(k,k) reflects accumulated evidence that point k is an exemplar based on its input preference tempered by how ill-suited it is to be assigned to another exemplar. The availability a(i,k), sent from candidate exemplar point k to point i, reflects the accumulated evidence for how appropriate it would be for point i to choose point k as its exemplar, taking into account the support from other points that point k should be an exemplar. Self-availability a(k, k), reflects accumulated evidence that point k is an exemplar, based on the positive responsibilities sent to candidate exemplar k from other points. The affinity propagation is performed as follows:
- Step 1. Initialization. All availabilities are set to zero, and choose the damping parameter λ:
(5) - Step 2. Computer and update responsibility:
(6) - Step 3. Computer and update availability:
(7) - Step 4. Combine responsibility and availability:
Data point k will be an exemplar if E ≥ 0.(8) Step 5. Go to step 2 until exemplars don’t change for certain iterations.
For more details of the affinity propagation method, please refer to (Frey and Dueck, 2007);
In this paper, the similarity s(i,k) of two random vertexes i and k is defined based on the Mahalanobis distance:
| (9) |
Here V⃑i and V⃑k are the feature vector defined in Table 2; cov is the covariance matrix of the feature vectors. Damping parameter λ = 0.9, and preferences are the same for all data points.
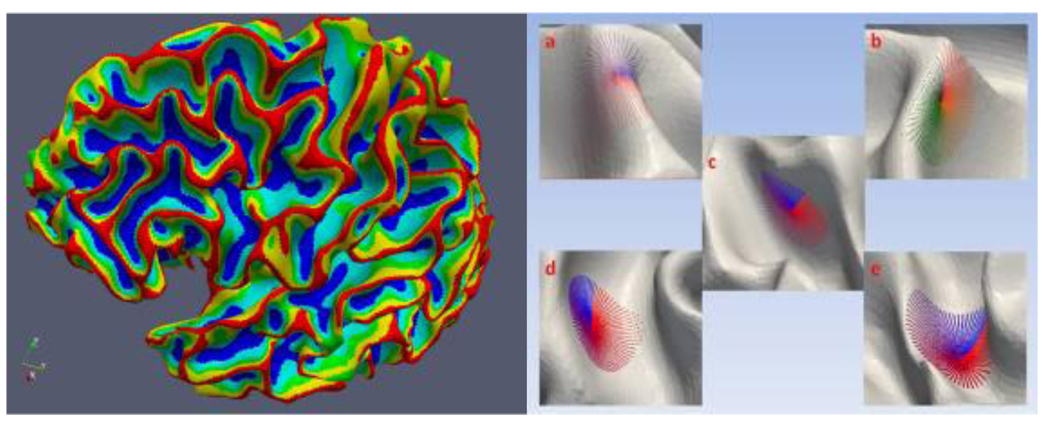
Figure 8 shows the result of affinity propagation clustering. The cortex is segmented into five classes: gyrus crown (red), sub gyrus crown (yellow), central area (green), sub sulcus basin (light blue), and sulcus basin (blue, Lohmann and Cramon, 2000). The result has two important properties. First, these parcellated cortical regions are very distinct in hierarchy. From the corresponding patch of each cortical region in the right of Figure 8, we can see that this hierarchy comes from the different shapes of different cortical regions. Second, the transition between different cortical regions is smooth. This property results from the smoothness of the cortical surface, and it brings a favorable characteristic, that is, if we move from gyrus crown (red in the left figure) to sulcus basin (blue in the left figure) along any path, we will cross the other three transitional cortical regions (yellow, green, and light blue) one by one. These two properties help us profile the gyrus crown (red area) on the parcellated cortex and analyze the folding pattern of the gyrus.
Figure 8.
The five parcellated cortical regions and their typical corresponding patches: gyrus crown (red, a), sub gyrus crown (yellow, b), central area (green, c), sub sulcus basin (light blue, d), and sulcus basin (blue, e).
It is noticeable that although we can obtain various numbers of classes from the clustering algorithm by changing the clustering parameters, the algorithm outputs still have the two properties mentioned above. The reasons why we choose five classes are two folds: 1) five classes are sufficient to represent the folding hierarchy shown in Fig.8; and Fig.2) this choice helps to generate distinct feature values defined by Eq. (10) in the following section.
2.5 Second-round profiling on the gyrus crown of parcellated cortex and hinge detection
After clustering the cortical surface into several regions based on their shape information, we obtain a parcellated cortical surface which has strict hierarchy among different areas while keeping the smooth transition from gyri to sulci, and therefore can conduct a second round profiling on the gyrus crowns of the parcellated cortex. To conduct this, we firstly assign a value to each parcellated cortical region. The assigned region value can vary, but should reflect the hierarchy and transition between different cortical regions. In this paper, gyrus crowns are assigned with a minimum value 1 whereas sulci are assigned with a maximum value of 5, and other regions are assigned with values according to their hierarchical level on the parcellated cortex. Then, a feature value f is created for each profile of a gyrus crown in order to measure the depth profile extension, as well as the number of different regions the profile crosses while extending. The feature value is defined as:
| (10) |
Here, N is the number of points on the profile. fi is the region value to which point i belongs. For example, if point i is on a gyrus crown, fi will be 1, and fi will be 5 if point i is on a sulcus basin.
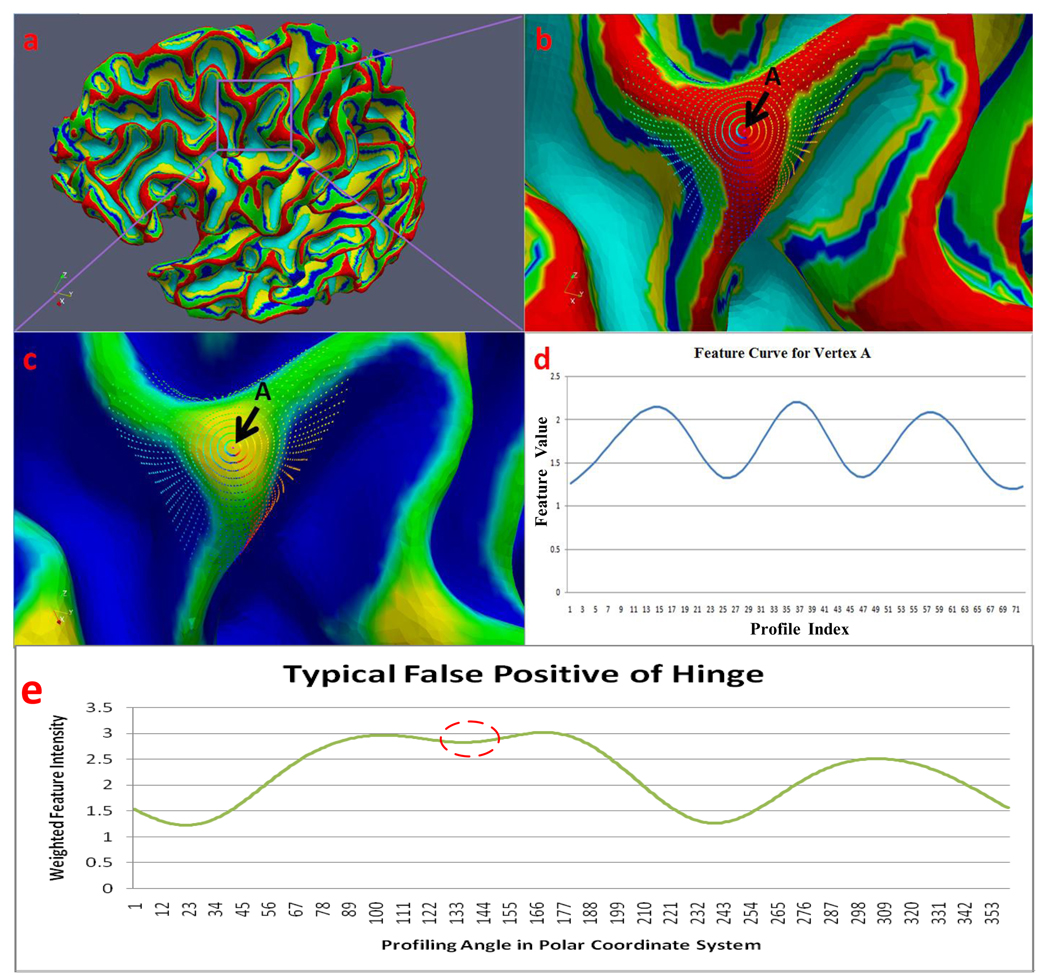
Following the above two steps, we detect hinges of the gyrus on which the current vertex sits. After 360 degree profiling, the feature values of all profiles for the current vertex will join together to form a ring curve (Figure 9d). Local minima of the curve correspond to the hinges of the gyrus, and the number of the local minima is the number of hinges of the gyrus. Take the case shown in Figure 9 for example, vertex A has a very clear folding pattern (three local minima) to indicate that it is on a 3-hinges gyrus.
Figure 9.
The profiling process on gyri of a segmented surface. Figure 9b shows the profiling at a certain vertex on gyri (vertex A in b and c). As we can see from Figure 9b, the profiling starts from the blue arrow direction and was conducted every 5 degrees in a counter-clockwise direction around the vertex; Figure 9e shows the typical curve of false positive hinge (corresponds to the inflection in red circle).
Detection of hinge number has proven to be consistent and smooth, e.g., as shown in Figure 9c, almost all neighboring vertexes of vertex A are detected on the 3-hinge gyri. However, there may be false positives (Figure 9e). The typical profile pattern for them is depicted in Figure 9e. As we can see from the curve, it does have three local minima, but the second local minimum is obviously much higher than the other two. Considering the feature value definition, the strict hierarchy, and the smooth transition between different regions of the parcellated cortex, a profile on the gyri should not have feature values like that, even when we take the smooth effect into consideration. To remove these false positives, we apply a local adaptive threshold method in the detection of hinges number. We first obtain the minima feature fmin of all concave inflections. Then, if the concave value fc of the curve exceeds the minima fmin for a certain threshold fthresh, the profile of this concave should not be recognized as a profile on the gyri. Otherwise, the profile will be considered. Mathematically, the decision is simple. Let us create a boolean variable ProfOnGyri to indicate whether or not on gyri the corresponding profile is of fc:
| (11) |
In our work, the fthresh is set to be 0.5.
3. Results
3.1 Hinge patterns detection
In this section, we applied the above methods to 10 constructed GM/WM cortical surfaces. The MR image dataset we used here were obtained from NIHPD public data released on March 2008 (http://www.bic.mni.mcgill.ca/nihpd/info/index.html). Subjects are youths (mean age: 17.98(y); standard variance: 0.37(y)). GM/WM cortical surfaces were reconstructed using home-built software (Liu et al., 2004). Topology correction and smoothing were applied to the cortical surfaces (Shattuck and Leahy, 2001). The reconstructed cortical surfaces have 300,000 vertexes and double sized triangle faces on average.
Our experimental results demonstrate that human gyral folding patterns can be divided into 3 classes according to their number of hinges: 2-hinge, 3-hinge and 4-hinge gyri. Figure 10a shows examples of the three folding pattern categories and Figure 10b shows their corresponding feature curves respectively. As we can see from the figure, the hinges of gyri correspond well to the local minima of the feature curves (Figure 10b). The number of local minima of the connected feature curve, therefore, is considered as the number of hinges for the current gyrus. Besides the number of local minima of the connected feature curve, the distance between local minima is also an important feature that could be used to further classify the detected gyral folding patterns. This distance actually represents the degree to which the gyrus bends itself. Take the 2-hinge gyrus in Figure 10a3 as an example; its bending degree is apparently larger than Figure 10a1 and Figure 10a2 in the same category. We can also see the differences from the feature curves in Figure 10b, that is, the distance of the two local minima in Figure 10b3 is larger than those of the other two gyri in Figure 10b1 and Figure 10b2. Figure 10c provides the gyri pattern detection result on a whole cortical surface. Most of the gyri patterns are correctly detected, indicating reasonably good performance of the proposed method. In particular, the detected 4-hinge patterns are highlighted by dashed circles. One zoomed example is shown in Figure 10d.
Figure 10.
Pattern detection results. (a): Examples for each detected pattern. Small triangles denote the centers of detected gyri patterns. 1–3: 2-hinge gyri; 4–6: 3-hinge gyri; 7–9: 4-hinge gyri. (b): Corresponding feature curve for each sample. (c): Detected patterns on a whole cortical surface. The three patterns are color-coded. (d): An example of detected 4-hinge gyri.
3.2 Pattern detection accuracy
To evaluate the accuracy of our proposed method, we had two experts manually check the detected patterns, and count the number of two types of detection errors: Type1 error (false positive) and Type2 error (false negative). We express the accuracy as:
| (12) |
The detection accuracy for 3-hinge gyri pattern is summarized in Table 3. The average detection accuracy was over 90%, indicating relatively good detection accuracy. For 2-hinge and 4-hinge patterns, our algorithm had a similar detection accuracy of over 90%.
Table 3.
Two types of errors and accuracy of our method.
| Subject ID |
Type1 Error By Expert1 |
Type2 Error By Expert1 |
Type1 Error By Expert2 |
Type2 Error By Expert2 |
3-hinge patterns |
Accuracy (%) |
|---|---|---|---|---|---|---|
| Sub 1 | 8 | 6 | 7 | 5 | 184 | 92.9 |
| Sub 2 | 5 | 9 | 6 | 11 | 196 | 92.1 |
| Sub 3 | 6 | 4 | 8 | 3 | 170 | 93.8 |
| Sub 4 | 4 | 11 | 4 | 9 | 143 | 90.2 |
| Sub 5 | 10 | 9 | 9 | 9 | 168 | 89.0 |
| Sub 6 | 6 | 4 | 6 | 5 | 181 | 94.2 |
| Sub 7 | 1 | 8 | 3 | 9 | 146 | 92.8 |
| Sub 8 | 9 | 3 | 7 | 3 | 203 | 94.6 |
| Sub 9 | 10 | 11 | 8 | 10 | 154 | 87.3 |
| Sub 10 | 7 | 3 | 5 | 5 | 165 | 93.9 |
| Total | 58 | 70 | 63 | 69 | 1410 | 90.8 |
3.3 Hinge pattern distributions on lobes
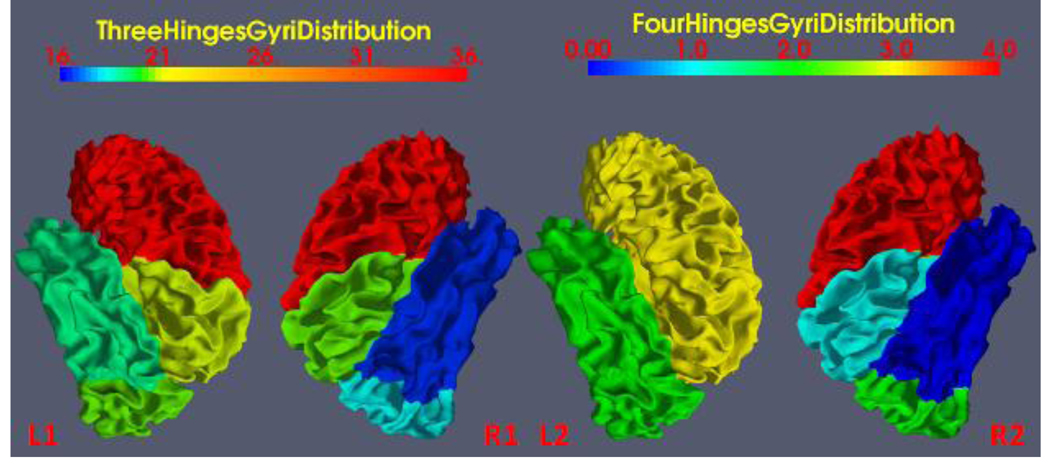
To quantitatively study the distribution of 3-hinge gyri and 4-hinge gyri across the human lobes, we mapped the number of these folding patterns onto a parcellated model cortical surface. The process has three steps which include: (1) brain registration using HAMMER (Shen and Davatzikos, 2002); (2) mapping the lobe labels onto the reconstructed GM/WM cortical surface, which generates a parcellated cortical surface into lobes; (3) mapping the average number of three-hinge and four-hinge gyri at each lobe onto the surface.
As shown in Figure 11, the distribution of 3-hinge and 4-hinge gyri across the lobes has shown some interesting patterns. For example, the frontal lobe has more 3-hinge and 4-hinge gyri than any other lobes, possibly indicating the more complicated gyrification process in the later stage of neurodevelopment (Brown et al., 2002). Another interesting observation is the left hemisphere shows more foldings than the right hemisphere, both for 3-hinge gyri and 4-hinge gyri, which may indicate more complicated gyrification and functional specification process in the left hemisphere (Sun and Walsh, 2006; Boni et al., 2007). This result reflects the asymmetry of the human brain from a gyral folding perspective.
Figure 11.
Gyral folding pattern distribution on lobes. The lobe parcellation was generated by brain volume parcellation using HAMMER first and then mapped to the cortical surface.L1 and L2 are left hemispheres and R1 and R2 are right hemispheres.
3.4 Relationship between gyral folding pattern and fiber density
Although the mechanisms underlying the formation of gyri and sulci remain an open question, evidences have demonstrated that cortical wiring has played an important role in cortical gyrification (Goldman-Rakic and Galkin, 1978; Goldman-Rakic, 1980; Goldman-Rakic, 1988; Dehay et al., 1996). A natural question following these evidences is: is there any relationship between different cortical folding patterns and the cortical wiring?
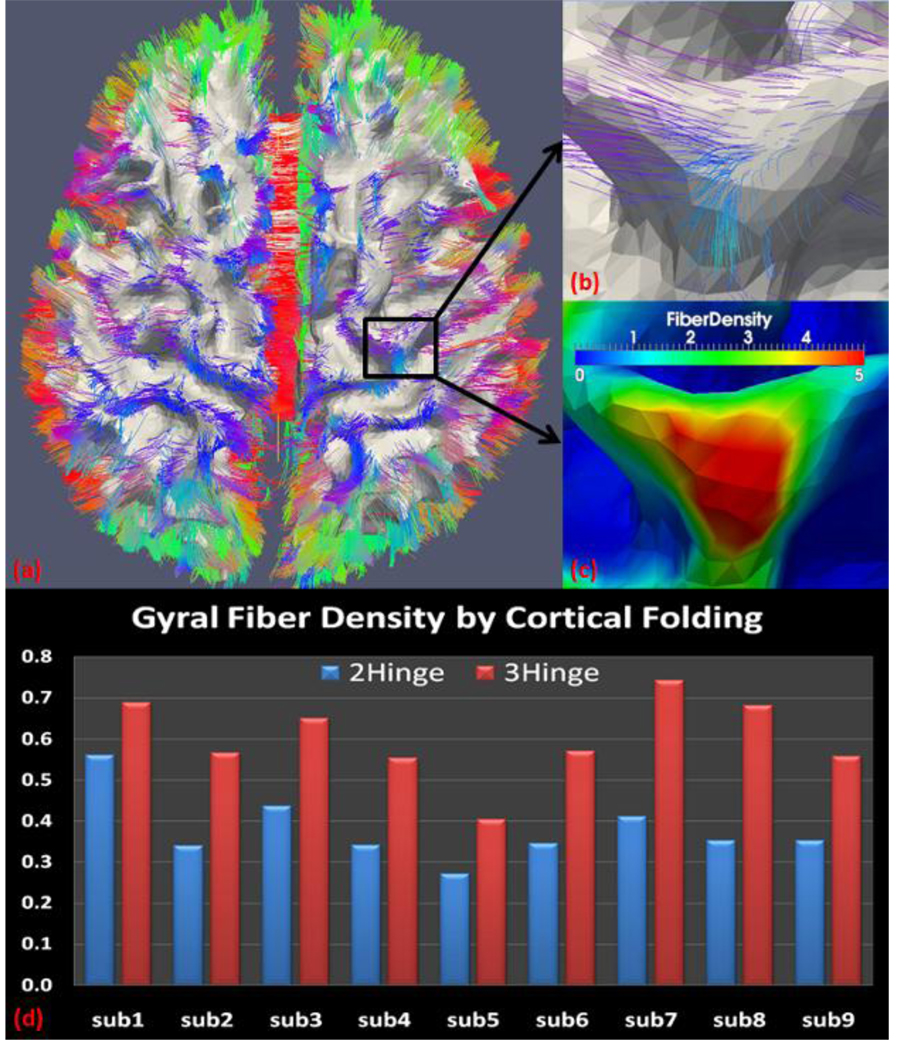
To study this relationship, we applied our proposed method to a new nine-subject dataset containing Diffusion Tensor images (DTI). The cortical surface was reconstructed from WM/GM segmentation using DTI images (Liu et al., 2007). Fibers were extracted from DTI data using fiber tractography (Fillard and Gerig, 2003). The fiber density ρx on any vertex x of the cortical surface is defined as:
| (13) |
Here, ni is the number of fibers penetrating the ith neighboring triangle of x; ri is the area of this triangle in mm2. The fiber density of two-hinge gyri is calculated as the average fiber density of vertices on the crowns of 2-hinge gyri (green regions in Fig. 10c), whereas the fiber density of three-hinge gyri is calculated as the average fiber density of vertices on the junctions of 3-hinge gyri ( yellow regions in Fig. 10c).
Figure 12 depicts the average fiber density of gyri with 2 hinges and 3 hinges. As we can see from this figure, 3-hinge gyri have larger fiber density than its 2-hinge counterpart for all the nine subjects. This indicates the cortical axongenesis might take effect in the formation of these different gyral patterns. However, to what degree and how the brain wiring affect this differentiation of gyral folding pattern need further investigation.
Figure 12.
Top: (a) Fiber overlaid on the WM/GM surface; (b) magnified view of the region in the black rectangular of (a); (c) fiber density of this region; (d) average fiber density of gyri with 2 hinges and 3 hinges for the whole dataset. Fiber density for 4-hinge gyri is not calculated since not every subject has this pattern in this dataset.
3.5 Gyral folding patterns for Schizophrenia patients
Schizophrenia (SZ) is a psychiatric disorder characterized by abnormalities in the perception or expression of reality. It most commonly manifests as auditory hallucinations, paranoid or bizarre delusions, or disorganized speech and thinking with significant social or occupational dysfunction. Cortical folding abnormalities of SZ patients and people with high risk of SZ have been reported in several studies (Kulynych et al., 1997; Paulo et al., 2003; Jou et al., 2005; Wisco et al., 2007; Cachia et al., 2008). All of them reported a folding reduction on the left hemisphere of SZ patients, while some (Paulo et al., 2003; Cachia, et al., 2008) reported a bilateral folding reduction on both hemispheres of SZ patients.
Since the left brain is the speech and communication center, and the number of three-hinge gyral patterns can be used as an indicator of gyral folding complexity, it is natural to hypothesize that SZ patients have the reduction of three-hinge gyri on the left brain.. In this section, we apply our surface profiling analysis to SZ patient MRI data to test this hypothesis. Eleven SZ patients and eleven health controls were used in this study. Left and right GM/WM surfaces were reconstructed using FreeSurfer (http://surfer.nmr.mgh.harvard.edu/). Table 4 shows the number of 3-hinge gyri of left and right hemisphere for both SZ patients and normal controls. The left hemisphere of SZ patients has less 3-hinge patterns than normal controls (p<0.04, one-tailed t-test assuming equal group variance), which may indicate abnormality of the left hemisphere of SZ patients. This finding is consistent with former studies (Kulynych et at., 1997; Paulo et al., 2003; Jou et al., 2005; Wisco et al., 2007; Cachia et al., 2008). For the right hemisphere, we do not have statistical evidence to prove a similar hypothesis. This result is consistent with Kulynych et al., 1997 on SZ patients and Jou et al., 2005 on people with high risk of SZ. The statistics of these results, including means and standard deviations, are visualized in Fig. 13.
Table 4.
3-hinge gyri number for SZ patients and the normal controls.
| ncl3* | ncr3* | ptl3* | ptr3* |
|---|---|---|---|
| 144 | 157 | 142 | 151 |
| 170 | 136 | 150 | 160 |
| 151 | 140 | 145 | 136 |
| 154 | 146 | 141 | 142 |
| 165 | 148 | 164 | 167 |
| 155 | 159 | 161 | 150 |
| 143 | 150 | 140 | 147 |
| 151 | 152 | 145 | 159 |
| 169 | 165 | 148 | 155 |
| 144 | 152 | 149 | 164 |
| 168 | 165 | 147 | 150 |
ncl3: three-hinge gyri number of LH for controls; ncr3: three-hinge gyri number of RH for controls; ptl3: three-hinge gyri number of LH for SZ patients; ptr3: three-hinge gyri number of RH for SZ patients.
Figure 13.
Statistics of 3-hinge gyri for SZ patients and the normal controls. Red bars for left hemisphere, and blue bars for right hemisphere. ncl3, ncr3, ptl3and ptr3 are defined at table 4.
However, it needs to be noticed that there are different views about cortical folding for SZ patients. For example, Highley et al., 2003 reported that there was no gyrification difference for schizophrenia; Narr et al., 2004 even reported an increase in cortical folding in the right superior frontal cortex of male schizophrenic patients. It is evident that there are still no common agreements on this issue across the whole community. Therefore, people should be cautions to interpret our analysis result in the above paragraph.
4. Discussion and Conclusion
In this paper, we propose a method to analyze human brain cortical gyral folding patterns via surface profiling. The method focuses on the detection of hinge numbers of gyri, which is converted to the problem of finding local minima on the feature curve. The proposed method has been applied to two normal brain datasets and a Schizophrenia dataset. Our preliminary results demonstrate that the proposed surface profiling method is able to accurately classify gyri into three folding patterns according to the number of gyral hinges.
In the literature, there has been significant amount of research work on sulci analysis, e.g., Li et al., 2008, Lohmann et al., 2008. The reasons that we focus on gyri in this paper are two folds: 1) Published data showed that gyri have significantly more neurons than sulci (Hilgetag and Barbas, 2005), suggesting that the morphogenesis of gyri has significant roles in the development of shape of the cerebral cortex; 2) gyri have significantly more long fiber connections than sulci, as shown in Fig 12a, suggesting that gyri might be the central structural substrate of interaction between corticogenesis and axogenesis (Van Essen, 1997). Hence, quantitative description of gyral shape patterns is of potentially significant interests to the neuroscience and neuroimaging community.
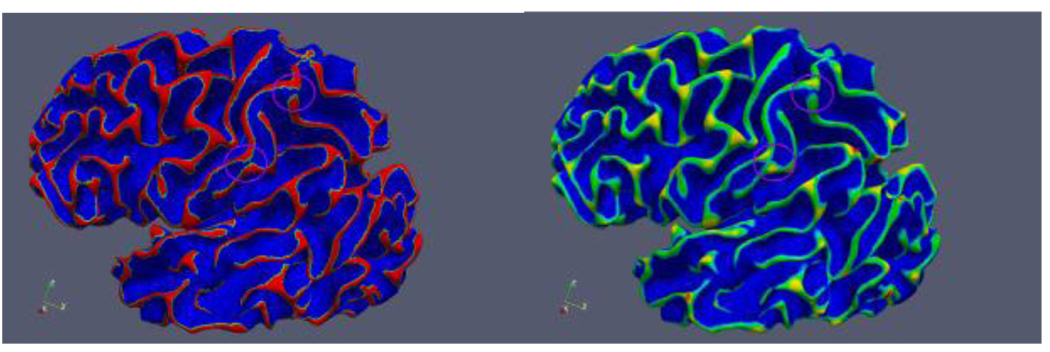
In the literature, several methods have been proposed to automatically label human brain surface into gyri and sulci (Cachia et al., 2003; Fischl et al., 2004). In comparison, our segmentation of the cortical surface is based on clustering using profile shape information, and three more classes in addition to gyrus crown and sulcus basin are segmented to fill the transitional area from gyri to sulci. Though the segmented gyrus crown might be broken somewhere (Figure 14a), it seems that these breaks have little impact on the final results of gyral folding patterns (Figure 14b). This robustness may come from the profiling method itself. As we profile the cortical surface at a macro level, small breaks of a gyrus crown probably will not change the fact that the majority of the profile is on a gyrus.
Figure 14.
(a) Examples of broken gyrus connections. (b) Result of gyral folding detection in regions with broken connections.
Our research on gyral folding pattern analysis has shown that 3-hinge and 4-hinge gyri (Figure 10) are common across different subjects, and the distribution of them among individuals can vary significantly. This result puts forward new challenges for registration-based analysis of the human brain (Thompson, 1996; Shen and Davatzikos, 2002; Liu et al., 2004; Fischl et al., 2004). For example, how to establish correspondence between different patterns of gyri, e.g., 3-hinge gyri and 4-hinge gyri, in brain registration remains a challenging and open problem.
Currently, our method only classifies gyral folding patterns into 3 broad classes: 2-hinge, 3-hinge, and 4-hinge gyri. A more detailed classification of the folding patterns, however, is possible via surface profiling. For the 2-hinge gyri, we could use the angle between local minima to recognize whether it is a “–” shape gyrus or “U” shape gyrus. For the three-hinge gyri, we could also use the angle information to further classify the gyri into “Y” shapes and “T” shapes. The more detailed classification of 2-hinge gyri and 3-hinge gyri could potentially provide additional important features for self-contained parcellation of the cerebral cortex into anatomically meaningful regions, as well as for automatic recognition of them.
We already showed the applications of the gyral folding analysis techniques in the understanding of cortical folding mechanisms and in the study of Schizophrenia diseases. In the future, this technique may be applied in many other diseases associated with abnormal cortical folding (Levine and Barnes, 1999; Mochida and Walsh, 2004) such as Down’s syndrome (Venita, 1996), the Donnai-Barrow syndrome (Kantarci et al., 2007) and lissencephaly, in which brain folds are less numerous and smaller (Clark, 2004).
Acknowledgement
K Li was supported by the China Government Scholarship. J Nie, L Guo and G Li were supported by the NWPU Foundation for Fundamental Research. T Liu was supported by the NIH Career Award (NIH EB 006878) and the University of Georgia start-up research funding. The normal brain MRI data were obtained from the NIH Pediatric Neuroimaging dataset and acquired in BIRC, UGA, respectively. The SZ patient MRI data was obtained from NA-MIC.
Footnotes
Publisher's Disclaimer: This is a PDF file of an unedited manuscript that has been accepted for publication. As a service to our customers we are providing this early version of the manuscript. The manuscript will undergo copyediting, typesetting, and review of the resulting proof before it is published in its final citable form. Please note that during the production process errors may be discovered which could affect the content, and all legal disclaimers that apply to the journal pertain.
References
- Awate Suyash P, Yushkevich Paul, Song Zhuang, Licht Daniel, Gee James C. Multivariate High-Dimensional Cortical Folding Analysis, Combining Complexity and Shape, in Neonates with Congenital Heart Disease. Lecture Notes In Computer Science. 2009;Vol. 5636:552–563. doi: 10.1007/978-3-642-02498-6_46. [DOI] [PubMed] [Google Scholar]
- Boni RC, Prosdócimi FC, Bonsi AB, Almeida TM, Ribeiro LAM. Asymmetries of the Left and Right Temporal Lobes, Int. J. Morphol. 2007;25(1):117–120. [Google Scholar]
- Bonnici Heidi M, Williama T, Moorhead J, Stanfielda Andrew C, Harris Jonathan M, Owens David G, Johnstone Eve C, Stephen M. Lawrie.: Pre-frontal lobe gyrification index in schizophrenia, mental retardation and comorbid groups: An automated study. NeuroImage. 2007;35:648–654. doi: 10.1016/j.neuroimage.2006.11.031. [DOI] [PubMed] [Google Scholar]
- Bastida F, Aller J, Bobillo-Ares NC. Geometrical analysis of folded surfaces using simple functions. Journal of Structural Geology. 1999;21(7):729–742. [Google Scholar]
- Boucher Maxime, Evans Alan, Siddiqi Kaleem. Oriented Morphometry of Folds on Surfaces. Lecture Notes In Computer Science. 2009;Vol. 5636:614–625. doi: 10.1007/978-3-642-02498-6_51. [DOI] [PubMed] [Google Scholar]
- Brown M, Keynes R, Lumsden A. The developing brain. Oxford: Oxford University Press; 2002. [Google Scholar]
- Cachia A, Mangin J-F, Riviere D, Papadopoulos-Orfanos D, Kherif F, Bloch I, Regis J. A generic framework for the parcellation of the cortical surface into gyri using geodesic Voronoï diagrams. Medical Image Analysis. 2003;7(4):403–416. doi: 10.1016/s1361-8415(03)00031-8. [DOI] [PubMed] [Google Scholar]
- Cachia A, Paillere Martinot ML, Galinowski A, Januel D, de Beaurepaire R, Bellivier F, Artiges E, Martinot JL. Cortical folding abnormalities in schizophrenia patients with resistant auditory hallucinations. NeuroImage. 2008;39(3):927–935. doi: 10.1016/j.neuroimage.2007.08.049. [DOI] [PubMed] [Google Scholar]
- Clark GD. The classification of cortical dysplasias through molecular genetics. Brain Dev. 2004;26(6):351–362. doi: 10.1016/S0387-7604(03)00093-7. [DOI] [PubMed] [Google Scholar]
- Davis George H, Reynolds Stephen J. Structural Geology of Rocks and Regions. New York: John Wiley & Sons; 1996. Folds; pp. 372–424. ISBN 0-471-52621-5. [Google Scholar]
- Dehay C, Giroud P, Berland M, Killackey H, Kennedy H. Contribution of thalamic input to the specification of cytoarchitectonic cortical fields in the primate: effects of bilateral enuclation in the fetal monkey on the boundaries, dimensions, and gyrification of striate and extrastriate cortex. J Comp Neurol. 1996;367:70–89. doi: 10.1002/(SICI)1096-9861(19960325)367:1<70::AID-CNE6>3.0.CO;2-G. [DOI] [PubMed] [Google Scholar]
- Donath FA, Parker RB. Folds and Folding: Geological Society of America Bulletin. 1964;v. 75:45–62. [Google Scholar]
- Fillard Pierre, Gerig Guido. Analysis Tool For Diffusion Tensor MR. In Proc. of MICCAI’03, Part II. 2003:979–980. volume 2879 of LNCS. [Google Scholar]
- Fischl B, Sereno MI, Dale AM. Cortical surface-based analysis II: inflation, flattening and a surface-based coordinate system. NeuroImage. 1999;9:195–207. doi: 10.1006/nimg.1998.0396. [DOI] [PubMed] [Google Scholar]
- Fischl B, van der Kouwe A, Destrieux C, Halgren E, Ségonne F, Salat D, Busa E, Seidman L, Goldstein J, Kennedy D, Caviness V, Makris N, Rosen B, Dale A. Automatically Parcellating the Human Cerebral Cortex. Cereb Cortex. 2004 Jan;14(1):11–22. doi: 10.1093/cercor/bhg087. PMID: 14654453. [DOI] [PubMed] [Google Scholar]
- Fischl B, Rajendran N, Busa E, Augustinack J, Hinds O, Yeo BTT, Mohlberg H, Amunts K, Zilles K. Cortical Folding Patterns and Predicting Cytoarchitecture. Cereb Cortex. 2008;18(8):1973–1980. doi: 10.1093/cercor/bhm225. [DOI] [PMC free article] [PubMed] [Google Scholar]
- Frey BJ, Dueck D. Clustering by passing messages between data points. Science. 2007;315:972–976. doi: 10.1126/science.1136800. [DOI] [PubMed] [Google Scholar]
- Geng G, Johnston L, Yan E, Walker D, Egan G. Modelling cerebral cortical folding; Proceedings of Workshop on Computational Biomechanisms, International Conference on Medical Image Computing & Computer Assisted Intervention; 2007. pp. 55–64. [Google Scholar]
- Geng Guangqiang, Johnston Leigh A, Yan Edwin, Britto Joanne M, Smith David W, Walker David W, Egan Gary F. Biomechanisms for Modelling Cerebral Cortical Folding. Medical Image Analysis. 2009;13(6):920–930. doi: 10.1016/j.media.2008.12.005. [DOI] [PubMed] [Google Scholar]
- Goldman-Rakic P, Galkin T. Prenatal removal of frontal association cortex in the fetal rhesus monkey: anatomical and functional consequences in postnatal life. Brain Res. 1978;152:451–485. doi: 10.1016/0006-8993(78)91103-4. [DOI] [PubMed] [Google Scholar]
- Goldman-Rakic P. Morphological consequences of prenatal injury to the primate brain. Prog Brain Res. 1980;53:3–19. [PubMed] [Google Scholar]
- Goldman-Rakic P. Specification of cerebral cortical areas. Science. 1988;241:170–176. doi: 10.1126/science.3291116. [DOI] [PubMed] [Google Scholar]
- Hardan Antonio Y, Jou Roger J, Keshavan Matcheri S, Varma Ravi, Minshew Nancy J. Increased frontal cortical folding in autism: a preliminary MRI study, Psychiatry Research: Neuroimaging. 2004;131(33):263–268. doi: 10.1016/j.pscychresns.2004.06.001. [DOI] [PubMed] [Google Scholar]
- Han Xiao, Xu Chenyang, Braga-Neto Ulisses, Prince Jerry L. Topology Correction in Brain Cortex Segmentation Using a Multi-Scale, Graph-Based Algorithm. IEEE Trans. Med. Imaging. 2002;21(2):109–121. doi: 10.1109/42.993130. [DOI] [PubMed] [Google Scholar]
- Highley JR, DeLisi LE, Roberts N, Webb JA, Relja M, Razi K, Crow TJ. Sex-dependent effects of schizophrenia: an MRI study of gyral folding, and cortical and white matter volume. Psychiatry Research Neuroimaging. 2003;124:11–23. doi: 10.1016/s0925-4927(03)00076-3. [DOI] [PubMed] [Google Scholar]
- Hilgetag CC, Barbas H. Developmental mechanics of the primate cerebral cortex. Anat Embryol (Berl) 2005;210:411–417. doi: 10.1007/s00429-005-0041-5. [DOI] [PubMed] [Google Scholar]
- Jou RJ, Hardan AY, Keshavan MS. Reduced cortical folding in individuals at high risk for schizophrenia: A pilot study. Schizophrenia Research. 2005;75(2–3):309–313. doi: 10.1016/j.schres.2004.11.008. [DOI] [PubMed] [Google Scholar]
- Kantarci S, Al-Gazali L, Hill RS, Donnai D, Black GCM, Bieth E, Chassaing N, Lacombe D, Devriendt K, Teebi A, Loscertales M, Robson C, Liu T, MacLaughlin DT, Noonan KM, Russell MK, Walsh CA, Donahoe PK, Pober BR. Mutations in megalin, a multi-ligand receptor, cause Donnai-Barrow syndrome characterized by corpus callosum, ocular, neurosensory, craniofacial, and diaphragmatic defects. Nature Genetics. 2007;39:957–959. doi: 10.1038/ng2063. [DOI] [PMC free article] [PubMed] [Google Scholar]
- Kulynych JJ, Luevano LF, Jones DW, Weinberger DR. Cortical abnormality in schizophrenia: an in vivo application of the gyrification index. Biol Psychiatry. 1997;41:995–999. doi: 10.1016/S0006-3223(96)00292-2. [DOI] [PubMed] [Google Scholar]
- Lefèvre J, Leroy F, Khan S, Dubois J, Huppi PS, Baillet S, Mangin JF. Identification of Growth Seeds in the Neonate Brain through Surfacic Helmholtz Decomposition. 2009:252–263. doi: 10.1007/978-3-642-02498-6_21. IPMI2009, LNCS5636. [DOI] [PubMed] [Google Scholar]
- Levenberg K. A Method for the Solution of Certain Problems in Least Squares. Quart. Appl. Math. 1944;2:164–168. [Google Scholar]
- Levine D, Barnes PD. Cortical maturation in normal and abnormal fetuses as assessed with prenatal MR imaging. Radiology. 1999;210:751–758. doi: 10.1148/radiology.210.3.r99mr47751. [DOI] [PubMed] [Google Scholar]
- Li Gang, Liu Tianming, Nie Jingxin, Guo Lei, Wong Stephen. A Novel Method for Cortical Sulcal Fundi Extraction. Lecture Notes In Computer Science. 2008;Vol. 5241:270–278. doi: 10.1007/978-3-540-85988-8_33. [DOI] [PubMed] [Google Scholar]
- Liu T, Shen D, Davatzikos C. Deformable Registration of Cortical Structures via Hybrid Volumetric and Surface Warping. NeuroImage. 2004;22(4):1790–1801. doi: 10.1016/j.neuroimage.2004.04.020. [DOI] [PubMed] [Google Scholar]
- Liu Tianming, Li Hai, Wong Kelvin, Tarokh Ashley, Guo Lei, Wong Stephen. Brain Tissue Segmentation Based on DTI Data. NeuroImage. 2007;38(1):114–123. doi: 10.1016/j.neuroimage.2007.07.002. [DOI] [PMC free article] [PubMed] [Google Scholar]
- Lohmann G, von Cramon DY, Colchester ACF. Colchester, Deep Sulcal Landmarks Provide an Organizing Framework for Human Cortical Folding. Cereb Cortex. 2008;18:1415–1420. doi: 10.1093/cercor/bhm174. [DOI] [PubMed] [Google Scholar]
- Lohmann Gabriele, von Cramon DYves. Automatic labelling of the human cortical surface using sulcal basins. Medical Image Analysis. 2000;vol 4(3):179–188. doi: 10.1016/s1361-8415(00)00024-4. [DOI] [PubMed] [Google Scholar]
- Mangin JF, Riviere D, Cachia A, Duchesnay E, Cointepas Y, Papadopoulos-Orfanos D, Scifo P, Regis J. A framework to study the cortical folding patterns. NeuroImage. 2004;23:S129–S138. doi: 10.1016/j.neuroimage.2004.07.019. [DOI] [PubMed] [Google Scholar]
- Marquardt D. An Algorithm for Least Squares Estimation on Nonlinear Parameters. SIAM J. Appl. Math. 1963;11:431–441. [Google Scholar]
- Mochida GH, Walsh CA. Genetic basis of developmental malformations of the cerebral cortex. Arch Neurol. 2004;61(5):637–640. doi: 10.1001/archneur.61.5.637. [DOI] [PubMed] [Google Scholar]
- Narr KL, Bilder RM, Kim S, Thompson PM, Szeszko P, Robinson D, Luders E, Toga AW. Abnormal gyral complexity in first-episode schizophrenia. Biological Psychiatry. 2004;55(8):859–867. doi: 10.1016/j.biopsych.2003.12.027. [DOI] [PubMed] [Google Scholar]
- Neal J, Takahashi M, Silva M, Tiao G, Walsh CA, Sheen VL. Insights into the gyrification of developing ferret brain by magnetic resonance imaging. J Anat. 2007;210(1):66–77. doi: 10.1111/j.1469-7580.2006.00674.x. [DOI] [PMC free article] [PubMed] [Google Scholar]
- Nie J, Guo L, Liu T. A computational model of cerebral cortex folding. Medical Image Computing and Computer Assisted Intervention (MICCAI) 2009 doi: 10.1007/978-3-642-04271-3_56. in press. [DOI] [PMC free article] [PubMed] [Google Scholar]
- Sallet Paulo C, Elkis Helio, Alves Tania M, Oliveira Jose R, Sassi Erlei, de Castro Claudio Campi, Busatto Geraldo F, Gattaz Wagner F. Reduced Cortical Folding in Schizophrenia: An MRI Morphometric Study Am J Psychiatry. 2003;160:1606–1613. doi: 10.1176/appi.ajp.160.9.1606. [DOI] [PubMed] [Google Scholar]
- Raghavan R, Lawton W, Ranjan SR, Viswanathan RR. A continuum mechanics-based model for cortical Growth. J. Theor. Biol. 1997;187:285–296. [Google Scholar]
- Régis J, Mangin JF, Ochiai T, Frouin V, Rivière D, Cachia A, Tamura M, Samson Y. “Sulcal root” generic model: a hypothesis to overcome the variability of the human cortex folding patterns. Neurol. Med.-Chir. (Tokyo) 2005;45:1–17. doi: 10.2176/nmc.45.1. [DOI] [PubMed] [Google Scholar]
- Rettmann ME, Kraut MA, Prince JL, Resnick SM. Crosssectional and longitudinal analyses of anatomical sulcal changes associated with aging. Cereb. Cortex. 2006;vol. 16:1584–1594. doi: 10.1093/cercor/bhj095. [DOI] [PubMed] [Google Scholar]
- Shattuck DW, Leahy RM. Automated graph-based analysis and correction of cortical volume topology. IEEE Trans. Med. Imag. 2001;v 20:11. doi: 10.1109/42.963819. [DOI] [PubMed] [Google Scholar]
- Shen D, Davatzikos C. HAMMER: hierarchical attribute matching mechanism for elastic registration. IEEE Trans. Med. Imag. 2002;21(11):1421–1439. doi: 10.1109/TMI.2002.803111. [DOI] [PubMed] [Google Scholar]
- Schaer Marie, Eric Schmitt J, Glaser Bronwyn, Lazeyras Franc¸ois, Delavelle Jacqueline, Eliez Stephan. Abnormal patterns of cortical gyrification in velo-cardio-facial syndrome (deletion 22q11.2): An MRI study. Psychiatry Research: Neuroimaging. 2006;146:1–11. doi: 10.1016/j.pscychresns.2005.10.002. [DOI] [PubMed] [Google Scholar]
- Sun T, Walsh CA. Molecular approaches to brain asymmetry and handedness. Nat Rev Neurosci. 2006 Aug;7(8):655–662. doi: 10.1038/nrn1930. [DOI] [PubMed] [Google Scholar]
- Talairach J, Tournoux P. Co-planar Stereotaxic Atlas of the Human Brain. New York: Thieme; 1988. [Google Scholar]
- Tao Xiaodong, Jerry Jerry L, Davatzikos Christos. Using a Statistical Shape Model to Extract Sulcal Curves on the Outer Cortex of the Human Brain. IEEE Trans. Med. Imag. 2002 May;21(5):513–524. doi: 10.1109/TMI.2002.1009387. [DOI] [PubMed] [Google Scholar]
- Thompson PM, Toga AW. A surface-based technique for warping three-dimensional images of the brain. IEEE Trans. Med. Imag. 1996;15(4):402–417. doi: 10.1109/42.511745. [DOI] [PubMed] [Google Scholar]
- Toro R, Burnod Y. A Morphogenetic Model of the Development of Cortical Convolutions. Cerebral Cortex. 2005;15:1900–1913. doi: 10.1093/cercor/bhi068. [DOI] [PubMed] [Google Scholar]
- Toro R, Perron M, Pike B, Richer L, Veillette S, Pausova Z, Paus T. Brain Size and Folding of the Human Cerebral Cortex. Cerebral Cortex. 2008;18(10):2352–2357. doi: 10.1093/cercor/bhm261. [DOI] [PubMed] [Google Scholar]
- Ulay HT, Ertuğrul A. Neuroimaging Findings in Auti sm: A Brief Review. Turk Psikiyatri Derg. 2009;20(2):164–174. 2009 Summer. [PubMed] [Google Scholar]
- Van Essen D. A tension-based theory of morphogenesis and compact wiring in the central nervous system. Nature. 1997;385:313–318. doi: 10.1038/385313a0. [DOI] [PubMed] [Google Scholar]
- Van Essen H, Drury A, Joshi S, Miller MI. Functional and structural mapping of human cerebral cortex: solutions are in the surfaces. Proc. Natl. Acad. Sci. 1998;95(3):788–795. doi: 10.1073/pnas.95.3.788. [DOI] [PMC free article] [PubMed] [Google Scholar]
- Venita J. Pathology in an infant with Down’s syndrome and Tuberous Sclerosis. Pediatrics Neurology. 1996;15:57–59. doi: 10.1016/0887-8994(96)00088-4. [DOI] [PubMed] [Google Scholar]
- Welker W. Why does cerebral cortex fissure and fold? A review of determinants of gyri and sulci. In: Jones E, Peters A, editors. Cerebral cortex. vol. 8b. New York: Plenum Press; 1990. pp. 3–136. [Google Scholar]
- Wisco Jonathan J, Kuperberg Gina, Manoach Dara, Quinn Brian T, Busa Evelina, Fischl Bruce, Heckers Stephan, Gregory Sorensen A. Abnormal cortical folding patterns within Broca's area in schizophrenia: Evidence from structural MRI. Schizophr Res. 2007 August;94(1–3):317–327. doi: 10.1016/j.schres.2007.03.031. [DOI] [PMC free article] [PubMed] [Google Scholar]
- Yeo BTT, Yu P, Grant PE, Fischl B, Golland P. Shape Analysis with Overcomplete Spherical Wavelets; Proceedings of the International Conference on Medical Image Computing and Computer Assisted Intervention (MICCAI); 2008. pp. 468–476. of LNCS. [DOI] [PMC free article] [PubMed] [Google Scholar]
- Yu P, Yeo BTT, Grant PE, Fischl B, Golland P. Cortical Folding Development Study based on Over-complete Spherical Wavelets; Proceedings of the Workshop on Mathematical Methods in Biomedical Image Analysis (MMBIA), International Conference on Computer Vision; 2007. [DOI] [PMC free article] [PubMed] [Google Scholar]
- Peng Yu, Xiao Han, Segonne F, Pienaar R, Buckner RL, Golland P, Grant PE, Fischl B. Cortical Surface Shape Analysis Based on Spherical Wavelets. IEEE Transaction on Medical Imaging. 2007;26(4):582–597. doi: 10.1109/TMI.2007.892499. [DOI] [PMC free article] [PubMed] [Google Scholar]
- Zhang T, Guo L, Li G, Nie J, Liu T. Parametric representation of cortical surface folding via polynomials. Medical Image Computing and Computer Assisted Intervention (MICCAI) 2009 doi: 10.1007/978-3-642-04271-3_23. [DOI] [PMC free article] [PubMed] [Google Scholar]
- Zhu D, Li K, Guo L, Liu T. Bezier Control Points Image: A Novel Shape Representation Approach for Medical Imaging; 43rd Annual Asilomar Conference on Signals, Systems, and Computers; 2009. [DOI] [PMC free article] [PubMed] [Google Scholar]
- Zilles K, Armstrong E, Schleicher A, Kretschmann HJ. The human pattern of gyrification in the cerebral cortex. Anat Embryol (Berl) 1988;179:173–179. doi: 10.1007/BF00304699. [DOI] [PubMed] [Google Scholar]
- Tuo Zhang, Lei Guo, Gang Li, Jingxin Nie, Tianming Liu. Parametric representation of cortical surface folding via polynomials. Medical Image Computing and Computer Assisted Intervention (MICCAI) 2009 doi: 10.1007/978-3-642-04271-3_23. [DOI] [PMC free article] [PubMed] [Google Scholar]


