

Class XI myosins are unique to plants and known to function in cytoplasmic streaming. This study demonstrates that the two myosin XI genes present in the moss Physcomitrella patens are functionally redundant, localize to the apical region of actively growing protonemal cells, and play a key role in tip growth.
Abstract
Class XI myosins are plant specific and responsible for cytoplasmic streaming. Because of the large number of myosin XI genes in angiosperms, it has been difficult to determine their precise role, particularly with respect to tip growth. The moss Physcomitrella patens provides an ideal system to study myosin XI function. P. patens has only two myosin XI genes, and these genes encode proteins that are 94% identical to each other. To determine their role in tip growth, we used RNA interference to specifically silence each myosin XI gene using 5′ untranslated region sequences. We discovered that the two myosin XI genes are functionally redundant, since silencing of either gene does not affect growth or polarity. However, simultaneous silencing of both myosin XIs results in severely stunted plants composed of small rounded cells. Although similar to the phenotype resulting from silencing of other actin-associated proteins, we show that this phenotype is not due to altered actin dynamics. Consistent with a role in tip growth, we show that a functional, full-length fusion of monomeric enhanced green fluorescent protein (mEGFP) to myosin XI accumulates at a subcortical, apical region of actively growing protonemal cells.
INTRODUCTION
Plant growth is a complex process, which at the cellular level is attained by patterns of cell division and expansion. To investigate cellular morphogenesis, we are using the moss Physcomitrella patens as a model organism. Because of its simple growth pattern and powerful molecular tools, moss provides a fast system to analyze gene function in the context of cell growth (Cove et al., 2006; Vidali et al., 2007, 2009c). Moss protonemata expand by polarized or tip growth (Menand et al., 2007). This is accomplished by deposition of membrane and wall components to the growing region of the cell. Several lines of evidence indicate that the actin cytoskeleton plays an essential role in this process (Doonan et al., 1988; Vidali et al., 2007, 2009a, 2009c; Augustine et al., 2008). Nevertheless, the molecular mechanisms underlying the role of actin in tip growth are not well understood.
Protonemata contain a cortical F-actin network at their apex (Finka et al., 2007; Vidali et al., 2009a). This structure is composed of highly dynamic actin filaments, which are essential for tip growth (Vidali et al., 2009a). One possible role for the apical F-actin network is to regulate the location and rate of cell wall material deposition, perhaps in combination with myosin XI function. In support of this, deletion analysis of a subset of myosin XIs in Arabidopsis thaliana suggests that myosin XI contributes to tip growth in root hairs (Prokhnevsky et al., 2008).
Class XI myosins have only been identified in plants. They are most similar to class V myosins from animals and fungi (Mooseker and Cheney, 1995), in which homology is strikingly conserved throughout the protein, from the motor to the globular tail domain (Li and Nebenfuhr, 2007). In vascular plants and the Characean algae, these proteins are responsible for cytoplasmic streaming and for subcellular organelle transport (Shimmen and Yokota, 2004). To date, localization of full-length myosin XI in live plant cells is not known. Using antibody localization in fixed cells, a subset of myosin XIs have been found to be associated with peroxisomes (Hashimoto et al., 2005), while others have been identified on the endoplasmic reticulum (Yokota et al., 2008) and at the tip of pollen tubes (Yokota et al., 1995). In vivo studies have analyzed the localization of fluorescently tagged globular tail (Li and Nebenfuhr, 2007; Reisen and Hanson, 2007) or head domains (Walter and Holweg, 2008), but so far not a full-length molecule. Fluorescent tail constructs localize to peroxisomes and at a lower frequency to Golgi and mitochondria (Li and Nebenfuhr, 2007; Reisen and Hanson, 2007). By contrast, expression of the motor domain of myosin XI accumulates on actin filaments (Walter and Holweg, 2008).
Functional characterization of myosin XI has also been challenging due to the large number of isoforms present in many plants. For example, in Arabidopsis, there are 13 class XI myosins (Reddy and Day, 2001; Peremyslov et al., 2008). Analyses of knockout lines and dominant-negative approaches have implicated a subset of these myosins in organelle transport and root hair elongation (Ojangu et al., 2007; Peremyslov et al., 2008; Prokhnevsky et al., 2008).
In this study, we used P. patens to characterize myosin XI function and localization. Moss offers a simpler system to investigate myosin XI function and regulation; in contrast with the 13 isoforms present in Arabidopsis, there are only two myosin XI genes in moss. Here, we show that myosin XI plays an essential role in tip growth and that the two genes present in P. patens are functionally redundant. We also show that a fluorescently tagged full-length myosin XI is fully functional and localizes to the apex of growing cells.
RESULTS
P. patens Has Two Myosin XI Genes
Detailed analysis of the P. patens genome revealed the presence of eight myosin motor domains. On the basis of sequence similarity with other plant myosins, three can be assigned to class XI and five to class VIII. No other sequences related to the myosin motor domain are present in the genome. Of the three myosin XI motor domains, only two have the additional sequences encoding domains present in canonical myosin XI proteins; namely, a neck domain containing six light chain binding or IQ motifs, a predicted coiled-coil, and a putative globular tail domain at the C terminus (Figure 1). The third myosin XI motor domain sequence encodes a motor domain only. We investigated whether this tail-less myosin is expressed by RT-PCR of protonemal mRNA and were unable to detect expression of a transcript derived from this sequence. Therefore, we did not attempt to characterize it further; instead, we focused our efforts on characterizing the remaining two myosin XI genes, myoXIa and myoXIb.
Figure 1.

Schematic Diagram of Myosin XI Genes in P. patens and Arabidopsis.
The primary structure with conserved protein domains is shown as a bar diagram on top. Motor domain is light gray. Neck is dark gray. Coiled-coil is white, and the tail is black. The exons encoding these conserved domains in the lower three diagrams are colored accordingly. The untranslated regions are represented by medium gray boxes lacking a black border. Intron-exon boundaries were determined by comparing the cDNA and genomic sequences. Sites within exons used to design the RNAi constructs are underlined in black. The sites that differ in the transcripts of the two variants of myosin XIa observed are indicated by arrows.
The intron-exon distribution of both myosin XI genes is very similar, and it is conserved with that of Arabidopsis MYA1 (Figure 1). In both cases, the ATG codon is located at the end of the first exon; this characteristic is also conserved in MYA1. We assigned 5′ and 3′ untranslated regions (UTRs) based on the presence of EST sequences. The intron-exon boundaries are highly conserved between the MYA1 gene and both moss myosin genes. The main differences are that MYA1 has significantly shorter introns and has one less exon that appears to be due to a fusion of the corresponding exons 35 and 36 of the P. patens myosin genes. At the nucleotide level, the moss myosin open reading frames are 88% identical to each other; at the protein level, they are 94% identical (98% similar). When compared with MYA1 across the whole molecule, the moss proteins are 63% identical (79% similar).
We obtained a full-length cDNA (pdp20423) encoding myoXIa from one of the EST collections (http://moss.nibb.ac.jp/). After sequencing, we found that pdp20423 contains two sequence variants not present in the genomic sequence. We verified the genomic sequence by sequencing PCR products spanning the regions encompassing the variants. The first variant is a 2-bp deletion after position 807, which generates a premature stop codon after amino acid 270 (Figure 1). The second variant is a missense mutation, resulting in a change from Thr to Ala at position 1477. To ensure that these sequence variants are present in the mRNA pool and not the result of reverse transcription infidelity, we sequenced cDNA synthesized from protonemal mRNA. For variant 1, we identified one of three cDNA fragments containing the genomically encoded sequence. For variant 2, we sequenced 11 cDNA fragments, but none contained the genomically encoded sequence. However, inspection of EST sources revealed the presence of at least one clone containing the genomic sequence (EST BJ960751.1). Although the Thr-to-Ala change is located at a residue conserved in many myosin XIs, an Ala substitution does not affect myosin XI function during tip growth (see below).
Myosin XI Is Essential for Protonemal Tip Growth
To investigate the role of myosin XI in tip growth, we used RNA interference (RNAi) to silence the expression of myoXIa and myoXIb in 1-week-old moss plants, which develop entirely from tip-growing protonemal cells. We previously established a robust system for fast gene silencing in P. patens in which a reporter line expressing a green fluorescent protein (GFP) fusion of β-glucuronidase (GUS) with a nuclear localization signal (NLS) is used to report on the activity of gene silencing (Bezanilla et al., 2005). This reporter line has a strong nuclear GFP signal that is suppressed by the expression of GUS inverted repeats. Using silencing constructs containing sequences of GUS fused to a gene of interest enables us to monitor gene suppression. We used this system successfully to silence the expression of single genes and gene families (Vidali et al., 2007, 2009c; Augustine et al., 2008).
We generated an RNAi construct, myoXIa+bCDS, that contains regions of the coding sequence of both myoXIa and myoXIb (Figure 1). These regions were located at the C terminus of the protein sequence, where the two molecules are slightly more divergent and, in particular, are very divergent from other myosins, preventing any silencing of class VIII myosins. We transformed the RNAi construct into moss protoplasts and allowed single protoplasts to regenerate into whole plants for 1 week. Expression of myoXIa+bCDS in 1-week-old plants causes a dramatic loss of growth polarity (Figure 2A; see Supplemental Figure 1 online). The plants lacking nuclear GFP fluorescence are severely stunted and composed of small, spherical cells, demonstrating that myosin XI is essential for tip growth. Myosin XI–silenced plants also have less than half the number of cells compared with control plants (Table 1), suggesting an additional delay in cell division.
Figure 2.

Myosin XI Is Essential for Tip Growth.
(A) Representative images of 1-week-old plants visualized by epifluorescence stereomicroscopy; the absence of nuclear GFP signal indicates that they are undergoing active gene silencing. The red fluorescence is the chlorophyll autofluorescence. The RNAi constructs present in the plants are indicated. Bar = 100 μm.
(B) Quantification of the RNAi-induced phenotype (control, n = 175; MyoXIa+bCDS, n = 85; MyoXIa5′UTR, n = 50; MyoXIb5′UTR, n = 50; MyoXIa+b5′UTR, n = 150). For the statistical significance of the comparison of the means, see Table 2. Error bars indicate se.
(C) and (D) Relative expression levels of MyoXIa (light gray) and MyoXIb (dark gray) normalized to Ubiquitin10 as determined by three independent real-time RT-PCR runs of RNA isolated from 1-week-old plants transformed with the indicated constructs. Error bars represent se. Inset in (C): relative expression level of MyoXIb normalized to Ubiquitin10.
Table 1.
Number of Nuclei in 1-Week-Old Moss Plants Transformed with the Indicated Constructs
| Average Number of Nuclei | se | |
| Control (n = 23) | 52.5 | 2.9 |
| MyoXIa+bCDS (n = 30) | 16.9 | 1.0 |
| MyoXIa+b5′UTR (n = 29) | 17.9 | 0.81 |
Number of plants analyzed is indicated in parentheses next to the construct name. Control versus MyoXIa+bCDS, P < 0.0001; control versus MyoXIa+b5′UTR, P < 0.0001; MyoXIa+bCDS versus MyoXIa+b5′UTR, P = 0.9041. Adjusted P values are shown for rejecting equivalence of means; values in bold indicate that the difference is statistically significant at the 0.05 level.
To quantify the morphological changes produced by silencing of myosin XI, we evaluated two parameters: plant area and solidity. Area is estimated by the thresholded chlorophyll autofluorescence acquired from images of individual silenced plants. Solidity is a unitless parameter defined as the ratio of area over convex hull area. The convex hull area is calculated from the shape of the thresholded chlorophyll autofluorescence. Solidity values approaching one correspond to rounder, more solid objects in which the area and convex hull area are similar. Solidity values approaching zero correspond to more branched structures. Since control plants are highly branched and elongated, the solidity value provides a sensitive measure of the degree of polarized growth. Silencing of myosin XI significantly reduces the total area of plants with a concomitant increase in solidity (Figure 2B). These studies were performed for large populations of plants, and the differences between control and myosin XI-RNAi plants have strong statistical support (Figure 2B, Table 2).
Table 2.
Statistical Analysis of RNAi-Induced Phenotypic Changes Evaluated from Morphological Parameters
| Area | Solidity | |
| Control versus MyoXIa+b CDS | <0.0001 | <0.0001 |
| Control versus MyoXIa 5′UTR | 0.9971 | 0.0033 |
| Control versus MyoXIb 5′UTR | 0.8171 | 0.0021 |
| Control versus MyoXIa+b 5′UTR | <0.0001 | <0.0001 |
| MyoXIa+b CDS versus MyoXIa+b 5′UTR | 0.0037 | 0.0035 |
Adjusted P values are shown for rejecting equivalence of means; values in bold indicate that the difference is statistically significant at the 0.05 level.
To determine if the two myosin XI isoforms are functionally redundant with respect to tip growth, we generated specific RNAi constructs, targeting sequences from the 5′UTR of each gene. Expression of either myoXIa5′UTR or myoXIb5′UTR has no effect on plant size or polarity (Figures 2A and 2B, Table 2). Importantly, expression of an RNAi construct containing the 5′UTR sequences from both myoXIa and myoXIb, myoXIa+b5′UTR, phenocopies the coding sequence construct, generating small plants with a high solidity value (Figures 2A and 2B, Table 2).
To ensure that myosin XI transcripts were silenced in GFP-deficient plants, we picked plants lacking GFP fluorescence and isolated RNA. We performed real-time RT-PCR analysis with primers specific for the myoXIa and myoXIb transcripts. In plants transformed with the control RNAi construct, myoXIa is expressed 60- to 200-fold higher than myoXIb (Figures 2C and 2D). When transformed with myoXIa+bCDS or myoXIa+b5′UTR, the total myosin XI transcript levels are reduced by 52 or 69%, respectively (Figure 2C), with the majority of the reduction detected in the myoXIa transcript. Since we did not observe a phenotype when we silenced myoXIa only with the myoXIa5′UTR construct, we hypothesized that myoXIb transcript levels are elevated to compensate for the loss of myoXIa. To test this, we used quantitative real-time RT-PCR to measure levels of myosin XI transcripts in plants transformed with either myoXIa5′UTR or myoXIb5′UTR, the RNAi constructs specific for each gene. In the myoXIa5′UTR transformed plants, we detected a 90% reduction in the myoXIa transcript and a concomitant 690% increase in the myoXIb transcript. These data support the conclusion that two myosin XI genes are functionally redundant and suggest that there is a threshold level of myosin XI transcript required for tip growth. Interestingly, in control plants, the myoXIa transcript is present at levels far above the apparent threshold.
F-Actin Organization Is Altered in Myosin XI–Deficient Cells
To determine the effect of myosin XI-RNAi on the organization of F-actin, we stained cells with fluorescent phalloidin. When compared with control cells, we found that myosin XI-RNAi cells have disorganized F-actin (Figure 3A). Control cells show a longitudinal orientation of cortical F-actin with an accumulation at their apex. By contrast, the spherical cells that result from RNAi of myosin XI have a disorganized cortical network of filaments (Figure 3A). To compare the level of organization of F-actin, we used a fast Fourier transform (FFT) analysis (Marga et al., 2005; Vidali et al., 2007) in which the resulting Fourier transforms of F-actin images are fit with an ellipse (Figure 3B). Images with longitudinally oriented cables produce more oblong elliptical transforms with higher eccentricity values, while disordered F-actin organization leads to more circular transforms and lower eccentricity values. This analysis confirms our observations that myosin XI-RNAi cells have lost F-actin longitudinal orientation (Figure 3B), similar to cells lacking other regulators of actin, such as profilin (Vidali et al., 2007) and formin (Vidali et al., 2009c)
Figure 3.

Actin Organization Is Altered in Myosin XI-RNAi Cells.
(A) Alexa-488 phalloidin staining of F-actin in cells of plants undergoing RNAi. Note the presence of F-actin in myosin XI-RNAi cells but a loss of axial orientation. Images are maximal projections of 10 to 12 confocal sections with 0.5-μm spacing starting at the cortex closest to the cover slip. Bar = 10 μm.
(B) FFT analysis was performed on maximal projections from confocal Z-stacks of Alexa-488 phalloidin-stained cells. Using a plug-in written for ImageJ, an ellipse was fit to the central area of the FFT and its eccentricity calculated. A higher degree of axial orientation results in higher eccentricity (control, n = 18; MyoXIa+b, n = 7; t test equivalence of means rejected, P < 0.0001). Error bars represent se.
F-Actin Dynamics Are Not Altered in Myosin XI–Deficient Cells
In moss protonemata, F-actin constantly and rapidly rearranges, with events such as initiation and destruction of actin filaments occurring on the order of seconds (Vidali et al., 2009a). To investigate if this dynamic behavior is altered in myosin XI-RNAi cells, we generated a stable NLS-GFP-GUS line expressing Lifeact-monomeric enhanced green fluorescent protein (mEGFP), a live-cell actin binding probe (Vidali et al., 2009a). This line can be transiently transformed with RNAi constructs that specifically silence the nuclear GFP-GUS signal and the genes of interest, but retain the Lifeact-mEGFP signal. Myosin XI-RNAi cells are round due to loss of polarization. To compare actin dynamics in similarly shaped cells, we identified control protonemal cells that were in the early stages of branching. These cells are more spherical, but importantly have normal F-actin distribution (Vidali et al., 2007, 2009a). When compared with these control cells, we found that fluctuations in the actin organization, in part resulting from what seems to be polymerization, depolymerization, and translocations are similar between control and myosin XI-RNAi cells (Figure 4; see Supplemental Movies 1 and 2 online). These results suggest that myosin XI does not contribute to generating the fast F-actin rearrangements observed in protonemal cells.
Figure 4.

F-Actin Dynamics Are Unaltered in Myosin XI RNAi Plants.
(A) Lifeact-mEGFP was used to analyze the dynamic behavior of F-actin in control RNAi, myosinXI-RNAi, and wild-type plants treated with DMSO or with 20 μM Jasplakinolide. Representative images from a single focal plane time-lapse series at 8-s intervals are shown. Time is indicated in seconds. The merged image (far-right column) shows all three time points as separate color channels in a red, green, blue (RGB) image. Note that the Jasplakinolide-treated cell exhibits very minor changes in actin filament organization over the time-course analyzed, and this is represented by an almost completely white overlay in the merged image. Bar = 3 μm.
(B) and (C) Quantification of actin dynamics using two independent methods.
(B) Total differences per pixel were calculated from difference maps (control RNAi, n = 8; myosinXI RNAi, n = 7; DMSO, n = 5; Jasplakinolide, n = 5). These maps were generated by subtracting frames at increasing intervals at all possible temporal spacings (time interval).
(C) In a similar way, the correlation coefficient between two images was calculated at all possible temporal spacings (time interval). For statistical analyses, see Table 3. Error bars represent se.
To quantify changes in actin organization over time, we developed two algorithms that analyze the overall behavior of the F-actin array. In one algorithm, the intensity difference between two images separated by time is determined. The value of this difference corresponds to changes between the two images. To increase our sample size and improve sensitivity, we can analyze all temporal increments and average them. For example, all frames are separated by two seconds. We average the difference value of frames 1 versus 2, 2 versus 3, 3 versus 4, etc., and use the resulting average as the 2-s interval value. Then we analyze frames 1 versus 3, 2 versus 4, 3 versus 5, etc., and use the resulting average as the 4-s interval. We continue this process for all frames present in the time-lapse sequence. Because the filaments are changing, the difference value should increase as the temporal interval increases, and this is what we observe (Figure 4B).
The dynamic behavior of the actin array should be reflected in the degree to which the difference value increases. To verify this, we quantified actin dynamics in the Lifeact-mEGFP line treated with the solvent control, DMSO, or the actin stabilizing drug Jasplakinolide (Figure 4; see Supplemental Movies 3 and 4 online for representative sequences). When the drug is present, as expected, the increase in difference values is highly reduced compared with the DMSO control (Figure 4B, Table 3). Interestingly, the DMSO control exhibits almost identical F-actin dynamics compared with the control- and myosin-RNAi plants, supporting the observation that actin dynamics are not affected by the reduction in myosin XI levels (Table 3). In addition, the DMSO and Jasplakinolide data were acquired from standard protonemal cultures, which have more elongated cells and branches. Since the actin dynamics were indistinguishable between the DMSO and the RNAi cells, differences in cell shape do not seem to have a major effect on the dynamic behavior of actin.
Table 3.
Statistical Analyses of Total Difference and Correlation Coefficients as a Function of Temporal Intervals
| Difference/Correlation |
|||
| 20 s | 40 s | 60 s | |
| DMSO versus Jasplakinolide | 0.0036/<0.0001 | 0.0042/<0.0001 | 0.0092/<0.0001 |
| DMSO versus Control RNAi | 0.9651/0.8508 | 0.9922/0.9956 | 0.9822/1.0000 |
| DMSO versus Myosin XI RNAi | 0.9506/0.6861 | 0.9260/0.6117 | 0.9999/0.8809 |
| Jasplakinolide versus Control RNAi | 0.0039/<0.0001 | 0.0030/<0.0001 | 0.0108/<0.0001 |
| Jasplakinolide versus Myosin XI RNAi | 0.0005/<0.0001 | 0.0005/<0.0001 | 0.0128/<0.0001 |
| Control RNAi versus Myosin XI RNAi | 0.6833/0.1713 | 0.7488/0.3727 | 0.9772/0.8426 |
Adjusted P values are shown for rejecting equivalence of means; values in bold indicate that the difference is statistically significant at the 0.05 level.
An alternative way to evaluate changes between two images is to determine the correlation between them. In a similar way to the analysis outlined above, we calculated the correlation coefficient between all temporal intervals. We observed the expected decay in correlation as the temporal interval increased. Similar to the difference values, the correlation values of control-RNAi, DMSO-treated, and myosin-RNAi were not significantly different, while those of Jasplakinolide showed a much slower decay in the correlation coefficient values (Figure 4C, Table 3). In addition, the correlation analysis seems to be more sensitive to changes in dynamics, as denoted by the smaller errors associated with this analysis. Together, these results indicate that myosin XI does not have a major effect on actin dynamics.
Myosin XI-RNAi Can Be Rescued with a Single Myosin XI Gene
Complementation of loss-of-function phenotypes establishes the specificity of the observed RNAi phenotype and is also a powerful test of purposefully modified sequences. Here, we first tested whether expression of myoXIa cDNA from an exogenous promoter rescued the myoXIa+b-5′UTR-induced phenotype. This transient complementation assay enables evaluation of constructs within 1 week of transformation, and because large numbers of plants can be easily analyzed, the assay is statistically robust. We also tested for rescue with the myoXIa cDNA variants we identified as well as the genomically encoded myoXIa cDNA. The Thr-to-Ala variant [myoXIa (TtoA)] substantially rescued myoXIa+b-5′UTR when expressed from the 35S promoter, and importantly, the level of complementation is identical to the rescue achieved with the genomically encoded sequence (myoXIa) (Figures 5A and 5B). As expected, the stop codon variant [i.e., +35S:MyoXIa(STOP)] did not rescue myoXIa+b-5′UTR (Figures 5A and 5B). We also tested for rescue with different strength promoters driving myoXIa (TtoA). Using the same amount of plasmid for comparison, we found that the promoter does not affect complementation; cDNAs driven by the relatively moderate strength 35S or the strong maize (Zea mays) ubiquitin promoters produce similar levels of rescue (Figures 5A and 5B).
Figure 5.

Transient Complementation of Myosin XI-RNAi.
(A) Representative images of 1-week-old plants visualized by chlorophyll autofluorescence. The complementing construct used to rescue myoXIa+b 5′UTR is indicated after the plus sign. Rescue experiments were performed with 30 μg of complementing plasmid. Bar = 100 μm.
(B) Quantification of the degree of rescue by the complementing plasmids [control, n = 117; MyoXIa+b5′UTR, n = 111; +35S:MyoXIa(TtoA), n = 91; +Ubi:MyoXIa(TtoA), n = 50; +35S:MyoXIa, n = 43; +35S:MyoXIa(STOP), n = 25]. Error bars represent se. No statistical significance of the comparison of the means found [+35S:MyoXIa(TtoA) versus +Ubi:MyoXIa(TtoA): area P = 0.6340, solidity P = 0.2586; +35S:MyoXIa(TtoA) versus +Ubi:MyoXIa: area P = 0.9974, solidity P = 0.0987; MyoXIa+b 5′UTR versus +35S:MyoXIa(STOP): area P = 0.08891, solidity P = 0.5355]. Note that promoter strength and the Thr-to-Ala mutation have no effect on rescue, but the deletion that introduces a stop codon cannot rescue myoXIa+b 5′UTR.
(C) Representative images of 1-week-old plants visualized by chlorophyll autofluorescence. The amount of 35S-MyoXIa-cDNA (TtoA) plasmid is indicated. Bar = 100 μm.
(D) Quantification of the dependence of polarized growth on the levels of myosin XI. Numbers next to the data points indicate the number of plants analyzed. Error bars represent se. For these data, 117 plants were analyzed for the control, with an average area of 1.000 ± 0.0294 and solidity 0.3684 ± 0.0072.
To evaluate whether myosin expression level affects the degree of rescue, we performed complementation studies using different amounts of the rescuing plasmid. We found the degree of rescue had a roughly hyperbolic dependency on the amount of plasmid (Figures 5C and 5D). Low levels of myoXIa plasmid (<5 μg) partially rescue the loss-of-function phenotype, creating small plants with spherical branching cells. Intermediate levels of plasmid (5 to 10 μg) produce plants with an intermediate phenotype; cells are more elongated, but several of the branching cells maintain their spherical appearance. To obtain full and consistent rescue, 15 μg of myoXIa is required. Interestingly, we did not find a detrimental effect of up to 60 μg of plasmid, suggesting that moss can either tolerate high myosin XI levels or its expression is regulated.
Myosin XI Localizes to the Cell Apex
To gain insight into myosin XI function, we investigated its localization during growth. We fused three tandem mEGFPs (3xmEGFP) to the N terminus of myoXIa. We chose to use tandem mEGFPs to increase our signal-to-noise ratio, enabling prolonged observation by confocal microscopy. In addition, we used the maize ubiquitin promoter instead of the 35S promoter because it expresses consistently in all protonemal cell types, particularly the apical cell (Saidi et al., 2005; Vidali et al., 2009a). We generated a stable line expressing 3xmEGFP-myoXIa in the NLS-GFP-GUS background (GFP-myoXI). Using the GFP-myoXI line, we first determined whether the tagged myosin is functional by performing RNAi experiments. The 3xmEGFP-myoXIa construct lacks the endogenous 5′UTR sequence and hence should be resistant to the myoXIa+b5′UTR construct. Demonstrating functionality, the GFP-myoXI line is indistinguishable from controls in area and morphology when the endogenous myosin XIs are silenced (Figures 6A and 6B). Moreover, transforming with myoXIa+bCDS, which targets both the endogenous and the tagged myosin XIs, phenocopies the myosin XI-RNAi phenotype (Figures 6A and 6B). These data demonstrate that 3xmEGFP-myoXIa is fully functional.
Figure 6.

The Tagged 3xmEGFP-myoXIa Is Functional.
(A) Representative images of 1-week-old plants visualized by chlorophyll autofluorescence. Two images are shown for each condition. A stable line expressing 3xmEGFP-myosin XIa was transformed with the indicated RNAi constructs. Bar = 100 μm.
(B) Quantification of the growth phenotype resulting from the expression of the RNAi constructs (100 plants were analyzed for each condition; adjusted P values are shown for rejecting equivalence of means) (control versus MyoXIa+b5′UTR: area P = 0.9073, solidity P < 0.0001; control versus MyoXIa+bCDS: area P < 0.0001, solidity P < 0.0001). Note the normal phenotype in plants transformed with myoXIa+b 5′UTR but a clear loss of growth with myoXIa+bCDS. Error bars represent se.
(C) Quantification of GFP fluorescence from 1-week-old GFP-myoXI plants expressing the indicated RNAi constructs. 3xmEGFP-myoXIa is reduced by 70% in plants transformed with MyoXIa+bCDS (control, n = 44; MyoXIa+b5′UTR, n = 40; MyoXIa+bCDS, n = 26; Formin2 RNAi, n = 9). Adjusted P values are shown for rejecting equivalence of means (control versus MyoXIa+b5′UTR: P = 0.1155; control versus MyoXIa+bCDS: P < 0.0001; MyoXIa+b5′UTR versus MyoXIa+bCDS: P < 0.0001; MyoXIa+bCDS versus Formin2: P < 0.0001). Error bars represent se.
To ensure that the tagged myosin XI construct was silenced, we measured levels of GFP fluorescence in the GFP-myoXI plant transformed with control, myoXIa+b5′UTR, and myoXIa+bCDS constructs. We observed that the GFP fluorescence was reduced by 70% in the myoXIa+bCDS plants but not affected in the myoXIa+b5′UTR plants (Figure 6C). To confirm that the GFP fluorescence is not altered in plants with a similar phenotype, we silenced class II formins in the GFP-myoXI line. Formin2 RNAi plants are of similar size and shape to myosin XI RNAi plants (Vidali et al., 2009c). In these plants, we see similar levels of GFP fluorescence as the control and myoXIa+b5′UTR plants (Figure 6C), demonstrating that the phenotype observed in the myoXIa+bCDS plants is due to loss of myosin XI.
By confocal microscopy, the 3xmEGFP-myoXIa fluorescent signal is diffuse and cytosolic, but accumulates at the tips of growing caulonemal, chloronemal, and branching cells (Figures 7A, 7C, and 7D; see Supplemental Movies 5 to 7 online). In the absence of growth, this accumulation is not observed. Sometimes the fluorescence accumulation forms a well-defined spot near the cell apex (see arrow in Figure 7A). This spot is not static: in time-lapse sequences, it moves from one side of the cell apex to the other and becomes more or less distinct. To distinguish between fluctuations in signal intensity versus changes in the focal plane, we collected a series of optical sections, minimizing time between images, and made maximum projections (Figure 7A). This approach confirmed that the apical fluorescent spot changes both in position and intensity (Figure 7A). Interestingly, F-actin also forms a similar focal accumulation at the tip (Figure 7B; see Supplemental Movie 8 online) (Vidali et al., 2009a).
Figure 7.

Time-Lapse Imaging of Tagged Myosin XI and F-Actin.
(A) Localization of 3xmEGFP-myoXIa in a growing protonemal cell. Note the accumulation of fluorescent signal at the cell apex (arrow). Also note that the signal at the apex fluctuates in intensity.
(B) F-actin distribution in a different cell was visualized by Lifeact-mEGFP. Note the similar accumulation (arrow) and fluctuation to that of myosin XI at the cell apex. In (A) and (B), each time point is a maximal projection of five optical sections acquired at 1-μm intervals.
(C) and (D) Single focal plane images of 3xmEGFP-myoXIa in an emerging branch (C) and the apex of a chloronemal cell (D). Bar = 3 μm, and time is indicated in seconds.
To determine if myosin XI localization depends on the dynamic state of the actin, we imaged cells that were treated for 30 min with 20 μM Jasplakinolide (Figure 8). In the medial portion of the cell, we observed that the F-actin apical focal accumulation dissipates in the presence of Jasplakinolide (Figure 8A). Similarly, the myosin XI concentration at the apical region dissipates, and we are only able to detect cytoplasmic fluorescence (Figure 8B). These data suggest that the apical actin focal point is composed of highly dynamic actin filaments, and this dynamic pool of actin is required for myosin XI apical accumulation.
Figure 8.

Stabilization of the Actin Cytoskeleton Delocalizes Myosin XI from the Apex of the Cell.
(A) Two representative images of F-actin distribution visualized with Lifeact-mEGFP in cells treated with DMSO (left panels) or with 20 μM Jasplakinolide (right panels) for 30 min.
(B) Two representative images of 3xmEGFP-myoXIa cells treated with DMSO (left panels) or with 20 μM Jasplakinolide (right panels) for 30 min. Images are the maximal projection of five focal planes acquired at 1-μm intervals from the medial section of the cells. Bar = 5 μm.
DISCUSSION
Here, we show that myosin XI is essential for tip growth. In vascular plants, previous studies altered myosin XI function by either insertional knockouts or dominant-negative constructs (Hashimoto et al., 2005; Ojangu et al., 2007; Peremyslov et al., 2008; Prokhnevsky et al., 2008; Sparkes et al., 2008). Compared with P. patens, vascular plants contain many more isoforms of myosin XI, significantly complicating functional studies. Single and double insertion mutants in a subset of myosin XI genes from Arabidopsis have defects in organelle transport (Peremyslov et al., 2008; Prokhnevsky et al., 2008). Some mutants also have stunted root hairs, although polar outgrowths are still present (Ojangu et al., 2007; Peremyslov et al., 2008; Prokhnevsky et al., 2008). The dominant-negative approach, which relies on overexpression of the tail domain of myosin XI, has been used to investigate global loss of myosin XI function (Sparkes et al., 2008). It is expected that overexpression of the tail domain will sequester critical tail-interacting proteins. These studies have lead to somewhat contradictory results (Reisen and Hanson, 2007; Sparkes et al., 2008), which may result from different levels of overexpression. In addition, the myosin tails may sequester essential molecules, thus further confusing the analysis. Our RNAi assay has a key advantage over these other approaches. Namely, we are able to observe the terminal phenotype resulting from silencing of all members of the myosin XI gene family within 1 week of transformation.
In addition, by using specific RNAi constructs containing UTR sequences together with expression analyses, we have demonstrated that the two myosin XI genes in moss are functionally redundant, with the myoXIa gene being the predominantly expressed gene during protonemal growth. Importantly, when both UTR sequences are used in the same RNAi construct, we are able to phenocopy the coding sequence constructs, underscoring the specificity of our constructs. Because the plants are so severely affected when both myosin XI genes are silenced, it would not have been possible to use a knockout approach to study this phenotype. In vascular plants, such as Arabidopsis, it is plausible that multiple myosin XI isoforms are partially redundant with respect to tip growth and that the appropriate mutant combination has yet to be generated to completely abrogate root hair and pollen tube growth. Additionally, as is the case for moss myosins, the complement of myosins in Arabidopsis required for proper tip growth may also be required for viability; therefore, a full loss-of-function mutant may be embryonic lethal.
Using a rapid transient rescue assay, we show that a single myosin XI gene is sufficient for tip growth. Interestingly, an excess amount of the rescuing plasmid does not appear to affect growth area and polarity, suggesting that overexpression of myosin XI does not abrograte growth. However, upon imaging plants containing 3xmEGFP-myosin XI, the fluorescent signal was found to be very weak in comparison with lines overexpressing mEGFP alone. Thus, it is likely that the myosin XI transcript or protein levels, particularly from myoXIa, are tightly regulated.
Plants lacking myosin XI function closely resemble plants that have been silenced for proteins critical for actin dynamics, such as profilin, ADF, and formin (Vidali et al., 2007, 2009c; Augustine et al., 2008). Loss of function of these actin binding proteins results in severely stunted plants composed of small spherical cells. Silencing of these proteins, like silencing of myosin XI, results in cells with disorganized F-actin (Vidali et al., 2007, 2009c). Whether F-actin organization relies directly on myosin XI still needs to be examined, and we are currently developing tools, such as conditional alleles, to address this complex question (Vidali et al., 2009b). However, it is clear that F-actin dynamics are critical for tip growth. Tip-growing cells treated with latrunculin immediately stop growing (Vidali et al., 2001, 2009a). Surprisingly, and assuming that our difference and correlation analyses are sensitive to changes in polymerization/depolymerization and translocation of F-actin, we show that myosin XI is not directly involved in regulating these dynamics. This suggests that myosin XI may be involved in either organizing the F-actin network or moving vesicles to and away from the site of growth.
Consistent with a role in polarized secretion, we found that 3xmEGFP-myoXIa concentrates subcortically at the apex of growing cells. This localization is different from that of mEGFP alone (see Supplemental Figure 2 and Supplemental Movie 9 online). Additionally, in contrast with other localization studies, which have analyzed the localization of myosin XI and myosin XI subdomains (Yokota et al., 1995, 2008; Hashimoto et al., 2005; Li and Nebenfuhr, 2007; Reisen and Hanson, 2007), 3xmEGFP-myoXIa does not localize to organelles. P. patens protonemal cells have no cytoplasmic streaming and show only slow saltatory organellar movements, which is in contrast with the rapid cytoplasmic streaming and organelle motility observed in many vascular plants. Our localization studies are consistent with these slower rates of organelle motility. Future studies will focus on identifying the nature of the subcortical region containing myosin XI and its cargo.
In addition to being localized to the subcortical region of the apex, 3xmEGFP-myoXIa accumulation fluctuates. We used time-lapse coupled, three-dimensional imaging to determine that the position of the apical cluster moves in three dimensions in and out of the medial plane of the cell, and importantly it also fluctuates in intensity. We observed similar fluctuations in apical actin residing in the medial section of cells (Vidali et al., 2009a; Figure 6), suggesting that myosin XI accumulation is correlated with that of actin. In support of this, when cells are treated with Jasplakinolide, which stabilizes the actin cytoskeleton, we observe that both the apical actin focal point and the myosin XI accumulation dissipate. This suggests that dynamic actin is required for myosin XI localization. Similar to what has been observed in yeast (Kozubowski et al., 2008), we hypothesize that these fluctuations might result from a feedback loop regulating the distribution of myosin and its cargo. Alterations in this feedback mechanism, at the level of F-actin dynamics, organization, or secretion, would result in disruption of tip growth. Consistent with this, we observed that moss lacking critical regulators of F-actin dynamics and organization result in round cells with altered F-actin organization (Vidali et al., 2007, 2009c; Augustine et al., 2008). We suggest that myosin XI's role in this cycle is to either organize F-actin or drive secretion to the site of tip growth.
METHODS
cDNA Preparation, PCR Amplification, and Site-Directed Mutagenesis
The full-length cDNA (pdp20423) of Physcomitrella patens myosin XIa was obtained from the Physcobase collection (http://moss.nibb.ac.jp/). The complete open reading frame was amplified (see Supplemental Table 1 online) and cloned into pENT/D-TOPO following the manufacturer's recommendations (Invitrogen), generating pdp20423-pENT. The pdp20423 clone contained both the 2-bp deletion and the point mutation near the 3′ end of the gene. To alter these variants to reflect the genomically encoded sequence, cDNA was prepared from total mRNA using myosin XIa–specific primers (see Supplemental Table 1 online). The first variant site fragment was cloned into pGEM-Teasy (Promega), generating var1-pGEM, and the second variant site fragment was cloned into pENT/D-TOPO, generating var2-pENT. Three independent var1-pGEM clones were sequenced, and one contained the genomically encoded sequence, var1g-pGEM. We used Bsu36I restriction enzyme sites flanking the site of the first variant from var1g-pGEM to replace the altered sequence in pdp20423-pENT. Eleven var2-pENT clones were sequenced, but none contained the genomically encoded sequence. Therefore, to change the second variant sequence to those present in the genomic sequence, PCR-based mutagenesis on var2-pENT was performed as previously described (Vidali et al., 2007; see Supplemental Table 1 online), generating var2g-pENT. Changes were verified by sequencing. NdeI and AscI sites flanking the site of the second variant were used to insert the corrected sequence from var2g-pENT into the clone in which the first mutation was already altered to match the genomic sequence according to the P. patens genome (http://genome.jgi-psf.org/Phypa1_1/Phypa1_1.home.html). The resulting construct, pdp20423g-pENT, was transferred via an LR clonase reaction (Invitrogen) to the destination vectors pTH-UbiGate and pTH-35SGate. This results in the expression constructs pTH-Ubi-myoXIa and pTH-35S-myosXIa. Similar manipulations were used to generate expression constructs containing the sequence variants.
Myosin XI RNAi Constructs
The generation of constructs for RNAi-based gene silencing was performed as previously described (Vidali et al., 2007, 2009c). Briefly, segments corresponding to the coding sequence of both myoXIa and myoXIb were amplified from cDNA (see Supplemental Table 1 online), fused by ligation, and cloned into pENT/D-TOPO (Figure 1). To generate the individual 5′UTR constructs, a segment of the 5′UTR of myoXIa and myoXIb was amplified from genomic DNA and cloned into pENT/D-TOPO. Additionally the myoXIa fragment was also cloned into pGEM-Teasy. The myoXIa fragment in pGEM-Teasy was excised with NotI and cloned into the myoXIb-pENT clone digested with NotI, generating pENT-myoXIa+b 5′UTR. All constructs were verified by sequencing in the pENT/D-TOPO vector. To generate the RNAi plasmids, constructs were transferred to the RNAi vector pUGGi (Bezanilla et al., 2005) via LR clonase, resulting in myoXIa+bCDS, myoXIa5′UTR, myoXIb5′UTR, and myoXIa+b5′UTR.
Real-Time RT-PCR Analysis of Transient RNAi Plants
Three hundred to five hundred 1-week-old plants lacking nuclear GFP were manually picked with a fine needle, and total RNA was extracted using the RNeasy plant mini kit (Qiagen), followed by DNase I treatment, according to the manufacturer's protocol. cDNA was synthesized from total RNA using SuperScript II reverse transcriptase (Invitrogen) and oligo(dT), following the manufacturer's protocol. Real-time PCR was performed in triplicate. All real-time PCR reactions used 2 to 8 ng of cDNA template in a 25-μL reaction using the Brilliant II SYBR Green QPCR Master Mix (Stratagene). The PCR conditions were as follows: 95°C for 10 min, followed by 50 cycles of 95°C for 30 s, 60°C for 1 min, and 72°C for 40 s. The primer sets were designed to have similar amplification efficiencies and are listed in Supplemental Table 1 online. The ubiquitin10 gene was used as an internal control for all reactions. Real-time PCR reactions were performed in an Eppendorf Mastercycler ep Realplex2 thermal cycler, and data were analyzed with the Realplex software 2.2.
Cell Wall and Nuclear Staining
To determine the number of nuclei per plant, cells were simultaneously stained with calcofluor (fluorescent brightener 28) and 4',6-diamidino-2-phenylindole (DAPI). Plants undergoing active gene silencing were selected with a fine metal needle into a solution of 100 mM PIPES, pH 6.8, 0.1% Nonident P-40, 1 μg/mL calcofluor, 0.1 μg/mL DAPI, and 2% paraformaldehyde. After 30 min of incubation, the plants were mounted in 20 μL of the same solution under a cover slip. The preparation was sealed with a melted 1:1:1 mixture of vaseline, lanolin, and paraffin. Images were acquired with the DAPI settings, a ×40 zoom and ×5 lens on a stereomicroscope (Leica MZ16FA), and a color camera (Leica DF300FX) using 36-bit RGB. When the plants were bigger than the camera field, several images were taken. Total nuclei per plant were counted manually from the blue channel of the images.
Alexa-Phalloidin Staining and Lifeact-mEGFP Imaging
Alexa-488-phalloidin staining was performed following previously established protocols (Vidali et al., 2007). Plants were visualized immediately after mounting using the 488 argon laser with a 515/30-nm band-pass emission filter of a Nikon confocal microscope (Nikon C1), a ×60 lens (NA 1.4; Nikon), and a pixel size of 83 nm. Several confocal sections, 0.5 μm apart, were acquired for each cell, and most optical sections consisted of the bottom half of the cell, including the cortical area that contained the majority of the F-actin structures. Further image processing was done with AutoDeblurGold Cf (MediaCybernetics) using five three-dimensional deconvolution iterations and displayed as a maximal Z-projection. To image F-actin in living cells, a stable moss line expressing Lifeact-mEGFP was used (Vidali et al., 2009a). This line was generated in the NLS4 background, allowing for identification of actively silencing plants by loss of nuclear fluorescence. Seven days after transformation, silencing plants were identified with a fluorescence stereomicroscope (Leica MZ16FA). The position of the selected plants was marked on the Petri dish. The cellophane containing the corresponding region was cut, and the cellophane was flipped onto a 1% agar pad containing modified Hoagland medium [4 mM KNO3, 2 mM KH2PO4, 1 mM Ca(NO3)2, 90 μM Fe citrate, 300 μM MgSO4, 9.93 μM H3BO3, 220 nM CuSO4, 1.2 μM MnCl2, 231 nM CoCl2, 191 nM ZnSO4, 170 nM KI, 100 nM Na2MoO4, and 1% sucrose]. The plants were covered with 10 μL of Hoagland medium and a cover slip placed on top. The cover slip was sealed with 1:1:1 vaseline/lanolin/paraffin. The plants were observed immediately after mounting with a Nikon C1 confocal microscope using a ×60 lens (NA 1.4; Nikon) and 1% laser power from a 488-nm argon laser. The filter used for all image acquisitions with the Nikon C1 confocal was a 515/30-nm band-pass filter. To analyze the effect of stabilization of the F-actin cytoskeleton, we treated growing Lifeact-mEGFP protonemata with 20 μM Jasplakinolide, an F-actin stabilizing drug, embedded into the 1% agar pads. Plants were evaluated 30 min after treatment. Images were acquired with a Nikon laser scanning confocal microscope (Nikon C1) as described above.
Quantification of Actin Dynamics from Lifeact-mEGFP Images
Images were cropped to 120 × 120 pixels encompassing a region within the cell. Images were then processed through a real-space band-pass filter that suppresses pixel noise and long-wavelength image variations while retaining information of a characteristic size. The characteristic size of noise and the smallest object was chosen to be one and four pixels, respectively. Once the images were processed through this filter, both difference and correlation maps were calculated.
In difference maps, image matrices were first scaled to have values in the interval [0,1]. The mean intensity values of each image were then calculated and subtracted from every pixel value. This removes any possible influence of photobleaching on the analysis. In the next step, the difference maps were calculated by subtracting one image from another. This procedure was repeated for all possible temporal spacings (time interval), for example, between frames 1 and 2, frames 1 and 3, frames 1 and 4, frames 2 and 3, frames 2 and 4, etc. This allows for better averaging and improves statistics for temporally close frames. The mean intensity of each map was then subtracted from the images to ensure homogenization of the intensity values. As a final step, the region of 1 sd around the mean of each map is removed from the difference image. This allows small differences around the mean, possibly due to noise, to be eliminated from the map. The total absolute intensities of each difference map were calculated as a function of time to compare different experimental conditions.
The correlation coefficient of a pair of images was calculated using the built-in MATLAB function corr2 defined as
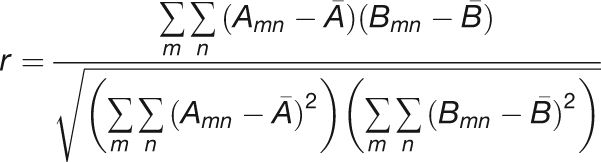 |
Here, A and B denote the matrices of the two images, and A and B with lines over them are the mean intensity values of each image. The correlation coefficient was once again computed between all possible temporal spacings (time interval) to allow for better averaging. The resulting averaged correlation coefficients were plotted as a function of time and compared with those calculated for RNAi, DMSO, or Jasplakinolide-treated plants.
Complementation of the Myosin XI-RNAi Phenotype
Transient complementation analysis was performed as previously described (Vidali et al., 2007). Briefly, 30 μg of myoXIa+b5′UTR was cotransformed with various concentrations of the complementing plasmid. After 4 d, the regenerating plants were transferred to hygromycin selection (15 μg/mL) in growth medium [1.03 mM MgSO4, 1.86 mM KH2PO4, 3.3 mM Ca(NO3)2, 45 μM FeSO4, 9.93 μM H3BO3, 220 nM CuSO4, 1.966 μM MnCl2, 231 nM CoCl2, 191 nM ZnSO4, 169 nM KI, 103 nM Na2MoO4, and 2.72 mM diammonium tartrate]. Three days later, the plants were evaluated for growth by measuring the plant area based on the chlorophyll autofluorescence and the degree of polarization estimated by the plant morphology using solidity. Solidity is the ratio of the area over the convex hull area. The convex hull, which is the smallest convex polygon that contains the shape under analysis, was calculated using the default function in ImageJ under the Edit/Selection menu. A perfectly solid structure has a solidity of 1, while more branched structures have lower solidity values.
Stable Expression of 3xmEGFP-Myosin XIa
A monomeric version of GFP (mEGFP) was amplified from pmEGFP-C1 (Vidali et al., 2009c) with primers (see Supplemental Table 1 online) that incorporated the appropriate attB sites and an additional BamHI site prior to the start ATG, resulting in mEGFP-L1L5r. The BamHI site at the 5′ end allows for cloning of additional mEGFPs with BamHI-BglII ends, which digested from the previously described mEGFP-pGEM (Vidali et al., 2009c). The BglII site is lost, and additional mEGFPs can be inserted, resulting in 3xmEGFP-L1L5r. pdp20423g-pENT was amplified using the appropriate attB primers (see Supplemental Table 1 online), and the resulting fragment was cloned into pDONR P5-P2 via a BP clonase reaction, creating myoXIa-L5L2 (see Supplemental Table 1 online). Using a two-fragment gateway recombination reaction, 3xmEGFP-L1L5r and pENT- myoXIa-L5L2 were combined and cloned into pTH-UbiGate to generate the expression construct pTH-Ubi-3xmEGFP-myoXIa. This plasmid was transformed into NLS-4, and stable hygromycin-resistant plants were isolated. The hygromycin resistance was removed by Cre-mediated recombination of lox-p sites flanking the antibiotic resistance cassette, generating a GFP-myoXI plant.
Quantification of Myosin XI Protein Reduction by Confocal Microscopy
To determine the extent of protein reduction by the myosin-RNAi constructs, we monitored the GFP fluorescence in 1-week-old GFP-myoXI plants transformed with different RNAi constructs. Individual transformants undergoing active gene silencing were selected based on the loss of nuclear GFP using a stereofluorescence microscope (Leica). The plants were transferred to 1% agar pads on modified Hoagland medium and mounted for confocal observation under a glass cover slip. Images from several cells from each plant were collected with a water immersion ×20 lens (0.75 NA; Nikon) using a laser scanning confocal (C1; Nikon) exciting with a 488-nm argon laser at 10% power. All acquisition parameters, including laser power, pixel dwell time, and gains, were kept at the same level for all experiments. Single optical sections were collected for comparison at a resolution of 414 nm/pixel, converted to 12-bit TIFF format, and imported to ImageJ. For analysis, the cells were thresholded to include all the fluorescence present in the optical section of the cell. Even in cells with very low GFP levels, the background signal provided enough information to delineate the cells. To correct for background levels, wild-type plants not expressing fluorescent proteins were imaged at the same settings, and their average intensity values subtracted for the analysis. To reduce possible nonspecific signal resulting from residual nuclear GFP-GUS fluorescence, the nuclei were masked before thresholding. We determined that the reduction of nuclear GFP-GUS in actively silencing plants is above 90%, but because of the low signal of 3xmEGFP-myosinXIa, this residual signal could affect further analysis and was therefore removed. The thresholded regions were selected using the automatic select tool from ImageJ and their average fluorescence intensity recorded. Two transformations were conducted to analyze between 10 and 44 regions from individual plants for each condition. Significant differences were evaluated by an analysis of variance using the Tukey-Kramer adjustment for multiple comparisons. P values < 0.05 were considered significant.
Analysis of Myosin XI Subcellular Localization
Localization of 3xmEGFP-myoXIa was determined in the stable line, GFP-myoXI. The cells were prepared as indicated for Lifeact-mEGFP. To acquire rapid confocal stacks, the imaged area was reduced to 256 × 256 pixels, and sections were generated within 1 s. For caulonemal cells, five slices from the apical dome were collected at 1-μm intervals every 5 s using a ×60 lens (NA 1.4; Nikon). Laser power was maintained at 1% to reduce bleaching. Under these conditions, the cells continue to grow for at least an hour. We subsequently analyzed maximal projections of the five Z-stacks.
For chloronemal cells and branches, which are growing at a slower rate, only single medial optical slices were collected. This reduced laser exposure and allowed for the necessary longer observation periods. For these longer-term observations, plants were cultured on thin agar films surrounded by a thicker layer of agar to maintain hydration. This was accomplished by creating a hole at the bottom of agar poured onto a glass bottom Petri dish and adding 50 to 100 μL of agar to this hole to create a film thin enough for observation with high-resolution optics. Images were collected every 5 s with a ×63 lens (NA 1.4; Leica) with a laser scanning confocal microscope (SP5 Leica) using the 488-nm laser with a 495- to 525-nm emission filter. These settings were used for all data acquired with the Leica scanning confocal.
To analyze the effect of F-actin stabilization on the localization of 3xmEGFP-myoXIa, we treated growing GFP-myoXI or Lifeact-mEGFP protonemata with 20 μM Jasplakinolide, an F-actin stabilizing drug, embedded into the 1% agar pads. Plants were evaluated 30 min after treatment. Images were acquired using a Leica laser scanning confocal microscope (SP5) as described above with a 256 × 256 format and 68-nm/pixel magnification. Five optical sections separated by 1-μm intervals and corresponding to the medial region of the cell were collected and maximally projected for presentation. Image acquisition parameters were chosen as similar as possible to those used with the C1 Nikon system.
Statistical Analyses
For comparison of multiple treatments, one-way analysis of variance was used, and comparison of means was done by the Tukey post hoc tests using SAS 9.1 TS level 1M2. An adjusted P value of 0.05 was used as significant. Area values were log transformed to obtain normal distributions. Solidity distributions are normal.
Accession Numbers
Sequence data from this article can be found in the GenBank/EMBL database under accession numbers HM038541 (myoXIa) and HM038542 (myoXIb).
Supplemental Data
The following materials are available in the online version of this article.
Supplemental Figure 1. Three Representative 1-Week-Old Plants Transformed with the Indicated Constructs.
Supplemental Figure 2. Localization of mEGFP in a Growing Protonemal Cell.
Supplemental Table 1. Primers Used in This Study.
Supplemental Movie 1. Dynamic Behavior of Cortical F-Actin in a Representative Control Cell.
Supplemental Movie 2. Dynamic Behavior of Cortical F-Actin in a Representative Myosin XI-RNAi Cell.
Supplemental Movie 3. Dynamic Behavior of Cortical F-Actin in a Representative Wild-Type Cell Expressing Lifeact-mEGFP Treated with DMSO.
Supplemental Movie 4. Dynamic Behavior of Cortical F-Actin in a Representative Wild-Type Cell Expressing Lifeact-mEGFP Treated with 20 μM Jasplakinolide.
Supplemental Movie 5. Localization of 3xmEGFP-Myosin XIa in a Growing Caulonemal Cell.
Supplemental Movie 6. Localization of 3xmEGFP-myoXIa in an Emerging Branch Cell.
Supplemental Movie 7. Localization of 3xmEGFP-myoXIa in a Growing Chloronemal Cell.
Supplemental Movie 8. Localization of Lifeact-mEGFP in a Growing Caulonemal Cell.
Supplemental Movie 9. Localization of mEGFP in a Growing Protonemal Cell.
Acknowledgments
We thank Peter Hepler, Tobias Baskin, and Ming Li for careful reading of the manuscript. We thank Ming Li for technical advice regarding real-time PCR. We also thank Paula Franco, Scotty Fay, Peter van Gisbergen, Victoria Huntress, and Yen-Chun Liu for technical support. This work was supported by National Science Foundation Grants MCB-0516702, MCB-0733580, MCB-0747231 (M.B.), DGE-065412 (R.C.A), and IOS-1002837 (L.V.) and the David and Lucille Packard Foundation (M.B.).
References
- Augustine R.C., Vidali L., Kleinman K.P., Bezanilla M. (2008). Actin depolymerizing factor is essential for viability in plants, and its phosphoregulation is important for tip growth. Plant J. 54: 863–875 [DOI] [PubMed] [Google Scholar]
- Bezanilla M., Perroud P.F., Pan A., Klueh P., Quatrano R.S. (2005). An RNAi system in Physcomitrella patens with an internal marker for silencing allows for rapid identification of loss of function phenotypes. Plant Biol. (Stuttg.) 7: 251–257 [DOI] [PubMed] [Google Scholar]
- Cove D., Bezanilla M., Harries P., Quatrano R. (2006). Mosses as model systems for the study of metabolism and development. Annu. Rev. Plant Biol. 57: 497–520 [DOI] [PubMed] [Google Scholar]
- Doonan J.H., Ccove D.J., Lloyd C.W. (1988). Microtubules and microfilaments in tip growth: evidence that microtubules impose polarity on protonemal growth in Physcomitrella patens. J. Cell Sci. 89: 533–540 [Google Scholar]
- Finka A., Schaefer D.G., Saidi Y., Goloubinoff P., Zryd J.P. (2007). In vivo visualization of F-actin structures during the development of the moss Physcomitrella patens. New Phytol. 174: 63–76 [DOI] [PubMed] [Google Scholar]
- Hashimoto K., Igarashi H., Mano S., Nishimura M., Shimmen T., Yokota E. (2005). Peroxisomal localization of a myosin XI isoform in Arabidopsis thaliana. Plant Cell Physiol. 46: 782–789 [DOI] [PubMed] [Google Scholar]
- Kozubowski L., Saito K., Johnson J.M., Howell A.S., Zyla T.R., Lew D.J. (2008). Symmetry-breaking polarization driven by a Cdc42p GEF-PAK complex. Curr. Biol. 18: 1719–1726 [DOI] [PMC free article] [PubMed] [Google Scholar]
- Li J.F., Nebenfuhr A. (2007). Organelle targeting of myosin XI is mediated by two globular tail subdomains with separate cargo binding sites. J. Biol. Chem. 282: 20593–20602 [DOI] [PubMed] [Google Scholar]
- Marga F., Grandbois M., Cosgrove D.J., Baskin T.I. (2005). Cell wall extension results in the coordinate separation of parallel microfibrils: evidence from scanning electron microscopy and atomic force microscopy. Plant J. 43: 181–190 [DOI] [PubMed] [Google Scholar]
- Menand B., Calder G., Dolan L. (2007). Both chloronemal and caulonemal cells expand by tip growth in the moss Physcomitrella patens. J. Exp. Bot. 58: 1843–1849 [DOI] [PubMed] [Google Scholar]
- Mooseker M.S., Cheney R.E. (1995). Unconventional myosins. Annu. Rev. Cell Dev. Biol. 11: 633–675 [DOI] [PubMed] [Google Scholar]
- Ojangu E.L., Jarve K., Paves H., Truve E. (2007). Arabidopsis thaliana myosin XIK is involved in root hair as well as trichome morphogenesis on stems and leaves. Protoplasma 230: 193–202 [DOI] [PubMed] [Google Scholar]
- Peremyslov V.V., Prokhnevsky A.I., Avisar D., Dolja V.V. (2008). Two class XI myosins function in organelle trafficking and root hair development in Arabidopsis. Plant Physiol. 146: 1109–1116 [DOI] [PMC free article] [PubMed] [Google Scholar]
- Prokhnevsky A.I., Peremyslov V.V., Dolja V.V. (2008). Overlapping functions of the four class XI myosins in Arabidopsis growth, root hair elongation, and organelle motility. Proc. Natl. Acad. Sci. USA 105: 19744–19749 [DOI] [PMC free article] [PubMed] [Google Scholar]
- Reddy A.S., Day I.S. (2001). Analysis of the myosins encoded in the recently completed Arabidopsis thaliana genome sequence. Genome Biol. 2: RESEARCH0024. [DOI] [PMC free article] [PubMed] [Google Scholar]
- Reisen D., Hanson M.R. (2007). Association of six YFP-myosin XI-tail fusions with mobile plant cell organelles. BMC Plant Biol. 7: 6. [DOI] [PMC free article] [PubMed] [Google Scholar]
- Saidi Y., Finka A., Chakhporanian M., Zryd J.P., Schaefer D.G., Goloubinoff P. (2005). Controlled expression of recombinant proteins in Physcomitrella patens by a conditional heat-shock promoter: a tool for plant research and biotechnology. Plant Mol. Biol. 59: 697–711 [DOI] [PubMed] [Google Scholar]
- Shimmen T., Yokota E. (2004). Cytoplasmic streaming in plants. Curr. Opin. Cell Biol. 16: 68–72 [DOI] [PubMed] [Google Scholar]
- Sparkes I.A., Teanby N.A., Hawes C. (2008). Truncated myosin XI tail fusions inhibit peroxisome, Golgi, and mitochondrial movement in tobacco leaf epidermal cells: A genetic tool for the next generation. J. Exp. Bot. 59: 2499–2512 [DOI] [PMC free article] [PubMed] [Google Scholar]
- Vidali L., Augustine R.C., Fay S.N., Franco P., Pattavina K.A., Bezanilla M. (2009b). Rapid screening for temperature-sensitive alleles in plants. Plant Physiol. 151: 506–514 [DOI] [PMC free article] [PubMed] [Google Scholar]
- Vidali L., Augustine R.C., Kleinman K.P., Bezanilla M. (2007). Profilin is essential for tip growth in the moss Physcomitrella patens. Plant Cell 19: 3705–3722 [DOI] [PMC free article] [PubMed] [Google Scholar]
- Vidali L., McKenna S.T., Hepler P.K. (2001). Actin polymerization is essential for pollen tube growth. Mol. Biol. Cell 12: 2534–2545 [DOI] [PMC free article] [PubMed] [Google Scholar]
- Vidali L., Rounds C.M., Hepler P.K., Bezanilla M. (2009a). Lifeact-mEGFP reveals a dynamic apical F-actin network in tip growing plant cells. PLoS One 4: e5744. [DOI] [PMC free article] [PubMed] [Google Scholar]
- Vidali L., van Gisbergen P.A., Guerin C., Franco P., Li M., Burkart G.M., Augustine R.C., Blanchoin L., Bezanilla M. (2009c). Rapid formin-mediated actin-filament elongation is essential for polarized plant cell growth. Proc. Natl. Acad. Sci. USA 106: 13341–13346 [DOI] [PMC free article] [PubMed] [Google Scholar]
- Walter N., Holweg C.L. (2008). Head-neck domain of Arabidopsis myosin XI, MYA2, fused with GFP produces F-actin patterns that coincide with fast organelle streaming in different plant cells. BMC Plant Biol. 8: 74. [DOI] [PMC free article] [PubMed] [Google Scholar]
- Yokota E., McDonald A.R., Liu B., Shimmen T., Palevitz B.A. (1995). Localization of a 170kda myosin heavy-chain in plant-cells. Protoplasma 185: 178–187 [Google Scholar]
- Yokota E., Ueda S., Tamura K., Orii H., Uchi S., Sonobe S., Hara-Nishimura I., Shimmen T. (2008). An isoform of myosin XI is responsible for the translocation of endoplasmic reticulum in tobacco cultured BY-2 cells. J. Exp. Bot. 60: 197–212 [DOI] [PMC free article] [PubMed] [Google Scholar]