Abstract
Acute myeloid leukemia (AML) is a malignancy without effective treatment for most patients. Here we demonstrate that combinations of the dietary plant polyphenols curcumin and carnosic acid, at non-cytotoxic concentrations of each agent, produced a synergistic antiproliferative effect and a massive apoptotic cell death in HL-60 and KG-1a human AML cells. In contrast, combinations of curcumin and another plant polyphenol silibinin had a predominantly additive cytostatic effect, without pronounced cytotoxicity. Neither polyphenol combination affected viability of normal human fibroblasts or proliferating and non-proliferating blood cells. Early stage of curcumin/carnosic acid-induced apoptosis was associated with cleavage (activation) of caspases-8, -9, and -3 and the proapoptotic protein Bid, but not with oxidative stress or altered levels of other Bcl-2 family proteins (Bcl-2, Bcl-xL, Mcl-1, Bax and Bak). Inhibitors of caspase-8 and -9 markedly attenuated apoptosis, indicating the involvement of both extrinsic and intrinsic apoptotic pathways. Caspase-8 inhibition abrogated Bid cleavage and strongly reduced caspase-9 activation, suggesting that the cross-talk mechanism mediated by caspase-8-dependent Bid cleavage can contribute to the activation of the intrinsic apoptotic pathway by CUR+CA. Collectively, these results suggest a mechanistic basis for the potential use of dietary plant polyphenol combinations in the treatment and prevention of AML.
Keywords: acute myeloid leukemia, plant polyphenols, curcumin, carnosic acid, silibinin, apoptosis, reactive oxygen species
INTRODUCTION
Acute myeloid leukemia (AML) is a hematological malignancy that results from transformation of multipotent hematopoietic progenitors and leads to accumulation of immature myeloid cells in the bone marrow. The mainstream approach for AML treatment is intensive combination chemotherapy with cytosine arabinoside (Ara-C) and anthracyclines such as doxorubicin or idarubicin (1). However, despite initial responses to chemotherapy, prognosis is poor for the majority of AML patients due to primary resistance and frequent relapse. Furthermore, standard treatment is highly toxic and poorly tolerated, particularly by older patients. Thus, the development of novel therapeutic agents and protocols is in an urgent need for improving outcomes in patients with AML.
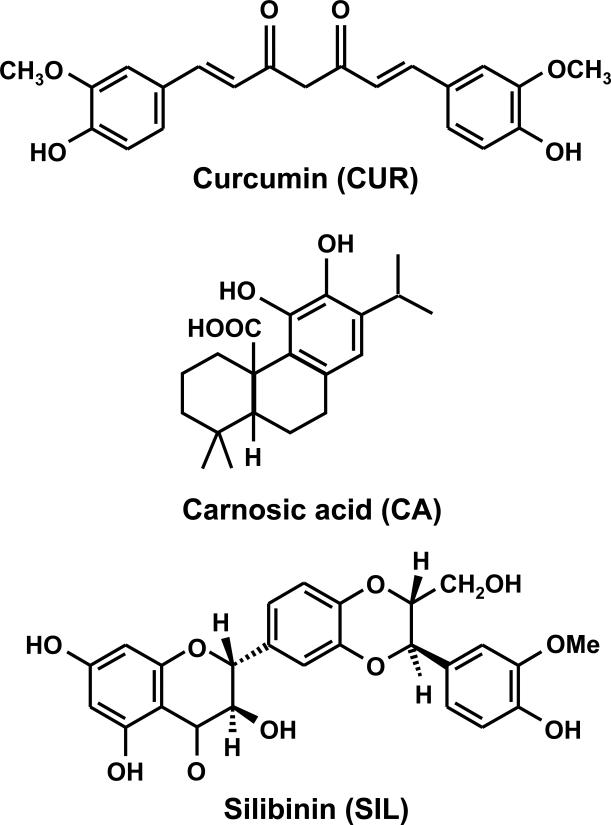
Accumulating evidence has demonstrated the chemopreventive and potential therapeutic activity of plant polyphenolic antioxidants in various preclinical models of human malignancies, including those of AML [reviewed in (2)]. Particularly, curcumin (CUR), the principal curcuminoid found in the Indian spice turmeric (Fig. 1), has been shown to inhibit proliferation and induce apoptosis in different types of solid tumor and leukemia cell lines, and to suppress tumor development in animal models of cancer [e.g. refs. (3,4); see also (5) for a recent review]. Importantly, CUR is capable of radiosensitizing tumor cells and potentiating the action of chemotherapeutic agents, such as gemcitabine (4) and celecoxib (6), in both cell lines and animal models. Recent studies have shown that different phytochemicals can also cooperate with one another to produce synergistic antiproliferative and cytotoxic effects [reviewed in (7)]. For instance, curcumin has been found to synergize with epigallocatechin-3-gallate in human breast cancer cells (8) and with phenethyl isothiocyanate in human prostate cancer cells (9), in vitro and in vivo. While being extensively studied in solid tumor cell lines, such potentially beneficial phytochemical combinations have not yet been explored in AML models.
Fig. 1. Chemical structures of polyphenols used in this study.
Curcumin (CUR), a curcuminoid found in turmeric (Curcuma longa); carnosic acid (CA), a diterpene derived from rosemary (Rosmarinus officinalis) silibinin (SIL), a flavonolignan found in milk thistle (Silibum marianum).
In this study we investigated the combinatorial effects of CUR and two other plant polyphenols: silibinin (SIL), the flavonolignan found in milk thistle, and carnosic acid (CA), the polyphenolic diterpene derived from rosemary (Fig. 1), on proliferation and viability of two human AML cell lines, HL-60 and KG-1a. A number of studies have documented potent anticancer activity of SIL, alone and in combination with cytotoxic drugs, in various cell and animal models [e.g., refs. (10,11); also reviewed in (12)]. CA is well known as one of the most effective plant antioxidants and possesses chemopreventive activity (13-15). Although its effects on cell proliferation and death remain to be characterized in detail, we have previously shown that CA as well as both CUR and SIL synergistically potentiate the differentiation effect of low, near physiologic concentrations of the active hormonal form of vitamin D3, (1α,25-dihydroxyvitamin D3) in human and murine leukemia cells via activation of molecular events consistent with monocytic differentiation (16-19). Furthermore, we have demonstrated that CA-rich rosemary extract and low-calcemic vitamin D3 analogs synergistically cooperate in the in vivo antileukemic effect in murine AML models (20,21).
Here we show that combined treatment of AML cells with CUR and CA at low micromolar concentrations results in a pronounced, synergistic inhibition of proliferation concomitant with an induction of massive cell death via activation of both extrinsic and intrinsic apoptotic pathways. Surprisingly, while SIL alone strongly inhibited cell growth, it did not significantly synergize with CUR in this effect or promote cell death. Importantly, neither CUR/CA nor CUR/SIL combinations at the dose ratios tested here affected the viability of normal human cells. These data indicate that diverse combinations of plant polyphenols differentially regulate cell entry to pathways which lead to apoptosis versus proliferation arrest, and that some of these combinations may have therapeutic potential for the selective targeting of leukemia cells.
MATERIALS AND METHODS
Materials
CUR was from Cayman Chemicals (Michigan, MI). CA was purchased from Alexis Biochemicals (Läufenfingen, Switzerland). SIL, Ara-C, 2’,7’-dichlorfluorescein-diacetate (DCFH-DA), propidium iodide (PI), were from Sigma (Rehovot, Israel). Inhibitors of caspase-8 (Z-IETD-fmk) and caspase-9 (Z-LEHD-fmk) were purchased from MBL (Nagoya, Japan). Thymidine, [methyl-3H] (6.7 Ci/mmol) was obtained from PerkinElmer (Boston, MA). RPMI 1640 medium and Dulbecco's modified Eagle's medium (DMEM) were purchased from Biological Industries (Beth Haemek, Israel). Fetal bovine serum (FBS) was from Gibco-Invitrogen (Carlsbad, CA). The following primary antibodies were used: caspase-9 (#9502) and caspase-8 (1C12) from Cell Signaling Technology (Beverly, MA); PARP (SA253) from BioMol (Plymouth Meeting, PA); caspase-3 (H-277), Bcl-2 (100), BCL-xL (N-20), Mcl-1 (S-19), Bax (N-20), Bak (G-23) and Bid (C-20) from Santa Cruz Biotechnology (Santa Cruz, CA); calreticulin (PA3-900) from Affinity BioReagents (Golden, CO). Stock solutions of CUR (20 mM) and SIL (120 mM) were prepared in DMSO. CA (10 mM) was dissolved in absolute ethanol.
Cell Culture
HL-60 myeloblastic leukemia cells (ATCC-CCL-240) were obtained from Dr. R. Levy (Ben-Gurion University, Beer Sheva, Israel). KG-1a promyeloblastic leukemia cells (ATCC-CCL-246.1) were obtained from Dr. E. Fibach (Hadassah University Hospital, Jerusalem, Israel). Human peripheral blood mononuclear cells (PBMC) were obtained from healthy donors after obtaining informed consent (Ben Gurion University IRB protocol #3587). Cultured normal human skin fibroblasts (HSF) were obtained for Dr. Nilli Grossmann (Soroka Medical Center, Beer Sheva, Israel). Cells were grown in RPMI 1640 medium (HL-60, KG-1a and PBMC) or DMEM (HSF) supplemented with 10% FBS, penicillin (100 U/ml), streptomycin (0.1 mg/ml), and 10 mM Hepes (pH=7.4) in a humidified atmosphere of 95% air and 5% CO2, at 37°C.
Cell treatment protocol, and proliferation and cytotoxicity assays
KG-1a or HL60 cells were plated at 4-8 × 10⁴ cells/ml in 2 ml of complete growth medium in 24-well plates and incubated with different concentrations of CUR, CA and SIL alone or in combination, for various periods of time. Controls cells were treated with vehicle (≤0.2% DMSO, ≤0.2% ethanol or ≤0.1% DMSO + ≤0.1% ethanol depending on the treatment). These concentrations of solvents in culture media did not significantly affect the parameters tested. Cell numbers and viability were then estimated on the basis of trypan blue exclusion by counting in Vi-Cell™ XR cell viability analyzer (Beckman Coulter Inc., Fullerton, CA). PBMC proliferation was determined by the standard 3H-thymidine incorporation assay (22,23). Briefly, cells were treated in 96-well plates (105 cells/well) with either ethanol and/or DMSO vehicle (control) or CUR, CA and SIL, alone and in combination, in the presence of 35 μg/ml phytohemagglutinin (PHA), for 54 h. Negative control cells were incubated with vehicle in the absence of PHA. Subsequently, 3H-thymidine (1 μCi) was added to each well followed by additional 18-h incubation. The cells were then harvested on glass-fiber filters using a cell harvester (Inotech, Basel, Switzerland). Radioactivity on the filters was measured by liquid scintillation counting.
Analysis of apoptosis and necrosis
Acridine orange and ethidium bromide staining
Cells (1 × 10⁶) were collected by centrifugation and doubly stained with 14 μg/ml acridine orange and 14 μg/ml ethidium bromide, as described previously (24). Nuclear morphology of stained cells was examined by fluorescent microscopy at a magnification of 400x.
Annexin V and propidium iodide staining
Cells were stained using MEBCYTO® Apoptosis Kit (MBL) according to manufacturer's recommended protocol. Briefly, 2 × 10⁵ cells were harvested, washed once with PBS and resuspended in 80 μl of binding buffer. Ten microliters of annexin VFITC and 5 μl of PI (100 μg/ml) were then added, and cells were incubated at room temperature for 15 min in the dark. Then 400 μl of binding buffer was added and the stained cells were analyzed in Cytomics FC500 flow cytometer equipped with CXP software (Beckman Coulter, Miami, FL). For each analysis 10,000 events were recorded.
Cell cycle analysis
Cells (1 × 10⁶) were washed twice with ice-cold PBS and fixed in 75% ethanol at −20°C for at least 24 h. Cell were then washed twice with PBS, and incubated in 1 ml of PBS containing 0.1% Triton X-100 and 50 μg of RNAse (Sigma) at room temperature for 30 min. PI (10 μg/ml) was then added for 20 min and the cells were analyzed in a Cytomics FC500 flow cytometer. For each analysis 10,000 events were recorded. Cell cycle distribution was determined by MultiCycle DNA Content and Cell Cycle Analysis Software (Phoenix Flow Systems, Inc., San Diego, CA
Determination of intracellular levels of reactive oxygen species
The intracellular ROS levels were determined as described previously (16,20) using the oxidation-sensitive fluorescent probe DCFH-DA. Intracellular peroxides oxidize this probe to a highly fluorescent compound DCF. Cells (5 × 10⁵) were harvested, washed with HEPES-buffered HBSS and loaded with 5 μM DCFH-DA, for 15 min at 37°C in a shaking water bath. The green fluorescence intensity was then analyzed in a Cytomics FC500 flow cytometer. For each analysis 10,000 events were recorded.
Assay for glutathione
Cells (1.5 × 10⁶) were washed with ice-cold PBS, and resuspended in 200 μl of 5% 5-sulfosalicylic acid. After 15 min on ice with intermittent vortexing, the suspension was centrifuged at 16,000 × g for 5 min to remove protein precipitates. Total glutathione was determined in the supernatants by the glutathione reductase recycling assay as described previously (16,20).
Preparation of whole cell extracts and Western blot analysis
Whole cell extracts were prepared, as described previously (17). Briefly, cells were lysed in ice-cold lysis buffer containing 50 mM, HEPES (pH 7.5), 150 mM NaCl, 10% (v/v) glycerol, 1% (v/v) Triton X-100, 1.5 mM EGTA, 2 mM sodium orthovanadate, 20 mM sodium pyrophosphate, 50 mM NaF, 1 mM DTT and 1:50 Complete™ protease-inhibitors cocktail (Roche Molecular Biochemicals, Mannheim, Germany) and centrifuged at 20,000 × g, 10 min, 4°C. Supernatant samples (30 μg protein) were subjected to SDS-PAGE and then electroblotted into nitrocellulose membrane (Whatman, Dassel, Germany). The membranes were blocked with 5% milk for 2 h and incubated with primary antibodies overnight at 4°C followed by incubation with HRP-conjugated secondary antibodies (Promega, Madison, WI) for 2 h. The protein bands were visualized using the Western Lightning™ Chemiluminescence Reagent Plus (PerkinElmer Life Sciences, Inc., Boston, MA). The blots were stripped and reprobed for the constitutively present protein, calreticulin, which served as the loading control. The optical density (OD) of each band was quantitated using an ImageMaster VDS-CL imaging system (Amersham Parmacia Biotech, Piscataway, NJ).
Statistical analysis
Experiments were repeated at least three times. The IC50 values for antiproliferative effects of polyphenols were obtained by nonlinear regression analysis using the various slope algorithm. The interaction of CUR with CA or SIL was assessed by the combination index (CI) analysis using Calcusyn software (Biosoft Inc., Cambridge, U.K.) The CI values were calculated on the basis of the levels of growth inhibition (fraction affected) by each agent individually and combination at non-constant ratios. CI values of <1, 1, and >1 show synergism, additivity and antagonism, respectively. Statistically significant differences between treatments were estimated by unpaired, two-tailed Student's t-test or one-way ANOVA with Tukey multiple comparison post-hoc analysis (for the data shown in Fig. 4B). P < 0.05 was considered statistically significant.
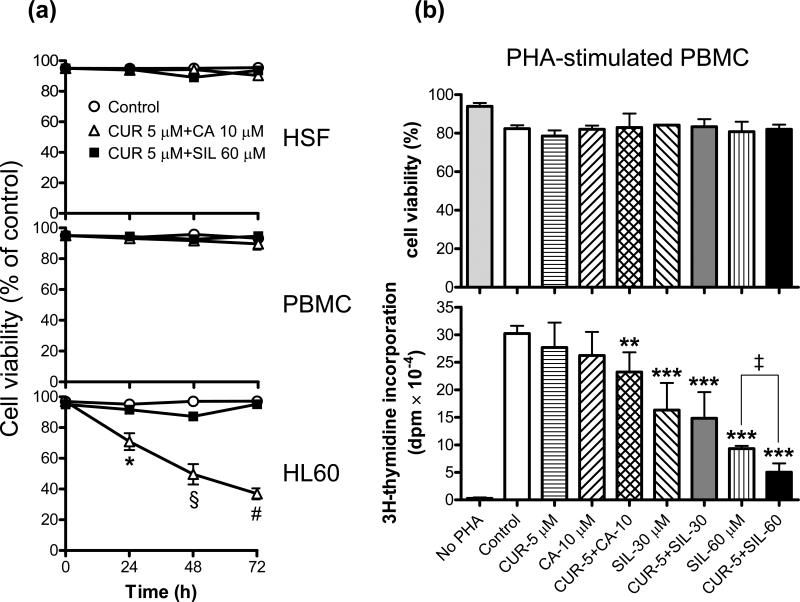
Fig. 4. Combinations of CUR and CA or SIL do not reduce the viability of normal human cells and differentially affect proliferation of phytohemagglutinin-stimulated human PBMC.
A: Time-dependent changes in the viability of PBMC (peripheral blood mononuclear cells) and HSF (human skin fibroblasts) vs. HL-60 cells. Cells were incubated for 24-72 h with the indicated combinations of CUR and CA or CUR and SIL followed by the trypan blue exclusion assay. Reported values are the means ± SE (n=3). *, P = 0.047; §, P = 0.016; #, P < 0.0001. B: PBMC were incubated in 96-well plates (105 cells/well) with the indicated agents in the presence or absence 35 μg/ml PHA, for 72 h. Cell viability (upper panel) and proliferation (lower panel) were then determined by the trypan blue exclusion assay and 3H-thymidine incorporation assay, respectively, as described in the Materials and Methods. Reported values are the means ± SD of two independent experiments performed in sextuplicate. **, P < 0.01 and ***, P < 0.001, significant differences as compared to PHA-treated control cells; ‡, P < 0.01, significant difference between samples treated with 60 μM SIL alone and its combination with 5 μM CUR.
RESULTS
Antiproliferative and cytotoxic effects of curcumin, carnosic acid and silibinin, alone and in combination
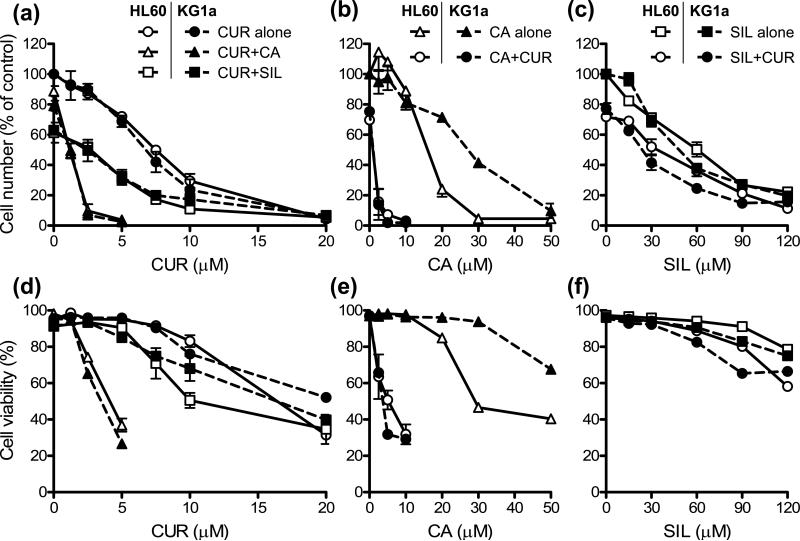
To determine whether CUR cooperates with CA and SIL in the in vitro antileukemic effects, exponentially growing HL-60 and KG-1a cells were incubated for 72 h with increasing concentrations of CUR in the absence or presence of relatively low concentrations of CA (10 μM) or SIL (30 μM), which alone did not significantly affect cell viability (Fig. 2A, D). Conversely, cells were treated with increasing doses of either CA (Fig. 2B, E) or SIL (Fig. 2C, F) alone and together with a single noncytotoxic concentration of CUR (5 μM).
Fig. 2. Effects of curcumin (CUR), carnosic acid (CA), silibinin (SIL) and their combinations on cell growth (A-C) and viability (D-F) in HL-60 and KG-1a cells.
Exponentially growing cells were treated for 72 h with increasing concentrations of CUR alone or in combination with 10 μM CA or 30 µM SIL (A, D); CA alone or in combination with 5 μM CUR (B, E); and SIL alone or in combination with 5 μM CUR (C, F). Cell growth and viability were determined by the trypan blue exclusion assay. At the end of incubation, the number of untreated control HL-60 and KG-1a cells increased from 80,000±3,500 to 680,000±37,000 cells/ml and from 80,000±4,500 to 760,000±38,000 cells/ml, respectively. Reported values are the means ± SE (n=3).
As measured by the trypan blue exclusion assay, CUR, CA and SIL alone reduced both the cell number (Fig. 2A, B, C) and viability (Fig. 2D, E, F) in a dose-dependent manner. The two cell lines demonstrated a similar sensitivity to the antiproliferative effects of CUR (Fig. 2A) and SIL (Fig. 2C), whereas HL-60 cells had moderately higher sensitivity to CA (Fig. 2B). For both cell lines, the order of potencies was CUR > CA > SIL (see Table 1 for IC50 values). Similar differences in susceptibility of HL-60 and KG-1a cells to the cytotoxic effects of these polyphenols were observed (Fig. 2D, E, F). Generally, for all the compounds tested, a marked antiproliferative effect already occurred at doses which only slightly affected cell viability. For example, in HL-60 cells, 10 μM CUR, 20 μM CA and 90 μM SIL, decreased the cell numbers by about 63%, 76% and 73%, respectively; whereas the viability was reduced by only about 12%, 15% and 9%, respectively (Fig. 2; compare panels A & D, B & E, and C & F).
TABLE 1.
Comparison of antiproliferative potencies of curcumin, carnosic acid, silibinin alone vs. combinations on the basis of IC50 values (in μM)
| No. | Polyphenol | HL60 cells | KG-1a cells | ||||
|---|---|---|---|---|---|---|---|
| Alone | +10 μM CA | +30 μM SIL | Alone | +10 μM CA | +30 μM SIL | ||
| 1 | Curcumin | 6.79±0.53 | 1.20±0.12** | 4.37±0.54* | 6.19±0.57 | 1.41±0.087** | 4.56±0.29* |
| +5 μM CUR | +5 μM CUR | ||||||
| 2 | Carnosic acid | 16.80±0.97 | 0.86±0.18*** | 27.30±1.40 | 0.95±0.17*** | ||
| +5 μM CUR | +5 μM CUR | ||||||
| 3 | Silibinin | 62.55±4.44 | 37.35±2.57** | 55.54±3.84 | 27.66±2.99* | ||
The IC50 values presented in rows 1, 2 and 3 were calculated by nonlinear regression analysis from the dose-response curves shown in Figs. 1A, 1B and 1C, respectively.
(P < 0.05)
(P < 0.01)
(P < 0.001), significant differences between the effects of an agent alone and its combination with another agent.
CUR, curcumin; CA, carnosic acid; SIL, silibinin.
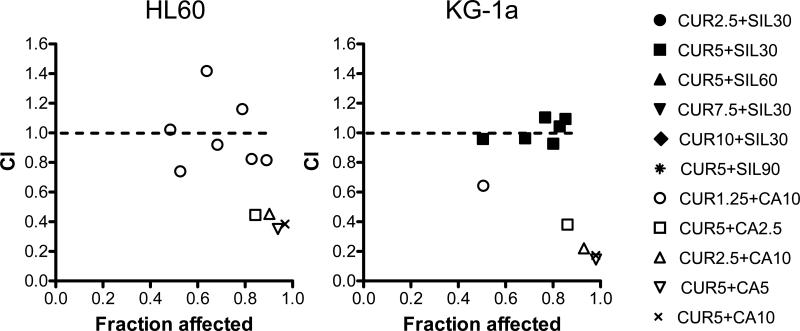
Strikingly, in both cell lines, combinations of CUR and CA at low micromolar concentrations, which alone did not significantly affect cell viability, induced a dramatic cooperative decrease in cell numbers (Fig. 2A, B) concomitant with a massive cell death (Fig. 2D & E). This resulted in an almost total cell loss at 2.5-5.0 μM CUR combined with 2.5-10.0 μM CA following 72 h incubations. As shown in Table 1, the addition of 10 μM CA to increasing concentrations of CUR (row 1) or 5 μM CUR to increasing concentrations of CA (row 2) caused 4-5 fold and 20-30 fold reduction in the IC50 values for the antiproliferative effects of CUR and CA alone, respectively. In contrast, although CUR and SIL alone exerted strong dose-dependent antiproliferative effects (Fig. 2A, C), these two agents did not particularly cooperate in growth arrest (Fig. 2A, C) with only a modest decrease in the IC50 values for CUR in the presence of 30 μM SIL (1.3-1.5 fold; Table 1, row 1) or for SIL in the presence of 5 μM CUR (1.7-2.0 fold; Table 1, row 3). Interestingly, despite strong antiproliferative effects of CUR/SIL combinations, only a mild reduction in cell viability was detected, mainly at higher concentrations of each agent (Fig. 2D, F). Detailed assessment of the growth inhibition data for both KG-1a and HL-60 cells using combination index analysis revealed a clear synergistic interaction between CUR and CA (CI<1) at all the concentration ratios tested, which was particularly strong (CI = 0.17-0.38) at 5 μM CUR combined with 10 μM CA. On the other hand, CUR/SIL combinations showed only mildly synergistic (CI≤1) or antagonistic (CI≥1) antiproliferative effects (Fig. 3).
Fig. 3. Combinations of CUR and CA or SIL show differential cooperation patterns in growth inhibition.
Combination index (CI) analysis of cell growth inhibition in HL-60 and KG-1a cells following treatment for 72 h with various CUR/CA and CUR/SIL combinations, based on the data presented in Fig. 2A, B, C. The CI values are plotted against the levels of growth inhibition (fraction affected). Dotted line designates CI=1. CI values of <1, 1, and >1 show synergism, additivity and antagonism, respectively.
Importantly, the viability of normal human skin fibroblasts or unstimulated PBMC (containing approximately 80% lymphocytes and 20% monocytes) was not significantly affected for 24-72 h treatment with the combination of 5 μM CUR and 10 μM CA (Fig. 4A), which was highly cytotoxic for both HL-60 (Figs. 2D and 4A) and KG-1a cells (Fig. 2D). A similar lack of cytotoxicity for these normal cells was observed following treatment with 5 μM CUR combined with up to 60 μM SIL (Fig. 4A). Likewise, neither of the polyphenols tested here, alone or in combination, affected the viability of PBMC incubated for 72 h in the presence phytohemagglutinin (PHA), the classical T-lymphocyte mitogen (25), as compared to the PHA-treated control cells (Fig. 4B, upper panel). PHA-stimulated proliferation of PBMC, as measured by the 3H-tymidine incorporation assay, was not significantly affected by CUR or CA alone while their combination produced only a small (~ 25%; P < 0.01) inhibitory effect (Fig. 4B, lower panel), which is in a striking contrast to the virtually complete inhibition of HL60 and KG-1a cell growth by this combination observed after a 72-h incubation (see Fig. 2A, B). On the other hand, treatment with SIL resulted in a marked, dose-dependent decrease in PBMC proliferation (P < 0.001) and, when administered at the higher concentration (60 μM), SIL cooperated with CUR to produce an enhanced inhibitory effect (Fig. 4B, lower panel; P < 0.01). The ability of SIL and its crude preparation, silymarin, to inhibit T-lymphocyte proliferation has been well documented [e.g., (26,27)], which is consistent with the known anti-inflammatory and immunomodulatory activity of these and other phytochemicals (28-30). Due to their antitoxic effects, SIL preparations have been used in the clinic for the treatment of liver diseases (31,32).
Induction of apoptosis by polyphenol combinations
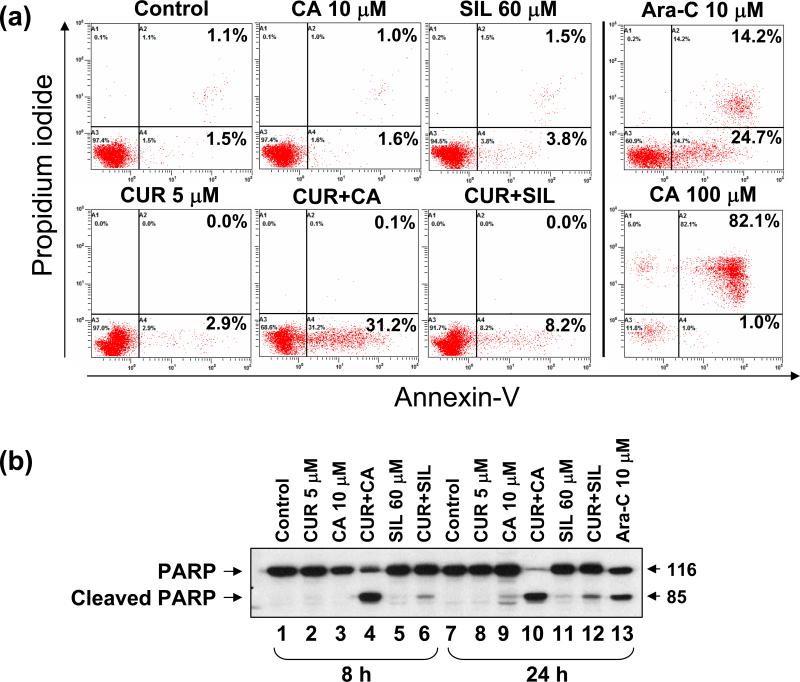
To elucidate the mode of the pronounced cytotoxicity of CUR/CA combinations we determined several well-defined markers of apoptotic and necrotic death in HL-60 and KG-1a cells. Using annexin-V/PI staining, we found that treatment of HL-60 cells for 18 h with 5 μM CUR plus 10 μM CA, but not with either agent alone, resulted in a marked increase in the percentage of annexin-V-stained/PI-negative (early apoptotic) cells, compared to untreated control (Fig. 5A). No noticeable elevation of annexin-V/PI-double positive (late apoptotic/necrotic) cell population was detected, in contrast to that seen in cells treated with the positive controls: Ara-C (10 μM) or, particularly, a high CA dose (100 μM). Consistent with the cell viability data (Fig. 2F), treatment with 5 μM CUR combined with 60 μM SIL resulted in a much less pronounced increase in annexin-V binding (Fig. 5A) than that detected in CUR/CA-treated cells (7.4±0.8 vs. 34.8±3.5; P = 0.0167).
Fig. 5. Comparison of the effects of CUR/CA and CUR/SIL combinations on the induction of apoptosis in HL-60 cells.
A: Annexin-V binding assay. Cells were treated with the indicated polyphenols alone or in combination for 16 h followed by staining with FITC-conjugated annexin-V antibody and PI and flow cytometric analysis. Cells treated for 24 h with 10 μM Ara-C or 100 μM CA were used as the positive controls. B: Western blot analysis of PARP cleavage. Cells were treated with the indicated concentrations of polyphenols or Ara-C for 8 h and 24 h. Whole cell extracts were subjected to SDS-PAGE and immunoblotting. Representative data from 3 independent experiments are shown.
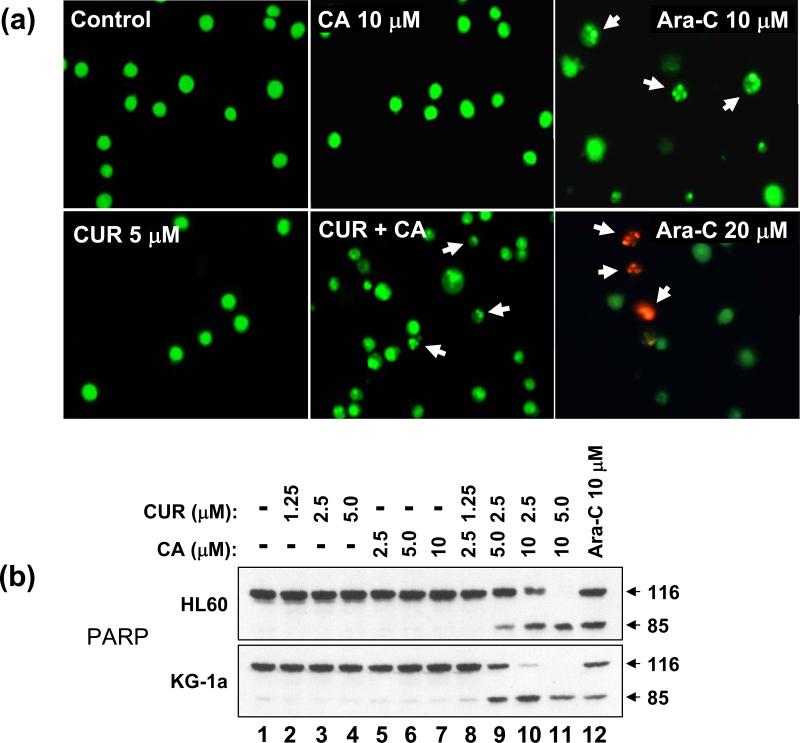
In support of the above findings, treatment with 5 μM CUR plus 10 μM CA, but not with single agents, for 8 h or 24 h resulted in marked cleavage of the intact PARP polypeptide (116 kDa), one of the early events in apoptosis induction, yielding a signature 85 kDa fragment (Fig. 5B) whereas a much less pronounced effect was observed after combined treatment with 5 μM CUR and 60 μM SIL (Fig. 5B, compare lanes 4 & 10 to lanes 6 & 12). Fluorescent microscopic examination of nuclear morphology in acridine orange/ethidium bromide-stained HL-60 cells demonstrated that, similar to 10 μM Ara-C, the combined but not single treatment with CUR and CA for 16 h induced a characteristic chromatin condensation, nuclear shrinkage and the presence of apoptotic bodies, as seen by the green fluorescence of acridine orange (Fig. 6A). In contrast to the cells treated with a higher dose of Ara-C (20 μM, 24 h), orange-red ethidium bromide-stained nuclei (typical for late apoptosis/necrosis when the cell membrane is damaged) were not detected in CUR/CA-treated cells (Fig. 6A). CUR/CA treatment also resulted in a time-dependent increase in the percentage of sub-G1 (apoptotic) cell population (data not shown). To determine whether the induction of apoptosis by CUR/CA is dose-dependent, PARP cleavage was examined in both HL-60 and KG-1a cells following 24 h incubation with increasing concentrations of each agent, alone and in combination. As shown in Fig. 6B, the appearance of an 85-kDa cleavage product was detectable at the combination of 2.5 μM CUR and 5.0 μM CA and increased with the dose of combined agents, concomitant with a gradual disappearance of the intact 116-kDa polypeptide. Single compounds were without effect. Taken together, these results indicate that the early time-and dose-dependent induction of programmed cell death, and not a nonspecific cytotoxicity, is a primary cause for CUR/CA-induced cell death.
Fig. 6. Analysis of the apoptosis-inducing effect of the CUR/CA combination in HL-60 cells.
A: Demonstration of changes in nuclear morphology. Cells were treated with the indicated concentrations of CUR and CA, alone and in combination for 24 h followed by staining with acridine orange (green fluorescence) and ethidium bromide (red fluorescence). Stained cells were examined under fluorescence microscopy at 400x magnification. Cells treated with 10 μM or 20 μM Ara-C, for 24 h were used as the positive controls. Arrows indicate small cells with shrunken and fragmented nuclei. Cells treated with 20 μM Ara-C display ethidium bromide staining of damaged nuclei. B: Western blot analysis of dose-dependent PARP cleavage. Cells were treated with the indicated concentrations of CUR and/or CA for 24 h. Ara-C (10 μM) was used as the positive control. Representative data from 3 independent experiments are shown.
The cytotoxic curcumin/carnosic acid combination does not induce oxidative stress
To elucidate the mode of CUR/CA-induced apoptosis we first determined whether this combination induced oxidative stress in leukemic cells. Apoptosis induction by various agents, including higher concentrations (25-50 μM) of CUR, in different cancer cell types has been frequently associated with generation of ROS (33,34). However, we did not observe a significant elevation of the intracellular ROS levels in leukemia cells treated with 5 μM CUR and 10 μM CA, alone or in combination (Fig. 7A), at the time points both preceding (2 h) and paralleling (4-8 h; see Figs. 5B and 8) the appearance of appreciable apoptotic changes. On the contrary, ROS levels significantly (P = 0.048) decreased following 8-h incubation with the CUR/CA combination (Fig. 7A) compared to untreated control cells, indicative of the antioxidant effect. Furthermore, there was a small but significant elevation of the total content of glutathione, the major intracellular antioxidant, in cells treated with CUR plus CA for 4 h (Fig. 7B). Interestingly, after 8 h, while CUR and CA alone markedly increased glutathione levels, the combination had a milder, but still significant (P = 0.039) positive effect (Fig. 7B).
Fig. 7. CUR/CA-treatment does not induce oxidative stress.
HL-60 cells were treated with the indicated concentrations of CUR and/or CA for 2-8 h followed by determination of intracellular levels of ROS (A) and total glutathione (B). A: Flow cytometric analysis of DCF fluorescence. *, P = 0.048. B. Glutathione reductase recycling assay of glutathione. *, P = 0.015; §, P = 0.002; #, P = 0.005; ‡, P = 0.039. Reported values are the means ± SE (n=3).
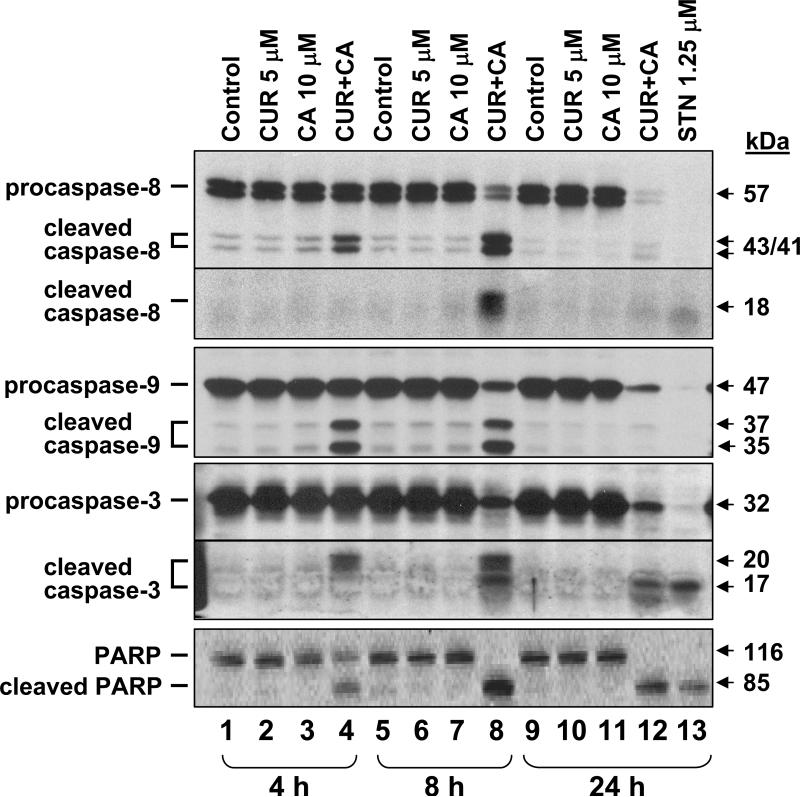
Fig. 8. Time-course of caspase-8, -9, and -3 and PARP processing in CUR/CA-treated cells.
HL-60 cells were incubated with 5 μM CUR and/or 10 μM CA for the indicated times followed by Western blotting of whole cell extracts. Staurosporin (STN, 1.25 μM) was used as the positive control. Each blot is a representative of 3 similar blots.
Apoptosis induced by the curcumin/carnosic acid combination is associated with activation of caspases
CUR/CAR-induced apoptosis in HL-60 cells was accompanied by a time-dependent activation of upstream initiator caspase-8 and caspase-9, mainly involved in death receptor-mediated (extrinsic) and mitochondria-mediated (intrinsic) apoptosis, respectively (35). This was manifested by both a decrease in the amount of full-length procaspases and generation of specific polypeptide fragments (Fig. 8). Likewise, a time-dependent processing of a downstream effector procaspase-3 was detected, accompanied with generation of an 85-kDa fragment of PARP, the known caspase-3 substrate (Fig. 8). Similar results were obtained in KG-1a cells (data not shown).
Effects of the curcumin/carnosic acid combination on the levels of Bcl-2 family proteins
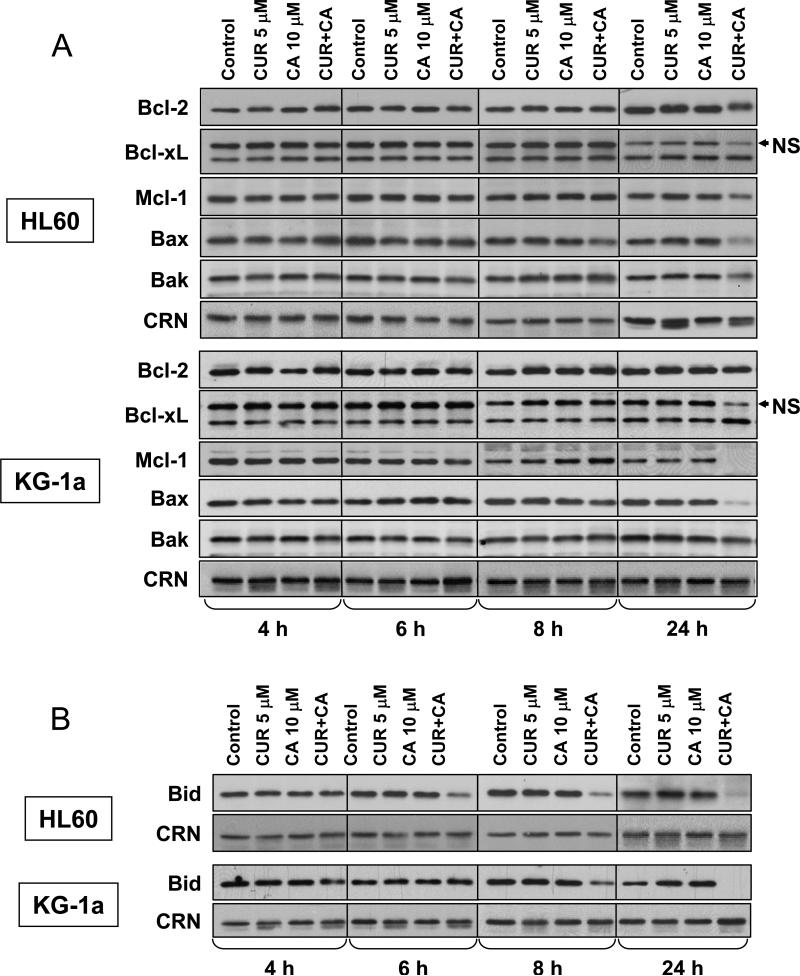
Bcl-2 family proteins are known to play key roles in mitochondria-mediated cell death and to contribute to cross-talk between the extrinsic and intrinsic apoptotic pathways (35). We, thus, determined whether CUR and CA alone or together affected the expression of several Bcl-2 family members in HL-60 and KG-1a cells. As shown in Fig. 9A, the levels of antiapoptotic proteins Bcl-2, Bcl-xL, and Mcl-1 and those of proapoptotic proteins Bax and Bak were not altered noticeably in the early stages of CUR+CA-induced apoptosis (4-8 h). On the other hand, we observed a relatively rapid decrease in the intact BH3-only protein Bid, the known caspase-8 substrate, whose cleaved form can mediate the link between caspase-8 and -9 activation (36). Reduction in Bid levels was clearly seen at 6-8 h in HL-60 cells and at 8 h in KG-1a cells (Fig. 9B). Longer incubation with CUR+CA (24 h), when more massive cleavage of caspases and PARP was apparent (see Fig. 8), did not result in detectable changes in Bcl-2 and Bcl-xL expression (Fig. 9A). On the other hand, the levels of Mcl-1 (Fig. 9A) and Bid (Fig. 9B) were strongly reduced, virtually completely in KG-1a cells. Surprisingly, a similar decrease was evident for Bax and, to a lesser extent, Bak (Fig. 9A). Single agents were without effect at any time point tested.
Fig. 9. Changes in the levels of antiapoptotic and proapoptotic Bcl-2 family proteins in CUR and CA-treated cells.
HL-60 and KG-1a cells were treated with the indicated concentrations of CUR and/or CA for 4-24 h followed by preparation of whole cell extracts. Expression levels of Bcl-2, Bcl-xL, Mcl-1, Bax and Bak (A) and BH3-only protein Bid (B) were determined by Western blot analysis. Calreticulin (CRN) was used as a protein loading control. Each blot is a representative of 3 similar blots. NS, non-specific polypeptide band.
Involvement of caspase-8 and caspase-9 in the apoptotic effect of the curcumin/carnosic acid combination
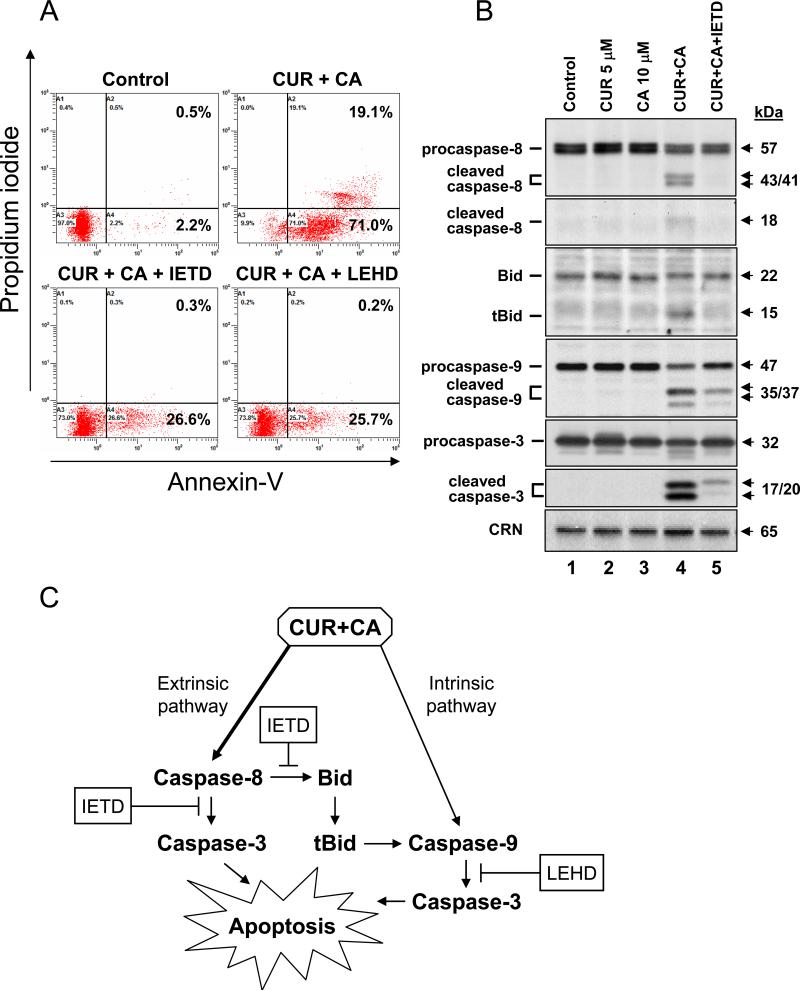
To explore the role of caspase-8 and-9 activation in CUR/CA-induced apoptosis, KG-1a cells were preincubated for 2 h with a specific cell-permeable inhibitor of caspase-8 (Z-IETD-fmk) or of caspase-9 (Z-LEHD-fmk) followed by treatment with CUR and CA, alone and in combination, for 24 h. As shown in Fig. 10A, the combination induced apoptosis in ~90% cells (the sum of early and late apoptotic populations), as determined by annexin-V/PI staining. The polyphenols alone were without effect (data not shown). Pretreatment with either Z-IETD-fmk or Z-LEHD-fmk caused a marked decrease (by about 65%) in the total percentage of apoptotic cells (Fig. 10A, lower panels). These results suggest that both the extrinsic and intrinsic apoptotic pathways are involved in cell death induced by the CUR/CA combination.
Fig. 10. Both caspase-8 and caspase-9 are involved in CUR/CA-induced apoptosis.
A: Effects of caspase inhibitors on CUR/CA-induced apoptosis. KG-1a cells were preincubated, where indicated, with 50 μM Z-IETD-fmk (caspase-8 inhibitor), 50 μM Z-LEHD-fmk (caspase-9 inhibitor) or without inhibitors (0.05% DMSO) for 2 h, followed by treatment with polyphenol vehicle (see Materials and Methods) or 5 μM CUR plus 10 μM CA for an additional 24 h. The percentage of apoptotic cells was determined by annexin-V/PI staining. Representative data from 3 independent experiments are shown. B: Effects of Z-IETD-fmk on caspase and Bid processing. KG-1a cells were preincubated with or without 50 μM Z-IETD-fmk for 2 h followed by treatment with the indicated polyphenols for an additional 8 h. Whole cell lysates were analyzed by Western blotting. Calreticulin (CRN) was used as a protein loading control. A representative of 3 similar experiments is shown. C: A simplified scheme of the possible mode of cell death induction by the CUR/CA combination through the activation of extrinsic and intrinsic apoptotic pathways (see Discussion for details).
Since of all the Bcl-2 proteins tested here only Bid levels changed noticeably in the early stages of CUR/CA-induced apoptosis (Fig. 9B), we attempted to test, using Z-IETD-fmk, whether CUR/CA-induced activation of caspase-8 may contribute to caspase-9 activation via Bid cleavage and generation of its active truncated form (tBid). To this end, KG-1a cells were treated with the CUR/CA combination for 8 h after pretreatment with vehicle or 50 μM Z-IETD-fmk, followed by Western blot analysis of caspase-8, Bid, caspase-9 and caspase-3 processing. CUR and CA alone were used to ascertain the specific apoptotic effect of their combination. As shown in Fig. 10B, Z-IETD-fmk completely inhibited CUR/CA-induced caspase-8 cleavage concomitant with the abrogation of tBid generation. Interestingly, these inhibitory events were associated with a marked suppression of the mitochondrial caspase-9 cleavage (Fig. 10B). These data indicate that CUR/CA-induced activation of caspase-9 (Figs 8 and 10B) may result, in part, from caspase-8-mediated generation of tBid, which is known to promote the intrinsic apoptotic pathway (36). Caspase-3 cleavage was also strongly suppressed in Z-IETD-fmk-treated cells (Fig. 10B), which could result from inhibition of both upstream initiator caspases.
Taken together, the above results provide an initial insight into the molecular mechanism of CUR/CA-induced cell death in AML cell lines, schematically illustrated in Fig. 10C and discussed in more detail below, which involves the activation of both the extrinsic and intrinsic apoptotic pathways.
DISCUSSION
In this study we characterized the antiproliferative and apoptotic effects of CUR, SIL and CA alone and in combinations in human AML cell lines. Although all three polyphenols alone were capable of markedly suppressing cell growth, the antiproliferative effect of CUR and CA, unlike that of SIL, was accompanied by substantial time- and dose-dependent cytotoxicity. The apparent lack of SIL cytotoxicity in HL-60 and KG-1a cells at concentrations up to 90 μM, also noted in other cancer cell lines, e.g. LNCaP prostate cancer cells (37), was probably one of the major factors determining a marked difference between CUR/SIL and CUR/CA combinations in their ability to induce cell death. Remarkably, substantial growth arrest and cell death evoked by CA and CUR was already evident at concentrations as low as 2.5-5.0 μM which, when applied singly, had no effect on cell viability and any of the specific apoptotic parameters tested, demonstrating clear synergistic interaction between the two agents. However, surprisingly, only a weak cooperation was observed between CUR and SIL over a range of concentrations. The reason for such distinct behavior of CUR combinations with two different polyphenols might reside in the structural features of the latter, and remains to be clarified. Other studies also showed that various phytochemicals can cooperate in antiproliferative and cytotoxic effects in cancer cells (reviewed in (7)). For instance, combinations of resveratrol and ellagic acid or quercetin (38) as well as of curcumin and epigallocatechin gallate (39) induced enhanced growth arrest and apoptosis in lymphocytic leukemia cells. Similar effects were reported for curcumin and isoflavone in pancreatic cancer cells (40).
Analysis of different cell death parameters strongly suggests that the primary cause for the cooperative cytotoxicity of CUR, CA and SIL, particularly that induced by CUR/CA, is a rapid induction of caspase-dependent apoptosis, and not necrotic cell death. Attempts to elucidate the mode of CUR/CA-induced apoptosis demonstrated rapid processing of the two major initiator caspases (-8 and -9), concomitant with the effector caspase-3 cleavage. Given the fact that apoptosis was markedly reduced by both caspase-8 and caspase-9 inhibitors, these results imply the involvement of both extrinsic and intrinsic apoptotic pathways which can converge at caspase-3 activation leading to apoptotic cell death (see scheme in Fig. 10C). It remains unclear whether the two pathways are independently activated by the CUR/CA combination. This possibility is supported by the fact that despite the complete inhibition of caspase-8 processing by Z-IETD-fmk there still remained detectable amounts of cleaved mitochondrial caspase-9 and effector caspase-3 forms (Fig. 10B), concomitant with the residual fraction of cells (~30%) that undergo apoptosis (Fig. 10A). On the other hand, an incomplete suppression of apoptosis by the caspase-9 inhibitor (Z-LEHD-fmk) may indicate that the extrinsic pathway may operate in CUR/CA-treated cells without the mitochondrial involvement. Our data suggest that the mitochondrial caspase-9 activation by CUR/CA may also be induced via the cross-talk mechanism mediated by the caspase-8-dependent formation of tBid, which can trigger the mitochondrial pathway by promoting oligomerization of Bax and Bak (41). Therefore, Bid cleavage in CUR/CA-treated cells may explain, at least in part, caspase-9 activation observed in the absence of changes in the expression levels of other Bcl-2 family proteins.
The exact molecular mechanism thereby apoptotic pathways are triggered by the CUR/CA combination remains to be elucidated. In some aspects, the combination effect appears to be similar to that of higher dose CUR alone (25-50 μM), which has been shown to induce substantial apoptotic death in HL60 cells through both death receptor-independent activation of caspase-8 (3) and the mitochondia-mediated intrinsic pathway (42). However, our data also indicate the existence of certain differences between the modes of CUR/CA and high dose CUR action. First, there was no indication of oxidative stress in CUR/CA-treated cells that could cause primary mitochondrial damage, thus inducing the intrinsic pathway, whereas several studies demonstrated association of CUR-induced apoptosis with oxidative stress (33,34). Second, early activation of mitochondrial caspase-9 in our experiments was not accompanied by detectable changes in the expression of either antiapoptotic (Bcl-2, Bcl-xL and Mcl-1) or proapoptotic (Bax and Bak) proteins. However, high dose CUR-induced apoptosis was reported to be associated with downregulation of Bcl-2 and Bcl-xL and elevation of Bax (33,42).
So far little is known about the ability of CA alone to affect cell viability. At concentrations of 10-20 μM this polyphenol has been found to induce only minor apoptosis in HL-60 cells (43). However, in HepG2 hepatocarcinoma cells (15) and SN4741 neuronal cells (44) CA exhibited rather protective effects against cell death. Therefore, it is currently unclear how exactly CUR and CA synergize in induction of apoptosis in AML cells. One possible cause for mutual enhancement between the polyphenols studied here may be chemical stabilization of one of the components of a combination by the other, or mutual stabilization due to antioxidant properties of plant polyphenols (45). Furthermore, one compound may facilitate intracellular accumulation of the other through inhibition of cellular mechanisms responsible for drug efflux (multidrug resistance systems). For instance, green tea polyphenols (46) and curcumin metabolite tetrahydrocurcumin (47) inhibited P-glycoprotein and other multidrug transporters. In addition, individual phytochemicals may exert their effects by different biochemical mechanisms, thus, affecting distinct cellular signaling and survival pathways, which would then converge on a common target, e.g. activation of caspases.
CUR, rosemary polyphenols, and SIL have been widely shown to have significant potential as chemoprevention and therapeutic agents in various models of cancer (2,5,12). Furthermore, data from recent clinical studies suggest that CUR and SIL can be safely administered in humans at pharmacologically relevant doses due to the low systemic toxicity of these agents (48,49). Despite their low bioavailability, the peak levels of CUR and SIL in human plasma could still reach 0.5–2 μM (48) and up to 70 μM (49), respectively, upon oral consumption of high doses. The bioavailability of CA in humans has not yet been established, whereas a pharmacokinetic study in SD rats administered intragastrically with 90 mg/kg CA demonstrated a high peak plasma concentration of the polyphenol (~100 μM) which slowly declined with time remaining at the level of ~30 μM for at least 24 h (50). Here we show that distinct combinations containing potentially bioavailable concentrations of CUR, CA and SIL were selectively toxic or growth inhibitory to human AML cells, without cytotoxicity to normal blood cells or fibroblasts. These findings warrant further exploration of the polyphenol-based combinatorial approach for the treatment of AML.
ACKNOWLEDGEMENTS
We thank Dr. Rachel Levy (Department of Clinical Biochemistry, Ben Gurion University), Dr. Nilli Grossman (Soroka Medical Center), and Dr. Eitan Fibach (Department of Hematology, Hadassah University Hospital, Jerusalem) for kindly providing leukemia cell lines. This study was supported by the National Institutes of Health; grant number: RO1-CA117942-02 (to G.P.S. and M.D.) and the Israel Science Foundation; grant number 778/07 (to M.D.).
REFERENCES
- 1.Shipley JL, Butera JN. Exp Hematol. 2009;37:649–658. doi: 10.1016/j.exphem.2009.04.002. [DOI] [PubMed] [Google Scholar]
- 2.Fresco P, Borges F, Diniz C, Marques MP. Med Res Rev. 2006;26:747–766. doi: 10.1002/med.20060. [DOI] [PubMed] [Google Scholar]
- 3.Anto RJ, Mukhopadhyay A, Denning K, Aggarwal BB. Carcinogenesis. 2002;23:143–150. doi: 10.1093/carcin/23.1.143. [DOI] [PubMed] [Google Scholar]
- 4.Li M, Zhang Z, Hill DL, Wang H, Zhang R. Cancer Res. 2007;67:1988–1996. doi: 10.1158/0008-5472.CAN-06-3066. [DOI] [PubMed] [Google Scholar]
- 5.Anand P, Sundaram C, Jhurani S, Kunnumakkara AB, Aggarwal BB. Cancer Lett. 2008;267:133–164. doi: 10.1016/j.canlet.2008.03.025. [DOI] [PubMed] [Google Scholar]
- 6.Lev-Ari S, Strier L, Kazanov D, Madar-Shapiro L, Dvory-Sobol H, et al. Clin Cancer Res. 2005;11:6738–6744. doi: 10.1158/1078-0432.CCR-05-0171. [DOI] [PubMed] [Google Scholar]
- 7.de Kok TM, van Breda SG, Manson MM. Eur J Nutr. 2008;47(Suppl 2):51–59. doi: 10.1007/s00394-008-2006-y. [DOI] [PubMed] [Google Scholar]
- 8.Somers-Edgar TJ, Scandlyn MJ, Stuart EC, Le Nedelec MJ, Valentine SP, et al. Int J Cancer. 2008;122:1966–1971. doi: 10.1002/ijc.23328. [DOI] [PubMed] [Google Scholar]
- 9.Khor TO, Keum YS, Lin W, Kim JH, Hu R, et al. Cancer Res. 2006;66:613–621. doi: 10.1158/0008-5472.CAN-05-2708. [DOI] [PubMed] [Google Scholar]
- 10.Son YG, Kim EH, Kim JY, Kim SU, Kwon TK, et al. Cancer Res. 2007;67:8274–8284. doi: 10.1158/0008-5472.CAN-07-0407. [DOI] [PubMed] [Google Scholar]
- 11.Raina K, Rajamanickam S, Singh RP, Deep G, Chittezhath M, et al. Cancer Res. 2008;68:6822–6830. doi: 10.1158/0008-5472.CAN-08-1332. [DOI] [PMC free article] [PubMed] [Google Scholar]
- 12.Singh RP, Agarwal R. Mol Carcinog. 2006;45:436–442. doi: 10.1002/mc.20223. [DOI] [PubMed] [Google Scholar]
- 13.Aruoma OI, Halliwell B, Aeschbach R, Loligers J. XENOBIOTICA. 1992;22:257–268. doi: 10.3109/00498259209046624. [DOI] [PubMed] [Google Scholar]
- 14.Mace K, Offord EA, Harris CC, Pfeifer AM. Arch Toxicol Suppl. 1998;20:227–236. doi: 10.1007/978-3-642-46856-8_20. [DOI] [PubMed] [Google Scholar]
- 15.Costa S, Utan A, Speroni E, Cervellati R, Piva G, et al. J Appl Toxicol. 2007;27:152–159. doi: 10.1002/jat.1186. [DOI] [PubMed] [Google Scholar]
- 16.Danilenko M, Wang Q, Wang X, Levy J, Sharoni Y, et al. Cancer Res. 2003;63:1325–1332. [PubMed] [Google Scholar]
- 17.Danilenko M, Wang X, Studzinski GP. J Natl Cancer Inst. 2001;93:1224–1233. doi: 10.1093/jnci/93.16.1224. [DOI] [PubMed] [Google Scholar]
- 18.Steiner M, Priel I, Giat J, Levy J, Sharoni Y, et al. Nutr Cancer. 2001;41:135–144. doi: 10.1080/01635581.2001.9680624. [DOI] [PubMed] [Google Scholar]
- 19.Wang Q, Salman H, Danilenko M, Studzinski GP. J Cell Physiol. 2005;204:964–974. doi: 10.1002/jcp.20355. [DOI] [PubMed] [Google Scholar]
- 20.Shabtay A, Sharabani H, Barvish Z, Kafka M, Amichay D, et al. Oncology. 2008;75:203–214. doi: 10.1159/000163849. [DOI] [PMC free article] [PubMed] [Google Scholar]
- 21.Sharabani H, Izumchenko E, Wang Q, Kreinin R, Steiner M, et al. Int J Cancer. 2006;118:3012–3021. doi: 10.1002/ijc.21736. [DOI] [PMC free article] [PubMed] [Google Scholar]
- 22.Polson RJ, Jenkins R, Lombard M, Williams AC, Roberts S, et al. Immunology. 1990;71:176–181. [PMC free article] [PubMed] [Google Scholar]
- 23.Deters M, Knochenwefel H, Lindhorst D, Koal T, Meyer HH, et al. Pharm Res. 2008;25:1822–1827. doi: 10.1007/s11095-008-9579-2. [DOI] [PubMed] [Google Scholar]
- 24.Hayon T, Atlas L, Levy E, Dvilansky A, Shpilberg O, et al. Cancer Detect Prev. 2003;27:389–396. doi: 10.1016/s0361-090x(03)00102-8. [DOI] [PubMed] [Google Scholar]
- 25.Rozenszajn LA, Goldman I, Kalechman Y, Michlin H, Sredni B, et al. Immunol Rev. 1981;54:157–186. doi: 10.1111/j.1600-065x.1981.tb00437.x. [DOI] [PubMed] [Google Scholar]
- 26.Meroni PL, Barcellini W, Borghi MO, Vismara A, Ferraro G, et al. Int J Tissue React. 1988;10:177–181. [PubMed] [Google Scholar]
- 27.Morishima C, Shuhart MC, Wang CC, Paschal DM, Apodaca MC, et al. Gastroenterology. 2009 [Google Scholar]
- 28.Min K, Yoon WK, Kim SK, Kim BH. Arch Pharm Res. 2007;30:1265–1272. doi: 10.1007/BF02980267. [DOI] [PubMed] [Google Scholar]
- 29.Hushmendy S, Jayakumar L, Hahn AB, Bhoiwala D, Bhoiwala DL, et al. Nutr Res. 2009;29:568–578. doi: 10.1016/j.nutres.2009.08.003. [DOI] [PMC free article] [PubMed] [Google Scholar]
- 30.Mainardi T, Kapoor S, Bielory L. J Allergy Clin Immunol. 2009;123:283–294. doi: 10.1016/j.jaci.2008.12.023. [DOI] [PubMed] [Google Scholar]
- 31.Crocenzi FA, Roma MG. Curr Med Chem. 2006;13:1055–1074. doi: 10.2174/092986706776360950. [DOI] [PubMed] [Google Scholar]
- 32.Saller R, Brignoli R, Melzer J, Meier R. Forsch Komplementmed. 2008;15:9–20. doi: 10.1159/000113648. [DOI] [PubMed] [Google Scholar]
- 33.Woo JH, Kim YH, Choi YJ, Kim DG, Lee KS, et al. Carcinogenesis. 2003;24:1199–1208. doi: 10.1093/carcin/bgg082. [DOI] [PubMed] [Google Scholar]
- 34.Javvadi P, Segan AT, Tuttle SW, Koumenis C. Mol Pharmacol. 2008;73:1491–1501. doi: 10.1124/mol.107.043554. [DOI] [PMC free article] [PubMed] [Google Scholar]
- 35.Fulda S, Debatin KM. Oncogene. 2006;25:4798–4811. doi: 10.1038/sj.onc.1209608. [DOI] [PubMed] [Google Scholar]
- 36.Yin XM. Cell Res. 2000;10:161–167. doi: 10.1038/sj.cr.7290045. [DOI] [PubMed] [Google Scholar]
- 37.Zi X, Agarwal R. Proc Natl Acad Sci U S A. 1999;96:7490–7495. doi: 10.1073/pnas.96.13.7490. [DOI] [PMC free article] [PubMed] [Google Scholar]
- 38.Mertens-Talcott SU, Percival SS. Cancer Lett. 2005;218:141–151. doi: 10.1016/j.canlet.2004.06.007. [DOI] [PubMed] [Google Scholar]
- 39.Ghosh AK, Kay NE, Secreto CR, Shanafelt TD. Clin Cancer Res. 2009;15:1250–1258. doi: 10.1158/1078-0432.CCR-08-1511. [DOI] [PMC free article] [PubMed] [Google Scholar]
- 40.Wang Z, Desmoulin S, Banerjee S, Kong D, Li Y, et al. Life Sci. 2008;83:293–300. doi: 10.1016/j.lfs.2008.06.017. [DOI] [PMC free article] [PubMed] [Google Scholar]
- 41.Korsmeyer SJ, Wei MC, Saito M, Weiler S, Oh KJ, et al. Cell Death Differ. 2000;7:1166–1173. doi: 10.1038/sj.cdd.4400783. [DOI] [PubMed] [Google Scholar]
- 42.Liao YF, Hung HC, Hour TC, Hsu PC, Kao MC, et al. Life Sci. 2008;82:367–375. doi: 10.1016/j.lfs.2007.11.022. [DOI] [PubMed] [Google Scholar]
- 43.Wang R, Li H, Guo G, Li X, Yu X, et al. J Int Med Res. 2008;36:682–690. doi: 10.1177/147323000803600409. [DOI] [PubMed] [Google Scholar]
- 44.Park JA, Kim S, Lee SY, Kim CS, Kim do K, et al. Neuroreport. 2008;19:1301–1304. doi: 10.1097/WNR.0b013e32830abc1f. [DOI] [PubMed] [Google Scholar]
- 45.Rahman I, Biswas SK, Kirkham PA. Biochem Pharmacol. 2006;72:1439–1452. doi: 10.1016/j.bcp.2006.07.004. [DOI] [PubMed] [Google Scholar]
- 46.Jodoin J, Demeule M, Beliveau R. Biochim Biophys Acta. 2002;1542:149–159. doi: 10.1016/s0167-4889(01)00175-6. [DOI] [PubMed] [Google Scholar]
- 47.Limtrakul P, Chearwae W, Shukla S, Phisalphong C, Ambudkar SV. Mol Cell Biochem. 2007;296:85–95. doi: 10.1007/s11010-006-9302-8. [DOI] [PubMed] [Google Scholar]
- 48.Cheng AL, Hsu CH, Lin JK, Hsu MM, Ho YF, et al. Anticancer Res. 2001;21:2895–2900. [PubMed] [Google Scholar]
- 49.Flaig TW, Gustafson DL, Su LJ, Zirrolli JA, Crighton F, et al. Invest New Drugs. 2007;25:139–146. doi: 10.1007/s10637-006-9019-2. [DOI] [PubMed] [Google Scholar]
- 50.Yan H, Wang L, Li X, Yu C, Zhang K, et al. Biomed Chromatogr. 2009;23:776–781. doi: 10.1002/bmc.1184. [DOI] [PubMed] [Google Scholar]


