

Abstract
We have measured concentration detection (i.e., psychometric) functions to determine the odor detectability of homologous aliphatic aldehydes (propanal, butanal, hexanal, octanal, and nonanal) and helional. Subjects (16 ≤ n ≤ 18) used a 3-alternative forced-choice procedure against carbon-filtered air (blanks), under an ascending concentration approach. Generation, delivery, and control of each vapor were achieved via an 8-station vapor delivery device. Gas chromatography served to quantify the concentrations presented. Group and individual functions were modeled by a sigmoid (logistic) equation. Odor detection thresholds (ODTs) were defined as the concentration producing a detectability (P) halfway (P = 0.5) between chance (P = 0.0) and perfect detection (P = 1.0). ODTs decreased with carbon chain length: 2.0, 0.46, 0.33, and 0.17 ppb, respectively, from propanal to octanal, but the threshold increased for nonanal (0.53 ppb), revealing maximum sensitivity for the 8-carbon member. The strong olfactory receptor (OR) ligands octanal and helional (0.14 ppb) showed the lowest thresholds. ODTs fell at the lower end of previously reported values. Interindividual variability (ODT ratios) amounted to a factor ranging from 10 to 50, lower than typically reported, and was highest for octanal and hexanal. The behavioral dose–response functions emerge at concentrations 2–5 orders of magnitude lower than those required for functions tracing the activation of specific human ORs by the same aldehydes in cell/molecular studies, after all functions were expressed as vapor concentrations.
Keywords: helional, homologous aldehydes, odor potency, odor thresholds, olfactory detection functions, olfactory structure–activity relationships
Introduction
Available data indicate that the detection of odorants by the olfactory sense is based on a combinatorial code of activated olfactory receptors (ORs) (Buck 2004). That is, each odorant activates a pattern of ORs, and, conversely, each OR responds to a number of odorants (Firestein 2004). In addition, each olfactory sensory neuron is thought to express one type of OR (Malnic 2007). Humans have a total of 800 olfactory genes of which about 380 code for intact protein receptors (Olender et al. 2008). The rest are pseudogenes, albeit some pseudogenes might still be functional (Lai et al. 2008). Thus, there are close to 400 types of human ORs, although very few from any species, with the exception of Drosophila, have been linked to their respective odorant ligands, that is, have been deorphanized (Malnic 2007).
A few deorphanized ORs from mammals have been found to be strongly responsive to aldehydes, in particular homologous aliphatic aldehydes, for example, butanal (Mizrahi et al. 2004), heptanal (Krautwurst et al. 1998), octanal (Araneda et al. 2000, 2004; Benbernou et al. 2007; Hall et al. 2004; Peterlin et al. 2008; Zhao et al. 1998), and nonanal (Sanz et al. 2005; Benbernou et al. 2007), as well as bulkier and/or more rigid aldehydes, that is, helional (Hatt et al. 1999; Wetzel et al. 1999; Jacquier et al. 2006), lilial (Doszczak et al. 2007; Cook et al. 2009), lyral (Singer and Shepherd 1994; Touhara et al. 1999; Grosmaitre et al. 2006), citronellal (Krautwurst et al. 1998; Shirokova et al. 2005; Schmiedeberg et al. 2007; Stary et al. 2007), and bourgeonal (Spehr et al. 2004). Some of these ORs are human ORs (Hatt et al. 1999; Wetzel et al. 1999; Sanz et al. 2005; Jacquier et al. 2006; Doszczak et al. 2007; Schmiedeberg et al. 2007). In principle, one can predict that the particular aldehydes shown to be the most potent ligands in cell/receptor assays employing human ORs could also turn out to be the most potent odorants (i.e., those with the lowest threshold) in human psychophysical detection tasks. Obviously, many other factors beyond the bare odorant ligand/OR interaction can modulate this outcome. These factors not only include the influence of neural processing at higher levels of the olfactory pathway but also include events happening even before the ligand/receptor interaction, for example, the influence of odorant-binding proteins (OBPs) (Vidic et al. 2008; Ko et al. 2010). In this regard, a human OBP has been shown to possess binding specificity for aldehydes (Tcatchoff et al. 2006), and a rat OBP was shown to increase the odorant detection sensitivity of the rat ORI7 to its specific odorant ligand octanal (Ko and Park 2008). These findings illustrate the need to complement the study of olfactory structure–activity relationships at the cell/receptor level (Singer 2000; Araneda et al. 2004; Hall et al. 2004; Saito et al. 2009) with those at the psychophysical odor detection level (Abraham et al. 2002; Abraham, Sanchez-Moreno, et al. 2007; Cometto-Muñiz and Abraham 2008b, 2009a) to gain a comprehensive understanding of the olfactory system sensitivity as a whole.
In the present study, we measure human concentration detection (i.e., psychometric) functions for the odor of selected aliphatic aldehydes and for helional, both at the individual and group (16 ≤ n ≤ 18) levels. The research is part of a broader effort to establish quantitative structure–activity relationships for the human olfactory detection of airborne chemicals, under an apparatus and methodology aimed to minimize sources of chemicoanalytical and psychophysical variability and uncertainty, while enhancing speed and efficiency of subject testing (Cometto-Muñiz et al. 2003; Cometto-Muñiz and Abraham 2008b, 2009a, 2009b; Cometto-Muñiz et al. 2008). The obtained dose–response functions can be compared with equivalent functions from receptor and olfactory neuron measurements (at the peripheral, olfactory bulb, and/or higher neural levels) to gain novel insights into the detection and processing of chemical signals via olfaction.
Materials and methods
An institutional review board at the University of California, San Diego, approved the protocol for all experiments described here. All participants provided written informed consent.
Stimuli
We tested the following aldehydes (purity or source and CAS number in parenthesis, FCC: Food Chemical Codex quality): propanal (97%) (CAS 123-38-6), butanal (≥99%) (CAS 123-72-8), hexanal (98%) (CAS 66-25-1), octanal (99%) (CAS 124-13-0), nonanal (95+%, FCC) (CAS 124-19-6), and helional, that is, alpha methyl-1,3-benzodioxole-5-propanal (International Flavors and Fragrances) (CAS 1205-17-0).
Subjects
A total of 43 participants (19 female) ranging from 18 to 37 years of age were recruited. They were nonsmokers, and all performed in the normosmic (normal sense of smell) range in a clinical olfactory test (Cain 1989). Not all subjects were available to be tested with every aldehyde, but 2 participants (female) were tested with all 6 stimuli. Table 1 presents the characteristics of the various subgroups of participants.
Table 1.
Number and characteristics of subjects in the various subgroups and of the 2 common subjects tested with all 6 aldehydes
| Subject subgroups | Number of subjects | Average age (y ± SD) | Age range (y) | Number of males | Number of females |
| Propanal | 16 | 26 ± 5 | 19–37 | 8 | 8 |
| Butanal | 18 | 22 ± 5 | 18–37 | 9 | 9 |
| Hexanal | 16 | 23 ± 5 | 18–37 | 9 | 7 |
| Octanal | 16 | 24 ± 5 | 19–37 | 7 | 9 |
| Nonanal | 17 | 25 ± 6 | 19–37 | 7 | 10 |
| Helional | 17 | 24 ± 5 | 19–37 | 7 | 10 |
| Common subjects | 2 | 20–37 | — | 2 |
SD, standard deviation.
Apparatus and procedure
We used an olfactometer especially designed with the aim of optimizing the generation, delivery, and control of odorant vapors, as well as the efficiency of subject testing in human chemosensory detection tasks. The instrument is an 8-station vapor delivery device (VDD8) that has been described in detail in recent publications (Cain et al. 2007; Cometto-Muñiz and Abraham 2008b, 2009a, 2009b; Cometto-Muñiz et al. 2008). Briefly, each station consists of 3 sniffing cones: 2 presenting blanks (carbon-filtered air) and 1 presenting the odorant (active cone), randomly selected in each trial. Participants move sequentially from station 1 (lowest concentration) to station 8 (highest concentration), selecting in each station the cone that smells different and rating their confidence in the decision on a scale ranging from “1” (not confident at all, just guessing) to “5” (extremely confident). Thus, we employ a 3-alternative, forced-choice procedure with an ascending concentration approach. Local extraction of air above the cones and a very high room ventilation rate (18 air changes per hour) with 100% fresh air (no recirculation) maintain an environment with negligible odor background. Dilutions are achieved in the VDD8 by changing ratios between the odorant line flow and the (carbon-filtered) air line flow, both tightly monitored. The dilution occurs at the base of the active cones. A speaker system instructs subjects to sniff from each cone in a 5-s window and to wait 15 s before continuing to the next station. After finishing with all 8 stations (what we call a “round”), participants leave the room. The experimenter sets a new random order of active cones and waits for at least 5 min. Then, the subjects are called back and perform another round. During the course of a day (session), participants complete 35 rounds. Sessions with a particular aldehyde continue until at least 16 subjects have finished testing. The order of testing of aldehydes was randomized.
Gas chromatography
Quantification of the concentrations delivered was confirmed by gas chromatography (GC) (flame ionization detector) by means of a calibration curve for mass, specific for each odorant (Cometto-Muñiz et al. 2003). On every testing day, before subjects started the session and 1 or 2 times per hour thereafter, we took vapor samples from the odorant line and injected them into the GC instrument for reading against the calibration curve. The samples were taken from a sampling port in the path of the metered odorant line flow, centimeters before it enters the base of the cone and is diluted to its final concentration by the metered air line flow. (Sampling right before the final dilution at the cone provided odorant concentrations that are just high enough to be read by direct injection into the GC). The average coefficient of variation of these vapor concentrations across testing sessions (i.e., days) equaled 28% for propanal, 13% for butanal, 15% for hexanal, 22% for octanal, 23% for nonanal, and 32% for helional. The range of final concentrations tested for each aldehyde, in 7 binary steps, was 0.12–15 ppb by volume for propanal, 0.056–7.1 ppb for butanal, 0.049–6.2 ppb for hexanal, 0.018–2.3 ppb for octanal, 0.029–3.7 ppb for nonanal, and 0.020–2.6 ppb for helional.
Data analysis and modeling
The outcome is summarized as plots of detection probability corrected for chance, that is, detectability, (P) vs. vapor concentration in log ppb (called psychometric functions) and as confidence rating versus vapor concentration (log ppb). Correction for chance produced a number between P = 0.0 (chance detection) and P = 1.0 (perfect detection) according to Macmillan and Creelman (1991):
| (1) |
where P = detection probability corrected for chance, m = number of choices per trial (here, 3), and p(c) = proportion correct (i.e., number of correct trials/total number of trials).
A sigmoid (logistic) equation served to model psychometric functions for the group and for each individual as follows:
 |
(2) |
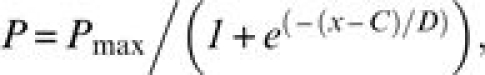
where P = detection probability (0 ≤ P ≤ 1), Pmax = 1.0, x = vapor concentration (log ppb by volume), and C and D are constants (fitted parameters). C is the value of x when P = 0.5, that is, when detection probability is halfway (P = 0.5) between chance (P = 0.0) and perfect (P = 1.0) detection. Constant C was taken as the odor detection threshold (ODT) expressed in log ppb. In turn, the constant D defines the steepness of the function such that the smaller the value of D, the steeper the function. Statistical significance was established by analysis of variance (ANOVA) (SuperANOVA v.1.11, Abacus Concepts, Inc).
Results
Figure 1 (left) presents the group psychometric functions for homologous aldehydes and helional. Along homologs, functions shifted progressively to the left (i.e., toward lower concentrations) from propanal to octanal, indicating an increase in olfactory potency, that is, a decrease in odor threshold, with increasing carbon chain length. This trend ended with nonanal, whose function shifted to the right (higher threshold), close to that of butanal. Helional, the aldehyde outside the homologous series, was the most potent odorant, slightly more so than octanal. Its psychometric function was shifted to the extreme left and, consequently, had the lowest threshold. As expected, these patterns of odor detectability were closely mirrored by those of confidence ratings (Figure 1, right). Table 2 quantifies the key parameters of the group function for each aldehyde, including: ODT (in ppb), C(±SE) (in log ppb), D(±SE), and 2 measurements of goodness of fit: R2 and χ2. The sigmoid, equation (2), provided a very adequate fit to the experimental data. The lower section of Table 2 shows the same key parameters but for the 2 common subjects tested with all 6 odorants. The close similarity between the outcome for all subjects and that for the common subjects indicates that differences in threshold among compounds are not due to differences in subject samples.
Figure 1.

Group psychometric odor function (left) and confidence ratings as a function of vapor concentration (right) for each aldehyde. Each point represents the outcome of 560 trials made by 16 subjects for propanal, hexanal, and octanal; 630 trials made by 18 subjects for butanal; and 595 trials made by 17 subjects for nonanal and helional. Bars indicate standard error. Psychometric functions (left) were modeled by the sigmoid equation (2).
Table 2.
Upper section—quantification of the group psychometric odor function for each aldehyde, including number of subjects (n), ODT, constant C (i.e., the ODT in log ppb) (±standard error, SE), constant D (±SE), R2, and χ2; lower section—same data but for the 2 common subjects tested with all 6 aldehydes
| n | ODT (ppb) | C (log ppb) | SE (C) | D | SE (D) | R2 | χ2 | |
| All subjects | ||||||||
| Propanal | 16 | 2.0 | 0.305 | ±0.016 | 0.21 | ±0.014 | 0.997 | 0.0039 |
| Butanal | 18 | 0.46 | −0.334 | ±0.017 | 0.20 | ±0.015 | 0.996 | 0.0045 |
| Hexanal | 16 | 0.33 | −0.482 | ±0.050 | 0.44 | ±0.049 | 0.975 | 0.0185 |
| Octanal | 16 | 0.17 | −0.759 | ±0.019 | 0.37 | ±0.018 | 0.996 | 0.0034 |
| Nonanal | 17 | 0.53 | −0.274 | ±0.028 | 0.25 | ±0.025 | 0.991 | 0.0106 |
| Helional | 17 | 0.14 | −0.868 | ±0.024 | 0.20 | ±0.021 | 0.992 | 0.0096 |
| Common subjects | ||||||||
| Propanal | 2 | 1.8 | 0.265 | ±0.036 | 0.17 | ±0.033 | 0.979 | 0.0265 |
| Butanal | 2 | 0.55 | −0.259 | ±0.028 | 0.12 | ±0.023 | 0.988 | 0.0212 |
| Hexanal | 2 | 0.41 | −0.389 | ±0.062 | 0.41 | ±0.058 | 0.964 | 0.0303 |
| Octanal | 2 | 0.28 | −0.554 | ±0.061 | 0.42 | ±0.058 | 0.964 | 0.0292 |
| Nonanal | 2 | 0.74 | −0.129 | ±0.077 | 0.29 | ±0.070 | 0.930 | 0.0670 |
| Helional | 2 | 0.18 | −0.734 | ±0.030 | 0.07 | ±0.032 | 0.987 | 0.0204 |
Supplementary Figures S1–S6 present the individual psychometric functions for all aldehydes. Each subject was assigned a unique number so that the performance of participants tested with more than one aldehyde can be followed across odorants. Table 3 quantifies each of these individual functions in terms of C, D, and R2. We see that the sigmoid, equation (2), also provided a very close fit to individual data, with 90 of the 100 individual functions having an R2 of 0.90 or higher.
Table 3.
Values of C, D, and R2 for each individual psychometric odor function for the aldehydes
|
Propanal (n = 16) |
Butanal (n = 18) |
Hexanal (n = 16) |
|||||||||
| Subject | C (log ppb) | D | R2 | Subject | C (log ppb) | D | R2 | Subject | C (log ppb) | D | R2 |
| 3 | 0.25 | 0.21 | 0.98 | 2 | −0.08 | 0.25 | 0.97 | 1 | −1.08 | 0.05 | 1.00 |
| 6 | 0.13 | 0.25 | 0.95 | 4 | −0.16 | 0.15 | 0.99 | 7 | −0.61 | 0.11 | 0.99 |
| 7 | 0.10 | 0.15 | 0.98 | 5 | −0.18 | 0.13 | 0.97 | 9 | 0.51 | 0.15 | 0.85 |
| 8 | 0.47 | 0.12 | 0.97 | 7 | −0.30 | 0.15 | 0.97 | 14 | −0.84 | 0.48 | 0.91 |
| 12 | 0.45 | 0.21 | 0.90 | 8 | −0.32 | 0.09 | 0.96 | 16 | −0.86 | 0.26 | 0.95 |
| 13 | 0.39 | 0.21 | 0.99 | 9 | −0.45 | 0.05 | 0.96 | 20 | −1.22 | 0.12 | 0.95 |
| 14 | 0.13 | 0.18 | 0.99 | 10 | −0.74 | 0.11 | 0.97 | 21 | −0.75 | 0.26 | 0.99 |
| 19 | 0.25 | 0.20 | 0.96 | 14 | −0.15 | 0.07 | 0.99 | 22 | −0.11 | 0.17 | 0.96 |
| 22 | 0.36 | 0.12 | 0.92 | 15 | −0.27 | 0.22 | 0.98 | 23 | −0.35 | 0.41 | 0.79 |
| 25 | 0.45 | 0.23 | 0.94 | 17 | −0.72 | 0.17 | 0.98 | 24 | −0.04 | 0.24 | 0.96 |
| 28 | 0.47 | 0.22 | 0.92 | 21 | −0.66 | 0.17 | 0.97 | 25 | −0.34 | 0.21 | 0.98 |
| 30 | 0.27 | 0.15 | 0.96 | 22 | −0.39 | 0.13 | 0.96 | 26 | −0.48 | 0.36 | 0.95 |
| 31 | 0.51 | 0.06 | 0.91 | 23 | −0.50 | 0.11 | 1.00 | 27 | 0.09 | 0.49 | 0.82 |
| 32 | −0.10 | 0.12 | 0.99 | 26 | −0.41 | 0.11 | 0.96 | 31 | −0.11 | 0.30 | 0.96 |
| 34 | 0.09 | 0.10 | 0.97 | 29 | −0.41 | 0.17 | 0.98 | 38 | 0.08 | 0.42 | 0.78 |
| 35 | 0.69 | 0.19 | 0.99 | 31 | −0.25 | 0.09 | 0.97 | 39 | −1.15 | 0.07 | 0.99 |
| 37 | 0.09 | 0.11 | 0.97 | ||||||||
| 38 | 0.18 | 0.67 | 0.85 | ||||||||
| Average | 0.31 | 0.17 | −0.32 | 0.16 | −0.45 | 0.26 | |||||
| SE | 0.05 | 0.01 | 0.06 | 0.03 | 0.13 | 0.04 | |||||
|
Octanal (n = 16) |
Nonanal (n = 17) |
Helional (n = 17) |
|||||||||
| Subject | C (log ppb) | D | R2 | Subject | C (log ppb) | D | R2 | Subject | C (log ppb) | D | R2 |
| 7 | −0.24 | 0.12 | 0.79 | 8 | −0.58 | 0.06 | 0.98 | 7 | −0.91 | 0.12 | 0.96 |
| 8 | −1.21 | 0.16 | 0.98 | 10 | −0.66 | 0.05 | 0.97 | 11 | −1.27 | 0.39 | 0.98 |
| 10 | −1.10 | 0.26 | 0.96 | 12 | 0.25 | 0.14 | 0.99 | 12 | −0.88 | 0.09 | 0.98 |
| 11 | −1.25 | 0.17 | 0.99 | 13 | 0.09 | 0.17 | 0.93 | 13 | −0.39 | 0.07 | 0.90 |
| 14 | −0.04 | 0.10 | 0.91 | 14 | 0.21 | 0.18 | 0.92 | 14 | −0.63 | 0.06 | 1.00 |
| 19 | −0.27 | 0.50 | 0.67 | 18 | −0.43 | 0.18 | 0.93 | 16 | −0.76 | 0.19 | 0.91 |
| 21 | −1.17 | 0.31 | 0.99 | 21 | −0.55 | 0.09 | 0.83 | 21 | −0.96 | 0.16 | 0.96 |
| 22 | −0.93 | 0.16 | 0.97 | 22 | −0.41 | 0.06 | 0.95 | 22 | −0.80 | 0.02 | 0.96 |
| 25 | −0.48 | 0.21 | 0.97 | 24 | −0.27 | 0.07 | 0.98 | 25 | −0.92 | 0.13 | 1.00 |
| 26 | −0.95 | 0.22 | 0.92 | 25 | 0.14 | 0.11 | 0.95 | 26 | −0.75 | 0.22 | 0.99 |
| 28 | −0.43 | 0.13 | 0.98 | 26 | −0.11 | 0.06 | 0.98 | 27 | −1.00 | 0.11 | 0.98 |
| 29 | −1.04 | 0.23 | 0.98 | 28 | −0.09 | 0.10 | 0.99 | 28 | −0.79 | 0.01 | 0.99 |
| 30 | −0.67 | 0.20 | 0.96 | 29 | −0.78 | 0.19 | 0.93 | 31 | −0.84 | 0.06 | 0.99 |
| 33 | −1.54 | 0.12 | 0.99 | 30 | −0.46 | 0.13 | 0.98 | 40 | −0.69 | 0.08 | 0.95 |
| 36 | 0.22 | 0.47 | 0.73 | 31 | −0.36 | 0.02 | 0.97 | 41 | −1.54 | 0.23 | 0.97 |
| 38 | −0.63 | 0.15 | 0.97 | 34 | −0.72 | 0.12 | 1.00 | 42 | −1.12 | 0.09 | 1.00 |
| 36 | 0.41 | 0.10 | 0.88 | 43 | −0.95 | 0.16 | 0.99 | ||||
| Average | −0.73 | 0.22 | −0.25 | 0.11 | −0.89 | 0.13 | |||||
| SE | 0.12 | 0.03 | 0.09 | 0.01 | 0.06 | 0.02 | |||||
SE, standard error.
The results of a 2-way ANOVA for the factors gender and aldehyde on the individual values of C (i.e., the ODT in log ppb) revealed a significant effect for aldehyde (F5,88 = 20.8, P < 0.0001) but not for gender or the interaction gender × aldehyde. A follow-up contrast within the aldehyde factor showed that ODTs for the 2 odorants reported to be the most potent ligand for a specific OR (octanal and helional) were significantly lower than those for the rest of the aldehydes (F = 63.6, P < 0.0001), giving statistical support to the results shown in Figure 1 (left) and Tables 2 and 3. As mentioned, the value of D reflects the steepness of the psychometric function. D can be calculated from the group function (Table 2) or from the average of individual D‘s (Table 3). The values of D from the group functions ranged from 0.20 to 0.44 (Table 2) and were higher than those averaged from individual functions which ranged from 0.11 to 0.26 (Table 3). In any case, neither set of D values showed a consistent trend among homologs or between aldehydes that have been shown to be the most potent ligand for a specific OR and those that have not.
Discussion
Group odor detectability
Olfactory potency along homologous aldehydes increased consistently (i.e., thresholds decreased) between propanal and octanal. This trend has been observed before in a study that delivered the aldehydes via a “squeeze bottle” system and measured ODTs using a fixed-performance criterion (Cometto-Muñiz et al. 1998) rather than the comprehensive psychometric function approach employed here. Still, 2 important differences emerge between present and previous aldehydes data. The first difference is that the present ODTs are lower than those obtained previously, although the gap between the 2 sets of ODTs decreases with increasing carbon chain length. For the 3 aldehydes common to both studies, we find that the gap equals 3.8 orders of magnitude for butanal, 2.4 for hexanal, and 1.4 for octanal. In fact, using the present approach, we consistently found lower ODTs than previously observed (and also found a decreasing gap) for all series tested: n-alcohols (Cometto-Muñiz and Cain 1990; Cometto-Muñiz and Abraham 2008b), acetates (Cometto-Muñiz and Cain 1991; Cometto-Muñiz et al. 2008), 2-ketones (Cometto-Muñiz and Cain 1993; Cometto-Muñiz and Abraham 2009b), and alkylbenzenes (Cometto-Muñiz and Cain 1994; Cometto-Muñiz and Abraham 2009a). As discussed in the recent papers just cited, the improvements in olfactometric and psychophysical techniques led to lower ODTs by removing various sources of uncertainty and variability (i.e., “noise”). The second difference between the present and previous aldehydes data resulted from expanding the range of homologs tested by adding propanal and nonanal at each end. We now find that the trend in decreasing thresholds is reversed upon reaching the 9-carbon homolog, whose ODT now increases. The result alters the trend that showed monotonically decreasing ODTs as a function of carbon chain length into one that shows an incipient U shape (Figure 2). In fact, 2 additional recently study series, acetates and alkylbenzenes, also show this U-shape trend (Cometto-Muñiz et al. 2008; Cometto-Muñiz and Abraham 2009a) (Figure 2). The outcome suggests that human olfactory sensitivity measured at the integrated, behavioral, level reaches an optimum molecular dimension (or size) within homologous series such that odor detectability peaks at a certain chain length, declining for smaller or larger homologs. The phenomenon is somewhat reminiscent of the cutoff effect observed for trigeminal chemosensory irritation (i.e., chemesthesis) (Cometto-Muñiz et al. 2007b). Nevertheless, the chemesthetic cutoff is quite more drastic than the effect in olfaction because homologs beyond a certain size do not just increase their irritation threshold (becoming less potent) but loose altogether their ability to evoke chemesthesis, even when one increases vapor concentration by heating the liquid chemical (Cometto-Muñiz et al. 2005a, 2005b, 2006, 2007a, 2007b; Cain et al. 2006; Cometto-Muñiz and Abraham 2008a). Although the 2 remaining series: n-alcohols and 2-ketones reached a plateau in ODTs rather than showing a U-shaped trend (Figure 2), the possibility remains that subsequent homologs beyond 1-octanol and 2-nonanone might show an increase in ODTs. The issue is open for further investigation. We note that the aldehydes have the lowest thresholds among all the tested series (Figure 2). This might be related to the existence of specific ORs for the aldehydes, as discussed below, and/or to their particular chemical reactivity (Abraham, Sanchez-Moreno, et al. 2007). Within the aldehydes tested, those that were found to be the most potent ligands for specific ORs (cases of octanal and helional) also were the ones with the lowest ODTs by, at least, a factor of 2 (Table 2).
Figure 2.

Plot of ODTs as a function of the variable alkyl carbon chain length for homologous aliphatic aldehydes (this study), n-alcohols (Cometto-Muñiz and Abraham 2008b), acetates (Cometto-Muñiz et al. 2008), 2-ketones (Cometto-Muñiz and Abraham 2009b), and n-alkylbenzenes (Cometto-Muñiz and Abraham 2009a). Bars (sometimes hidden by the symbol) represent standard error of the mean.
One could argue that if the present and other recent work did indeed succeed in minimizing various sources of interfering “noise” in sensory and chemicoanalytical measurements, then the obtained ODTs should appear at the low end of reported values from odor threshold compilations (Devos et al. 1990; van Gemert 2003). Figure 3 shows that this is precisely the case. Our ODTs are close to those recently reported by Nagata (Nagata 2003) using a triangle odor bag method (Iwasaki 2003).
Figure 3.

Values of ODTs for homologous aldehydes (in vapor phase) from studies compiled by van Gemert (van Gemert 2003) (diamonds) and those compiled and standardized by Devos et al. (Devos et al. 1990) (circles). Also shown are the ODTs from Nagata (Nagata 2003) (triangles) and from the present study (crosses).
In terms of the steepness of the functions (quantified by the value of D), we have not found a consistent trend among aldehydes. Other series have produced mixed results. n-Alkylbenzenes and 2-ketones have shown no or partial trends (Cometto-Muñiz and Abraham 2009a, 2009b), whereas n-alcohols and acetate esters have shown a significant decrease in the value of D (i.e., functions became steeper) with increasing carbon chain length (Cometto-Muñiz and Abraham 2008b; Cometto-Muñiz et al. 2008). Perhaps, the uniformity of D values across aldehydes reflects the fact that they might activate quite specifically a narrower range of ORs than the other series. This would agree with 1) the relative narrow overall range of ODTs from highest to lowest seen for the aldehydes compared with the other series tested (Figure 2) and 2) the considerably higher odor potency (i.e., lower ODTs) of aldehydes compared with other series (Figure 2).
Individual odor detectability and intersubject variability
The considerable amount of odor detection data gathered per subject allowed us to examine individual psychometric functions for each aldehyde (Supplementary Figures S1 to S6, and Table 3). As was the case for the group data, the sigmoid equation (2) also provided a very adequate description of individual data. A question of interest among our group of normosmic, nonsmoker, young adults was the extent of performance variability across subjects for each aldehyde. The ratio of ODTs (in parts per billion) between the least and the most sensitive subject equaled 6 for propanal, 8 for butanal, 53 for hexanal, 55 for octanal, 15 for nonanal, and 7 for helional. The outcome is illustrated in Figure 4. If the behavioral detection of odorants that are the most potent ligand for a specific OR is assumed to be heavily dependent on the integrity of mainly that OR, one could speculate that 1) the ODT for such odorants would be lower than those for chemically related, less potent ligands and 2) due to genetic variation in ORs, the spread in ODTs among individuals (Figure 4) would be larger for odorant ligands activating mainly one critical OR than for those activating a wide pattern of ORs where no single receptor type is critical. The first expectation was met for octanal, among the most potent ligands for human OR1A1 and OR1A2 (Schmiedeberg et al. 2007), and for helional, the most potent ligand for human OR 17-40 (Hatt et al. 1999; Wetzel et al. 1999; Jacquier et al. 2006), but was not met for nonanal, a strong ligand of human OR1G1 (Sanz et al. 2005) (Figure 1, Table 2). The second expectation was met for octanal and, to some extent, nonanal but not for helional (Figure 4). A recent investigation found hexanal to be even more potent than octanal and nonanal as a ligand of human OR2W1 (Saito et al. 2009). If, based on these findings, hexanal is also considered a most potent odorant for some specific OR, then both expectations (particularly the second one) were met for hexanal (Figures 1 and 4, Table 2).
Figure 4.

Comparison of psychometric functions between the least and the most sensitive subject for each aldehyde (with their respective ODT). The least and most sensitive subjects for propanal, butanal, hexanal, octanal, nonanal, and helional were, respectively, subjects 35 and 32, 38 and 10, 9 and 39, 36 and 33, 36 and 29, and 13 and 11.
Comparison of olfactory dose–response functions for aldehydes tested at the behavioral and at the cell/receptor level
A number of investigations using preparations from mouse, rat, and human origin have measured dose–response functions for specific ORs, employing, among other odorants, some of the aldehydes tested here: hexanal, octanal, nonanal, and helional. These studies are summarized in Table 4, where the parameter of interest is the “effective concentration 50” (EC50). The EC50 is the concentration of the odorant producing half (50%) of the maximum response obtained for that particular preparation (when all sources of unspecific responses have been discounted). The EC50 can be compared with our constant C, that is, the ODT concentration. We recognize that there are differences between the concepts underlying each measurement and that there are several limitations in the comparison of the 2. As mentioned below, cell/receptor functions could also be compared with suprathreshold odor functions. Furthermore, because human ORs are far from having been completely sampled and characterized, the comparison of EC50s and ODTs is preliminary. Using the limited data presently available, we deemed worthwhile to probe for a tentative comparison between olfactory responses emerging at the 2 neural levels, particularly as it relates to issues of structure–activity within the selected aldehydes. Both parameters, EC50 and C, are obtained from dose–response functions modeled by sigmoid equations. We note that in all cell/receptor studies cited in Table 4, with one exception (Sanz et al. 2005), the odorant stimulus is presented as a liquid solution (Concliquid), whereas in all our experiments, and in the noted exception, the odorant is presented as a vapor, that is, a gas (Concgas). Thus, in order to make meaningful comparisons of olfactory potency between the 2 parameters for any given odorant, we must first express both values in the same physical state, e.g., vapor. We have done precisely that by establishing, for each odorant, the partition coefficient between the gas and liquid media, according to
| (3) |
The method to obtain these coefficients (K) has been described in detail in a recent publication (Abraham, Ibrahim, and Acree 2007). It does not make much difference whether the liquid phase is water (Kw) or some variation of physiological saline (Ksal), typically at 37 °C, as commonly used in cell/receptor studies. To strengthen comparability between data sets, we chose Ksal at 37 °C (Table 4). Once the partition coefficients are taken into account, we find that, with one exception, ODTs calculated from constant C are quite lower than the corresponding EC50s for the same odorants, by a factor ranging from 1 to 6 orders of magnitude. The factor ranges from 2 to 5 orders of magnitude if we consider only human ORs: OR2W1 (Saito et al. 2009) and OR1G1 (Sanz et al. 2005) (Table 4). The exception is the study by Wetzel et al. (1999) on the response of OR17-40 to helional, although this paper does not report an EC50. It only reports a “threshold” response that emerges within a concentration range whose upper boundary (0.007 nM, vapor phase) is very close to our ODT for helional (0.006 nM).
Table 4.
Comparison of ODTs from the present study with EC50 values, expressed in vapor phase via log Ksal, from studies testing olfactory cell/receptor preparations
| Odorant | Species | Stimulus phase | Response level | Receptors tested | Fitting model | EC50 (log M) | EC50 (nM) | Log Ksal (@37 °C) | EC50 or ODT (nM) Vapor phase | Reference |
| Hexanal | Human | Vapor | Behavioral | All | Sigmoid (eq. 2) | 1.67 | 0.014 | This study | ||
| Hexanal | Human | Liquid | Cell | OR2W1 | Sigmoidal | −5.102 | 7907 | 1.67 | 168 | Saito et al. (2009) |
| Hexanal | Mouse | Liquid | Cell | MOR4-1 | Sigmoidal | −3.231 | 587 489 | 1.67 | 12 509 | Saito et al. (2009) |
| Hexanal | Mouse | Liquid | Cell | MOR271-1 | Sigmoidal | −3.322 | 476 431 | 1.67 | 10 144 | Saito et al. (2009) |
| Hexanal | Mouse | Liquid | Cell | MOR1-1 | Sigmoidal | −3.987 | 103 039 | 1.67 | 2194 | Saito et al. (2009) |
| Octanal | Human | Behavioral | All | Sigmoid (eq. 2) | 1.46 | 0.007 | This study | |||
| Octanal | Human | Liquid | OR2W1 | Sigmoidal | −4.361 | 43 551 | 1.46 | 1519 | Saito et al. (2009) | |
| Octanal | Rat | Liquid | Olfactory sensory neurons | OR-I7 | Hill function | −5.745 | 1800 | 1.46 | 63 | Peterlin et al. (2008) |
| Octanal | Rat | Liquid | Olfactory sensory neurons | OR-I7 | Hill equation | −5.721 | 1900 | 1.46 | 66 | Araneda et al. (2004) |
| Octanal | Mouse | Liquid | Cell (HeLa/Olf) | Rho-tag-39-Olfr43 | Equation | −4.648 | 22 500 | 1.46 | 785 | Shirokova et al. (2005) |
| Nonanal | Human | Vapor | Behavioral | All | Sigmoid (eq. 2) | 1.36 | 0.022 | This study | ||
| Nonanal | Human | Vapor | Cell (HEK293) | OR 1G1 | No fitting | 1.36 | 1000 | Sanz et al. (2005) | ||
| Nonanal | Human | Liquid | Cell | OR2W1 | Sigmoidal | −3.598 | 252 348 | 1.36 | 11 046 | Saito et al. (2009) |
| Nonanal | Mouse | Liquid | Cell | MOR40-1 | Sigmoidal | −3.194 | 639 735 | 1.36 | 28 002 | Saito et al. (2009) |
| Nonanal | Mouse | Liquid | Cell | MOR37-1 | Sigmoidal | −3.295 | 506 991 | 1.36 | 22 192 | Saito et al. (2009) |
| Nonanal | Mouse | Liquid | Cell | MOR33-1 | Sigmoidal | −3.234 | 583 445 | 1.36 | 25 538 | Saito et al. (2009) |
| Nonanal | Mouse | Liquid | Cell | MOR30-1 | Sigmoidal | −3.914 | 121 899 | 1.36 | 5336 | Saito et al. (2009) |
| Helional | Human | Vapor | Behavioral | All | Sigmoid (eq. 2) | 5.17 | 0.006 | This study | ||
| Helional | Human | Liquid | Cell (HEK293, Xenopus laevis oocytes) | OR17-40 | Threshold | −7.000 to −6.000 | 100–1000 | 5.17 | 0.0007 to 0.007 | Wetzel et al. (1999) |
| Helional | Human | Liquid | Cell (HEK293) | h-OR17-40 | Equation | −4.006 | 98 700 | 5.17 | 0.67 | Jacquier et al. (2006) |
| Helional | Human | Liquid | Cell (HEK293) | h-OR17-40-EGFP | Equation | −3.942 | 114 400 | 5.17 | 0.78 | Jacquier et al. (2006) |
| Helional | Mouse | Liquid | Cell (HeLa/Olf) | Rho-tag-39-Olfr43 | Equation | −5.444 | 3600 | 5.17 | 0.025 | Shirokova et al. (2005) |
A straightforward explanation for the much higher sensitivity shown by the behavioral response rests on the stimulation of the intact olfactory epithelium, including relevant perireceptor factors, for example, OBPs (Ko and Park 2008), and on the various degrees of signal sharpening and contrast provided by progressively higher stages of the olfactory pathway (Christie and Westbrook 2006; Vogt 2006). In any case, we suggest that there is merit in attempting further systematic comparisons of dose–response functions, measured at different processing levels, for both strong specific ligands of particular ORs and broader acting odorants. For example, comparing functions obtained in unicellular versus multicellular recordings, peripheral versus central locations, and “in vitro” versus “in vivo” conditions. As an integral part of these comparisons, one could also include another behavioral end point: suprathreshold concentration–response (i.e., psychophysical) functions. The outcome will help to increase our understanding of how the chemical information contained in odorants is detected and subsequently processed by the sense of smell.
Supplementary Material
Supplementary Figures S1–S6 can be found at http://www.chemse.oxfordjournals.org/.
Funding
This work was supported by the National Institute on Deafness and Other Communication Disorders at the National Institutes of Health [R01 DC 002741 to J.E.C.-M.].
Supplementary Material
Acknowledgments
Thanks are due to E. Moreno-Davis for excellent technical assistance. Thanks are also due to M. Bahramzi, A. Budiman, and A. Rahman for their help in testing subjects and processing and plotting data.
References
- Abraham MH, Gola JMR, Cometto-Muñiz JE, Cain WS. A model for odour thresholds. Chem Senses. 2002;27:95–104. doi: 10.1093/chemse/27.2.95. [DOI] [PubMed] [Google Scholar]
- Abraham MH, Ibrahim A, Acree WE. Partition of compounds from gas to water and from gas to physiological saline at 310 K: linear free energy relationships. Fluid Phase Equilib. 2007;251:93–109. [Google Scholar]
- Abraham MH, Sanchez-Moreno R, Cometto-Muñiz JE, Cain WS. A quantitative structure-activity analysis on the relative sensitivity of the olfactory and the nasal trigeminal chemosensory systems. Chem Senses. 2007;32:711–719. doi: 10.1093/chemse/bjm038. [DOI] [PubMed] [Google Scholar]
- Araneda RC, Kini AD, Firestein S. The molecular receptive range of an odorant receptor. Nat Neurosci. 2000;3:1248–1255. doi: 10.1038/81774. [DOI] [PubMed] [Google Scholar]
- Araneda RC, Peterlin Z, Zhang X, Chesler A, Firestein S. A pharmacological profile of the aldehyde receptor repertoire in rat olfactory epithelium. J Physiol. 2004;555:743–756. doi: 10.1113/jphysiol.2003.058040. [DOI] [PMC free article] [PubMed] [Google Scholar]
- Benbernou N, Tacher S, Robin S, Rakotomanga M, Senger F, Galibert F. Functional analysis of a subset of canine olfactory receptor genes. J Hered. 2007;98:500–505. doi: 10.1093/jhered/esm054. [DOI] [PubMed] [Google Scholar]
- Buck LB. Olfactory receptors and odor coding in mammals. Nutr Rev. 2004;62:S184–S188. doi: 10.1111/j.1753-4887.2004.tb00097.x. discussion S224–S241. [DOI] [PubMed] [Google Scholar]
- Cain WS. Testing olfaction in a clinical setting. Ear Nose Throat J. 1989;68:316–328. [PubMed] [Google Scholar]
- Cain WS, Lee NS, Wise PM, Schmidt R, Ahn BH, Cometto-Muñiz JE, Abraham MH. Chemesthesis from volatile organic compounds: psychophysical and neural responses. Physiol Behav. 2006;88:317–324. doi: 10.1016/j.physbeh.2006.03.035. [DOI] [PubMed] [Google Scholar]
- Cain WS, Schmidt R, Wolkoff P. Olfactory detection of ozone and D-limonene: reactants in indoor spaces. Indoor Air. 2007;17:337–347. doi: 10.1111/j.1600-0668.2007.00476.x. [DOI] [PubMed] [Google Scholar]
- Christie JM, Westbrook GL. Lateral excitation within the olfactory bulb. J Neurosci. 2006;26:2269–2277. doi: 10.1523/JNEUROSCI.4791-05.2006. [DOI] [PMC free article] [PubMed] [Google Scholar]
- Cometto-Muñiz JE, Abraham MH. A cut-off in ocular chemesthesis from vapors of homologous alkylbenzenes and 2-ketones as revealed by concentration-detection functions. Toxicol Appl Pharmacol. 2008a;230:298–303. doi: 10.1016/j.taap.2008.03.011. [DOI] [PMC free article] [PubMed] [Google Scholar]
- Cometto-Muñiz JE, Abraham MH. Human olfactory detection of homologous n-alcohols measured via concentration-response functions. Pharmacol Biochem Behav. 2008b;89:279–291. doi: 10.1016/j.pbb.2007.12.023. [DOI] [PMC free article] [PubMed] [Google Scholar]
- Cometto-Muñiz JE, Abraham MH. Olfactory detectability of homologous n-alkylbenzenes as reflected by concentration-detection functions in humans. Neuroscience. 2009a;161:236–248. doi: 10.1016/j.neuroscience.2009.03.029. [DOI] [PMC free article] [PubMed] [Google Scholar]
- Cometto-Muñiz JE, Abraham MH. Olfactory psychometric functions for homologous 2-ketones. Behav Brain Res. 2009b;201:207–215. doi: 10.1016/j.bbr.2009.02.014. [DOI] [PMC free article] [PubMed] [Google Scholar]
- Cometto-Muñiz JE, Cain WS. Thresholds for odor and nasal pungency. Physiol Behav. 1990;48:719–725. doi: 10.1016/0031-9384(90)90217-r. [DOI] [PubMed] [Google Scholar]
- Cometto-Muñiz JE, Cain WS. Nasal pungency, odor, and eye irritation thresholds for homologous acetates. Pharmacol Biochem Behav. 1991;39:983–989. doi: 10.1016/0091-3057(91)90063-8. [DOI] [PubMed] [Google Scholar]
- Cometto-Muñiz JE, Cain WS. Efficacy of volatile organic compounds in evoking nasal pungency and odor. Arch Environ Health. 1993;48:309–314. doi: 10.1080/00039896.1993.9936719. [DOI] [PubMed] [Google Scholar]
- Cometto-Muñiz JE, Cain WS. Sensory reactions of nasal pungency and odor to volatile organic compounds: the alkylbenzenes. Am Ind Hyg Assoc J. 1994;55:811–817. doi: 10.1080/15428119491018529. [DOI] [PubMed] [Google Scholar]
- Cometto-Muñiz JE, Cain WS, Abraham MH. Nasal pungency and odor of homologous aldehydes and carboxylic acids. Exp Brain Res. 1998;118:180–188. doi: 10.1007/s002210050270. [DOI] [PubMed] [Google Scholar]
- Cometto-Muñiz JE, Cain WS, Abraham MH. Quantification of chemical vapors in chemosensory research. Chem Senses. 2003;28:467–477. doi: 10.1093/chemse/28.6.467. [DOI] [PubMed] [Google Scholar]
- Cometto-Muñiz JE, Cain WS, Abraham MH. Molecular restrictions for human eye irritation by chemical vapors. Toxicol Appl Pharmacol. 2005a;207:232–243. doi: 10.1016/j.taap.2005.02.004. [DOI] [PubMed] [Google Scholar]
- Cometto-Muñiz JE, Cain WS, Abraham MH. Determinants for nasal trigeminal detection of volatile organic compounds. Chem Senses. 2005b;30:627–642. doi: 10.1093/chemse/bji056. [DOI] [PubMed] [Google Scholar]
- Cometto-Muñiz JE, Cain WS, Abraham MH, Sánchez-Moreno R. Chemical boundaries for detection of eye irritation in humans from homologous vapors. Toxicol Sci. 2006;91:600–609. doi: 10.1093/toxsci/kfj157. [DOI] [PubMed] [Google Scholar]
- Cometto-Muñiz JE, Cain WS, Abraham MH, Sánchez-Moreno R. Concentration-detection functions for eye irritation evoked by homologous n-alcohols and acetates approaching a cut-off point. Exp Brain Res. 2007a;182:71–79. doi: 10.1007/s00221-007-0966-4. [DOI] [PubMed] [Google Scholar]
- Cometto-Muñiz JE, Cain WS, Abraham MH, Sánchez-Moreno R. Cut-off in detection of eye irritation from vapors of homologous carboxylic acids and aliphatic aldehydes. Neuroscience. 2007b;145:1130–1137. doi: 10.1016/j.neuroscience.2006.12.032. [DOI] [PMC free article] [PubMed] [Google Scholar]
- Cometto-Muñiz JE, Cain WS, Abraham MH, Gil-Lostes J. Concentration-detection functions for the odor of homologous n-acetate esters. Physiol Behav. 2008;95:658–667. doi: 10.1016/j.physbeh.2008.09.021. [DOI] [PMC free article] [PubMed] [Google Scholar]
- Cook BL, Steuerwald D, Kaiser L, Graveland-Bikker J, Vanberghem M, Berke AP, Herlihy K, Pick H, Vogel H, Zhang S. Large-scale production and study of a synthetic G protein-coupled receptor: human olfactory receptor 17-4. Proc Natl Acad Sci U S A. 2009;106:11925–11930. doi: 10.1073/pnas.0811089106. [DOI] [PMC free article] [PubMed] [Google Scholar]
- Devos M, Patte F, Rouault J, Laffort P, van Gemert LJ. Standardized human olfactory thresholds. Oxford: IRL Press; 1990. [Google Scholar]
- Doszczak L, Kraft P, Weber HP, Bertermann R, Triller A, Hatt H, Tacke R. Prediction of perception: probing the hOR17-4 olfactory receptor model with silicon analogues of bourgeonal and lilial. Angew Chem Int Ed Engl. 2007;46:3367–3371. doi: 10.1002/anie.200605002. [DOI] [PubMed] [Google Scholar]
- Firestein S. A code in the nose. Sci STKE. 2004 doi: 10.1126/stke.2272004pe15. 2004: pe15. [DOI] [PubMed] [Google Scholar]
- Grosmaitre X, Vassalli A, Mombaerts P, Shepherd GM, Ma M. Odorant responses of olfactory sensory neurons expressing the odorant receptor MOR23: a patch clamp analysis in gene-targeted mice. Proc Natl Acad Sci U S A. 2006;103:1970–1975. doi: 10.1073/pnas.0508491103. [DOI] [PMC free article] [PubMed] [Google Scholar]
- Hall SE, Floriano WB, Vaidehi N, Goddard WA., 3rd Predicted 3-D structures for mouse I7 and rat I7 olfactory receptors and comparison of predicted odor recognition profiles with experiment. Chem Senses. 2004;29:595–616. doi: 10.1093/chemse/bjh063. [DOI] [PubMed] [Google Scholar]
- Hatt H, Gisselmann G, Wetzel CH. Cloning, functional expression and characterization of a human olfactory receptor. Cell Mol Biol. 1999;45:285–291. [PubMed] [Google Scholar]
- Iwasaki Y. Odor measurement review. Tokyo, Japan: Office of Odor, Noise and Vibration. Environmental Management Bureau, Ministry of Environment; 2003. The history of odor measurement in Japan and triangle odor bag method; pp. 37–47. [Google Scholar]
- Jacquier V, Pick H, Vogel H. Characterization of an extended receptive ligand repertoire of the human olfactory receptor OR17-40 comprising structurally related compounds. J Neurochem. 2006;97:537–544. doi: 10.1111/j.1471-4159.2006.03771.x. [DOI] [PubMed] [Google Scholar]
- Ko HJ, Lee SH, Oh EH, Park TH. Specificity of odorant-binding proteins: a factor influencing the sensitivity of olfactory receptor-based biosensors. Bioprocess Biosyst Eng. 2010;33:55–62. doi: 10.1007/s00449-009-0348-3. [DOI] [PubMed] [Google Scholar]
- Ko HJ, Park TH. Enhancement of odorant detection sensitivity by the expression of odorant-binding protein. Biosens Bioelectron. 2008;23:1017–1023. doi: 10.1016/j.bios.2007.10.008. [DOI] [PubMed] [Google Scholar]
- Krautwurst D, Yau KW, Reed RR. Identification of ligands for olfactory receptors by functional expression of a receptor library. Cell. 1998;95:917–926. doi: 10.1016/s0092-8674(00)81716-x. [DOI] [PubMed] [Google Scholar]
- Lai PC, Bahl G, Gremigni M, Matarazzo V, Clot-Faybesse O, Ronin C, Crasto CJ. An olfactory receptor pseudogene whose function emerged in humans: a case study in the evolution of structure-function in GPCRs. J Struct Funct Genomics. 2008;9:29–40. doi: 10.1007/s10969-008-9043-x. [DOI] [PMC free article] [PubMed] [Google Scholar]
- Macmillan NA, Creelman CD. Cambridge: Cambridge University Press; 1991. Detection theory: a user's guide. [Google Scholar]
- Malnic B. Searching for the ligands of odorant receptors. Mol Neurobiol. 2007;35:175–181. doi: 10.1007/s12035-007-0013-2. [DOI] [PubMed] [Google Scholar]
- Mizrahi A, Matsunami H, Katz LC. An imaging-based approach to identify ligands for olfactory receptors. Neuropharmacology. 2004;47:661–668. doi: 10.1016/j.neuropharm.2004.07.020. [DOI] [PubMed] [Google Scholar]
- Nagata Y. Odor measurement review. Tokyo, Japan: Office of Odor, Noise and Vibration. Environmental Management Bureau, Ministry of Environment; 2003. Measurement of odor threshold by triangle odor bag method; pp. 118–127. [Google Scholar]
- Olender T, Lancet D, Nebert DW. Update on the olfactory receptor (OR) gene superfamily. Hum Genomics. 2008;3:87–97. doi: 10.1186/1479-7364-3-1-87. [DOI] [PMC free article] [PubMed] [Google Scholar]
- Peterlin Z, Li Y, Sun G, Shah R, Firestein S, Ryan K. The importance of odorant conformation to the binding and activation of a representative olfactory receptor. Chem Biol. 2008;15:1317–1327. doi: 10.1016/j.chembiol.2008.10.014. [DOI] [PMC free article] [PubMed] [Google Scholar]
- Saito H, Chi Q, Zhuang H, Matsunami H, Mainland JD. Odor coding by a mammalian receptor repertoire. Sci Signal. 2009;2:ra9. doi: 10.1126/scisignal.2000016. [DOI] [PMC free article] [PubMed] [Google Scholar]
- Sanz G, Schlegel C, Pernollet JC, Briand L. Comparison of odorant specificity of two human olfactory receptors from different phylogenetic classes and evidence for antagonism. Chem Senses. 2005;30:69–80. doi: 10.1093/chemse/bji002. [DOI] [PubMed] [Google Scholar]
- Schmiedeberg K, Shirokova E, Weber HP, Schilling B, Meyerhof W, Krautwurst D. Structural determinants of odorant recognition by the human olfactory receptors OR1A1 and OR1A2. J Struct Biol. 2007;159:400–412. doi: 10.1016/j.jsb.2007.04.013. [DOI] [PubMed] [Google Scholar]
- Shirokova E, Schmiedeberg K, Bedner P, Niessen H, Willecke K, Raguse JD, Meyerhof W, Krautwurst D. Identification of specific ligands for orphan olfactory receptors. G protein-dependent agonism and antagonism of odorants. J Biol Chem. 2005;280:11807–11815. doi: 10.1074/jbc.M411508200. [DOI] [PubMed] [Google Scholar]
- Singer MS. Analysis of the molecular basis for octanal interactions in the expressed rat 17 olfactory receptor. Chem Senses. 2000;25:155–165. doi: 10.1093/chemse/25.2.155. [DOI] [PubMed] [Google Scholar]
- Singer MS, Shepherd GM. Molecular modeling of ligand-receptor interactions in the OR5 olfactory receptor. Neuroreport. 1994;5:1297–1300. doi: 10.1097/00001756-199406020-00036. [DOI] [PubMed] [Google Scholar]
- Spehr M, Schwane K, Heilmann S, Gisselmann G, Hummel T, Hatt H. Dual capacity of a human olfactory receptor. Curr Biol. 2004;14:R832–R833. doi: 10.1016/j.cub.2004.09.034. [DOI] [PubMed] [Google Scholar]
- Stary A, Suwattanasophon C, Wolschann P, Buchbauer G. Differences in (-)citronellal binding to various odorant receptors. Biochem Biophys Res Commun. 2007;361:941–945. doi: 10.1016/j.bbrc.2007.07.137. [DOI] [PubMed] [Google Scholar]
- Tcatchoff L, Nespoulous C, Pernollet JC, Briand L. A single lysyl residue defines the binding specificity of a human odorant-binding protein for aldehydes. FEBS Lett. 2006;580:2102–2108. doi: 10.1016/j.febslet.2006.03.017. [DOI] [PubMed] [Google Scholar]
- Touhara K, Sengoku S, Inaki K, Tsuboi A, Hirono J, Sato T, Sakano H, Haga T. Functional identification and reconstitution of an odorant receptor in single olfactory neurons. Proc Natl Acad Sci U S A. 1999;96:4040–4045. doi: 10.1073/pnas.96.7.4040. [DOI] [PMC free article] [PubMed] [Google Scholar]
- van Gemert LJ. Odour thresholds. Compilations of odour threshold values in air, water and other media. Utrecht, The Netherlands: Oliemans, Punter & Partners BV; 2003. [Google Scholar]
- Vidic J, Grosclaude J, Monnerie R, Persuy MA, Badonnel K, Baly C, Caillol M, Briand L, Salesse R, Pajot-Augy E. On a chip demonstration of a functional role for odorant binding protein in the preservation of olfactory receptor activity at high odorant concentration. Lab Chip. 2008;8:678–688. doi: 10.1039/b717724k. [DOI] [PubMed] [Google Scholar]
- Vogt RG. How sensitive is a nose? Sci STKE. 2006 doi: 10.1126/stke.3222006pe8. 2006: pe8. [DOI] [PubMed] [Google Scholar]
- Wetzel CH, Oles M, Wellerdieck C, Kuczkowiak M, Gisselmann G, Hatt H. Specificity and sensitivity of a human olfactory receptor functionally expressed in human embryonic kidney 293 cells and Xenopus Laevis oocytes. J Neurosci. 1999;19:7426–7433. doi: 10.1523/JNEUROSCI.19-17-07426.1999. [DOI] [PMC free article] [PubMed] [Google Scholar]
- Zhao H, Ivic L, Otaki JM, Hashimoto M, Mikoshiba K, Firestein S. Functional expression of a mammalian odorant receptor. Science. 1998;279:237–242. doi: 10.1126/science.279.5348.237. [DOI] [PubMed] [Google Scholar]
Associated Data
This section collects any data citations, data availability statements, or supplementary materials included in this article.