

Abstract
In the intact heart, the distribution of electromechanical delay (EMD), the time interval between local depolarization and myocyte shortening onset, depends on the loading conditions. The distribution of EMD throughout the heart remains, however, unknown because current experimental techniques are unable to evaluate three-dimensional cardiac electromechanical behavior. The goal of this study was to determine the three-dimensional EMD distributions in the intact ventricles for sinus rhythm (SR) and epicardial pacing (EP) by using a new, to our knowledge, electromechanical model of the rabbit ventricles that incorporates a biophysical representation of myofilament dynamics. Furthermore, we aimed to ascertain the mechanisms that underlie the specific three-dimensional EMD distributions. The results revealed that under both conditions, the three-dimensional EMD distribution is nonuniform. During SR, EMD is longer at the epicardium than at the endocardium, and is greater near the base than at the apex. After EP, the three-dimensional EMD distribution is markedly different; it also changes with the pacing rate. For both SR and EP, late-depolarized regions were characterized with significant myofiber prestretch caused by the contraction of the early-depolarized regions. This prestretch delays myofiber-shortening onset, and results in a longer EMD, giving rise to heterogeneous three-dimensional EMD distributions.
Introduction
The onset of local myofiber shortening (mechanical activation) in the intact ventricles follows the local electrical depolarization by as much as tens of milliseconds. This electromechanical delay (EMD) has two components:
-
1.
The intrinsic latent period between membrane depolarization and myofilament activation in the process of myocyte excitation-contraction coupling.
-
2.
Additional EMD component arising from the local myofiber mechanical loading conditions in the intact heart.
The mechanical loading conditions, and therefore EMD, depend on the pattern of electrical activation in the ventricles. Experimental evidence has demonstrated that there is a difference in EMD on the epicardium between apex and base in sinus rhythm (SR), and that this difference is altered by a change in the activation sequence (1,2). Recently, the existence of transmural differences in EMD has also been reported. Specifically, measurements of EMD during SR along the transmural direction at a single location in the LV free wall revealed that, at that location, EMD was longer at the late-depolarized epicardial site than at the corresponding endocardial site (3). After epicardial pacing (EP), the transmural mechanical activation times at the same location were different from those during SR, suggesting that the transmural distribution of EMD may be altered in the paced heart (4). These experimental findings indicate that the EMD distribution could be nonuniform throughout the ventricles and dependent on the activation sequence. However, current experimental techniques such as radiopaque bead markers and ultrasonic crystals as well as echocardiography and even magnetic resonance imaging are limited in their ability to evaluate the three-dimensional distribution of mechanical activation times and its dependence on loading conditions. Furthermore, recording of electrical activity simultaneously with any of these techniques is limited either to the epicardial surface or to a single transmural location. Therefore, alternative approaches must be undertaken to analyze the three-dimensional electromechanical activity in the heart under different loading conditions. Realistic computer simulations provide such an opportunity.
The goals of this study are to test, using a sophisticated electromechanical simulation approach, the hypotheses that EMD distribution is heterogeneous throughout the three-dimensional volume of the ventricles and is radically different in SR and after EP. The electromechanical behavior and mechanisms that give rise to the specific EMD distributions in the ventricles under these different loading conditions are then ascertained.
Methods
Electromechanical model
Fig. 1 A presents the overall scheme of the new, to our knowledge, three-dimensional electromechanical model of the rabbit ventricles. Geometry of the ventricles is based on the UCSD representation (5). The electromechanical model is composed of two parts, an electrical component, and a mechanical component, coupled via the intracellular calcium (Ca) transient. The intracellular Ca transient links biophysically detailed models of local membrane kinetics and local cardiac myofilament dynamics throughout the ventricles. The myofilament model describes the binding of Ca to Troponin C, and the development of active tension (Ta; see Fig. 1 A). Deformation of the ventricles (contraction) arises from the active tension generated by the cardiac cells. The resultant stretch ratio (i.e., the ratio of fiber length before and after deformation) in the fiber direction, λ, and its time derivative, dλ/dt, in turn, affect myofilament dynamics, including length-dependent Ca myofilament sensitivity.
Figure 1.
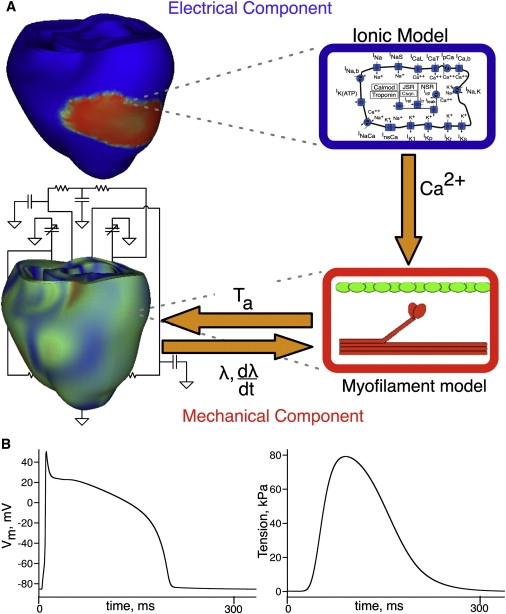
(A) Schematic diagram of the electromechanical model. (B) Traces of transmembrane potential (left) and active tension (right) in the model.
Mathematical description of cardiac tissue in the electrical component of the model is based on the bidomain representation, which has been previously validated and used extensively by our group (6,7). Although explicit representation of current flow in the extracellular space, as provided by the bidomain approach, is not essential during propagation, it was chosen here to adequately represent the load on the current in immediate proximity to the endocardial surfaces, which are in contact with the low-resistance blood in the cavity, thus ensuring accurate electrical activation times in the endocardial layers (8). The mechanics component is based on continuum models of passive cardiac mechanics (9). The myocardium is assumed to be transversely isotropic, hyperelastic, nearly-incompressible material, with passive mechanical properties defined by an exponential strain energy function (10). The latter was modified by adjusting the material parameters to match tension-strain curves from equibiaxial stretch experiments (11) and by adjusting the scaling constant C to ensure that the end diastolic LV volume was 3.8 mL (12). The model parameters are in Table S1 in the Supporting Material. Realistic fiber orientations from the UCSD rabbit ventricular geometry (5) were incorporated into both components of the model. Fiber orientation determined the anisotropic electrical conductivity, the anisotropic passive mechanical properties, and the direction in which uniaxial active stress acts.
The Shannon-Bers ionic model (13) was employed to represent the membrane kinetics in the rabbit ventricles. The biophysical model by Rice et al. (14) was used to represent cardiac myofilament dynamics because this model recapitulates the strong dependence of both active tension amplitude and duration on sarcomere length. Temporal traces of transmembrane potential and active tension, as calculated from the ionic and myofilament models, are shown in Fig. 1 B. Consistent with the goal of the study, homogeneous electrophysiological and mechanical properties were assumed throughout the ventricles (i.e., the intrinsic cell E-C coupling latency was kept constant), allowing for a comprehensive examination of the role of the loading conditions in creating heterogeneity in EMD distribution.
Similar to previous studies (15), we did not implement strong coupling between electrical and mechanical components to reduce the computational load. The tension generated by the myofilament model was scaled by setting the linear spring constant kxb to 60 mN/mm2 to ensure that the maximum LV pressure during isovolumic contraction was 22.6 kPa (16). Finally, the electromechanical model of the ventricles was coupled to a closed-system representation of the circulatory system. We used the implementation of Kerckhoffs et al. (17), which we adjusted for the rabbit ventricles according to experimental data (18). The parameters are in Table S2.
The electrical component of the model was numerically solved on a mesh of tetrahedral finite elements using a Crank-Nicolson integration scheme, as described previously (19). The solver for the mechanical problem employed numerical integration on 192 hexahedral finite elements with 7832 degrees of freedom, using the methodology described elsewhere (15).
Simulation protocol and data analysis
Electrical activation sequences
Two activation sequences were simulated in the model, SR and EP. To represent the activation sequence in the rabbit ventricles during SR as observed experimentally (21), the model ventricles were activated at several locations along the endocardial surface of the inferior two-thirds of the LV and RV free walls as if activation originated from the Purkinje network (22). Endocardial locations at the midbase (62% of the distance between apex and base in the long axis direction) were stimulated with a delay of 10 ms after those at the apex. The timings at which the endocardium was stimulated as well as the conductivity values were adjusted (Table S3) until electrical activation matched experimental data (21).
To determine how EMD distribution is altered with changes in the electrical activation sequence, and thus, in loading conditions, EP simulation was performed; the pacing site was located at the midbase of the LV anterolateral wall, as done experimentally (4). Simulations of EP and SR were conducted at a basic cycle length (BCL) of 350 ms. To ascertain how the three-dimensional EMD distribution changes with pacing rate, EP was also performed at BCL of 250 ms. The parameters of the myofilament model were thus adjusted accordingly (Table S4). For each simulation, steady state was achieved after 20 beats.
Data analysis
Strain in the fiber direction (Eff) was analyzed throughout the ventricles. The end-diastolic state of the ventricles was the reference state for strain calculations. The local electrical activation time was defined as the instant at which transmembrane voltage exceeded 0 mV. The local onset of myofiber shortening (local mechanical activation time) was defined as the time when local myofiber shortening reached 10% of its maximum (23). EMD was calculated as the time interval between local electrical activation time and local onset of myofiber shortening.
Results
Three-dimensional distributions of EMD
Fig. 2 presents maps of electrical activation times (panel A) and myofiber shortening onset times (panel B) during SR and EP in short axis views of the ventricles in direction base to apex. In SR, the general direction of both electrical and mechanical activation was from endocardium to epicardium, and from apex to base. After EP at the location indicated by asterisk, the depolarization wave propagated from the anterior LV wall toward the posterior; mechanical activation also followed this pattern.
Figure 2.
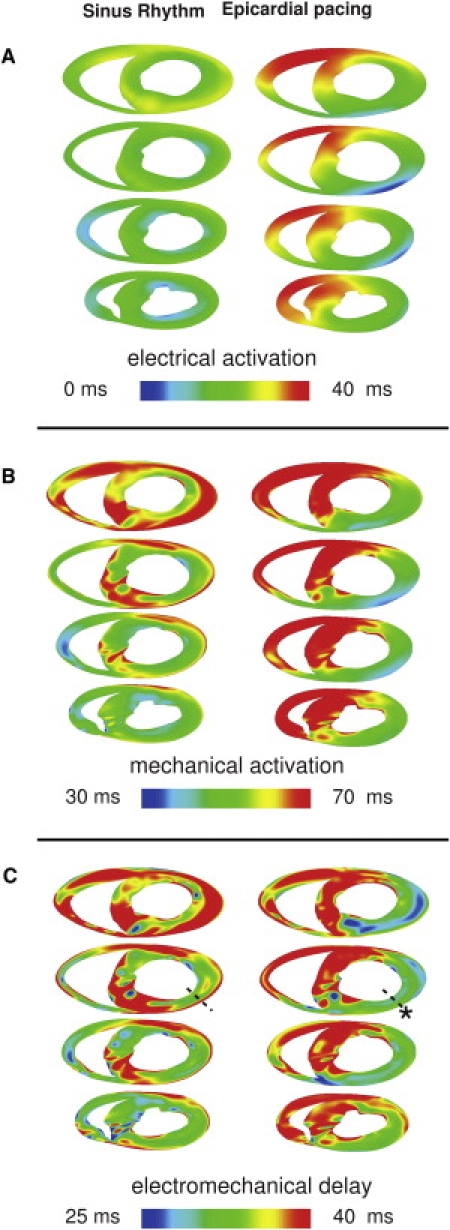
Electrical activation (A), mechanical activation (B), and EMD (C) maps for SR and EP at different short-axis cross-sections of the ventricles. The asterisk marks the pacing location. (Dashed line) Transmural direction from the pacing site. (Bottom of images) Anterior wall.
Transmural maps of EMD in the same short-axis views are shown in Fig. 2 C. In SR, there were transmural differences in EMD throughout the LV free wall. At the midbase, along the dashed line across the LV anterior wall, EMD was 35 and 43 ms at the endo- and epicardium, respectively. The transmural differences in EMD attenuated near the apex. For EP, EMD distribution was markedly different from that in SR. EMD was significantly larger at the late-depolarized posterior wall than at the early-depolarized LV anterior wall. The transmural differences in EMD at the LV anterior wall were smaller; along the dashed line, EMD was shorter at the endo- than at the epicardium, 31 vs. 33 ms. EMD distribution near the apex exhibited a pattern similar to that at the base.
Fig. 3 presents endo- and epicardial distributions of electrical activation time (Fig. 3 A), mechanical activation time (Fig. 3 B), and EMD (Fig. 3 C) on the epi- and endocardium of the LV free wall for SR and EP. Fiber direction on the epicardium is illustrated by the orientation of the short lines in each map. In SR, the endocardium was activated electrically much faster than the epicardium. EMD increased from apex to base on the epicardial surfaces. The apex-to-base dispersion of EMD was smaller on the endocardium than on the epicardium. Thus, for SR, the differences in EMD between epicardium and endocardium were smaller around the apex and larger at the midbase (Fig. 3 C, left), consistent with results shown in Fig. 2 (left). After EP, the pattern of EMD distribution was different from that in SR. EMD at the midbase was shorter than that at the apex and the posterior wall (Fig. 3 C, right). The transmural differences in EMD near the apex and those at the midbase were not different. The EMD distribution after EP remained different from that in SR for other pacing locations as well, which we confirmed by conducting simulations with alternate pacing site. A sample of the data is presented in Fig. S2, where the ventricles were paced from the posterior wall.
Figure 3.
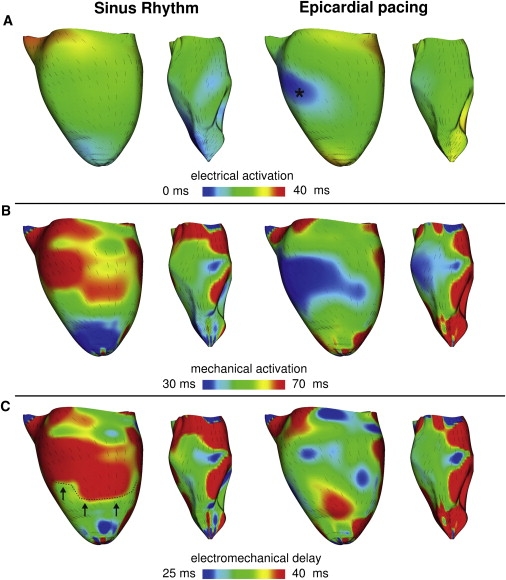
Electrical activation times (A), mechanical activation times (B), and EMD (C) during SR and EP. Each panel presents LV lateral view of epicardium (left) and endocardium (right). (Lines) Fiber direction.
In the following sections, we examine the electromechanical behavior under these two different loading conditions that gives rise to the specific three-dimensional EMD distributions.
Electromechanical behavior giving rise to EMD distributions in the transmural direction
To understand the transmural differences in EMD under the two different loading conditions, we first analyzed ventricular deformation in the transmural direction. Transmural maps of Eff at the midbase during the different phases of the cardiac cycle for SR and EP are shown in Fig. 4. In SR, during the isovolumic contraction phase, as the endocardial regions in the LV wall begin to contract (manifested as the green color in the middle image, top row, see green arrow), the epicardial fibers are stretched, as evidenced by the positive Eff (red regions, see red arrow). EP results in early myocyte shortening at the pacing site (green regions in middle image, bottom row, see green arrow), whereas myocytes in the posterior wall undergo significant stretching (red region, see red arrow) during the isovolumic phase of contraction. These transmural distribution maps of Eff reveal that the regions that are characterized with longer EMDs in Fig. 3 are prestretched during the isovolumic phase. Note that in SR, during the ejection phase, the epicardial cells, whose prestretch gave rise to an extended EMD, begin to shorten along with the rest of the myocardium; at end-systole, Eff is mostly homogeneous throughout the ventricular wall. In contrast, after EP, at end-systole Eff is elevated near the pacing site, revealing decreased synchrony in contraction. This behavior is consistent with experimental results (4).
Figure 4.
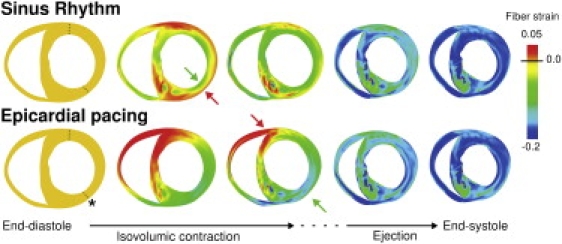
Transmural maps of strain in the fiber direction during the systolic phase of the cardiac cycle for SR and EP. This transmural view corresponds to the second short-axis view in Fig. 2. (Arrows) Early shortening and prestretching of myocardium during the isovolumic phase. (Asterisk) Pacing site. (Dashed lines) Transmural locations along which fiber strain was analyzed.
This phenomenon is further confirmed by the transmural Eff (Fig. 5) in the anterior and posterior LV wall at locations along the dashed lines marked in Fig. 4. For SR, prestretching of the epicardial layers, both in the anterior and posterior wall segment, is evident during the isovolumic phase of contraction, as manifested by the positive Eff (Fig. 5, above-zero segments of blue and yellow traces). For all locations across the ventricular wall, maximum shortening took place near end-systole. Note that at the anterior wall, contraction in SR was associated with reduced shortening velocity of the endocardial myofibers, consistent with experimental data (3). After EP, early shortening occurred for all transmural locations in the anterior wall (where the pacing site is located), whereas the entire posterior wall was prestretched (Fig. 5, right panels). Fiber shortening velocity at the anterior wall after EP was greater than that during SR; this result agrees with experimental data (4). Early occurrence of shortening at the anterior wall and simultaneous prestretching of the tissue at the posterior wall represents the contraction of the early-depolarized region around the pacing site against the later-depolarized mechanically passive tissue (the latter evidenced by the flat portion in Eff trace).
Figure 5.
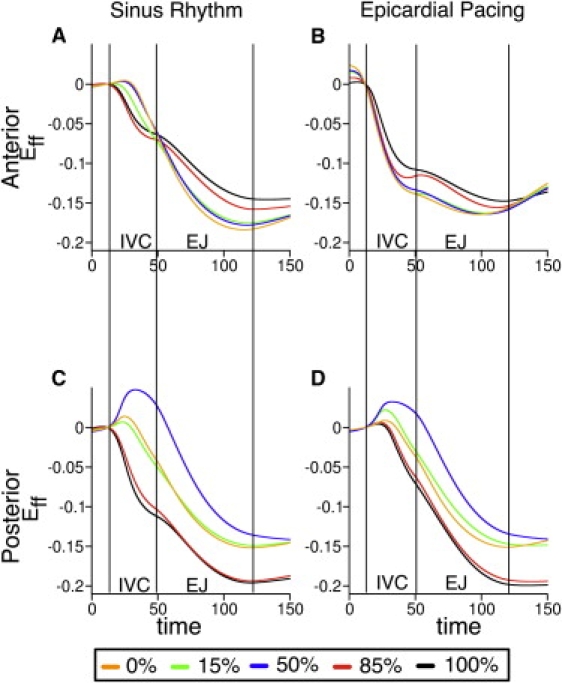
Temporal traces of fiber strain along the dashed lines in Fig. 4 (anterior and posterior walls) at different wall depths (expressed as % of wall thickness) during SR and after EP. Epicardium and endocardium correspond to 0% and 100% wall depth, respectively. IVC, isovolumic phase; EJ, ejection phase.
Electromechanical behavior giving rise to the EMD distribution on the epi- and endocardium
Fig. 6 presents traces of Eff at points along the epicardial fiber direction (line connecting colored dots in panel A) between apex and midbase on the epicardium for SR and EP (data for the endocardium not shown). The color of each trace corresponds to the color of the dot at the location where Eff was measured. The black dot coincides with the site of EP.
Figure 6.
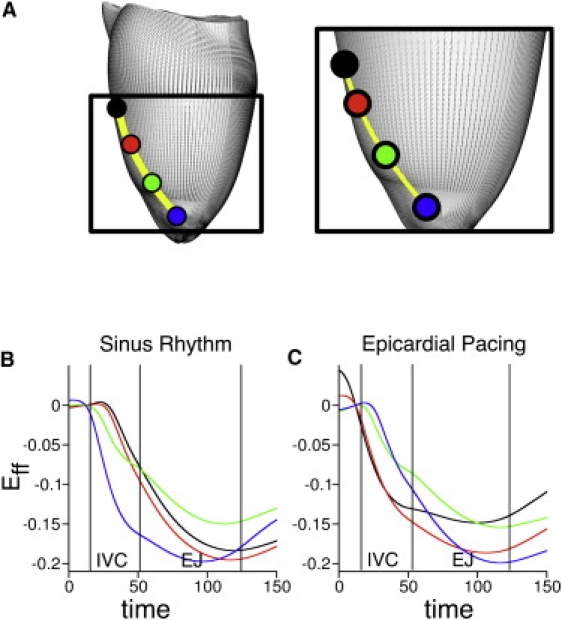
Temporal traces of epicardial fiber strain at four locations along the fiber direction. (A) Locations range from the site marked by an asterisk in Figs. 3–5 (black dot) to the apex (blue dot). Traces of strain for SR (B) and EP (C). The color of each trace denotes the location in panel A. Abbreviations as in Fig. 5.
In SR, myocytes in the apical region shortened early during the isovolumic phase (Fig. 6 B, blue trace), which resulted in prestretching of the fibers at midbase (black trace). Epicardial prestretch at the midbase delayed mechanical activation there, and thus, increased EMD.
The three-dimensional EMD distribution in SR on endo- and epicardium, presented in Fig. 3 (left), is determined by the different patterns of electrical propagation on these surfaces. The delay between electrical activation times at the two outermost locations (black and blue points in Fig. 6 A) was 11 ms on the epicardium, whereas on the endocardium the delay between the corresponding endocardial points was 2 ms. Thus, at midbase the epicardium remained mechanically passive for a longer period, during which it was stretched by the shortening of the apical fibers (Fig. 6 B). In contrast, the contraction of the endocardial myofibers at the apex did not alter the deformation of those at midbase because these regions were already active. These results demonstrate that the increase in the difference in EMD between endo- and epicardium in direction from apex to base (as in Fig. 3, left, and also evident in Fig. 2, left) is due to the different electrical activation delays on the endo- and epicardium between apex and midbase during SR.
EP provides a different electrical activation sequence and thus, different loading conditions, resulting in EMD that increases from the midbase toward the apex on the epicardium along the fiber direction. This EMD distribution arises from early shortening at midbase and consequent prestretching of the late-depolarized apical region (Fig. 6 C, black and blue traces). Note that unlike SR, where maximum myofiber shortening occurred at end-systole, disparity in end-systolic Eff is observed here (Fig. 6 C), again underscoring the less synchronous contraction after EP.
Rate-dependent changes in EMD after EP
Fig. 7 A presents transmural EMD maps after EP at BCL of 350 ms (left) and 250 ms (right), demonstrating that EMD distribution changes with pacing rate. When BCL is decreased, EMD is reduced at the late-depolarized posterior wall, but remains mostly unchanged at the early-depolarized LV anterior wall. Altering the pacing rate also affects the relationship between EMD and electrical activation. This finding is quantified by the regression analysis between mechanical and electrical activation times at the LV midwall (Fig. 7 B, top): the slope of the regression line for BCL = 250 ms is less than that for BCL = 350 ms, demonstrating that EMD increases with electrical activation to a greater extent in the latter case. Thus, EMD is longer at the late-depolarized regions at slower pacing rates.
Figure 7.
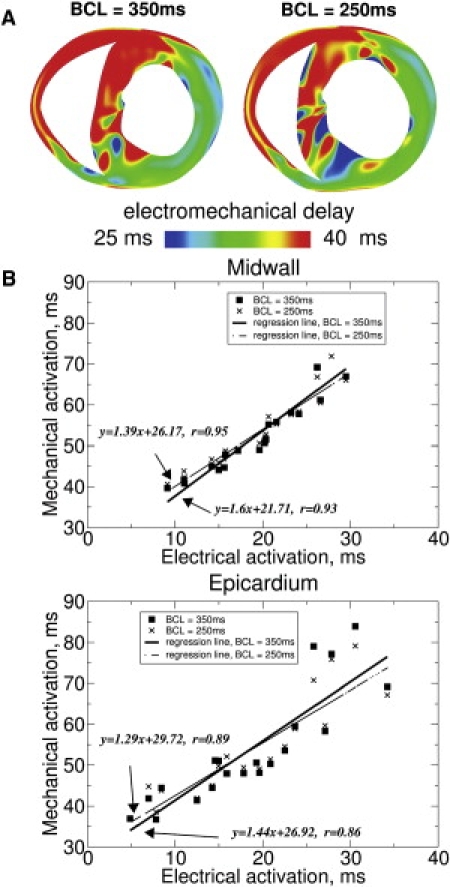
Transmural EMD maps (A) after EP at BCL = 350 ms (left) and BCL = 250 ms (right). The transmural map for BCL = 350 ms is the same as the second slice in Fig. 2C (left), and is included here for comparison. Regressional analysis of mechanical versus electrical activation times (B) at the midwall (top) and at the epicardium (bottom) of LV free wall. (Squares and crosses) Data points for BCL = 350 ms and BCL = 250 ms, respectively. (Solid and dashed lines) Regression lines for BCL = 350 ms and BCL = 250 ms, respectively.
Mechanical and electrical activation times at different sites on the epicardium were also plotted (Fig. 7 B, bottom) for the two BCLs because studies that analyze electromechanical activation in the paced heart often conduct epicardial measurements (1,2). These plots demonstrate that the correlation between mechanical and electrical activation times on the epicardium is somewhat weaker than that for the midwall.
Discussion and Conclusions
Main findings
This study aimed to elucidate the three-dimensional distribution of EMD in the ventricles, and in particular, the component of EMD that is established by the specific loading conditions in the ventricles. EMD distributions resulting from two different activation sequences were examined, SR and EP, testing the hypothesis that the three-dimensional EMD distribution in the ventricles during SR and after EP is nonuniform and differs for the two different loading conditions. In addition, the electromechanical interactions in the ventricles responsible for the resulting three-dimensional EMD distributions were examined. Because no current experimental techniques are available to test the hypotheses, the goals of the study were achieved using, what we believe is, a novel three-dimensional electromechanical model of the rabbit ventricles that incorporated a biophysically detailed model of myofilament dynamics into an anatomically accurate model of the ventricles. Consistent with the goals of the study, the component of EMD that is due to heterogeneities in Ca handling in the ventricles was not included here, allowing for a comprehensive examination of the role of the loading conditions in creating heterogeneity in the distribution of EMD.
The main findings of this study are:
The three-dimensional distributions of EMD are heterogeneous for both SR and EP.
The EMD distribution depends on the activation sequence (loading conditions). During SR, the EMD distribution is longer at the epicardium compared to that at the endocardium, and is longer near the base than at the apex. After EP, the three-dimensional EMD distribution is markedly different as compared to that in SR. It is also dependent on the pacing rate.
For both SR and EP, late-depolarized regions are characterized with significant myofiber prestretch caused by the contraction of the early-depolarized regions. This prestretch delays the onset of myofiber shortening, and thus results in a longer EMD, giving rise to heterogeneities in the three-dimensional EMD distribution. An increase in the pacing rate for EP results in a shorter EMD at the late-depolarized regions.
Three-dimensional EMD distribution during SR
The experimental study of Prinzen et al. (1) has shown that in SR there are differences in EMD between apex and base on the LV anterior epicardium. We extended these findings to demonstrate here that there are differences in EMD between apex and base over most of the LV volume. Experimental data from Sengupta et al. (23) have suggested that EMD might be different at the apex and the base on the endocardium as well. In our study, no significant heterogeneities in EMD were found over the endocardial surface; this discrepancy may be due to the fact that, in the study by Sengupta et al., strain was calculated in the longitudinal and circumferential directions in the ventricles, which do not necessarily coincide with the local directions along the cardiac fibers. Thus, onset of myofiber shortening as estimated by Sengupta's group is different from the way it is calculated in our study. Finally, Ashikaga et al. (3) have demonstrated that EMD is larger on the epicardium than on the endocardium at a single location across the LV anterior wall. Our simulation results agree with this result; we further demonstrate that transmural differences in EMD exist throughout the LV free wall, and that these differences are greater at the base than at the apex during SR.
Three-dimensional EMD distribution after EP
The study by Prinzen et al. (1) has also shown that the differences in EMD between the apex and base on the epicardium are altered after EP as compared to SR. In this study, we extended this finding and demonstrated that the distribution of EMD throughout the entire ventricular volume is markedly different for EP as compared to SR. This finding is valid regardless of pacing location. Experimental recordings in the transmural direction at the pacing site by Ashikaga et al. (4) demonstrated that transmural mechanical activation times at the anterior LV wall were reduced after EP as compared to during SR. In this study, we found that both transmural mechanical activation times and transmural differences in EMD were smaller for EP than for SR throughout the LV wall.
Our simulation results also demonstrate that the three-dimensional EMD distribution after EP is dependent on pacing rate. An increase in pacing rate results in shorter EMD at the late-depolarized regions.
Mechanisms underlying the three-dimensional EMD distribution
Our simulations revealed that prestretch and longer EMD arises from mechanical interactions between myocytes connected in series. During SR, the contraction of the apical myocytes exerts a tension along the fiber direction that stretches the myocytes near the base (Fig. 6 B). Similarly, after EP, the shortening of the basal myofibers at the anterior wall results in prestretch of myocytes located at the basal posterior because of the mechanical interaction of myofibers connected circumferentially (Figs. 4 and 5, right panels). Prestretch arises either because the early-depolarized regions passively stretch those depolarized later, or in the later phases of isovolumic contraction, because the active tension developed by the late-depolarized regions is insufficient to result in shortening; the large volume of the already-depolarized contracting myocardium impedes the process (Figs. 5 and 6).
The results obtained here clearly demonstrate that mechanical interactions in the myofiber between early and late depolarized regions cause nonuniformity in EMD distribution. However, because myocytes do not interact mechanically only in the myofiber direction, fiber orientation plays an important role in the global EMD distribution. Indeed, contraction of the apex affects the deformation, and thus EMD, of the late-depolarized regions where the myofibers are oriented in the longitudinal direction to a greater degree than in regions where the myofibers are oriented predominantly in the circumferential direction (largest stretch occurs when force is applied in the longitudinal direction of the myocyte). This is evident from the leftmost image of Fig. 3 C (fiber direction is depicted by the thin lines). Regions in the SR epicardial EMD distribution characterized with delays above 45 ms (45 ms isoline marked with dashed line), and thus significant prestretch, are formed further from the early contracting apex on the anterior epicardium, where the fibers are oriented at ∼40° (left arrow), than at the posterior epicardium, where fibers are oriented in the longitudinal direction (right arrow). Similar observations can be made from the results regarding EP. Although EMD increases in the direction from midbase to apex along the fiber orientation (Fig. 3 C, right panels) due to prestretch by myofibers oriented in series (Fig. 6 C), the posterior epicardial apical regions are characterized with a minimum EMD (Fig. 3 C, right panels) and are not affected by the contraction of the early-activated midbase—the reason is that mechanical interactions there occur between myofibers connected in parallel.
In addition to the interaction between myofibers connected in series, there are other types of mechanical coupling by which prestretch can arise and EMD could be prolonged, such as interactions between myocardial layers. Fig. 8 presents temporal traces of fiber (left) and cross-fiber strain (right) at different locations along the LV free wall on the endocardium (panel A) and epicardium (panel B) during SR. The color of each trace denotes the location at which strain was measured. During the isovolumic phase of contraction, the early-depolarized endocardium is stretched in the cross-fiber direction (Fig. 8 A, right), whereas the late-depolarized epicardium is lengthened in the fiber direction (Fig. 8 B, left). These simulation results suggest that, owing to the physical coupling of myofibers in the transmural direction, the cross-fiber stretch at the endocardium could impede fiber shortening at the epicardium, and thus extend EMD there, as proposed by Ashikaga et al. (3). Additionally, prestretch and EMD prolongation could stem from the increasing intracavitary LV pressure during contraction. As suggested by Prinzen et al. (1), the LV pressure arising from the contraction of the early-depolarized regions may be sufficiently high that it stretches the late-depolarized myofibers, thus further delaying the onset of myofiber shortening and prolonging EMD.
Figure 8.
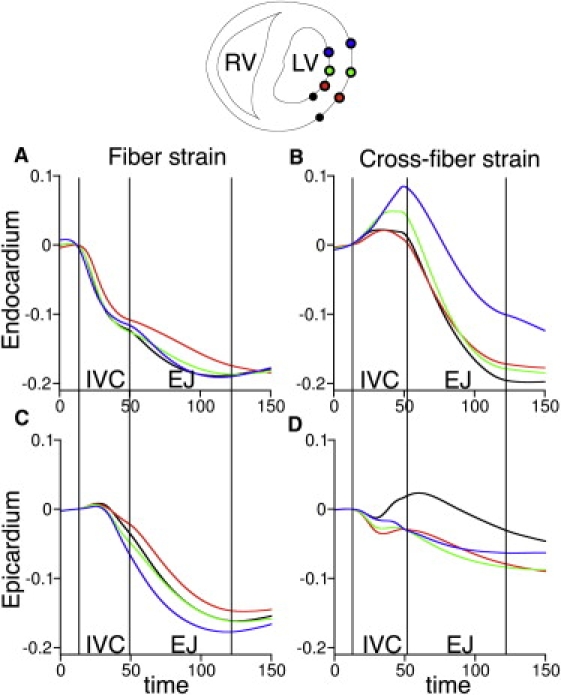
Strain in the fiber (left) and cross-fiber direction (right) at the endocardium (A) and epicardium (B) during SR. Colors correspond to the location where strain was measured; the latter are shown in the transmural view of the ventricles above the graphs. Abbreviations as in Fig. 5.
Lastly, extended EMD depends on the intrinsic myofilament properties. By employing a biophysically detailed model of myofilament dynamics (14), our electromechanical model implicitly incorporates the mechanisms that underlie the force-length relationship of cardiac contraction, which affect the amplitude and durations of the developed force. Prestretched areas are lengthened and then develop a greater tension that could prevent additional stretching, thus limiting further increases in EMD.
The new model of ventricular electromechanics
In this study, we present a model of electromechanics that features a biophysical model of myofilament dynamics and bidomain representation of the myocardium. This multiscale, integrative model is a significant improvement over previous attempts to model the electromechanical activity of the whole heart. Limitations in previous modeling efforts include phenomenological representations of membrane kinetics and myofilament dynamics (24,25) and simplified representations of ventricular geometry (26). The model used here overcomes these limitations by including biophysical representations of both membrane kinetics and, in particular, myofilament dynamics and incorporating realistic ventricular geometry and fiber orientation. The myofilament dynamics model allowed us to obtain simulation results regarding EMD that are consistent with experimental findings (1–3), in contrast to previous studies (25), where the obtained delays have not been observed in experiment.
The model was validated by comparing three-dimensional strain rates with experimental data from ultrasound imaging, and excellent agreement between simulation and experiment, in regard to the propagation patterns of electromechanical waves, was obtained (22,27; J. Provost, unpublished). Simulation and experimental electromechanical waves were compared for different pacing sites. Despite the fact that the experiment was conducted in an in vivo heart, whereas our model was of a different, ex vivo heart, very good qualitative, and where possible, quantitative agreement with the ultrasound imaging data was demonstrated (such as zero-crossing of temporal profiles of incremental axial strain in the lateral and septal walls along the center line of the ultrasound probe, which define the transition from the thinning phase, i.e., the negative interframe strains, to the thickening phase, i.e., the positive interframe strains).
In addition, our simulation results agree qualitatively with experimental measurements of transmural myofiber strain. Specifically, we observed greater end-systolic shortening at the midwall compared to the endocardial and epicardial layers and reduction of epicardial shortening velocity near the end of the isovolumic contraction phase during SR (3). Consistent with experimental recordings (29), shortening in the cross-fiber direction during ejection phase was substantial on the endocardium, whereas it was minimal on the epicardium (Fig. 8, right). In our model, after EP, shortening velocity at the LV anterior wall was less than that for SR, similar to experimental data (4). However, contrary to experimental results, there was no overall decrease in the magnitude of myofiber shortening at the pacing site in our simulations, which could be due to the fact the end-diastolic pressures after EP and during SR were equal in our model and were different in the experiment (4).
Study implications
This study reveals that the loading conditions of the ventricles play a very important role in the relationship between electrical and mechanical activation. Understanding the latter relationship is of paramount importance to therapies that employ pacing of the heart, and particularly pacing strategies to resynchronize mechanical contraction, such as cardiac resynchronization therapy (CRT). Acute CRT therapy affects only the component of EMD that is due to the loading conditions, but has no influence the cell-intrinsic E-C coupling latency. This is because the time interval between electrical activation and the instance at which active tension develops is not a function of sarcomere length, i.e., of prestretch (30). Thus, only by understanding the heterogeneity in the distribution of the component of EMD that is due to the loading conditions, as done in this article for the normal heart, could one potentially suggest avenues for CRT optimization. This is where the clinical relevance of our study lies.
In the diseased and/or dyssynchronous heart, large EMD durations have been observed; the understanding of their origin can help devise strategies to minimize EMD and thus optimize CRT therapy. Indeed, ∼30% of patients fail to respond to CRT, eroding the trust in the technology and making it difficult to justify the expense of its broader application (31). Further advancements in CRT efficacy and in the criteria for selection of potential responders to the therapy will require insight into the interaction between electrical and mechanical activity in the heart offered by the results of basic science studies such as this one.
Limitations
The Purkinje network was not explicitly represented in the model. Simulations representing activation in SR, however, mimic the role of the Purkinje system; thus, the results of our study in SR are not affected by this limitation. The Purkinje system could potentially alter the three-dimensional EMD distribution after EP; however, combined MRI tagging and EP studies have demonstrated that the Purkinje network is not engaged during ventricular pacing (32). An additional limitation of the model is that it lacks representation of papillary muscles. Inclusion of such structures could result in changes in regional longitudinal shortening, which could alter EMD distribution in these regions. However, it is not expected to alter the electromechanical mechanisms that underlie the three-dimensional EMD distribution as determined in this study. Further research is needed to ascertain the effect of papillary muscles on EMD distribution.
Acknowledgments
This work was supported by National Institutes of Health grants Nos. HL082729 and HL096094, National Science Foundation grant No. CBET-0933029 to N.A.T., and an American Heart Association Postdoctoral Fellowship to V.G.
Supporting Material
References
- 1.Prinzen F.W., Augustijn C.H., Reneman R.S. The time sequence of electrical and mechanical activation during spontaneous beating and ectopic stimulation. Eur. Heart J. 1992;13:535–543. doi: 10.1093/oxfordjournals.eurheartj.a060210. [DOI] [PubMed] [Google Scholar]
- 2.Badke F.R., Boinay P., Covell J.W. Effects of ventricular pacing on regional left ventricular performance in the dog. Am. J. Physiol. 1980;238:H858–H867. doi: 10.1152/ajpheart.1980.238.6.H858. [DOI] [PubMed] [Google Scholar]
- 3.Ashikaga H., Coppola B.A., Omens J.H. Transmural dispersion of myofiber mechanics: implications for electrical heterogeneity in vivo. J. Am. Coll. Cardiol. 2007;49:909–916. doi: 10.1016/j.jacc.2006.07.074. [DOI] [PMC free article] [PubMed] [Google Scholar]
- 4.Ashikaga H., Omens J.H., Covell J.W. Transmural mechanics at left ventricular epicardial pacing site. Am. J. Physiol. Heart Circ. Physiol. 2004;286:H2401–H2407. doi: 10.1152/ajpheart.01013.2003. [DOI] [PMC free article] [PubMed] [Google Scholar]
- 5.Vetter F.J., McCulloch A.D. Three-dimensional analysis of regional cardiac function: a model of rabbit ventricular anatomy. Prog. Biophys. Mol. Biol. 1998;69:157–183. doi: 10.1016/s0079-6107(98)00006-6. [DOI] [PubMed] [Google Scholar]
- 6.Rodríguez B., Li L., Trayanova N.A. Differences between left and right ventricular chamber geometry affect cardiac vulnerability to electric shocks. Circ. Res. 2005;97:168–175. doi: 10.1161/01.RES.0000174429.00987.17. [DOI] [PMC free article] [PubMed] [Google Scholar]
- 7.Maleckar M.M., Woods M.C., Trayanova N.A. Polarity reversal lowers activation time during diastolic field stimulation of the rabbit ventricles: insights into mechanisms. Am. J. Physiol. Heart Circ. Physiol. 2008;295:H1626–H1633. doi: 10.1152/ajpheart.00706.2008. [DOI] [PMC free article] [PubMed] [Google Scholar]
- 8.Henriquez C.S., Trayanova N., Plonsey R. Potential and current distributions in a cylindrical bundle of cardiac tissue. Biophys. J. 1988;53:907–918. doi: 10.1016/S0006-3495(88)83172-2. [DOI] [PMC free article] [PubMed] [Google Scholar]
- 9.Guccione J.M., Costa K.D., McCulloch A.D. Finite element stress analysis of left ventricular mechanics in the beating dog heart. J. Biomech. 1995;28:1167–1177. doi: 10.1016/0021-9290(94)00174-3. [DOI] [PubMed] [Google Scholar]
- 10.Vetter F.J., McCulloch A.D. Three-dimensional stress and strain in passive rabbit left ventricle: a model study. Ann. Biomed. Eng. 2000;28:781–792. doi: 10.1114/1.1289469. [DOI] [PubMed] [Google Scholar]
- 11.Lin D.H., Yin F.C. A multiaxial constitutive law for mammalian left ventricular myocardium in steady-state barium contracture or tetanus. J. Biomech. Eng. 1998;120:504–517. doi: 10.1115/1.2798021. [DOI] [PubMed] [Google Scholar]
- 12.Feng Y., Xie Y., Ni Y. A modified rabbit model of reperfused myocardial infarction for cardiac MR imaging research. Int. J. Cardiovasc. Imaging. 2009;25:289–298. doi: 10.1007/s10554-008-9393-2. [DOI] [PubMed] [Google Scholar]
- 13.Shannon T.R., Wang F., Bers D.M. A mathematical treatment of integrated Ca dynamics within the ventricular myocyte. Biophys. J. 2004;87:3351–3371. doi: 10.1529/biophysj.104.047449. [DOI] [PMC free article] [PubMed] [Google Scholar]
- 14.Rice J.J., Wang F., de Tombe P.P. Approximate model of cooperative activation and crossbridge cycling in cardiac muscle using ordinary differential equations. Biophys. J. 2008;95:2368–2390. doi: 10.1529/biophysj.107.119487. [DOI] [PMC free article] [PubMed] [Google Scholar]
- 15.Kerckhoffs R.C.P., Healy S.N., McCulloch A.D. Computational methods for cardiac electromechanics. Proc. IEEE. 2006;94:769–783. [Google Scholar]
- 16.Leite-Moreira A.F., Correia-Pinto J., Gillebert T.C. Afterload induced changes in myocardial relaxation: a mechanism for diastolic dysfunction. Cardiovasc. Res. 1999;43:344–353. doi: 10.1016/s0008-6363(99)00099-1. [DOI] [PubMed] [Google Scholar]
- 17.Kerckhoffs R.C., Neal M.L., McCulloch A.D. Coupling of a 3D finite element model of cardiac ventricular mechanics to lumped systems models of the systemic and pulmonic circulation. Ann. Biomed. Eng. 2007;35:1–18. doi: 10.1007/s10439-006-9212-7. [DOI] [PMC free article] [PubMed] [Google Scholar]
- 18.Little R.A. Changes in the blood volume of the rabbit with age. J. Physiol. 1970;208:485–497. doi: 10.1113/jphysiol.1970.sp009133. [DOI] [PMC free article] [PubMed] [Google Scholar]
- 19.Plank G., Liebmann M., Haase G. Algebraic multigrid preconditioner for the cardiac bidomain model. IEEE Trans. Biomed. Eng. 2007;54:585–596. doi: 10.1109/TBME.2006.889181. [DOI] [PMC free article] [PubMed] [Google Scholar]
- 20.Reference deleted in proof.
- 21.Azarov J.E., Shmakov D.N., Roshchevsky M.P. Activation and repolarization patterns in the ventricular epicardium under sinus rhythm in frog and rabbit hearts. Comp. Biochem. Physiol. A Mol. Integr. Physiol. 2007;146:310–316. doi: 10.1016/j.cbpa.2006.10.036. [DOI] [PubMed] [Google Scholar]
- 22.Provost, J., V. Gurev, …, E. Konofagou. 2008. Characterization of wave origins in electromechanical wave imaging. IEEE International Ultrasonics Symposium, Beijing, China.
- 23.Sengupta P.P., Khandheria B.K., Belohlavek M. Apex-to-base dispersion in regional timing of left ventricular shortening and lengthening. J. Am. Coll. Cardiol. 2006;47:163–172. doi: 10.1016/j.jacc.2005.08.073. [DOI] [PubMed] [Google Scholar]
- 24.Usyk T.P., LeGrice I.J., McCulloch A.D. Computational model of three-dimensional cardiac electromechanics. Comput. Vis. Sci. 2002;4:247–249. [Google Scholar]
- 25.Usyk T.P., McCulloch A.D. Relationship between regional shortening and asynchronous electrical activation in a three-dimensional model of ventricular electromechanics. J. Cardiovasc. Electrophysiol. 2003;14(Suppl):S196–S202. doi: 10.1046/j.1540.8167.90311.x. [DOI] [PubMed] [Google Scholar]
- 26.Campbell S.G., Howard E., Kerckhoffs R.C. Effect of transmurally heterogeneous myocyte excitation-contraction coupling on canine left ventricular electromechanics. Exp. Physiol. 2009;94:541–552. doi: 10.1113/expphysiol.2008.044057. [DOI] [PMC free article] [PubMed] [Google Scholar]
- 27.Gurev V., Provost J., Trayanova N. In silico characterization of ventricular activation patterns by electromechanical wave imaging. Heart Rhythm. 2009;2009:S357. doi: 10.1016/j.hrthm.2010.12.034. [DOI] [PMC free article] [PubMed] [Google Scholar]
- 28.Reference deleted in proof.
- 29.Rademakers F.E., Rogers W.J., Shapiro E.P. Relation of regional cross-fiber shortening to wall thickening in the intact heart. Three-dimensional strain analysis by NMR tagging. Circulation. 1994;89:1174–1182. doi: 10.1161/01.cir.89.3.1174. [DOI] [PubMed] [Google Scholar]
- 30.Janssen P.M., Hunter W.C. Force, not sarcomere length, correlates with prolongation of isosarcometric contraction. Am. J. Physiol. 1995;269:H676–H685. doi: 10.1152/ajpheart.1995.269.2.H676. [DOI] [PubMed] [Google Scholar]
- 31.Greenberg B., Mehra M.R. All patients with heart failure and intraventricular conduction defect or dyssynchrony should not receive cardiac resynchronization therapy. Circulation. 2006;114:2685–2690. doi: 10.1161/CIRCULATIONAHA.104.514190. [DOI] [PubMed] [Google Scholar]
- 32.Prinzen F.W., Hunter W.C., McVeigh E.R. Mapping of regional myocardial strain and work during ventricular pacing: experimental study using magnetic resonance imaging tagging. J. Am. Coll. Cardiol. 1999;33:1735–1742. doi: 10.1016/s0735-1097(99)00068-6. [DOI] [PMC free article] [PubMed] [Google Scholar]
Associated Data
This section collects any data citations, data availability statements, or supplementary materials included in this article.