

Abstract
Histamine has been proposed to be an important regulator of energy intake and expenditure. The aim of this study was to evaluate histamine regulation of glucose and lipid metabolism and development of nonalcoholic steatohepatitis (NASH) with a hyperlipidemic diet. Histamine regulation of glucose and lipid metabolism, adipocytokine production, and development of hyperlipidemia-induced hepatic injury were studied in histamine H1 (H1R−/−) and H2 (H2R−/−) receptor knockout and wild-type mice. H1R−/− mice showed mildly increased insulin resistance. In contrast, H2R−/− mice manifested profound insulin resistance and glucose intolerance. High-fat/high-cholesterol feeding enhanced insulin resistance and glucose intolerance. Studies with two-deoxy-2-[18F]-fluoro-d-glucose and positron emission tomography showed a brain glucose allocation in H1R−/− mice. In addition, severe NASH with hypoadiponectinemia as well as hepatic triglyceride and free cholesterol accumulation and increased blood hepatic enzymes were observed in H2R−/− mice. H1R−/− mice showed an obese phenotype with visceral adiposity, hyperleptinemia, and less severe hepatic steatosis and inflammation with increased hepatic triglyceride. These data suggest that H1R and H2R signaling may regulate glucose and lipid metabolism and development of hyperlipidemia-induced NASH.
Histamine, one of the mediators of inflammation and immunity, is produced from L-histidine by the rate-limiting enzyme histidine decarboxylase (HDC). HDC is expressed in various types of cells, including mast cells, monocytes/macrophages, T lymphocytes, enterochromaffin-like cells, and neuronal cells.1,2,3 The effects of histamine are mediated through specific histamine receptors, which have been classified into the H1, H2, H3, and H4 subtypes.4 The recent development of gene-modified mice lacking HDC or histamine receptors has provided valuable tools to analyze the functions of histamine.5 For example, HDC knockout (KO) mice were reported to show clinical features of visceral adiposity, hyperleptinemia, and decreased glucose tolerance.6 In addition, it was reported that H1R−/− mice fed a high-fat diet showed increased fat deposition and leptin resistance and that disruption of the H3R gene in mice resulted in an obese phenotype and glucose intolerance, with elevated blood insulin and leptin levels.7,8 Taken together, these studies indicate that histamine plays important roles in energy regulation and metabolism.
In contrast, insulin resistance/metabolic syndrome, which increases the risk for atherosclerosis and cardiovascular events, is an aggregate of disorders related to obesity or visceral adiposity, insulin resistance, hyperlipidemia, and hypertension.9,10 Recently, the liver has also been recognized as one of the pathological targets of metabolic syndrome.11,12 Insulin resistance is associated with increased adiposity and nonalcoholic fatty liver disease, which can lead to the advanced condition known as nonalcoholic steatohepatitis (NASH). Typical morphological features of NASH in humans include steatosis, inflammation and pericellular fibrosis.13 Obese and diabetic ob/ob mice develop steatohepatitis, but not fibrosis, in their liver.14 Other obese and diabetic db/db mice fed a diet lacking methionine and choline exhibited liver fibrosis as a model of NASH.15 Adiponectin, an adipocytokine secreted from adipocytes,16,17 was recently reported to be centrally involved in the pathogenesis of metabolic syndrome and nonalcoholic fatty liver disease.18,19
Because the loss of histamine functions has been suggested to result in disturbed energy regulation and metabolism,6,7,8 we speculated that the functions of histamine might be closely related to the pathogenesis of insulin resistance syndrome, metabolic disturbances, and NASH. In this study, we evaluated the phenotypic differences of wild-type, H1R−/−, and H2R−/− mice in terms of glucose metabolism, lipid metabolism, and the expression of adipocytokines, including adiponectin and leptin after high-fat/high-cholesterol diet (HcD). In addition, we examined in vivo glucose uptake using 2-deoxy-2-[18F]-fluoro-d-glucose ([18F]FDG) and positron imaging of whole mice bodies.
Materials and Methods
Animals and Diets
Targeting vectors were constructed in pMC1 (H1R−/−) and pPNT (H2R−/−) vectors and transfected into E14 ES cells. After the neor colonies were selected and verified by PCR and Southern blotting, the targeted ES cells were injected into blastocysts from C57BL/6 mice. The resulting male chimeras were mated with C57BL/6 mice to generate heterozygous mice.20,21 Experiments were performed on 8-week-old male wild-type, H1R−/−, and H2R−/− mice (backcrossed for nine generations) weighing 20–25 g (7–30 mice per experiment). Mice were fed a normal chow diet (NcD) or a HcD (1.25% cholesterol, 0.5% cholic acid, and 15% lard) for 14 weeks. On a caloric basis, HcD consisted of 41.5% fat from lard, 40.8% carbohydrate, and 17.7% protein (total, 4.44 kcal/g). Mice were euthanized by an overdose of pentobarbital (i.p.) at the indicated periods of time. All protocols were approved by the Ethics Committee of Animal Care and Experimentation, University of Occupational and Environmental Health, and were performed according to the Institutional Guidelines for Animal Experiments and to Law (number 105) and Notification (number 6) of the Japanese government.
Analysis of Glucose Metabolism
To examine the presence of glucose intolerance, mice were fasted for 16 hours and then injected (i.p.) with glucose at a dose of 1 mg/g body weight. Blood samples were collected from the tail vein at 0, 30, 60, and 120 minutes after the glucose injection. To determine insulin tolerance, mice were injected (i.p.) with human insulin (1 U/kg body weight), and blood samples were collected at 0, 30, 60, and 120 minutes after the insulin injection. Blood glucose levels were measured using a One-Touch glucose monitoring system (Bayer Medical, Tokyo, Japan). Blood insulin levels were also measured by an enzyme-linked immunosorbent assay (Morinaga, Tokyo, Japan) from the same samples obtained after the glucose challenge test according with the manufacturer’s instructions.
Blood Levels of Adiponectin and Leptin
Blood levels of adiponectin and leptin were measured by enzyme-linked immunosorbent assay (R&D Systems, Minneapolis, MN) in accordance with the manufacturer’s instructions.
Real-Time PCR
After extracting total RNA from the liver, skeletal muscle and visceral adipose tissue using TRIzol reagent (Life Technologies, Grand Island, NY), the mRNA expression of glucose transporters (Glut), adiponectin receptor (AdipoR), sterol-responsive element-binding protein-1b/c and 2 (SREBP-1 and -2), hydroxymethylglutaryl-CoA reductase (HMGR) and fatty acid synthase (FASn) was analyzed by real-time PCR (TaqMan probe) using the primer pairs summarized in Table 1. The levels of mRNA expression were normalized by those of the expression of 18s ribosomal RNA in the same samples.
Table 1.
List of Primers and Probes for Real-Time PCR Analysis
| Gene | Primer |
|---|---|
| Glut1 | |
| Forward | 5′-GGGCATGATTGGTTCCTTCTC-3′ |
| Reverse | 5′-AGGATCAGCATCTCAAAGGACTTG-3′ |
| Probe | 5′-ATGCTGATGATGAACCTGTTGGCCTTTGT-3′ |
| Glut2 | |
| Forward | 5′-CCCTTGTCACAGGCATTCTTATTAG-3′ |
| Reverse | 5′-GAGCAGTAGCAGACACTGCAGAAG-3′ |
| Probe | 5′-CAATCAGGATCATTGGCACATCCTACTTGG-3′ |
| Glut3 | |
| Forward | 5′-CTCTGTTGGTGGCATGATTGG-3′ |
| Reverse | 5′-AGCATTTCAACAGACTCCGCTATC-3′ |
| Probe | 5′-CACTCTATGCTTCTAGTCAACTTGCTGGCCA-3′ |
| Glut4 | |
| Forward | 5′-GCTCCCTTCAGTTTGGCTATAACA-3′ |
| Reverse | 5′-CTACCCAGCCACGTTGCATT-3′ |
| Probe | 5′-CAATGCCCCACAGAAGGTGATTGAACA-3′ |
| AdipoR1 | |
| Forward | 5′-CATGGCCACAGACCACCTATG-3′ |
| Reverse | 5′-GAAATAGCACAAAACCAAGCAGATG-3′ |
| Probe | 5′-TCAAGAGCATCTTCCGCATCCACACAG-3′ |
| AdipoR2 | |
| Forward | 5′-GGTCTCCCGACTCTTCTCTAAATTG-3′ |
| Reverse | 5′-TTGTGGGTTACAGTAGAAAGAATAATAAAGC-3′ |
| Probe | 5′-CTGGTATTGCTCTTCTGATCATGGGAAGTTTTGT-3′ |
| SREBP-1* | |
| Forward | 5′-CACTGAAGCAAAGCTGAATAAACTG-3′ |
| Reverse | 5′-GTCCTTCAGTGATTTGCTTTTGTG-3′ |
| Probe | 5′-AGCACAGCAACCAGAAGCTCAAGC-3′ |
| SREBP-2 | |
| Forward | 5′-CTCCGCAGACGAGGATCATC-3′ |
| Reverse | 5′-GACGTCCACGAGGCTTTGCA-3′ |
| Probe | 5′-AGAACGCAGCGACCAGCTTTCAAG-3′ |
| FASn | |
| Forward | 5′-AGATCCTGGAACGAGAACACGAT-3′ |
| Reverse | 5′-GAGACGTGTCACTCCTGGACTTG-3′ |
| Probe | 5′-CACGCTGCGGAAACTTCAGGAAATG-3′ |
| HMGR | |
| Forward | 5′-TTGGCCAACTACTTTGTGTTCATG-3′ |
| Reverse | 5′-CCTCACGGCTTTCACGAGAA-3′ |
| Probe | 5′-TTCTTCCCGGCCTGTGTGTCGCT-3′ |
The primers recognize both isoforms of SREBP-1c and 1b.
Western Blotting of FASn
Fresh frozen liver tissues were lysed with a lysis buffer (10 mmol/L Tris-HCl [pH 7.5], 0.4 M NaCl, 1% Triton X-100, 0.1% Nonidet P-40, and 1 mmol/L phenylmethylsulfonyl fluoride) and applied to SDS-PAGE and electrotransfer onto polyvinylidene difluoride membrane. The expression of hepatic FASn was detected using anti-FASn antibody (American Research Products, Belmont, MA).
Dissection Analysis of [18F]FDG in Mice
The production of [18F]FDG was performed according to a method described elsewhere.22 [18F]FDG (2.5 MBq) was injected into mice through the tail veins. The mice were then sacrificed by decapitation under chloral hydrate anesthesia 45 minutes after the injection. Blood samples, heart, lung, liver, kidney, spleen, muscle, bone, stomach, small intestine, colon, brain, pancreas, and artery tissue samples were rapidly removed, weighed and radioactivity was measured using a gamma counter (Aloka ARC-2000; Aloka, Tokyo, Japan). Standard uptake values (SUVs) were calculated as the radioactivity in each tissue sample divided by the ratio of the total injected radioactivity and body weight. Data are expressed as the ratio to muscle.
Planar Positron Imaging
The kinetics and distribution patterns of each radiolabeled compound were determined with a planar positron imaging system (PPIS-4800; Hamamatsu Photonics, Hamamatsu, Japan).23 Two mice anesthetized with chloral hydrate were positioned prone on an acrylic plate and placed on the midplane between two opposing detectors arranged in a horizontal mode. Each radiolabeled compound was i.v. injected at a dose of 2.5 MBq into each mouse via the tail vein. The data were acquired with a 1-minute time frame interval for 45 minutes, and summation images were created by averaging the data obtained from 30 to 45 minutes after injection.
Histological Examination
The resected organs were fixed in 15% phosphate-buffered formalin and embedded in paraffin. Five-micrometer-thick sections were stained with H&E and Azan-Mallory stain or used for immunostaining with anti-α-smooth muscle actin antibody (α-SMA, DakoCytomation, Tokyo, Japan), as described previously.24 Paraffin sections of the liver, which were fixed in osmium tetroxide, were stained with Oil red-O to assess lipid accumulation. The degree of fat accumulation (fat accumulation score) was categorized into four categories: no lipid droplets (score = 0); lipid droplets in <50% of hepatocytes (score = 1); lipid droplets present in up to 75% of hepatocytes (score = 2); or lipid droplets in >75% of the hepatocytes (score = 3). The intensity of inflammation (inflammation score) was also categorized into four categories: no inflammation (score = 0); <10 inflammatory foci, each consisting of an aggregation of more than five inflammatory cells, in 10 microscopic fields viewed at ×200 (score = 1); ≥10 inflammatory foci (score = 2); or uncountable diffuse or fused inflammatory foci in the liver lobules (score = 3). Frozen sections of formalin-fixed liver underwent fluorescent staining to demonstrate the accumulation of neutral lipids (HCS LipidTOX Phospholipidosis and Steatosis Detection kits; Molecular Probes, Eugene OR).
Pancreatic tissue was stained with H&E and immunostained to detect insulin-, glucagon-, and somatostatin-positive cells (DakoCytomation). The size and numbers of islets per unit area were assessed using computer-assisted morphometry (NIH Image).
Analysis of Hepatic Injury and Lipid Content
Blood levels of aspartate aminotransferase (AST) and alanine aminotransferase (ALT) were measured using commercial kits (Wako Pure Chemical, Osaka, Japan). For the examination of hepatic lipid profile, snap frozen liver tissue (30 mg) was homogenized and extracted with chloroform-methanol (2/1 v/v) solution.25 The organic phase was dried and resolubilized in 2-propanol. Then the content of cholesterol in free and total, and triglyceride (TG) was determined using commercial kits (Wako Pure Chemical).
Statistical Analysis
All results are expressed as mean ± SE. Statistical analysis of the differences between groups was assessed by analysis of variance, and considered significant at P < 0.05.
Results
Histological Examination of Pancreatic Islet Cells
The pancreatic islets were hypertrophic in H1R−/− mice in comparison with those from wild-type and H2R−/− mice (Figure 1A). Immunohistochemically, the proportion of islet cells expressing insulin, glucagon, and somatostatin was not different among wild-type and KO mice (data not shown). The number (Figure 1B) and size of islets (Figure 1C) per unit area were significantly higher in H1R−/− mice.
Figure 1.

Histology of the pancreatic islets. A: Representative photomicrographs of pancreatic islets (H&E). The number (B) and area (C) of islets in the mice are presented in arbitrary units. **P < 0.01 versus wild-type; WT, wild-type; H1, H1R−/−; H2, H2R−/− mice
Effect of Histamine Receptor Deficiency on Insulin and Glucose Challenge Tests
With respect to mice fed NcD, nonfasting blood glucose levels showed no difference in wild-type and H1R−/− mice, but those in H2R−/− mice showed increased than in wild-type mice (time 0; Figure 2A). After insulin challenge, blood glucose levels in H1R−/− mice were higher than those in wild-type mice at 120 minutes. In contrast, H2R−/− mice showed increased blood glucose at 60 and 120 minutes (Figure 2A). There was reduced clearance of glucose after glucose challenge only in H2R−/− mice (Figure 2B). Although the blood insulin levels in H2R−/− mice were lower than those in wild-type mice (time 0 in Figure 2C), the insulin levels after the glucose challenge were comparable with those in wild-type and H1R−/− mice (Figure 2C).
Figure 2.

Blood glucose levels in response to insulin and glucose challenge. Mice were fed NcD or HcD for 14 weeks. Open square, wild-type; closed circle, H1R−/−; open triangle, H2R−/− mice. A and D: Insulin challenge test. Blood glucose levels were measured after an insulin challenge. B and E: Intraperitoneal glucose tolerance test. After starvation for 16 hours, mice were injected with glucose. C and F: Blood insulin levels after the glucose challenge, corresponding to B and E, respectively. A–C, NcD-fed mice; D–F, HcD-fed mice. *P < 0.05 and **P < 0.01 versus wild-type; †P < 0.05 NcD versus HcD.
After 14 weeks of HcD feeding, the nonfasting blood glucose levels were significantly increased in all groups (time 0; Figure 2D, P < 0.05 NcD versus HcD). The blood glucose levels after insulin challenge were not increased in H1R−/− mice but higher in H2R−/− mice at 30 minutes. Results of glucose challenge showed impaired glucose clearance in all groups of mice (Figure 2E; P < 0.05 NcD versus HcD). Of note, glucose clearance in HcD-fed H2R−/− mice was markedly impaired after the glucose challenge (P < 0.05 versus HcD-fed wild-type mice). The insulin levels after glucose challenge were comparable with those in wild-type, H1R−/−, and H2R−/− mice (Figure 2F).
Positron Imaging and in Vivo Distribution of [18F]FDG
The planar positron imaging demonstrated enhanced glucose uptake in the brain of H1R−/− mice with NcD feeding (Figure 3A). After organ dissection analysis, the actual glucose uptake presented as SUVs in the brain were also increased in H1R−/− mice with any types of diet (Figure 3B). In addition to the brain, the glucose uptake given by organ SUV ratio to skeletal muscle SUV was increased in the kidney and colon in H1R−/− mice, whereas almost even distribution among organs was observed in H2R−/− mice with HcD-fed condition (Figure 3C). In the skeletal muscles, FDG uptake was higher in H1R−/− mice of NcD feeding and that was higher in H2R−/− mice of HcD feeding (Figure 3B).
Figure 3.

Positron imaging and in vivo distribution of [18F]FDG. A: Representative planar positron imaging after HcD, showing increased FDG uptake in the brain of H1R−/− mice. B: Actual glucose uptake presented as SUVs. Glucose uptake in the brain of H1R−/− mice was also increased. WT, wild-type; H1, H1R−/−; H2, H2R−/− mice. *P < 0.05, **P < 0.01, and ***P < 0.001. C: The glucose uptake represented by organ SUV ratio to skeletal muscle SUV (SUV ratio) was increased in the brain, kidney, and colon in H1R−/− mice with HcD.
Expression of Gluts in the Brain, Liver, and Skeletal Muscle
The expression of Gluts 1, 2, 3, and 4 in the brain was investigated in HcD-fed mice (12 weeks of feeding). The brain Glut1 and Glut2 expression were increased in H1R−/− mice. The expression of Glut3 was lower in H1R−/− mice than in wild-type and H2R−/− mice, whereas Glut4 expression was increased in both groups of KO mice (Figure 4A). In the liver, Glut1 expression was decreased and Glut2 expression was increased in both groups of KO mice (Figure 4B). By contrast, Glut1 expression was decreased in H2R−/− mice in skeletal muscle. Glut4 expression was decreased in both H1R−/− and H2R−/− mice (Figure 4C).
Figure 4.

Expression of Gluts in the brain, liver, and skeletal muscle. A: Brain Glut1 and Glut2 expression were markedly increased, whereas Glut3 expression was decreased in H1R−/− mice. Glut4 expression was increased in both groups of KO mice. B: In the liver, Glut1 expression was decreased in both KO mice and Glut2 expression was higher in H1R−/− mice than in H2R−/− mice. C: In the skeletal muscle, the expression of Glut1 was decreased in H2R−/− mice, and Glut4 was reduced in both KO mice. *P < 0.05, **P < 0.01, and ***P < 0.001 versus wild-type; †P < 0.05 and †††P < 0.001. WT, wild-type; H1, H1R−/−; H2, H2R−/− mice.
Effects of Histamine Receptor Deficiency on Body Weight and Visceral Adiposity
H1R−/− mice showed obese phenotype with visceral adiposity when fed NcD for 33 weeks or fed HcD for 12 weeks. H2R−/− mice were not obese (Table 2).
Table 2.
Weight of Body and Adipose Tissue
| Diet for NcD mice (33 weeks)
|
Diet for HcD mice (12 weeks)
|
|||||
|---|---|---|---|---|---|---|
| Wild type (n = 15) | H1R−/− (n = 11) | H2R−/− (n = 12) | Wild-type (n = 11) | H1R−/− (n = 23) | H2R−/− (n = 24) | |
| Body weight (g) | 33.0 ± 0.5 | 36.1 ± 0.9*† | 30.1 ± 0.3*** | 29.3 ± 0.5 | 31.0 ± 0.4*‡ | 27.8 ± 0.3* |
| Adipose tissue (g) | 1.22 ± 0.09 | 1.65 ± 0.21*† | 0.68 ± 0.07*** | 0.80 ± 0.07 | 1.36 ± 0.11**‡ | 0.78 ± 0.04 |
Data are presented as means ± SE Mice were fed NcD or HcD for 33 and 12 weeks, respectively.
P < 0.05,
P < 0.01, and
P < 0.001 versus wild type.
P < 0.01.
P < 0.001 versus H2R−/−.
Histological Examination of the Liver
After 6 weeks of HcD intake, the liver from wild-type and H1R−/− mice were almost normal in their gross appearance (Figure 5, A and B) but that from H2R−/− mice was pale in appearance (Figure 5C), indicating lipid accumulation. On microscopic examination, the liver from wild-type and H1R−/− mice after 6 weeks on HcD showed scattered foci of inflammation (inflammation score = 1; Figure 5, D and E); whereas those from H2R−/− mice showed prominent inflammation (inflammation score = 3; Figure 5F). No fibrosis and stellate cell activation was noted in the liver form wild-type and H1R−/− mice investigated by Azan stain and immunostaining for α-SMA (Figure 5, G, H, J, and K). In contrast, Azan stain revealed pericellular fibrosis, where linear expression of α-SMA along the hepatic sinusoids was noted in H2R−/− mice (Figure 5, I and L), indicating the activation of hepatic stellate cells.15 HcD feeding for 14 weeks induced progressive inflammation in H1R−/− and H2R−/− mice. In H1R−/− mice, scattered foci of moderate fibrosis and stellate cell activation were noted. However, those were much advanced in H2R−/− mice. Moreover, enlarged hepatocyte (ballooning) and prominent anisonucleosis were observed in H2R−/− mice (supplemental Figure 1, see http://ajp.amjpathol.org).
Figure 5.

Hepatic steatosis and inflammation after 6-week HcD. A–C, Gross appearance of the liver from mice fed HcD. The liver from H2R−/− mice is pale in color. D–L: Representative photomicrographs showing hepatic inflammation, fibrosis, and hepatic stellate cell activation in mice fed HcD for 6 weeks. Livers from wild-type (D) and H1R−/− (E) mice show scattered lobular inflammation (arrows), whereas livers from H2R−/− mice (F) show severe lobular and perivenular inflammation (arrowheads). Pericellular fibrosis (Azan-Mallory stain, I) and α-SMA-positive stellate cells (L) are evident in livers from H2R−/− mice. No fibrosis and α-SMA-positive stellate cells are noted in wild-type (G and J) and H1R−/− mice (H and K). M–O: Representative photomicrographs showing lipid accumulation after six weeks of HcD feeding. The wild-type liver shows very few and small deposits of lipid in hepatocytes (M) and increased numbers of lipid droplets are evident in H1R−/− hepatocytes (N). Macrovesicular steatosis throughout the entire lobules is apparent in the liver from H2R−/− mice (O). Oil-red O stain.
Morphometric Analysis of Lipid Accumulation and Inflammation in the Liver
Oil-red O staining revealed small numbers of lipid droplets in the wild-type liver (Figure 5M). The numbers of lipid-positive hepatocytes and droplets numbers in each hepatocyte were increased in H1R−/− (Figure 5N) and H2R−/−mice (Figure 5O). The lipid droplets in H2R−/− mice, however, in most cases, showed variable in size, indicating mixed micro- and macrovesicular steatosis (Figure 5O). Fluorescent staining (LipidTOX) also demonstrated an increased lipid accumulation in the liver from H1R−/− and H2R−/−mice (supplemental Figure 2, see http://ajp.amjpathol.org). Morphometric analyses revealed that H2R−/− mice showed more severe lipid accumulation and inflammation than wild-type and H1R−/− mice after 6 weeks of HcD feeding (Figure 6A). Although the lipid accumulation in wild-type mice was comparable to that in H1R−/− and H2R−/− mice after 14 weeks of HcD, no inflammation was progressed in the liver of wild-type mice (Figure 6B). To clearly demonstrate the difference in lipid content and profile in each mice group, hepatic TG and cholesterol were measured from the liver tissues. The hepatic TG was increased in H1R−/− mice, whereas TG, total, and free cholesterol were markedly increased in H2R−/− mice (Figure 6C).
Figure 6.

Morphometric analysis of liver histology. Fat accumulation and inflammation in the liver after HcD were scored after 6 (A) and 14 (B) weeks of HcD feeding. Plasma AST and ALT levels, and hepatic lipidomics after 14 weeks of HcD. C: Plasma AST and ALT are increased in H2R−/− mice. D: Hepatic TG accumulation is enhanced in both KO mice, whereas total and free cholesterol are markedly increased in H2R−/− mice. FAS, fat accumulation score; IS, inflammation score. *P < 0.05, **P < 0.01, and ***P < 0.001 versus wild type. †P < 0.05, ††P < 0.01, and †††P < 0.001.WT, wild-type; H1, H1R−/−; H2, H2R−/− mice.
Increased Blood AST and ALT in H2R−/− Mice
The blood AST and ALT were significantly increased only in H2R−/− mice, indicating a presence of liver cell death (Figure 6D). Twenty percent of HcD-fed H2R−/− mice were dead before 12 weeks of the feeding (2.3% dead in H1R−/− mice, comparable with wild-type mice) possibly because of hepatic failure from severe hepatic inflammation and steatosis. Considering the histological findings, the induction of macrovesicular steatosis and ballooning of hepatocytes with inflammation and fibrosis by hyperlipidemia in H2R−/− mice is consistent with those seen in human NASH.13
Expression of Leptin, Adiponectin, and AdiopR after HcD Feeding for 12 Weeks
As shown in Figure 7A, the blood leptin levels were higher in H1R−/− mice than those in wild-type mice, while the blood adiponectin levels were significantly lower in H2R−/− mice than in wild-type mice (Figure 7B). Hepatic AdipoR1 expression in H1R−/− and H2R−/− mice was comparable to that in wild-type mice (Figure 7C) but that of AdipoR2 was decreased in both groups of KO mice (Figure 7D). In skeletal muscle, the expression of AdipoR1 and R2 did not differ between wild-type and KO mice (Figure 7, E and F).
Figure 7.
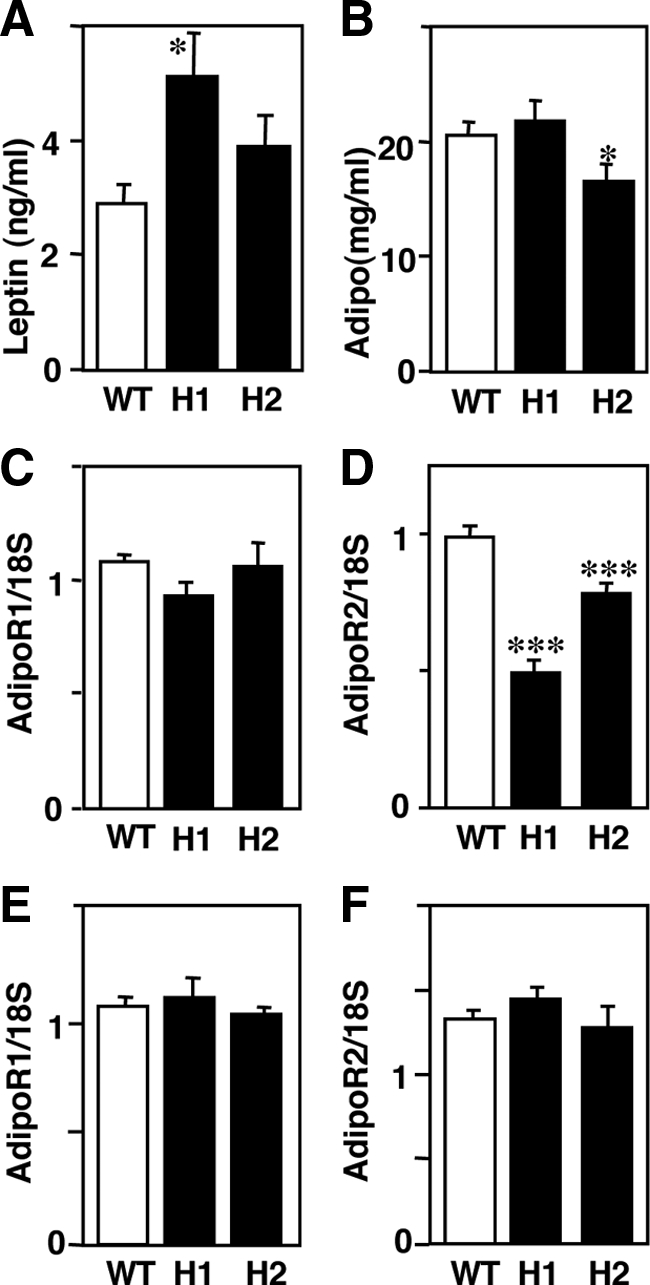
Expression of leptin, adiponectin and AdipoR in mice fed with HcD for 12 weeks. Blood leptin levels in H1R−/− mice are increased (A), and blood adiponectin levels are decreased in H2R−/− mice (B). C and D: Expression of AdipoRs in the liver. AdipoR1 expression was not different in the liver (C) but AdipoR2 expression was significantly decreased in both KO mice (D). E and F: Expression of AdipoRs in skeletal muscle. There was no difference in expression of AdipoR1 or AdipoR2 between wild-type and KO mice. *P < 0.05 and ***P < 0.001 versus wild-type mice. WT, wild-type; H1, H1R−/−; H2, H2R−/− mice.
Hepatic Expression of SREBPs, FASn, and HMGR after HcD Feeding for 12 Weeks
Expression of SREBP-1, a master regulator which up-regulates expression of enzymes involved in hepatic fatty acid biosynthetic pathway, including FASn, was investigated. The hepatic expression of SREBP-1 was moderately increased in H1R−/− mice and markedly decreased in H2R−/− mice (Figure 8A) compared with wild-type mice. The mRNA and protein expression of FASn were decreased in H2R−/− mice (Figure 8, B and C). Although the mRNA expression of SREBP-2 was decreased in H1R−/− and H2R−/− mice, one of its target genes, HMGR, was moderately decreased in H2R−/− mice (Figure 8, D and E).
Figure 8.

Hepatic expression of SREBPs, FASn, and HMGR in mice fed with HcD for 12 weeks. A: Hepatic expression of SREBP-1 was increased in H1R−/− mice and decreased in H2R−/− mice. B and C: mRNA and protein (273 kDa) expression of FASn were decreased in H2R−/− mice. D and E: SREBP-2 expression was reduced in both KO mice, and HMGR was decreased in H2R−/− mice. *P < 0.05, **P < 0.01, and ***P < 0.001 versus wild-type mice. †P < 0.05 and †††P < 0.001. WT, wild-type; H1, H1R−/−; H2, H2R−/− mice.
Discussion
With NcD feeding, neither H1R−/− nor H2R−/− mice showed hyperlipidemia or any cardiovascular events but exhibited moderately impaired glucose metabolism. After the mice had been fed HcD to enhance hyperlipidemia-induced disturbances in glucose and lipid metabolism, both groups of KO mice exhibited impaired glucose uptake, as determined by the glucose challenge test. In addition, H1R−/− mice showed obesity and visceral adiposity with hyperleptinemia, whereas H2R−/− mice showed severe and early onset of NASH-like hepatic lesion with hypoadiponectinemia. Taken together, these findings suggest that histamine signaling mediated through H1R and/or H2R may contribute to glucose and lipid metabolism.
Hyperlipidemic Mice Model to Study Glucose and Lipid Metabolisms
The most known models for NASH are leptin deficient (ob/ob) mice exhibiting obese and diabetic phenotypes, but the ob/ob mice require other factors such as methionine choline-deficient (MCD) diet, lipopolysaccharide, or carbon tetrachloride to induce hepatic inflammation and fibrosis.26 The MCD diet-induced models are also frequently used for the studies of NASH because MCD-fed mice show very similar histology of human NASH, including steatosis, inflammation, and fibrosis. However, MCD diet, in itself, is not physiological and induces lower plasma TG levels.26 In contrast, human NASH has been recognized as one of the pathological targets of metabolic syndrome and hyperlipidemia is closely associated with its pathogenesis.11,12 Therefore, HcD-induced models would be beneficial to study the development and progression of NASH.
Glucose Metabolism in H1R−/− and H2R−/− Mice
Lipid-induced insulin resistance has been extensively studied in experiments by acute lipid infusion and dietary overload.27,28,29 However, the extent of insulin resistance could not be fully elucidated using this lipid-induced etiology because the differences in severity of insulin resistance between H1R−/− and H2R−/− mice suggest the pathogeneses differ between the two groups of KO mice.
H1R−/− mice have been reported to show leptin-resistant, diabetic, and obese phenotypes.7 In fact, H1R−/− mice exhibited moderate insulin resistance, hyperleptinemia, obesity, and visceral adiposity after HcD feeding. Leptin regulates metabolic efficiency and anorexic action via its receptors in hypothalamic nuclei, which receive projections from histamine neurons.7,8,30,31 Therefore, in the central nervous system, the mechanism that leads to decreased energy expenditure in HDC−/−, H1R−/−, and H3R−/− mice can be explained by impaired activity of the leptin–hypothalamic loop, because of the deficiency of neuronal histamine action and downstream leptin signaling, in which obese phenotypes and leptin resistance are common features.6,7,8 The leptin-mediated central mechanisms regulate insulin-dependent glucose utilization in the liver32 and the expression of uncoupling proteins in adipose tissue and skeletal muscle.33,34 Therefore, in H1R−/− mice, impairment of the leptin–histamine loop in the central nervous system results in decreased leptin-induced up-regulation of uncoupling proteins in adipose tissue.7,35
In addition to the hypothalamic actions, leptin also exerts peripheral functions via leptin receptors expressed in peripheral tissues, including pancreatic islets.36,37,38 For example, leptin inhibits insulin gene expression and insulin secretion in isolated murine islets.38 In leptin deficient (ob/ob), leptin receptor-deficient (db/db) and pancreas-specific leptin receptor-deficient mice, the pancreatic islets are hyperplastic because of deficient leptin signaling with enhanced insulin action in β cells.39,40,41 The presence of islet hypertrophy and hyperplasia in H1R−/− mice suggests that leptin signaling may also be impaired in H1R-deficient β cells and that leptin–histamine-mediated signaling may regulate β-cell growth and insulin secretion.41 Together with the fact that histamine can suppress islet cell proliferation,42 the islet hyperplasia in H1R−/− mice might not due to compensation for impaired glucose metabolism but might be resulted from deficiency of H1R and leptin-mediated histamine effects on islet cells. This might be a possible explanation that H2R−/− mice did not show islet hyperplasia even though the mice exhibited more profound glucose metabolic impairment.
H2R−/− mice exhibited enhanced insulin resistance and glucose intolerance, indicating reduced insulin sensitivity in peripheral tissues. Recent studies have revealed a central role of the adipocyte in metabolic regulation, which is mediated by the secretion of adipocytokines. In particular, hypoadiponectinemia is thought to be pivotal for the pathogenesis of insulin resistance/metabolic syndrome.43,44 In skeletal muscle and liver, adiponectin enhances insulin sensitivity through AdipoRs (AdipoR1 and AdipoR2, respectively) by increasing glucose transport.45,46 H2R−/− mice showed significantly decreased expression of adiponectin and hepatic AdipoR2 compared with wild-type mice, which may explain, in part, the decreased insulin sensitivity.
[18F]FDG Uptake and Gluts Expression in H1R−/− and H2R−/− Mice
The organ distribution of [18F]FDG was quite different in these KO mice. Of note, the relative and actual [18F]FDG uptake in the brain was higher in H1R−/− mice than in H2R−/− mice. However, the expression profile of the major Gluts (brain, Glut3; liver, Glut2; and skeletal muscle, Glut4) did not correspond to the distribution in [18F]FDG uptake. One possible explanation for the higher [18F]FDG uptake in the brain might be related to leptin and insulin effects on neuronal cells to enhance glucose uptake via Glut4.47 Actually both leptin and Glut4 expression was increased in H1R−/− mice after HcD feeding. Furthermore, the expression of other transporters Glut1 and Glut2, which located in the endothelial cells of blood brain barrier and astrocytes, respectively,48 were also increased in H1R−/− mice. The brain is given the highest priority to maintain its energy supply by a system of glucose allocation to the brain from the peripheral tissues, which is regulated by the neocortex and limbic-hypothalamic-pituitary-adrenal system. Disorders in energy on demand process can influence the glucose allocation and result in metabolic abnormalities such as anorexia, obesity, diabetes mellitus, and metabolic syndrome.49,50 Histamine signaling through H1 receptor might be involved in regulating the glucose allocation. However, the mechanisms and significance of uneven organ distribution of [18F]FDG among these KO mice is still unknown.
Hepatic Steatosis and Inflammation in H1R−/− and H2R−/− Mice
Adiponectin is an anti-steatogenic cytokine and decreases the content of TG in the liver and inhibits liver fibrosis.51,52 AdipoR1 and R2 are the predominant receptors for adiponectin, and stimulation of AdipoR1-mediated signaling was shown to suppress hepatic expression of SREBP-1c,53 a master regulator which up-regulates enzymes involved in the fatty acid biosynthetic pathway, including FASn, to enhance de novo lipogenesis and lipid accumulation. In contrast, AdipoR2 is coupled to peroxisome proliferator-activated receptor-α signaling, which controls peroxisomal and mitochondrial β-oxidation. Thus, reduction of adiponectin signaling or targeted disruption of AdipoR enhances TG accumulation, lipid peroxidation, and oxidative stress leading to cell injuries and fibrosis.45,54 In contrast, adenovirus-mediated expression of either AdipoR1 or adipoR2 in leptin receptor-deficient mice attenuated the hepatic TG accumulation.45 Our results show that hepatic AdipoR2 expression were decreased in both H1R−/− and H2R−/− mice. Therefore, the AdipoR2-mediated signaling in the liver might be reduced, which would partly explain the increased hepatic TG content in both KO mice.
Hepatic TG accumulation, however, is considered as a first step in the development of NASH, and a second hit is required to promote oxidative stress and inflammation, cell death, and fibrosis.26,55 In regard to hepatic lipidomics, recent studies have suggested a pathogenic role of hepatic cholesterol in progression to NASH.56,57 Especially, free cholesterol accumulation in the liver has been reported to sensitize tumor necrosis factor and Fas-induced hepatic injuries.58 Furthermore, other studies indicate that dietary cholesterol, rather than hepatic steatosis, is necessary for the progression to NASH, and a high-fat diet containing no cholesterol prevents hepatic inflammation without decreasing liver TG content.59 In the present study, NASH-like hepatic injuries manifested by liver cell ballooning, macrovesicular steatosis, and fibrosis were very often observed in H2R−/− mice, in which hepatic free cholesterol was markedly increased. Therefore, these findings support a presence of the pathogenic role of free cholesterol, but not TG, in the progression to NASH. The mechanism(s), by which cholesterol, especially free cholesterol, accumulates in the liver of H2R−/− mice, is not clearly understood yet. The expression of SREBPs, FASn, and HMGR was decreased in H2R−/− mice, which may be due to physiological feedback response on hyperlipidemia. Therefore, the possibility that altered hepatic lipogenesis might be related to cholesterol accumulation is still remained. Alternatively, enterohepatic circulation of cholesterol, including absorption, transport, excretion, and bile acid synthesis would be involved in the hepatic cholesterol accumulation in H2R−/− mice or preserved expression of adiponectin and AdipoR1 in H1R−/− mice may have a currently unknown protective effect on cholesterol accumulation, which are remained to be clarified in the future studies. In fact, acute hepatic injuries associated with clinical use of H2R antagonist has been reported in human cases, in which metabolic idiosyncrasy but not drug allergy is suggested for its etiology.60
In summary, H1R and H2R signaling may play important roles in glucose and lipid metabolism, which seems to be mediated through both central and peripheral pathways. H1R signaling would be involved in central nervous system and pancreatic tissue to regulate glucose metabolism, while H2R signaling would be mainly related to peripheral action in the liver and skeletal muscle via adiponectin system to regulation both lipid and glucose metabolisms.
Footnotes
Address reprint requests to Yasuyuki Sasaguri, M.D., Ph.D., Department of Pathology and Cell Biology, School of Medicine, University of Occupational and Environmental Health, 1-1 Iseigaoka, Yahatanishi, Kitakyushu 807-8555, Japan. E-mail: yasu3219@med.uoeh-u.ac.jp.
Supported by a research grant from the Smoking Research Foundation (A.T.) and by grant-in-aid 20590416 from the Japanese Ministry of Education, Science, and Culture (Tokyo, A.T.). This work was conducted as part of the national wide efforts to standardize diagnostic and therapeutic definitions of vascular disease of DVD Research Group (Tokyo, Japan) (Y.S).
K.-Y.W. and A.T. contributed equally to this study.
Supplemental material for this article can be found on http://ajp.amjpathol.org.
References
- Higuchi S, Tanimoto A, Arima N, Xu H, Murata Y, Hamada T, Makishima K, Sasaguri Y. Effects of histamine and interleukin-4 synthesized in arterial intima on phagocytosis by monocytes/macrophages in relation to atherosclerosis. FEBS Lett. 2001;505:217–222. doi: 10.1016/s0014-5793(01)02823-x. [DOI] [PubMed] [Google Scholar]
- Matsuki Y, Tanimoto A, Hamada T, Sasaguri Y. Histidine decarboxylase expression as a new sensitive and specific marker for small cell lung carcinoma. Mod Pathol. 2003;16:72–78. doi: 10.1097/01.MP.0000044485.14910.3A. [DOI] [PubMed] [Google Scholar]
- Tanimoto A, Matsuki Y, Tomita T, Sasaguri T, Shimajiri S, Sasaguri Y. Histidine decarboxylase expression in pancreatic endocrine cells and related tumors. Pathol Int. 2004;54:408–412. doi: 10.1111/j.1440-1827.2004.01641.x. [DOI] [PubMed] [Google Scholar]
- Bakker RA, Timmerman H, Leurs R. Histamine receptors: specific ligands, receptor biochemistry, and signal transduction. Clin Allergy Immunol. 2002;17:27–64. [PubMed] [Google Scholar]
- Ohtsu H, Watanabe T. New functions of histamine found in histidine decarboxylase gene knockout mice. Biochem Biophys Res Commun. 2003;305:443–447. doi: 10.1016/s0006-291x(03)00696-x. [DOI] [PubMed] [Google Scholar]
- Fülöp AK, Földes A, Buzás E, Hegyi K, Miklós IH, Romics L, Kleiber M, Nagy A, Falus A, Kovacs KJ. Hyperleptinemia, visceral adiposity, and decreased glucose tolerance in mice with a targeted disruption of the histidine decarboxylase gene. Endocrinology. 2003;144:4306–4314. doi: 10.1210/en.2003-0222. [DOI] [PubMed] [Google Scholar]
- Masaki T, Yoshimatsu H, Chiba S, Watanabe T, Sakata T. Targeted disruption of histamine H1-receptor attenuates regulatory effects of leptin on feeding, adiposity, and UCP family in mice. Diabetes. 2001;50:385–391. doi: 10.2337/diabetes.50.2.385. [DOI] [PubMed] [Google Scholar]
- Takahashi K, Suwa H, Ishikawa T, Kotani H. Targeted disruption of H3 receptors results in changes in brain histamine tone leading to an obese phenotype. J Clin Invest. 2002;110:1791–1799. doi: 10.1172/JCI200215784. [DOI] [PMC free article] [PubMed] [Google Scholar]
- Lakka HM, Laaksonen DE, Lakka TA, Niskanen LK, Kumpusalo E, Tuomilehto J, Salonen JT. The metabolic syndrome and total and cardiovascular disease mortality in middle-aged men. J Am Med Assoc. 2002;288:2709–2716. doi: 10.1001/jama.288.21.2709. [DOI] [PubMed] [Google Scholar]
- Park YW, Zhu S, Palaniappan L, Heshka S, Carnethon MR, Heymsfield SB. The metabolic syndrome: prevalence and associated risk factor findings in the US population from the third national health and nutrition examination survey, 1988–1994. Arch Intern Med. 2003;163:427–436. doi: 10.1001/archinte.163.4.427. [DOI] [PMC free article] [PubMed] [Google Scholar]
- Neuschwander-Tetri BA. Nonalcoholic steatohepatitis and the metabolic syndrome. Am J Med Sci. 2005;330:326–335. doi: 10.1097/00000441-200512000-00011. [DOI] [PubMed] [Google Scholar]
- Agarwal N, Sharma BC. Insulin resistance and clinical aspects of non-alcoholic steatohepatitis (NASH). Hepatol Res. 2005;33:92–96. doi: 10.1016/j.hepres.2005.09.012. [DOI] [PubMed] [Google Scholar]
- Washington K, Wright K, Shyr Y, Hunter EB, Olson S, Raiford DS. Hepatic stellate cell activation in nonalcoholic steatohepatitis and fatty liver. Hum Pathol. 2000;31:822–828. doi: 10.1053/hupa.2000.8440. [DOI] [PubMed] [Google Scholar]
- Leclercq IA, Farrell GC, Schriemer R, Robertson GR. Leptin is essential for the hepatic fibrogenic response to chronic liver injury. J Hepatol. 2002;37:206–213. doi: 10.1016/s0168-8278(02)00102-2. [DOI] [PubMed] [Google Scholar]
- Sahai A, Malladi P, Pan X, Paul R, Melin-Aldana H, Green RM, Whitington PF. Obese and diabetic db/db mice develop marked liver fibrosis in a model of nonalcoholic steatohepatitis: role of short-form leptin receptors and osteopontin. Am J Physiol Gastrointest Liver Physiol. 2004;287:G1032–G1043. doi: 10.1152/ajpgi.00199.2004. [DOI] [PubMed] [Google Scholar]
- Maeda K, Okubo K, Shimomura I, Funahashi T, Matsuzawa Y, Matsubara K. cDNA cloning and expression of a novel adipose specific collagen-like factor apM1 (AdiPose most abundant gene transcript 1). Biochem Biophys Res Commun. 1996;221:286–289. doi: 10.1006/bbrc.1996.0587. [DOI] [PubMed] [Google Scholar]
- Scherer PE, Williams S, Fogliano M, Baldini G, Lodish HF. A novel serum protein similar to C1q, produced exclusively in adipocytes. J Biol Chem. 1995;270:26746–26749. doi: 10.1074/jbc.270.45.26746. [DOI] [PubMed] [Google Scholar]
- Marchesini G, Marzocchi R, Agostini F, Bugianesi E. Nonalcoholic fatty liver disease and the metabolic syndrome. Curr Opin Lipidol. 2005;16:421–427. doi: 10.1097/01.mol.0000174153.53683.f2. [DOI] [PubMed] [Google Scholar]
- Vuppalanchi R, Marri S, Kolwankar D, Considine RV, Chalasani N. Is adiponectin involved in the pathogenesis of nonalcoholic steatohepatitis? A preliminary human study. J Clin Gastroenterol. 2005;39:237–242. doi: 10.1097/01.mcg.0000152747.79773.2f. [DOI] [PubMed] [Google Scholar]
- Inoue I, Yanai K, Kitamura D, Taniuchi I, Kobayashi T, Niimura K, Watanabe T. Impaired locomotor activity and exploratory behavior in mice lacking histamine H1 receptors. Proc Natl Acad Sci USA. 1996;93:13316–13320. doi: 10.1073/pnas.93.23.13316. [DOI] [PMC free article] [PubMed] [Google Scholar]
- Kobayashi T, Tonai S, Ishihara Y, Koga R, Okabe S, Watanabe T. Abnormal functional and morphological regulation of the gastric mucosa in histamine H2 receptor-deficient mice. J Clin Invest. 2000;105:1741–1749. doi: 10.1172/JCI9441. [DOI] [PMC free article] [PubMed] [Google Scholar]
- Oberdorfer F, Hull WE, Traving BC, Maier-Borst W. Synthesis and purification of 2-deoxy-2-18Ffluoro-d-glucose and 2-deoxy-2–18Ffluoro-d-mannose: characterization of products by 1H- and 19F-NMR spectroscopy. Int J Rad Appl Instrum A Isot. 1986;37:695–701. doi: 10.1016/0883-2889(86)90263-7. [DOI] [PubMed] [Google Scholar]
- Uchida H, Okamoto T, Ohmura T, Shimizu K, Satoh N, Koike T, Yamashita T. A compact planar positron imaging system. Nucl Instr Meth. 2004;A516:564–574. [Google Scholar]
- Sasaguri Y, Wang KY, Tanimoto A, Tsutsui M, Ueno H, Murata Y, Kohno Y, Yamada S, Ohtsu H. Role of histamine produced by bone marrow-derived vascular cells in pathogenesis of atherosclerosis. Circ Res. 2005;96:974–981. doi: 10.1161/01.RES.0000166325.00383.ed. [DOI] [PubMed] [Google Scholar]
- Folch J, Lees M, Sloane Stanley GH. A simple method for the isolation and purification of total lipids from animal tissues. J Biol Chem. 1957;226:497–509. [PubMed] [Google Scholar]
- Anstee QM, Goldin RD. Mouse models in non-alcoholic fatty liver disease and steatohepatitis research. Int J Exp Pathol. 2006;87:1–16. doi: 10.1111/j.0959-9673.2006.00465.x. [DOI] [PMC free article] [PubMed] [Google Scholar]
- Schmitz-Peiffer C. Signaling aspects of insulin resistance in skeletal muscle: mechanisms induced by lipid oversupply. Cell Signal. 2000;12:583–594. doi: 10.1016/s0898-6568(00)00110-8. [DOI] [PubMed] [Google Scholar]
- Yu C, Chen Y, Cline GW, Zhang D, Zong H, Wang Y, Bergeron R, Kim JK, Cuhman SW, Cooney GJ, Atcheson B, White MF, Kraegen EW, Shulman GI. Mechanism by which fatty acids inhibit insulin activation of insulin receptor substrate-1 (IRS-1)-associated phosphatidylinositol 3-kinase activity in muscle. J Biol Chem. 2002;277:50230–50236. doi: 10.1074/jbc.M200958200. [DOI] [PubMed] [Google Scholar]
- Dube JJ, Bhatt BA, Dedousis N, Bonen A, O'Doherty RM. Leptin, skeletal muscle lipids, and lipid-induced insulin resistance. Am J Physiol Regul Integr Comp Physiol. 2007;293:R642–R650. doi: 10.1152/ajpregu.00133.2007. [DOI] [PubMed] [Google Scholar]
- Ebihara K, Ogawa Y, Masuzaki H, Shintani M, Miyanaga F, Aizawa-Abe M, Hayashi T, Hosoda K, Inoue G, Yoshimasa Y, Gavrilova O, Reitman ML, Nakao K. Transgenic overexpression of leptin rescues insulin resistance and diabetes in a mouse model of lipoatrophic diabetes. Diabetes. 2001;50:1440–1448. doi: 10.2337/diabetes.50.6.1440. [DOI] [PubMed] [Google Scholar]
- Yoshimatsu H, Itateyama E, Kondou S, Tajima D, Himeno K, Hidaka S, Kurokawa M, Sakata T. Hypothalamic neuronal histamine as a target of leptin in feeding behavior. Diabetes. 1999;48:2286–2291. doi: 10.2337/diabetes.48.12.2286. [DOI] [PubMed] [Google Scholar]
- German J, Kim F, Schwartz GJ, Havel PJ, Rhodes CJ, Schwartz MW, Morton GJ. Hypothalamic leptin signaling regulates hepatic insulin sensitivity via a neurocircuit involving the vagus nerve. Endocrinology. 2009;150:4502–4511. doi: 10.1210/en.2009-0445. [DOI] [PMC free article] [PubMed] [Google Scholar]
- Zhou YT, Shimabukuro M, Koyama K, Lee Y, Wang MY, Trieu F, Newgard CB, Unger RH. Induction by leptin of uncoupling protein-2 and enzymes of fatty acid oxidation. Proc Natl Acad Sci USA. 1997;94:6386–6390. doi: 10.1073/pnas.94.12.6386. [DOI] [PMC free article] [PubMed] [Google Scholar]
- Cusin I, Zakrzewska KE, Boss O, Muzzin P, Giacobino JP, Ricquier D, Jeanrenaud B, Rohner-Jeanrenaud F. Chronic central leptin infusion enhances insulin-stimulated glucose metabolism and favors the expression of uncoupling proteins. Diabetes. 1998;47:1014–1019. doi: 10.2337/diabetes.47.7.1014. [DOI] [PubMed] [Google Scholar]
- Masaki T, Chiba S, Yasuda T, Noguchi H, Kakuma T, Watanabe T, Sakata T, Yoshimatus H. Involvement of hypothalamic histamine H1 receptor in the regulation of feeding rhythm and obesity. Diabetes. 2004;53:2250–2260. doi: 10.2337/diabetes.53.9.2250. [DOI] [PubMed] [Google Scholar]
- Poitout V, Rouault C, Guerre-Millo M, Reach G. Does leptin regulate insulin secretion? Diabetes Metab. 1998;24:321–326. [PubMed] [Google Scholar]
- Kieffer TJ, Habener JF. The adipoinsulin axis: effects of leptin on pancreatic β cells. Am J Physiol Endocrinol Metab. 2000;278:E1–E14. doi: 10.1152/ajpendo.2000.278.1.E1. [DOI] [PubMed] [Google Scholar]
- Kulkarni RN, Wang ZL, Wang RM, Hurley JD, Smith DM, Ghatei MA, Withers DJ, Gardiner JV, Bailey CJ, Bloom SR. Leptin rapidly suppresses insulin release from insulinoma cells, rat and human islets and, in vivo, in mice. J Clin Invest. 1997;100:2729–2736. doi: 10.1172/JCI119818. [DOI] [PMC free article] [PubMed] [Google Scholar]
- Bock T, Pakkenberg B, Buschard K. Increased islet volume but unchanged islet number in ob/ob mice. Diabetes. 2003;52:1716–1722. doi: 10.2337/diabetes.52.7.1716. [DOI] [PubMed] [Google Scholar]
- Baetens D, Stefan Y, Ravazzola M, Malaisse-Lagae F, Coleman DL. Alteration of islet cell populations in spontaneously diabetic mice. Diabetes. 1978;27:1–7. doi: 10.2337/diab.27.1.1. [DOI] [PubMed] [Google Scholar]
- Morioka T, Asilmaz E, Hu J, Dishinger JF, Kurpad AJ, Elias CF, Li H, Elmquist JK, Kennedy RT, Kulkarni RN. Disruption of leptin receptor expression in the pancreas directly affects β cell growth and function in mice. J Clin Invest. 2007;117:2860–2868. doi: 10.1172/JCI30910. [DOI] [PMC free article] [PubMed] [Google Scholar]
- Sjöholm A. Histaminergic regulation of pancreatic β cell replication and insulin secretion. Biochem Biophys Res Commun. 1995;214:224–229. doi: 10.1006/bbrc.1995.2278. [DOI] [PubMed] [Google Scholar]
- Ryo M, Nakamura T, Kihara S, Kumada M, Shibazaki S, Takahashi M, Nagai M, Matsuzawa Y, Funahashi T. Adiponectin as a biomarker of the metabolic syndrome. Circ J. 2004;68:975–981. doi: 10.1253/circj.68.975. [DOI] [PubMed] [Google Scholar]
- Okamoto Y, Kihara S, Funahashi T, Matsuzawa Y, Libby P. Adiponectin: a key adipocytokine in metabolic syndrome. Clin Sci. 2006;110:267–278. doi: 10.1042/CS20050182. [DOI] [PubMed] [Google Scholar]
- Yamauchi T, Kamon J, Minokoshi Y, Ito Y, Waki H, Uchida S, Yamashita S, Noda M, Kita S, Ueki K, Eto K, Akanuma Y, Froguel P, Foufelle F, Ferre P, Carling D, Kimura S, Nagai R, Kahn BB, Kadowaki T. Adiponectin stimulates glucose utilization and fatty-acid oxidation by activating AMP-activated protein kinase. Nat Med. 2002;8:1288–1295. doi: 10.1038/nm788. [DOI] [PubMed] [Google Scholar]
- Nawrocki AR, Rajala MW, Tomas E, Pajvani UB, Saha AK, Trumbauer ME, Pang Z, Chen AS, Ruderman NB, Chen H, Rossetti L, Scherer PE. Mice lacking adiponectin show decreased hepatic insulin sensitivity and reduced responsiveness to peroxisome proliferator-activated receptor γ agonists. J Biol Chem. 2006;281:2654–2660. doi: 10.1074/jbc.M505311200. [DOI] [PubMed] [Google Scholar]
- Benomar Y, Naour N, Aubourg A, Bailleux V, Gertler A, Djiane J, Guerre-Millo M, Taouis M. Insulin and leptin induce Glut4 plasma membrane translocation and glucose uptake in a human neuronal cell line by a phosphatidylinositol 3-kinase-dependent mechanism. Endocrinology. 2006;147:2550–2556. doi: 10.1210/en.2005-1464. [DOI] [PubMed] [Google Scholar]
- Choeiri C, Staines W, Messier C. Immunohistochemical localization and quantification of glucose transporters in the mouse brain. Neuroscience. 2002;111:19–34. doi: 10.1016/s0306-4522(01)00619-4. [DOI] [PubMed] [Google Scholar]
- Peters A, Schweiger U, Frühwald-Schultes B, Born J, Fehm HL. The neuroendocrine contral of glucose allocation. Exp Clin Endocrinol Diabetes. 2002;110:199–211. doi: 10.1055/s-2002-33068. [DOI] [PubMed] [Google Scholar]
- Peters A, Schweiger U, Pellerin L, Hubold C, Oltmanns KM, Conrad M, Schultes B, Born J, Fehm HL. The selfish brain: competition for energy resources. Neurosci Biobehav Rev. 2004;28:143–180. doi: 10.1016/j.neubiorev.2004.03.002. [DOI] [PubMed] [Google Scholar]
- Kamada Y, Tamura S, Kiso S, Matsumoto H, Saji Y, Yoshida Y, Fukui K, Maeda N, Nishizawa H, Nagaretani H, Okamoto Y, Kihara S, Miyagawa J, Shinomura Y, Funahashi T, Matsuzawa T. Enhanced carbon tetrachloride-induced liver fibrosis in mice lacking adiponectin. Gastroenterology. 2003;125:1796–1807. doi: 10.1053/j.gastro.2003.08.029. [DOI] [PubMed] [Google Scholar]
- Yamauchi T, Kamon J, Waki H, Terauchi Y, Kubota N, Hara K, Mori Y, Ide T, Murakami K, Tsuboyama-Kasaoka N, Ezaki O, Akanuma Y, Gavrilova O, Vinson C, Reitman ML, Kagechika H, Shudo K, Yoda M, Nakano Y, Tobe K, Nagai R, Kimura S, Tomita M, Froguel P, Kadowaki T. The fat-derived hormone adiponectin reverses insulin resistance associated with both lipoatrophy and obesity. Nat Med. 2001;7:941–946. doi: 10.1038/90984. [DOI] [PubMed] [Google Scholar]
- Awazawa M, Ueki K, Inabe K, Yamauchi T, Kaneko K, Okazaki Y, Bardeesy N, Ohnishi S, Nagai R, Kadowaki T. Adiponectin suppresses hepatic SREBP-1c expression in an AdipoR1/LKB1/AMPK dependent pathway. Biochem Biophys Res Commun. 2009;382:51–56. doi: 10.1016/j.bbrc.2009.02.131. [DOI] [PubMed] [Google Scholar]
- Tomita K, Oike Y, Teratani T, Taguchi T, Noguchi M, Suzuki T, Mizutani A, Yokoyama H, Irie R, Sumimtoto H, Takayanagi A, Miyashita K, Akao M, Tabata M, Tamiya G, Ohkura T, Hibi T. Hepatic AdipoR2 signaling plays a protective role against progression of nonalcoholic steatohepatitis in mice. Hepatology. 2008;48:458–473. doi: 10.1002/hep.22365. [DOI] [PubMed] [Google Scholar]
- Day CP, James OF. Steatohepatitis: a tale of two “hits”? Gatroenterology. 1998;114:842–845. doi: 10.1016/s0016-5085(98)70599-2. [DOI] [PubMed] [Google Scholar]
- Matsuzawa N, Takamura T, Kurita S, Misu H, Ota T, Ando H, Yokoyama M, Honda M, Zen Y, Nakanuma Y, Miyamoto K, Kaneko S. Lipid-induced oxidative stress causes steatohepatitis in mice fed an atherogenic diet. Hepatology. 2007;46:1392–1403. doi: 10.1002/hep.21874. [DOI] [PubMed] [Google Scholar]
- Caballero F, Fernandez A, De Lacy AM, Fernandez-Checa JC, Caballeria J, Garcia-Ruiz C. Enhanced free cholesterol, SREBP-2 and StAR expression in human NASH. J Hepatol. 2009;50:789–796. doi: 10.1016/j.jhep.2008.12.016. [DOI] [PubMed] [Google Scholar]
- Mari M, Caballero F, Collel A, Morales A, Caballeria J, Fernandez A, Enrich C, Fernandez-Checa JC, Garcia-Ruiz C. Mitochondrial free cholesterol loading sensitizes to TNF- and Fas-mediated steatohepatitis. Cell Metab. 2006;4:185–189. doi: 10.1016/j.cmet.2006.07.006. [DOI] [PubMed] [Google Scholar]
- Wouters K, Van Gorp PJ, Bieghs V, Gijbels MJ, Duimel H, Lütjohann D, Kerksiek A, Van Kruchten R, Maeda N, Staels B, Van Bilsen M, Shiri-Sverdlov R, Hofker MH. Dietary cholesterol, rather than liver steatosis, leads to hepatic inflammation in hyperlipidemic mouse models of nonalcoholic steatohepatitis. Hepatology. 2008;48:474–486. doi: 10.1002/hep.22363. [DOI] [PubMed] [Google Scholar]
- Andrade RJ, Lucena MI, Martin-Vivaldi R, Fernandez MC, Nogueras F, Pelaez G, Gomez-Outes A, Garcia-Escano MD, Bellot V, Hervas A, Cardenas F, Bermudez F, Romero M, Salmeron J. Acute liver injury associated with the use of ebrotidine, a new H2-receptor antagonist. J Hepatol. 1999;31:641–646. doi: 10.1016/s0168-8278(99)80343-2. [DOI] [PubMed] [Google Scholar]