Abstract
This paper presents an ultrafast optical spectroscopic investigation of the excited state energies, lifetimes and spectra of specific geometric isomers of neoxanthin, violaxanthin, lutein, and zeaxanthin. All-trans- and 15,15’-cis-β-carotene were also examined. The spectroscopy was done on molecules purified by HPLC frozen immediately to inhibit isomerization. The spectra were taken at 77 K to maintain the configurations and to provide better spectral resolution than seen at room temperature. The kinetics reveal that for all of the molecules except neoxanthin, the S1 state lifetime of the cis-isomers is shorter than that of the all-trans isomers. The S1 excited state energies of all the isomers were determined by recording S1 → S2 transient absorption spectra. The results obtained in this manner at cryogenic temperatures provide an unprecedented level of precision in the measurement of the S1 energies of these xanthophylls, which are critical components in light-harvesting pigment-protein complexes of green plants.
Keywords: excited state energy, ultrafast transient absorption, xanthophylls, geometric isomers excited state lifetime
1. Introduction
Carotenoids consist of two groups of molecules: carotenes, which are hydrocarbons, and xanthophylls, which are the oxygenated derivatives of carotenes [1]. Members of both groups are characterized structurally by a long, conjugated, π-electron chain of carbon-carbon double bonds and spectrally, by strong visible absorption in the 400 to 500 nm region [2,3]. This absorption is due to an intense, allowed S0 (11Ag −) → S2 (11Bu +) transition. This notation considers carotenoids as belonging to the idealized C2h point group [4,5]. Strictly speaking however, carotenoids do not possess this high degree of symmetry, but because many carotenoids exhibit the spectral characteristics of shorter polyenes that do have C2h symmetry, it is customary to use the same electronic state notation [6]. Transitions between S0 (11Ag −) and the lowest excited singlet state, S1 (21Ag −), are forbidden by symmetry.
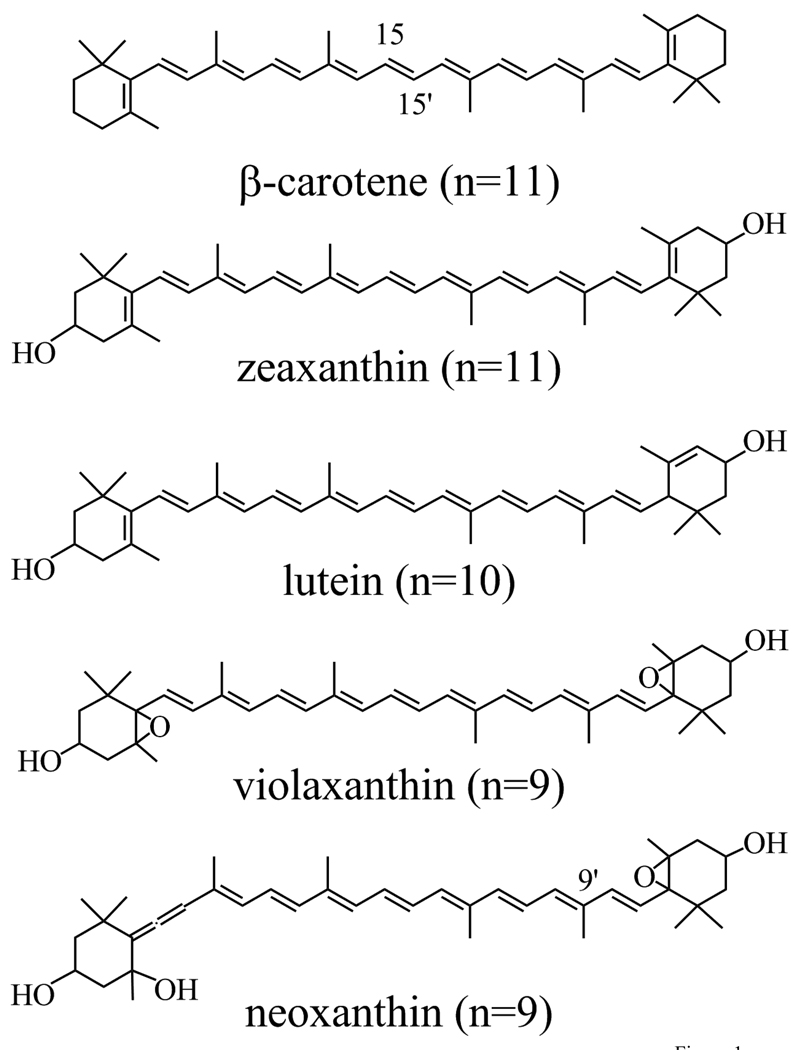
All-trans configurations of carotenes and xanthophylls can be induced thermally, photochemically or catalytically to undergo rotations about carbon-carbon double bonds to form cis geometric isomers [7]. The occurrence of cis geometric isomers of carotenoids can be confirmed through the presence of an additional absorption band in the ultraviolet region. This band is termed the “cis-peak,” and it is associated with an S0 (11Ag −) → S3 (11Ag +) transition that becomes more allowed upon isomerization from trans to cis [1,7–9]. A number of cis-geometric configurations as well as all-trans carotenoids have been resolved in three-dimensional X-ray crystal structures of pigment-protein complexes from photosynthetic organisms [10–13]. These findings have raised the question of whether nature has selected different geometric isomers in photosynthetic pigment-protein complexes for specific functional roles. Studies on different geometric isomers of carotenoids in solution and bound in photosynthetic pigment-protein complexes have addressed this issue using steady-state and time-resolved optical spectroscopic methods [14–18]. For example, the natural selection of the 15,15’-cis isomer in photosynthetic bacterial reaction centers has been postulated to be involved in the deactivation of harmful excited triplet states of bacteriochlorophyll [14,15,19]. In higher plants, xanthophylls are important components in a complex defense mechanism known as the xanthophyll cycle, which is thought to be a means by which excess excited states of chlorophyll (Chl) are quenched, thereby protecting the photosynthetic apparatus from photo-damage caused by excess light absorption [20–30]. The enzymatic de-epoxidation of the xanthophyll, violaxanthin, to zeaxanthin is one component of the xanthophyll cycle protection mechanism which also involves the formation of a trans-membrane pH gradient [31,32]. The mechanism is also facilitated in some thus far undetermined manner by a protein subunit known as PsbS [25,33–35]. Moreover, it has been suggested that the differences in molecular conformations of the xanthophylls which include not only violaxanthin and zeaxanthin, but also lutein and neoxanthin (Fig. 1), may affect the assembly or structure of the light-harvesting pigment-protein complexes and lead to different extents of Chl excited state quenching [36,37]. Recent reports have implicated conformational twisting of neoxanthin, which exists in a 9’-cis-configuration in the LHCII antenna complex, as a critical component signaling aggregation and quenching [38,39]. Yet, despite the common occurrence, broad distribution, and physiological importance of xanthophylls in photosynthetic organisms, no detailed systematic study of the photophysical properties of the geometric isomers of these molecules has been carried out. In this work we present a steady-state and ultrafast time-resolved optical spectroscopic investigation of the excited state energies, lifetimes and spectra of purified all-trans and cis geometric isomers of the xanthophylls, neoxanthin (n=9), violaxanthin (n=9), lutein (n=10), and zeaxanthin (n=11), where n is the number of conjugated π-electron double bonds (Fig. 1). β-carotene (n=11) was also examined.
Fig. 1.
Structures of the all-trans isomers of β-carotene, zeaxanthin, lutein, violaxanthin and neoxanthin.
The spectroscopic experiments were carried out on the molecules purified by high performance liquid chromatography (HPLC) and immediately frozen to prevent isomerization. Another advantage to carrying out the experiments at low temperatures is that the spectral features are better resolved than those observed at room temperature which leads to higher precision in the determination of the excited state energy levels of the isomers. The overall goal of this work is to examine the relationship between the stereochemistry of xanthophylls and their photophysics which determine their biological functions in photosynthetic organisms.
2. Materials and methods
Lutein, violaxanthin and neoxanthin were obtained using methods described previously [40]. Briefly, approximately 10 g of spinach leaves were ground in 50 mL acetone/methanol (50/50 v/v technical grade), filtered, dried, then redissolved in 87/10/3 v/v/v acetonitrile (Fisher)/methanol (Fisher)/water (Sigma), filtered, and injected to a Millipore Waters 600E high performance liquid chromatography (HPLC) system. The HPLC was equipped with a Model 996 single diode array detector and used a 3.9 mm × 300 mm Nova-Pak C18 reverse phase column, a gradient mobile phase of 100% A to 100% B in 40 min (A, 87/10/3 v/v/v acetonitrile (Fisher)/methanol (Fisher)/water (Sigma); B, ethyl acetate (Fisher)), and a flow rate of 1 mL/min. Zeaxanthin and 15,15’-cis-β-carotene were obtained as gifts from F. Hoffman LaRoche. Geometric isomers of β-carotene were obtained using a YMC C30 carotenoid column and an isocratic mobile phase of acetone (Fisher) with a flow rate of 1 mL/min. Isomers of zeaxanthin and lutein were obtained using the same column and an isocratic mobile phase of 97/3 v/v methanol (Fisher)/MTBE (Fisher) with a flow rate of 1 mL/min. Isomers of violaxanthin and neoxanthin were obtained using same column and an isocratic mobile phase of 87/10/3 v/v/v acetonitrile (Fisher)/methanol (Fisher)/water (Sigma) with a flow rate of 1.5 mL/min. The purified geometric isomers were obtained by collecting the peaks from the HPLC as they emerged. Subsequently the samples were dried with a gentle stream of nitrogen gas in the dark at room temperature and stored at −80°C until ready for use.
All of the spectroscopic experiments carried out at 77 K used 2-methyltetrahydrofuran (2-MTHF) as a solvent which forms a clear glass at that temperature. Steady-state absorption spectra were recorded using a Varian Cary-50 spectrophotometer and a custom-made (Kontes) liquid nitrogen cryostat. Transient absorption spectra were taken using a femtosecond time-resolved spectrometer system described previously [41,42] and an optical cryostat (Janis STVP100). The visible light and NIR continuum probe beams were generated by a 3 mm Sapphire plate obtained from Ultrafast Systems LLC. Two different types of detectors were used: an Ocean Optics Model S2000 charge-coupled detector with a 2048 pixel array for detection in the visible range, and a 512 pixel array SU-LDV high resolution InGaAs Digital Line Camera from Sensors Unlimited in the NIR region. The samples were excited at wavelengths corresponding to their spectral origin (0-0) vibronic bands and had optical densities of ~0.5 in a 2 mm path length cuvette at the excitation wavelength. The pump beam was set to 1 µJ energy focused in 1 mm spot, corresponding to an intensity of (3.2 ± 0.1) × 1014 photons pulse−1 cm−2. The integrity of the samples was checked by taking absorption spectra before and after every transient absorption experiment. Surface Explorer (v.1.0.6) was used for dispersion correction in the transient absorption datasets, and ASUFit 3.0 program provided by Dr. Evaldas Katilius at Arizona State University was used for global fitting analysis. The temporal response function of the instrument was obtained for each measurement as a parameter in the global fitting analysis (Table 1).
Table 1.
Lifetimes of the S2 (11Bu+) (τ2),hot S1 (21Ag −) (τ1’) and relaxed S1 (21Ag −) (τ1) of β-carotene and xanthophylls obtained from the global fitting analysis.
| Molecule | λexca (nm) |
λmax(TA)b (nm) |
τ 1 (ps) |
τ 1’ (ps) |
τ 2 (fs) |
τ sc (fs) |
|---|---|---|---|---|---|---|
| all-trans-β-carotene | 507 | 581 | 14.4 ± 0.8 | 0.58 ± 0.13 | 240 ± 50 | 160 |
| central-cis-β-carotene | 503 | 589 | 11.0 ± 0.5 | 0.78 ± 0.15 | <250 | 250 |
| all-trans-zeaxanthin | 506 | 579 | 14.8 ± 1.0 | 0.73 ± 0.13 | 220 ± 50 | 190 |
| central-cis-zeaxanthin | 502 | 588 | 12.4 ± 1.0 | 0.84 ± 0.15 | <220 | 220 |
| all-trans-lutein | 496 | 558 | 23.9 ± 0.9 | 0.63 ± 0.13 | 170 ± 90 | 120 |
| central-cis-lutein | 489 | 571 | 19.1 ± 0.9 | 1.2 ± 0.3 | 160 ± 40 | 120 |
| all-trans-violaxanthin | 488 | 536 | 37.0 ± 3.0 | 1.1 ± 0.3 | 210 ± 50 | 200 |
| central-cis-violaxanthin | 480 | 553 | 27.7 ± 1.0 | 1.0 ± 0.3 | 220 ± 80 | 190 |
| all-trans-neoxanthin | 488 | 538 | 47.4 ± 1.6 | 1.1 ± 0.3 | 250 ± 70 | 160 |
| central-cis-neoxanthin | 476 | 562 | 47.7 ± 2.0 | 1.3 ± 0.3 | 260 ± 70 | 160 |
(0-0) vibronic band of the steady-state absorption spectrum used for excitation;
Wavelength maximum of the main transient absorption band.
FWHM of the instrument response function.
3. Results
3.1. High performance liquid chromatography
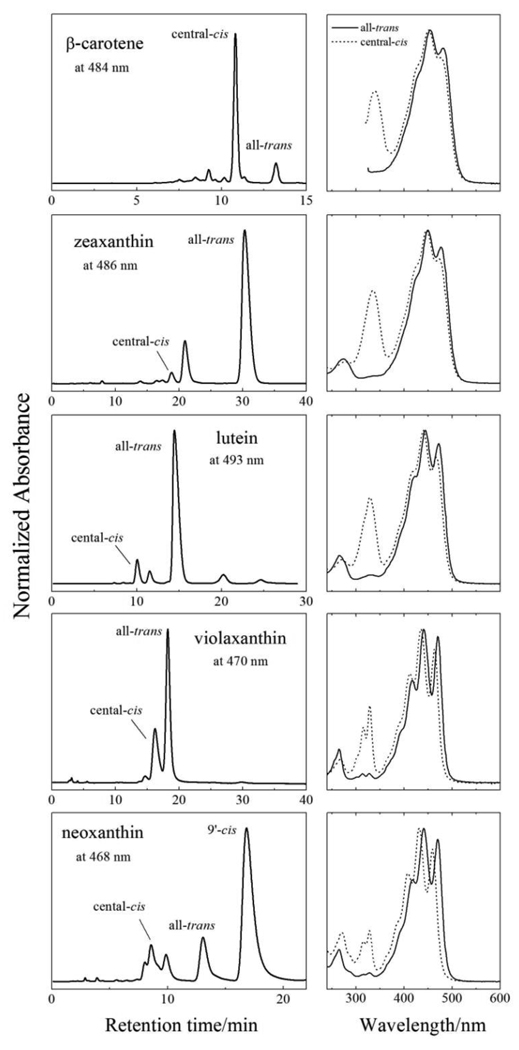
Room temperature (RT) absorption spectra of selected elution peaks corresponding to all-trans and cis geometric isomers of the carotenoids were obtained using the single diode array detector on the HPLC and are shown in Fig. 2. In all cases the main visible bands of the cis isomers of the molecules are blue-shifted relative to their corresponding all-trans isomers; e.g. by ~4 nm for β-carotene and ~11 nm for neoxanthin. Also, the cis isomers display pronounced absorption in the ultraviolet (UV) region between 300 and 350 nm. These UV absorption bands from carotenoids are referred to as “cis-peaks” and occur when a symmetry forbidden transition becomes allowed upon trans-to-cis isomerization. The large amplitude of the cis-peaks combined with the fact that cis isomers exhibit blue shifts of their absorption spectra identifies the chromatographic peaks noted in Fig. 2 as being associated with central-cis isomeric configurations of the molecules. Previous investigations correlating absorption spectral lineshapes of carotenoids with NMR structure determinations [43–46] support these assignments which are 15,15’-cis for β-carotene [47], zeaxanthin [48], and 13,14-cis for lutein, violaxanthin and neoxanthin as previously reported [49–53]. In addition, the 9’-cis isomer of neoxanthin was obtained [51].
Fig. 2.
HPLC chromatograms of β-carotene and xanthophylls recorded at the indicated detection wavelengths along with room temperature steady-state absorption spectra of selected peaks (all-trans (solid lines) and central-cis isomers (dashed lines)) taken from the single diode array detector as the molecules elute from the C30 reverse-phase column.
3.2. Steady-state absorption spectroscopy
Steady-state absorption spectra of the all-trans and central-cis isomers of the molecules taken at 77 K in 2-MTHF are shown in Figs. 3A–E. The steady-state absorption spectra shift to shorter wavelength with decreasing number of conjugated carbon-carbon double bonds. Compared to the RT spectra shown in Fig. 2, the 77 K absorption spectra are shifted to longer wavelengths due to the larger refractive index of the 2-MTHF glass formed at low temperature. Moreover, the spectra display a much higher degree of vibronic resolution compared to the spectra taken at RT. All of the spectra show multiple vibronic bands. However, the spectral resolution is less for β-carotene, zeaxanthin and lutein whose π-electron conjugation extends into terminal β-ionylidene rings. The wavelengths of the spectral origin (0-0) vibronic bands for all the molecules are given in Table 1. These were used for excitation of the molecules in the 77 K transient absorption spectroscopic experiments.
Fig. 3.
Steady-state absorption spectra of all-trans (solid lines) and central-cis isomers (dashed lines) of: (A) β-carotene; (B) zeaxanthin; (C) lutein; (D) violaxanthin and (E) neoxanthin. The spectra were recorded at 77 K in 2-MTHF. The spectra were normalized to their absorption maxima.
3.3. Transient absorption spectroscopy in the visible region
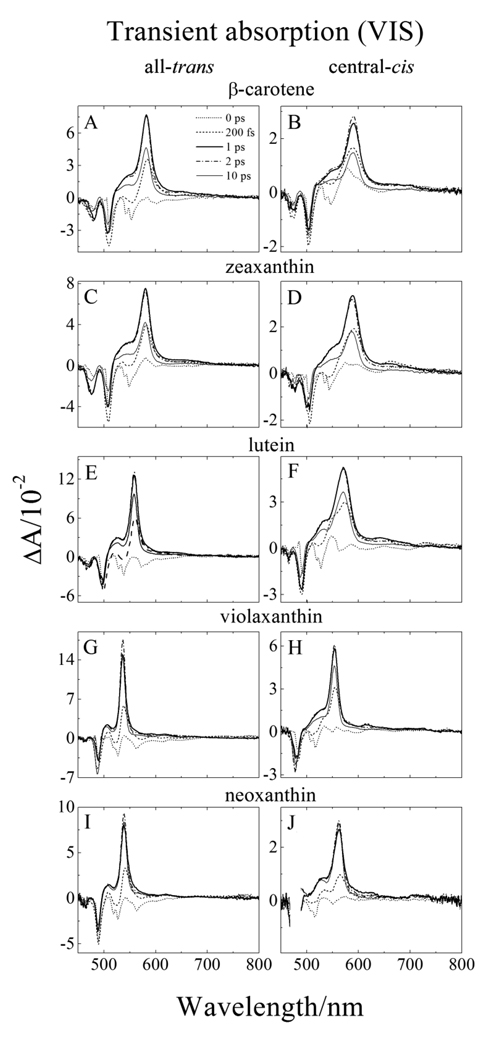
Transient absorption (TA) spectra recorded at 77 K in 2-MTHF at various delay times after the excitation pulse are shown in Fig. 4. At the earliest delay time (0 ps, dotted lines in Fig. 4) within the time resolution of the instrument, the TA spectra display a set of negative bands in the region between 450 and 650 nm. These spectral features correspond to a combination of bleaching of the S0 (11Ag −) → S2 (11Bu +) ground state absorption and stimulated emission from the S2 (11Bu +) state. Within 200 fs (dashed lines in Fig. 4) the build-up of a major TA band associated with the S1 (21Ag −) → Sn transition is beginning to show. In 1–2 ps (dark solid and dashed dotted lines in Fig. 4) this band has reached its maximum amplitude. From the spectra shown in Fig. 4 it is apparent that the position of this major TA band shifts to shorter wavelength with decreasing n. In addition, this TA band is significantly narrower for violaxanthin and neoxanthin whose π-electron chain does not extend into the terminal β-ionylidene rings; e.g. compare the dark solid line for β-carotene (Fig. 4A) with that from violaxanthin (Fig 4G). The wavelengths corresponding to the maximum TA of this band are given in Table 1.
Fig. 4.
Transient absorption spectra in the visible (VIS) spectra region of: (A) all-trans-β-carotene; (B) central-cis-β-carotene; (C) all-trans-zeaxanthin; (D) central-cis-zeaxanthin; (E) all-trans-lutein; (F) central-cis-lutein; (G) all-trans-violaxanthin; (H) central-cis-violaxanthin; (I) all-trans-neoxanthin, and (J) central-cis-neoxanthin, taken at various delay times after excitation. The spectra were recorded at 77 K in 2-MTHF.
In comparing the TA spectra of the central-cis isomers to those of the all-trans molecules, one can see similar characteristics and trends. However, in all cases the TA spectra of the central-cis isomers are broader, shifted to longer wavelength, and have relatively more intensity on the short wavelength (blue) side of the major TA band compared to the all-trans configurations. The difference between the positions of the major S1 (21Ag −) → Sn TA bands of the cis isomers relative to the trans isomers increases with decreasing n (Table 1) reaching a maximum of 24 nm for neoxanthin (Table 1). In addition, small bands located ~60 nm to longer wavelength of the major TA band are evident. These bands are more pronounced for the central-cis isomers than for the all-trans molecules. (See e.g. Figs. 4C and D).
3.4. Global fitting analysis of the transient absorption datasets in the visible region
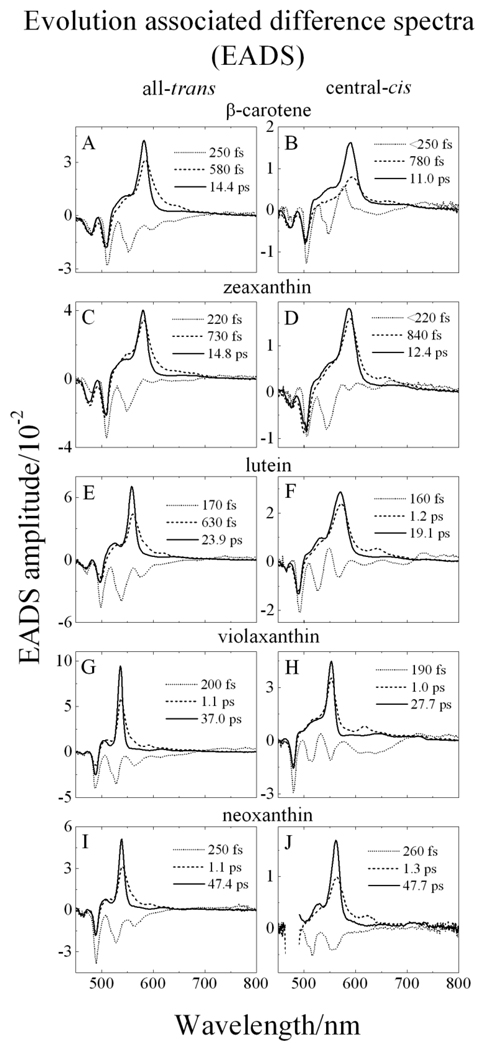
Global fitting of the visible region TA datasets shown in Fig. 4 was performed using a kinetic model corresponding to a sequential deactivation pathway of the excited states of the photo-excited molecules. The results obtained from this type of fitting are termed evolution associated difference spectra (EADS) [54] and are shown in Fig. 5. For all the molecules, three EADS components were sufficient to obtain a satisfactory fit based on singular value decomposition (SVD) and minimization of the residual matrix. The fastest kinetic component has a time constant ranging from 160 to 260 fs and contains a number of negative bands in the 450 to 650 nm range. As mentioned above, these are attributable to a combination of bleaching of the steady-state S0 (11Ag −) → S2 (11Bu +) absorption bands and stimulated emission from the S2 (11Bu +) state. A second EADS component falls in the range of 580 fs to 1.3 ps, and due to the fact that its lineshape is broad and narrows as it evolves into a third EADS component, it is assigned to vibrationally non-equilibrated S1 (11Ag +) excited state as previously reported for a number of carotenoids [18,40,47,55–57].
Fig. 5.
Global fitting results using an sequential decay model (EADS) of the transient absorption datasets of (A) all-trans-β-carotene; (B) central-cis-β-carotene; (C) all-trans-zeaxanthin; (D) central-cis-zeaxanthin; (E) all-trans-lutein; (F) central-cis-lutein; (G) alltrans-violaxanthin; (H) central-cis-violaxanthin; (I) all-trans-neoxanthin, and (J) central-cis-neoxanthin.
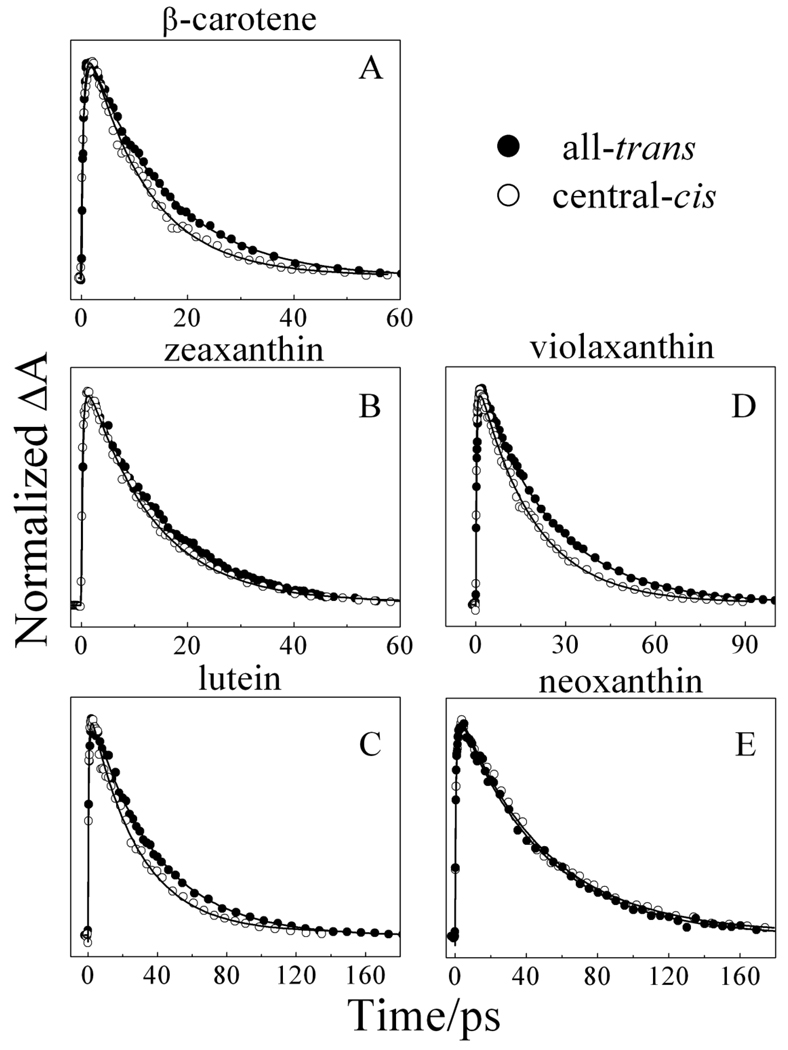
The third and final EADS component for all the molecules displays a spectral profile typical of a transition from a vibrationally relaxed S1 (21Ag −) state to a higher Sn excited state. The time constant of this component is in good agreement with the S1 (21Ag −) lifetimes of the all-trans isomers reported previously. (See Table 2.) The central-cis isomers of all the molecules except neoxanthin have consistently shorter S1 (21Ag −) lifetimes than their all-trans counterparts in agreement with a previous report on open-chain carotenoids [18]. The central-cis and all-trans isomers of neoxanthin have the same S1 (21Ag −) lifetimes within experimental error. The difference in the S1 (21Ag −) lifetimes between the central-cis and all-trans isomers of the other molecules is clearly evident in the TA temporal profiles shown in Fig. 6 which overlays the kinetic traces from each pair of isomers taken at the maximum of their S1 (21Ag −) → Sn TA bands. It can be seen clearly in the figure that in all cases except neoxanthin, the S1 (21Ag −) state lifetime of the central-cis isomer is shorter than that of the corresponding all-trans isomer. Upon closer inspection of the spectral profiles of the third EADS components (Fig. S1), additional small bands are seen at longer wavelength of the major band that are distinct from those evident in the second EADS traces. These are attributable to excited state TA between S1 (21Ag −) and a low-lying singlet state and will be discussed below.
Table 2.
Energies and lifetimes of the S1 (21Ag −) excited states of geometric isomers of xanthophylls and β-carotene.
| Carotenoi d |
τ1a (ps) |
S1 (21Ag−) energy (cm−1)b |
Solvent | T (K) |
Ref. |
|---|---|---|---|---|---|
| all-trans-β-carotene | |||||
| 14.4 ± 0.8 | 13,900 ± 40 | 2-MTHF | 77 | this work | |
| 9.2 – 9.5 | n.d.c | pyridine | RT | [40] | |
| 7.9 – 10.0 | n.d. | 3-methyl- pentane |
RT | [79] | |
| 12.4 | n.d. | n-hexane | RT | [71] | |
| 8.9 – 9.7 | n.d. | n-hexane | RT | [47] | |
| 9.9 | n.d. | n-hexane | RT | [80] | |
| 8.2 – 9.1 | n.d. |
n-hexane benzene |
RT | [81] | |
| 14,500d | n-hexane | 170 | [82] | ||
| 14,200 ± 500d | toluene CS2 |
RT | [70] | ||
| central-cis-β-carotene | |||||
| 11.0 ± 0.5 | 14,100 ± 30 | 2-MTHF | 77 | this work | |
| 8.4 – 8.6 | n.d. | n-hexane | RT | [47] | |
| 14.0 ± 0.5 | n.d. | n-hexane | RT | [71] | |
| all-trans-zeaxanthin | |||||
| 14.8 ± 1.0 | 13,950 ± 30 | 2-MTHF | 77 | this work | |
| 9.1 – 9.2 | 14,030 ± 90 | methanol | RT | [61] | |
| 11 | 13,850 ± 300 | LHCII | RT | [64] | |
| 14.5 ± 0.1 | n.d. | EPA | 77 | [83] | |
| 10.2 ± 0.1 | n.d. | pyridine | RT | [40] | |
| 9.0 | n.d. | n-hexane | RT | [84] | |
| 9.0 – 9.6 | n.d |
n-hexane methanol |
RT | [56] | |
| 9.0 – 9.8 | n.d. | methanol | RT | [85] | |
| 9.0 | n.d | methanol | RT | [86] | |
| 9.3 | n.d. | ethanol | RT | [87] | |
| 14,550d | n-hexane | RT | [88] | ||
| 14,610d | EPAe | 77 | [89] | ||
| central-cis-zeaxanthin | |||||
| 12.4 ± 1.0 | 14,240 ± 40 | 2-MTHF | 77 | this work | |
| all-trans-lutein | |||||
| 23.9 ± 0.1 | 14,300 ± 30 | 2-MTHF | 77 | this work | |
| 19.7 ± 0.1 | n.d. | EPA | 77 | [83] | |
| 15.6 | n.d. | pyridine | RT | [83] | |
| 15.6 – 15.8 | n.d. | pyridine | RT | [40] | |
| 15.0 | n.d. | methanol | RT | [86] | |
| 11.0 | 14,050 | LHCII | RT | [64] | |
| central-cis-lutein | |||||
| 19.1 ± 0.1 | 14,730 ± 20 | 2-MTHF | 77 | this work | |
| all-trans-violaxanthin | |||||
| 37.0 ± 3.0 | 14,650 ± 20 | 2-MTHF | 77 | this work | |
| 24.6 – 25.3 | 14,470 ± 90 | methanol | RT | [61] | |
| 11 | 13,700 ± 300 | LHCII | RT | [64] | |
| 23.9 | n.d. | n-hexane | RT | [84] | |
| 33.5 ± 0.1 | n.d. | EPA | 77 | [83] | |
| 15,580 ± 60d | EPA | 77 | [89] | ||
| 14,880 ± 90d | n-hexane | RT | [88] | ||
| central-cis-violaxanthin | |||||
| 27.7 ± 1.0 | 14,980 ± 30 | 2-MTHF | 77 | this work | |
| all-trans-neoxanthin | |||||
| 47.4 ± 1.6 | 14,850 ± 30 | 2-MTHF | 77 | this work | |
| 37.6 ± 0.1 | n.d. | pyridine | RT | [40] | |
| 35 ± 2 | n.d. |
n-hexane methanol |
RT | [90] | |
| central-cis-neoxanthin | |||||
| 47.7 ± 2.0 | 15,500 ± 30 | 2-MTHF | 77 | this work | |
| 9’-cis-neoxanthin | |||||
| 53.0 ± 2.0 | 15,100 ± 50 | 2-MTHF | 77 | this work | |
Lifetime of the S1 (21Ag −) excited state;
The value of the S1 (21Ag−) excited state energy determined from a TA experiment probing directly the S1−S2 transition unless otherwise noted;
not determined;
The S1 (21Ag −) excited state energy determined from steady-state fluorescence;
EPA is diethyl ether/isopentane/ethanol, 5/5/2, v/v/v.
Fig. 6.
Kinetic traces taken at the maximum of the S1→Sn transient absorption peaks of all-trans and central-cis molecules recorded at 77 K in 2-MTHF. The kinetics were normalized for better visualization of the trend.
3.5. Transient absorption spectroscopy in the NIR
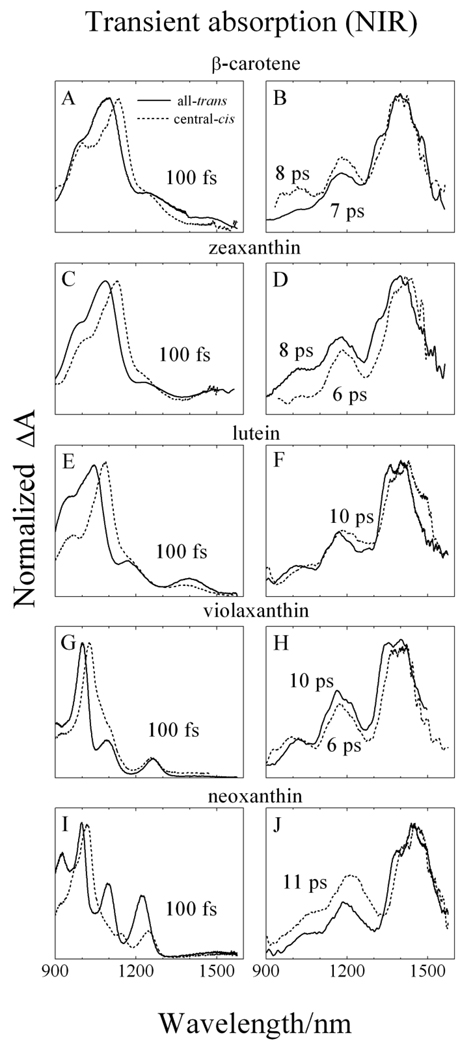
Transient absorption spectra of the central-cis- and all-trans- molecules in the near infrared (NIR) region are shown in Fig. 7. The NIR TA datasets are displayed in two time regimes: Initial TA spectral features taken at a delay time of 100 fs and subsequent TA bands taken between 6–11 ps. The TA spectra taken at 100 fs are shown on the left hand side of Fig. 7 and correspond to an excited state having a lifetime of ~200 fs (fitting not shown) similar to the lifetime of the S2 (11Bu +) excited state obtained from global fitting of the TA datasets in the visible region (Fig. 5). Thus, these initial spectral profiles are attributed to the S2 (11Bu +) → Sn transition. Also, these S2 (11Bu +) → Sn TA profiles taken at 100 fs show multiple bands which are less well-resolved for the longer molecules. Upon decreasing n; i.e. in going from β-carotene to neoxanthin, the TA peaks sharpen and shift to shorter wavelength. In all cases for these initial NIR TA features, the major band for the central-cis isomers appears 20–30 nm to longer wavelength than that of the all-trans molecules. For neoxanthin only, the smaller peaks appearing at longer wavelengths for the central-cis isomer are significantly less intense than those observed for the all-trans molecule.
Fig. 7.
Transient absorption spectra in the near infrared (NIR) spectral region of all-trans (solid lines) and central-cis (dashed lines) isomers of: (A and B) β-carotene; (C and D) zeaxanthin; (E and F) lutein; (G and H) violaxanthin and (I and J) neoxanthin. The delay times corresponding to when the spectra were taken are indicated in the figure. The spectra were recorded at 77 K in 2-MTHF.
Transient NIR absorption spectra taken at delay times between 6 and 11 ps after the S2 (11Bu +) → Sn TA has fully disappeared, are shown on the right hand side of Fig. 7. These spectra exhibit three distinct vibronic bands at ~1000, ~1200 and ~1400 nm for both isomeric configurations. These spectral profiles are known to be associated with TA from a vibronically relaxed S1 (21Ag −) state to the S2 (11Bu +) state and can be used to determine precise values of the S1 state energies [18,58–65].
3.6. Determination of the S1 (21Ag −) energies of the isomers
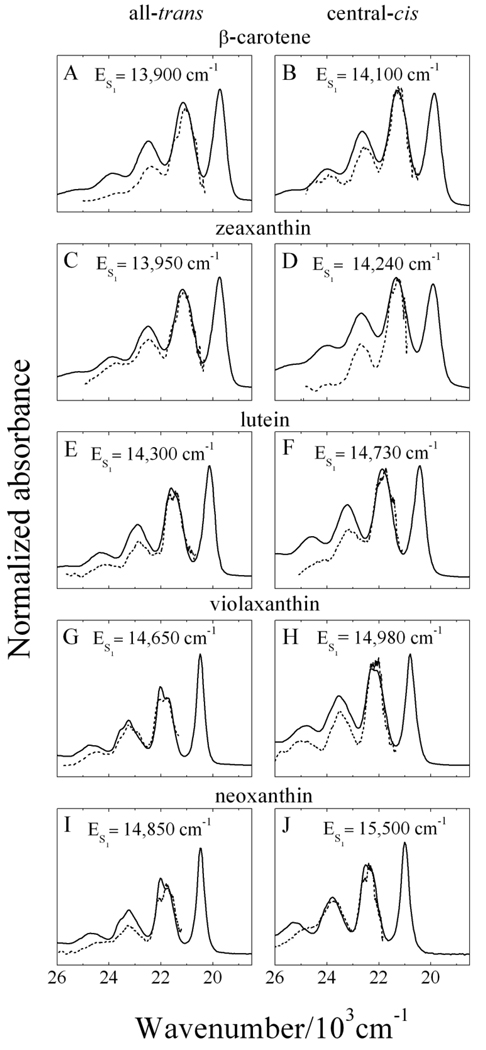
Figure 8 overlays the steady-state S0 (11Ag −) → S2 (11Bu +) absorption spectra (solid lines) from Fig. 3 with the S1 (21Ag −) → S2 (11Bu +) NIR transient absorption profiles (dashed lines) from Fig. 7 plotted on a wavenumber scale and shifted to give agreement between the spectral traces. The shift in energy required to bring the spectra into coincidence corresponds to the energy of the S1 (21Ag −) state of the molecules. The numbers indicate that the central-cis isomers have consistently higher S1 (21Ag −) energies by 200–650 cm−1 than the all-trans isomers. The values for the S1 (21Ag −) energies are displayed in Fig. 8 and listed in Table 2. The same experiments were carried out on 9’-cis-neoxanthin, the results of which are displayed in Fig. S2.
Fig. 8.
The S1 (21Ag −) → S2 (11Bu +) NIR transient absorption spectra (dashed lines) from Fig. 7 shifted in energy to give agreement with the steady-state absorption spectra (solid lines) from Fig. 3 plotted on a wavenumber scale. The magnitude of the shift of the S1 (21Ag −) → S2 (11Bu +) NIR spectra to bring the lineshapes into coincidence determines the energy of the S1 (21Ag −) state for each carotenoid isomer. These values are indicated in the figure and in Table 1.
4. Discussion
4.1. Steady-state absorption
Figure 3 shows that for all the molecules examined here, the absorption spectra of the central-cis isomers are blue-shifted by a few nanometers relative to the all-trans isomers (see Table 1). This is due to a decrease in the effective π-electron conjugation chain length which results in an increase in the S2 (11Bu +) energy for the cis-isomers compared the all-trans molecules. Also seen in Fig. 3 is the fact that the steady-state absorption spectra of the geometric isomers taken at 77 K show a substantially higher level of vibronic resolution compared to the RT spectra (Fig. 2). Vibronic bands in the absorption spectra of carotenoids are characterized by combinations of fully symmetric carbon-carbon single and double bond stretching modes having frequencies of ~1200 and ~1600 cm−1 that decrease with increasing conjugation [66,67]. In the 77 K absorption spectra of the all-trans isomers (Fig. 3), all of the molecules have their Franck-Condon maximum intensity associated with the lowest energy (0-0) band. This indicates that a relatively small geometry change accompanies the S0 (11Ag −) → S2 (11Bu +) transition. However, a closer inspection reveals that ratio of the intensity of the (0–1) to the (0-0) vibronic band increases with increasing n; e.g. for neoxanthin (n=9) the ratio is 0.7, for lutein (n=10) it is 0.8, and for β-carotene (n=11), it is ~0.9. This suggests that there is a shift in the minimum of the potential energy surface of the S2 (11Bu +) state relative to the ground S0 (11Ag −) state as the extent of π-electron conjugation gets longer. A similar effect is observed for the central-cis isomers although the progression is much faster; i.e. the ratio is 0.8 for neoxanthin (n=9), and rises rapidly to 0.97 for lutein (n=10), and then to 1.0 for β-carotene.
4.2. Transient absorption spectroscopy
Dynamics of the S1 (21Ag −) state
The lifetime of the S1 (21Ag −) excited state of carotenoids can be rationalized using the weak coupling limit form of the energy gap law for radiationless transitions which is applicable if the vibrational frequencies of the accepting modes, ħωM, are comparable to the depth, EM, of the minima in the potential energy surfaces corresponding to the S1 (21Ag −) and S0 (11Ag −) states [68]. In addition, the reduced displacement, ΔM, should be small compared to the energy gap ΔE between them [69]. Under these conditions the nonradiative decay rate, knrad, from S1 (21Ag −) to S0 (11Ag −) can be described by
| (1) |
or in logarithmic notation by
| (2) |
where C is the vibronic coupling matrix element, m is the number of degenerate or nearly degenerate modes of the frequency ωM, and ℏωM is the energy of the accepting vibrational modes. It has been reported previously that the dominant energy accepting mode for the nonradiative decay from the S1 (21Ag −) state of carotenoids is 1600 cm−1 [69,70]. For such a value, for ΔE between 12,000 and 16,000 cm−1 which includes the range of the S1 − S0 energy gaps spanned by the present molecules. Under these conditions, equation (2) reduces to
| (3) |
where
| (4) |
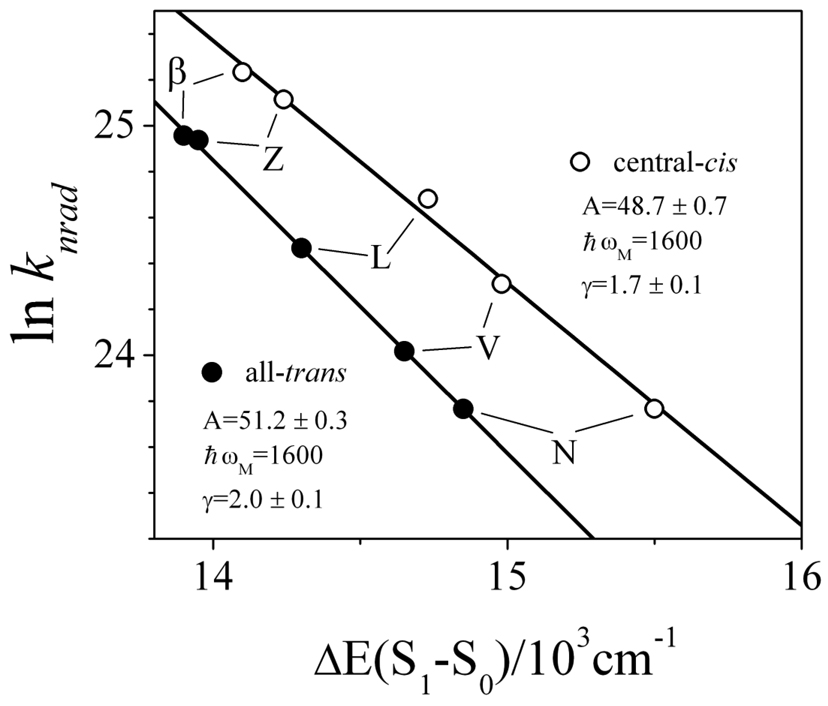
Figure 9 shows that central-cis and all-trans isomers require different sets of parameters to account for the data according to the energy gap law. In particular, the value of γ must be decreased from 2.0 for the all-trans isomers to 1.7 to obtain a good fit to the data for the central-cis isomers. Given that the cis isomers have uniformly larger S1 − S0 energy gaps (ΔE in Eq. 4) compared to the all-trans isomers, the smaller γ value for the central-cis isomers must mean that their S1 (21Ag −) potential energy surfaces have a larger displacement than the all-trans isomers. In addition, a slightly smaller A parameter is needed to fit the data from the central-cis isomers compared to the all-trans molecules. This suggests that the vibronic coupling between the S1 (21Ag −) and S0 (11Ag −) states is stronger for the all-trans molecules. However, because nonradiative decay of the S1 (21Ag −) state is faster for all the central-cis isomers (except neoxanthin) compared to the corresponding trans isomers despite the fact that the S1 (21Ag −) energies of the cis isomers are higher than the trans isomers, the values of the parameters suggest that it is not vibronic coupling that plays the most important role in controlling knrad of the S1 (21Ag −) state for these molecules. Rather, the reduced displacement, ΔM, appears to be more essential, but these are not the only contributing factors. Previous quantum theoretical calculations on a linear, n=9, polyene chromophore [18] indicate that electronic coupling is significantly higher for the cis isomer, and when combined with the Franck-Condon factors predict knrad values approximately double those of the all-trans species. These electronic effects were reported to more than compensate for the decrease in coupling efficiencies associated with the higher system origin energies of the cis isomers compared to the all-trans configurations, which explained the observed shorter cis isomer lifetimes for carotenoids. It is very likely that the same rationale holds true for the xanthophylls studied here. However, neoxanthin exhibits no effect of isomer geometry on its S1 (21Ag −) lifetime. This may occur if the various factors offset each other; i.e. the knrad value for the cis isomer should be smaller due to its 650 cm−1 larger S1 − S0 energy gap compared to the trans isomer, but because of enhanced vibronic or electronic coupling, or a favorable displacement of the S1 potential energy surface relative to that of the S0 state, an equivalent increase in knrad for the cis isomer compared to the trans isomer may occur and compensate.
Fig. 9.
The results of fitting Eq. 3 to the knrad values for all-trans- and central-cis-β-carotene (β) and xanthophylls, zeaxanthin (Z), lutein (L), violaxanthin (V) and neoxanthin (N). The A, ℏωM and γ values derived from the fitting are indicated.
Origin of the minor long wavelength bands in the TA spectra and EADS profiles
A close inspection of the wavelength profiles of the second and third EADS components reveal small bands at longer wavelength compared to the major band. (See Figure S1.) The minor longer wavelength bands appearing in the second EADS traces sharpen upon shortening the conjugation, but have a constant amount of energy separation (1,730 ± 40 cm−1 for the all-trans isomers and 1,890 ± 50 cm−1 for the central-cis isomers) from their corresponding major TA bands. This suggests that these minor bands derive from transitions originating from a specific, hot vibronic level of S1 (21Ag −) corresponding to a carbon-carbon double bond stretching frequency expected to be in this energy range [71–74]. This assignment is the same as one we made for similar bands observed in the second EADS traces from a series of open-chain carotenoids [18,57]. In addition, the distinct peaks occurring in the third EADS components of the open-chain molecules were assigned to TA from the S1 (21Ag −) to the S3 (11Ag +) excited state; i.e. to a transient “cis-peak” [18,57]. The present observations on the xanthophylls can be similarly assigned. The energies of the (0-0) and (0–1) vibronic bands of the cis-peaks in the UV region of the steady-state absorption spectra (from Fig. 3) are given in Table 3. To improve the reliability of the determination in the cases of β-carotene, zeaxanthin and lutein, the energies were obtained by Gaussian deconvolution which was not necessary for violaxanthin and neoxanthin because for these molecules the cis-peaks are so well-resolved (Fig. 3). The sum of the energies of the small long wavelength features evident in the third EADS traces with the S1 excited state energies (Fig. 8) are also given in Table 3. The fact that the summed energies fall very close to the energies of the (0-0) and (0–1) cis-peak energies derived from the steady-state absorption spectra shown in Fig. 3 supports the argument that the small long wavelength bands seen in the third EADS components correspond to S1 (21Ag −) → S3 (11Ag +) transitions.
Table 3.
The energies of the (0-0) and (0–1) vibronic bands of the cis-peak, S0 (11Ag −) → S3 (11Ag +) transition, in the UV region of the steady-state absorption spectra. Also given are the energies of the small long wavelength bands in the third EADS components summed with the S1 (21Ag −) energies of the central-cis isomers of the xanthophylls and β-carotene. All values are given in cm−1.
| molecule | cis-peak energies | 3rd EADS peaks + S1 (21Ag−) energies |
||
|---|---|---|---|---|
| (0-0) | (0–1) | (0-0) | (0–1) | |
| central-cis-β-carotene | 27,880 | 29,170 | n.e.a | 28,600 |
| central-cis-zeaxanthin | 28,320 | 29,440 | n.e. | 28,970 |
| central-cis-lutein | 28,880 | 30,280 | 28,240 | 29,830 |
| central-cis-violaxanthin | 29,540 | 31,070 | 29,020 | 30,490 |
| central-cis-neoxanthin | 29,660 | 30,910 | 29,490 | 30,880 |
not evident
Role of the xanthophylls in LHCII
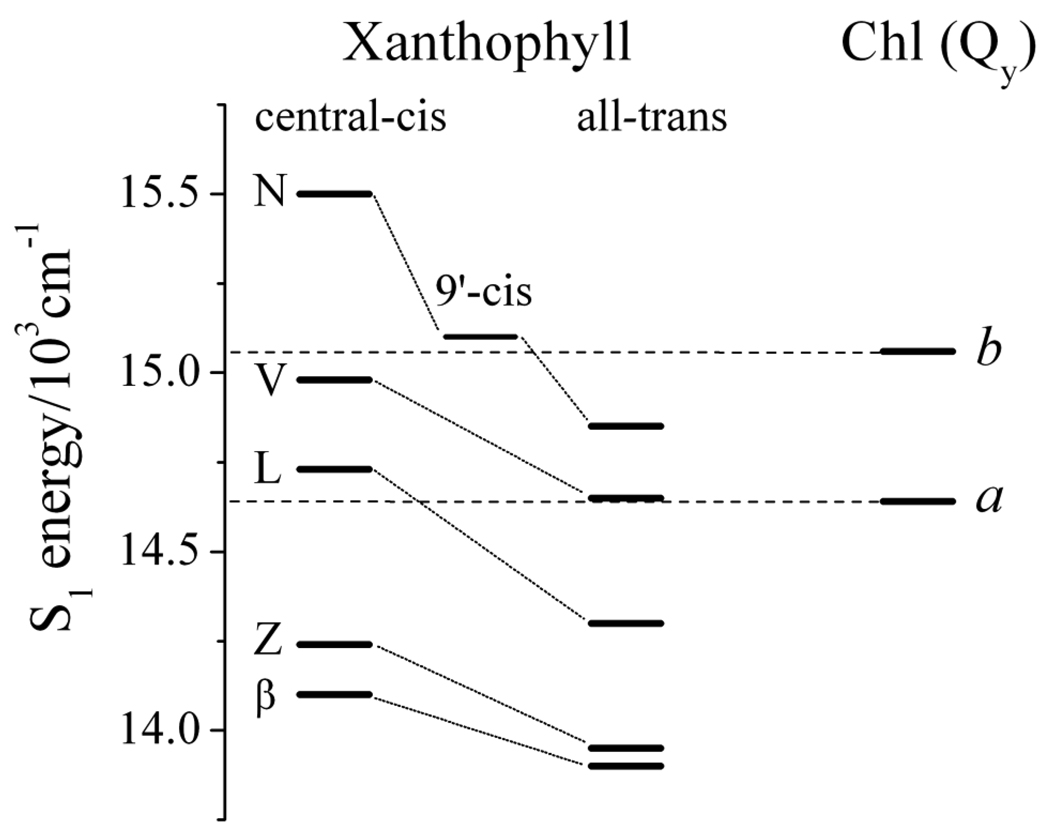
Figure 10 shows the positions of the S1 (21Ag −) states of the central-cis and all-trans isomers of the xanthophylls and the Qy transitions of Chl a (at 683 nm) and Chl b (at 664 nm) [75]. The figure shows that the S1 (21Ag −) state energy of all-trans-neoxanthin is higher than the energy of the Qy transition of Chl a, but lower than that of Chl b. However, the LHCII complex contains neoxanthin in a 9’-cis geometric configuration. Hence, we performed spectroscopic experiments on this isomer as well. (See Fig. S2.) The measurements displayed in Fig. S2F reveal the S1 energy of 9’-cis-neoxanthin to be significantly below that of central-cis-neoxanthin, nearly isoenergetic with the S1 energy of Chl b, and higher than the S1 energy of Chl a. The energy of the S1 (21Ag −) state of all-trans-violaxanthin is nearly degenerate with that of the Qy transition of Chl a, but significantly below that of Chl b. Whereas the S1 (21Ag −) state of central-cis-lutein appears higher than that of Chl a, the S1 (21Ag −) state energies of all-trans-lutein, central-cis- and all-trans-zeaxanthin, and central-cis- and all-trans-β-carotene lie significantly lower than the S1 states of both Chls a and b. Therefore, from an energy level standpoint, the data suggest that neoxanthin in its native 9’-cis geometric configuration is capable of transferring energy to Chl b, whereas all-trans violaxanthin in its native all-trans configuration in the LHCII complex is not. However, both 9’-cis-neoxanthin and all-trans-violaxanthin have S1 (21Ag −) energies high enough to be able to donate energy to Chl a. This observation is consistent with the spatial distribution of the pigments in LHCII, where three of the four closest Chl molecules to violaxanthin are Chl a. These are Chl a 611 (Chl 7), Chl a 613 (Chl 3), Chl a 614 (Chl 8) with Chl-to-carotenoid, π-system edge distances of 6.7 Å, 6.7 Å and 7.3 Å, respectively. [20,76]. Two of the three closest Chl molecules to 9’-cis-neoxanthin are Chl b. These are Chl b 606 (Chl 13) and Chl b 608 (Chl 11) at distances of 3.9 Å and 4.7 Å, respectively. All-trans-lutein and all-trans-zeaxanthin have S1 (21Ag −) energies below the S1 states of Chl a and b suggesting a lesser role for these molecules in singlet energy transfer, at least via the route that involves the S1 (21Ag −) state. Instead, energy transfer via the S2 (11Bu +) state may be the more important avenue for light-harvesting involving these molecules. This conclusion is consistent with the report by Polivka et al [64] who measured the S1 (21Ag −) lifetime of lutein to be 11 ps at room temperature in an LHCII complex reconstituted solely with that xanthophyll in the L1 and L2 positions. Comparing this result to the value of 15 ps they obtained for the S1 (21Ag −) lifetime of lutein in methanol at room temperature indicated that the S1 → (Chl a) Qy channel of energy transfer is not very efficient. These studies are also in agreement with the report by Croce et al [77] on the minor CP29 light-harvesting complex where it was concluded that lutein transfers energy primarily from the S2 (11Bu +) state (80%) with only small contributions (10% each) from vibronically hot and relaxed S1 (21Ag −). Moreover, Gradinaru et al. [78] reported 80% total energy transfer from lutein to Chl in native LHCII with 60–65% of the transfer occurring via the S2 (11Bu +) route and 15–20% occurring via S1 (21Ag −). Taken together, the data may suggest a greater potential for all-trans-lutein and all-trans-zeaxanthin to carry out nonphotochemical quenching compared to all-trans-violaxanthin and 9’-cis-neoxanthin which, owing to their higher lying S1 (21Ag −) states, are apparently more adept at light-harvesting.
Fig. 10.
The S1 (21Ag −) state energies of central-cis and all-trans isomers of β-carotene (β), zeaxanthin (Z), lutein (L), violaxanthin (V) and neoxanthin (N) and 9’-cis neoxanthin on the same scale as the Qy transition energies of Chl a (683 nm) and Chl b (664 nm) in LHCII [75].
Supplementary Material
Acknowledgements
This work has been supported by grants from the National Science Foundation (MCB-0913022) and the University of Connecticut Research Foundation.
Footnotes
Publisher's Disclaimer: This is a PDF file of an unedited manuscript that has been accepted for publication. As a service to our customers we are providing this early version of the manuscript. The manuscript will undergo copyediting, typesetting, and review of the resulting proof before it is published in its final citable form. Please note that during the production process errors may be discovered which could affect the content, and all legal disclaimers that apply to the journal pertain.
References
- 1.Isler O, Carotenoids, Birkhauser, Basel 1971 [Google Scholar]
- 2.Frank HA, Young AJ, Britton G, Cogdell RJ. In: Advances in Photosynthesis. Govindjee, editor. Dordrecht: Kluwer Academic Publishers; 1999. [Google Scholar]
- 3.Britton G. In: Carotenoids. Britton G, Liaaen-Jensen S, Pfander H, editors. Basel: Birkhäuser Verlag; 1995. pp. 13–62. [Google Scholar]
- 4.Hudson B, Kohler B. Ann. Rev. Phys. Chem. 1974;25:437–460. [Google Scholar]
- 5.Hudson BS, Kohler BE, Schulten K. In: Excited States. Lim ED, editor. New York: Academic Press; 1982. pp. 1–95. [Google Scholar]
- 6.Birge RR. Accts Chem. Res. 1986;19:138–146. [Google Scholar]
- 7.Zechmeister L. Cis-trans isomeric carotenoids, vitamin A, and arylpolyenes. New York: Academic Press; 1962. [Google Scholar]
- 8.Dale J. Acta Chem.Scand. 1954;8:1235–1256. [Google Scholar]
- 9.Kohler BE. In: Carotenoids. Britton G, Liaaen-Jensen S, Pfander H, editors. Basel: Birkhäuser Verlag AG; 1995. pp. 3–12. [Google Scholar]
- 10.Yeates TO, Komiya H, Chirino A, Rees DC, Allen JP, Feher G. Proc. Natl. Acad. Sci. USA. 1988;85:7993–7997. doi: 10.1073/pnas.85.21.7993. [DOI] [PMC free article] [PubMed] [Google Scholar]
- 11.Deisenhofer J, Michel H. Annu. Rev. Biophys. Biophys. Chem. 1991;20:247–266. doi: 10.1146/annurev.bb.20.060191.001335. [DOI] [PubMed] [Google Scholar]
- 12.McDermott G, Prince SM, Freer AA, Hawthornthwaite-Lawless AM, Papiz MZ, Cogdell RJ, Isaacs NW. Nature (London) 1995;374:517–521. [Google Scholar]
- 13.Jordan P, Fromme P, Witt HT, Klukas O, Seanger W, Krauss N. Nature. 2001;411:909–917. doi: 10.1038/35082000. [DOI] [PubMed] [Google Scholar]
- 14.Koyama Y, Takatsuka I, Kanaji M, Tomimoto K, Kito M, Shimamura T, Yamashita J, Saiki K, Tsukida K. Photochem. Photobiol. 1990;51:119–128. [Google Scholar]
- 15.Kuki M, Naruse M, Kakuno T, Koyama Y. Photochem. Photobiol. 1995;62:502–508. [Google Scholar]
- 16.Bautista JA, Chynwat V, Cua A, Jansen FJ, Lugtenburg J, Gosztola D, Wasielewski MR, Frank HA. Photosyn. Res. 1998;55:49–65. [Google Scholar]
- 17.Pendon ZD, Hoef Ivd, Lugtenburg J, Frank HA. Photosynth. Res. 2006;88:51–61. doi: 10.1007/s11120-005-9026-8. [DOI] [PubMed] [Google Scholar]
- 18.Niedzwiedzki DM, Sandberg DJ, Cong H, Sandberg MN, Gibson GN, Birge RR, Frank HA. Chem. Phys. 2009;357:4–16. doi: 10.1016/j.chemphys.2008.07.011. [DOI] [PMC free article] [PubMed] [Google Scholar]
- 19.Hashimoto H, Koyama Y. J. Phys. Chem. 1988;92:2101–2108. [Google Scholar]
- 20.Standfuss J, van Scheltinga ACT, Lamborghini M, Külbrandt W. EMBO Journal. 2005;24:919–928. doi: 10.1038/sj.emboj.7600585. [DOI] [PMC free article] [PubMed] [Google Scholar]
- 21.Gilmore AM. Physiol. Plant. 1997;99:197–209. [Google Scholar]
- 22.Gilmore AM, Hazlett TL, Govindjee Proc. Natl. Acad. Sci. USA. 1995;92 doi: 10.1073/pnas.92.6.2273. [DOI] [PMC free article] [PubMed] [Google Scholar]
- 23.Horton P, Ruban AV. Photosynth. Res. 1992;34:375–385. doi: 10.1007/BF00029812. [DOI] [PubMed] [Google Scholar]
- 24.Pfündel E, Bilger W. Photosynth. Res. 1994;42:89–109. doi: 10.1007/BF02187121. [DOI] [PubMed] [Google Scholar]
- 25.Holt NE, Fleming GR, Niyogi KK. Biochem. 2004;43:8281–8289. doi: 10.1021/bi0494020. [DOI] [PubMed] [Google Scholar]
- 26.Demmig B, Winter K, Kruger A, Czygan F-C. Plant Physiol. 1987;84:218–224. doi: 10.1104/pp.84.2.218. [DOI] [PMC free article] [PubMed] [Google Scholar]
- 27.Demmig-Adams B. Biochim. Biophys. Acta. 1990;1020:1–24. [Google Scholar]
- 28.Demmig-Adams B, Adams WW., III . In: Carotenoids in Photosynthesis. Young AJ, Britton G, editors. London: Chapman and Hall; 1993. pp. 206–251. [Google Scholar]
- 29.Demmig-Adams B, Adams WW. Trends Plant Sci. 1996;1:21–26. [Google Scholar]
- 30.Demmig-Adams B. Photosynth. Res. 2006;76:73–80. doi: 10.1023/A:1024902927403. [DOI] [PubMed] [Google Scholar]
- 31.Horton P, Ruban AV, Walters RG. Annu. Rev. Plant Physiol. Mol. Biol. 1996;47:655–684. doi: 10.1146/annurev.arplant.47.1.655. [DOI] [PubMed] [Google Scholar]
- 32.Müller P, Li X-P, Niyogi KK. Plant Physiol. 2001;125:1588–1566. doi: 10.1104/pp.125.4.1558. [DOI] [PMC free article] [PubMed] [Google Scholar]
- 33.Li X-P, Björkman O, Shih C, Grossman AR, Rosenquist M, Jansson S, Niyogi KK. Nature. 2000;403:391–395. doi: 10.1038/35000131. [DOI] [PubMed] [Google Scholar]
- 34.Li X-P, Müller-Moule P, Gilmore AM, Niyogi KK. Proc. Natl. Acad. Sci. 2002;99:15222–15227. doi: 10.1073/pnas.232447699. [DOI] [PMC free article] [PubMed] [Google Scholar]
- 35.Li X-P, Phippard A, Pasari J, Niyogi K. Funct. Plant Biol. 2002;29:1131–1139. doi: 10.1071/FP02065. [DOI] [PubMed] [Google Scholar]
- 36.Ruban AV, Phillip D, Young AJ, Horton P. Photochem. Photobiol. 1998;68:829–834. [Google Scholar]
- 37.Ruban AV, Pascal A, Lee PJ, Robert B, Horton P. J. Biol. Chem. 2002;277:42937–42942. doi: 10.1074/jbc.M207823200. [DOI] [PubMed] [Google Scholar]
- 38.Pascal AA, Liu Z, Broess K, van Oort B, van Amerongen H, Wang C, Horton P, Robert B, Chang W, Ruban AV. Nature. 2005;436:134–137. doi: 10.1038/nature03795. [DOI] [PubMed] [Google Scholar]
- 39.Ruban AV, Berera R, Ilioaia C, van Stokkum IHM, Kennis JTM, Pascal AA, van Amerongen H, Robert B, Horton P, van Grondelle R. Nature. 2007;450:575–579. doi: 10.1038/nature06262. [DOI] [PubMed] [Google Scholar]
- 40.Niedzwiedzki DM, Sullivan JO, Polivka T, Birge RR, Frank HA. J. Phys. Chem. B. 2006;110:22872–22885. doi: 10.1021/jp0622738. [DOI] [PubMed] [Google Scholar]
- 41.Ilagan RP, Christensen RL, Chapp TW, Gibson GN, Pascher T, Polivka T, Frank HA. J. Phys. Chem. A. 2005;109:3120–3127. doi: 10.1021/jp0444161. [DOI] [PubMed] [Google Scholar]
- 42.Chatterjee N, Niedzwiedzki DM, Kajikawa T, Hasegawa S, Katsumura S, Frank HA. Chem. Phys. Lett. 2008;463:219–224. doi: 10.1016/j.cplett.2008.08.056. [DOI] [PMC free article] [PubMed] [Google Scholar]
- 43.Koyama Y, Kanaji M, Shimamura T. Photochem. Photobiol. 1988;48:107–114. [Google Scholar]
- 44.Koyama Y. In: Carotenoids: Chemistry and Biology. Krinsky NI, editor. New York: Plenum Press; 1990. pp. 207–222. [Google Scholar]
- 45.Jiang Y-S, Kurimoto Y, Shimamura T, Ko-Chi N, Ohashi N, Mukai Y, Koyama Y. Biospectroscopy. 1996;2:47–58. [Google Scholar]
- 46.Koyama Y, Fujii R. In: The Photochemistry of Carotenoids. Frank HA, Young AJ, Britton G, Cogdell RJ, editors. Dordrecht: Kluwer Academic Publishers; 1999. pp. 161–188. [Google Scholar]
- 47.Pendon ZD, Gibson GN, van der Hoef I, Lugtenburg J, Frank HA. J. Phys. Chem.B. 2005;109:21172–21179. doi: 10.1021/jp0529117. [DOI] [PubMed] [Google Scholar]
- 48.Milanowska J, Gruszecki WI. Journal of Photochemistry and Photobiology B-Biology. 2005;80:178–186. doi: 10.1016/j.jphotobiol.2005.05.004. [DOI] [PubMed] [Google Scholar]
- 49.Niedzwiedzki D, Gruszecki WI. Colloid Surf. B-Biointerfaces. 2003;28:27–38. [Google Scholar]
- 50.Krawczyk S, Jazurek B, Luchowski R, Wiacek D. Chem. Phys. 2006;326:465–470. [Google Scholar]
- 51.Melendez-Martinez AJ, Britton G, Vicario IM, Heredia FJ. Food Chem. 2008;107:49–54. [Google Scholar]
- 52.Melendez-Martinez AJ, Vicario IM, Heredia FJ. Food Chem. 2007;104:169–175. [Google Scholar]
- 53.Aman R, Biehl J, Carle R, Conrad J, Beifuss U, Schieber A. Food Chem. 2005;92:753–763. [Google Scholar]
- 54.van Stokkum IHM, Larsen DS, van Grondelle R. Biochim. Biophys. Acta. 2004;1657:82–104. doi: 10.1016/j.bbabio.2004.04.011. [DOI] [PubMed] [Google Scholar]
- 55.de Weerd FL, van Stokkum IHM, van Grondelle R. Chem. Phys. Lett. 2002;354:38–43. [Google Scholar]
- 56.Billsten HH, Zigmantas D, Sundström V, Polívka T. Chem. Phys. Lett. 2002;355:465–470. [Google Scholar]
- 57.Niedzwiedzki D, Koscielecki JF, Cong H, Sullivan JO, Gibson GN, Birge RR, Frank HA. J. Phys. Chem. B. 2007;111:5984–5998. doi: 10.1021/jp070500f. [DOI] [PubMed] [Google Scholar]
- 58.Zigmantas D, Polivka T, Hiller RG, Yartsev A, Sundström V. J. Phys. Chem. A. 2001;105:10296–10306. [Google Scholar]
- 59.Zigmantas D, Hiller RG, Sharples FP, Frank HA, Sundstrom V, Polivka T. Phys. Chem. Chem. Phys. 2004;6:3009–3016. [Google Scholar]
- 60.Papagiannakis E, van Stokkum IHM, van Grondelle R. J. Phys. Chem. B. 2003;107:11216–11223. [Google Scholar]
- 61.Polívka T, Herek JL, Zigmantas D, Akerlund HE, Sundström V. Proc. Nat. Acad. Sci. U.S.A. 1999;96:4914–4917. doi: 10.1073/pnas.96.9.4914. [DOI] [PMC free article] [PubMed] [Google Scholar]
- 62.Billstein HH, Herek JL, Garcia-Asua G, Hashoj L, Hunter CN, Sundstrom V. Biochem. 2002;41:4127–4136. doi: 10.1021/bi011741v. [DOI] [PubMed] [Google Scholar]
- 63.Polívka T, Zigmantas D, Herek JL, He Z, Pascher T, Pullerits T, Cogdell RJ, Frank HA, Sundström V. J. Phys. Chem. B. 2002;106:11016–11025. [Google Scholar]
- 64.Polívka T, Zigmantas D, Sundström V, Formaggio E, Cinque G, Bassi R. Biochem. 2002;41:439–450. doi: 10.1021/bi011589x. [DOI] [PubMed] [Google Scholar]
- 65.Cong H, Niedzwiedzki D, Gibson GN, LaFountain AM, Kelsh RM, Gardiner AT, Cogdell RJ, Frank HA. J. Phys. Chem. B. 2008;112:10689–10703. doi: 10.1021/jp711946w. [DOI] [PMC free article] [PubMed] [Google Scholar]
- 66.Christensen RL. In: The Photochemistry of Carotenoids. Frank HA, Young AJ, Britton G, Cogdell RJ, editors. Dordrecht: Kluwer Academic Publishers; 1999. pp. 137–159. [Google Scholar]
- 67.Christensen RL, Barney EA, Broene RD, Galinato MGI, Frank HA. Arch. Biochem. Biophys. 2004;430:30–36. doi: 10.1016/j.abb.2004.02.026. [DOI] [PubMed] [Google Scholar]
- 68.Englman R, Jortner J. Mol. Phys. 1970;18:145–164. [Google Scholar]
- 69.Chynwat V, Frank HA. Chem. Phys. 1995;194:237–244. [Google Scholar]
- 70.Andersson PO, Bachilo SM, Chen R-L, Gillbro T. J. Phys. Chem. 1995;99:16199–16209. [Google Scholar]
- 71.Hashimoto H, Koyama Y, Hirata Y, Mataga N. J. Phys. Chem. 1991;95:3072–3076. [Google Scholar]
- 72.Hashimoto H, Koyama Y. Chem. Phys. Lett. 1989;154:321–325. [Google Scholar]
- 73.Kohler BE, Spangler C, Westerfield C. J. Chem. Phys. 1988;89:5422–5428. [Google Scholar]
- 74.Simpson JH, McLaughlin L, Smith DS, Christensen RL. J. Chem. Phys. 1987;87:3360–3365. [Google Scholar]
- 75.Polívka T, Sundström V. Chem. Rev. 2004;104:2021–2071. doi: 10.1021/cr020674n. [DOI] [PubMed] [Google Scholar]
- 76.Liu ZF, Yan HC, Wang KB, Kuang TY, Zhang JP, Gui LL, An XM, Chang WR. Nature. 2004;428:287–292. doi: 10.1038/nature02373. [DOI] [PubMed] [Google Scholar]
- 77.Croce R, Muller MG, Caffari S, Bassi R, Holzwarth AR. Biophys. J. 2003;84:2517–2532. doi: 10.1016/S0006-3495(03)75057-7. [DOI] [PMC free article] [PubMed] [Google Scholar]
- 78.Gradinaru CC, Stokkum IHMV, Pascal AA, van Grondelle R, Amerongen HV. J. Phys. Chem. B. 2000;104:9330–9342. [Google Scholar]
- 79.Wasielewski MR, Johnson DG, Bradford EG, Kispert LD. J. Chem. Phys. 1989;91:6691–6697. [Google Scholar]
- 80.Nagae H, Kuki M, Zhang JP, Sashima T, Mukai Y, Koyama Y. J. Phys. Chem. A. 2000;104:4155–4166. [Google Scholar]
- 81.Kosumi D, Komukai M, Hashimoto H, Yoshizawa M. Phys. Rev. Lett. 2005;95:213601–213604. doi: 10.1103/PhysRevLett.95.213601. [DOI] [PubMed] [Google Scholar]
- 82.Onaka K, Fujii R, Nagae H, Kuki M, Koyama Y, Watanabe Y. Chem. Phys. Lett. 1999;315:75–81. [Google Scholar]
- 83.Cong H, Niedzwiedzki DM, Gibson GN, Frank HA. J. Phys. Chem. B. 2008;112:3558–3567. doi: 10.1021/jp0763681. [DOI] [PubMed] [Google Scholar]
- 84.Frank HA, Cua A, Chynwat V, Young A, Gosztola D, Wasielewski MR. Photosynth. Res. 1994;41:389–395. doi: 10.1007/BF02183041. [DOI] [PubMed] [Google Scholar]
- 85.Billsten HH, Pan J, Sinha S, Pascher T, Sundström V, Polívka T. J. Phys. Chem. A. 2005;109:6852–6859. doi: 10.1021/jp052227s. [DOI] [PubMed] [Google Scholar]
- 86.Billsten HH, Bhosale P, Yemelyanov A, Bernstein PS, Polivka T. Photochem. Photobiol. 2003;78:138–145. doi: 10.1562/0031-8655(2003)078<0138:ppoxic>2.0.co;2. [DOI] [PubMed] [Google Scholar]
- 87.Billsten HH, Sundström V, Polívka T. J. Phys. Chem. A. 2005;109:1521–1529. doi: 10.1021/jp044847j. [DOI] [PubMed] [Google Scholar]
- 88.Frank HA, Bautista JA, Josue JS, Young AJ. Biochem. 2000;39:2831–2837. doi: 10.1021/bi9924664. [DOI] [PubMed] [Google Scholar]
- 89.Josue JS, Frank HA. J. Phys. Chem. A. 2002;106:4815–4824. [Google Scholar]
- 90.Frank HA, Bautista JA, Josue J, Pendon Z, Hiller RG, Sharples FP, Gosztola D, Wasielewski MR. J. Phys. Chem. B. 2000;104:4569–4577. [Google Scholar]
Associated Data
This section collects any data citations, data availability statements, or supplementary materials included in this article.


