

Abstract
We present the use of an alternating current (AC) signal as a means to monitor the conductance of an α-hemolysin (αHL) pore as a DNA hairpin with a polydeoxyadenosine tail is driven into and released from the pore. Specifically, a 12 base pair DNA hairpin attached to a 50-nucleotide poly-A tail (HP-A50) is threaded into an αHL channel using a DC driving voltage. Once the HP-A50 molecule is trapped within the αHL channel, the DC driving voltage is turned off and the conductance of the channel is monitored using an AC voltage. The escape time, defined as the time it takes the HP-A50 molecule to transport out of the αHL channel, is then measured. This escape time has been monitored as a function of AC amplitude (20 to 250 mVac), AC frequency (60–200 kHz), DC drive voltage (0 to 100 mVdc), and temperature (−10 to 20 °C), in order to determine their effect on the predominantly diffusive motion of the DNA through the nanopore. The applied AC voltage used to monitor the conductance of the nanopore has been found to play a significant role in the DNA/nanopore interaction. The experimental results are described by a one-dimensional asymmetric periodic potential model that includes the influence of the AC voltage. An activation enthalpy barrier of 1.74 × 10⁻¹⁹ J and a periodic potential asymmetry parameter of 0.575 are obtained for the diffusion at zero electrical bias of a single nucleotide through αHL.
Introduction
The use of both biological and synthetic nanopores for the direct sequencing of biopolymers has received much interest from the scientific community.1-7 Specifically, the exotoxin α-hemolysin (αHL) which spontaneously forms stable heptameric pores within planar lipid bilayers has been used to analyze DNA segments at the single-molecule level.1-6,8-15 Typically, in these experiments a direct current (DC) voltage is used to electrophoretically drive negatively charged single-stranded DNA (ssDNA) into and through the nanopore while simultaneously monitoring the conductance of the nanopore. As the biopolymer translocates through the nanopore, it decreases the conductance of the nanopore, due to volume exclusion, and produces a measurable reduction in ionic current flowing through the nanopore. The duration of the translocation event yields quantitative information about the polymer/pore interaction. Recently, there has been increasing evidence that this interaction is dependent on both the polymer/pore orientation and the applied voltage.12,14,16,17 Here we investigate the use of AC bias to probe diffusive transport of a biopolymer within a nanopore.
In 2000, Henrickson et al., demonstrated that a biotin/streptavidin-capped ss-DNA molecule could be driven into an αHL pore and trapped at voltages below −70 mV.18 Following this work Mathé et al., recently devised an experiment to measure the voltage free diffusion of a DNA hairpin containing a polydeoxyadenosine (poly-A) tail as it escapes from an αHL pore.12 In their experiment the DNA hairpin is initially driven into the αHL channel using a DC drive voltage (120 mVdc). The ssDNA tail of the hairpin is driven through the nanopore until the larger hairpin prevents further motion. Once the ssDNA tail of the hairpin has been captured within the pore, it is released by turning off the DC drive voltage. A short time later, between 100 and 10,000 μs, the DC bias is turned back on in order to probe the conductance of the pore and determine the probability of the ssDNA tail remaining within the constriction of the protein pore. Using the general formalism derived by Lubensky and Nelson,19 which describes the one-dimensional motion of a homopolymer translocating through a narrow pore (with which it has a strong interaction), Mathé et al. were able to determine the bias-free diffusion constant for DNA escaping out of an αHL pore. Motivated by the work of Mathé et al., the theoretical analysis provided by Lubensky and Nelson, and an examination of asymmetric potentials on DNA translocation provided by Lua and Grosberg,20 we examined the escape time of a DNA molecule, out of an αHL pore, using an alternating current (AC) probing signal.
The use of an AC measurement has significant potential advantages in comparison to the conventional DC measurement. Combining an AC probing signal with a DC drive voltage provides the capability to separate the electric field used to produce the probing current from the electric field used to drive the biomolecule into and through the nanopore.21 This combination offers the potential benefit that a high-amplitude AC signal (i.e., > 150 mVac) can be used to monitor the conductance of the pore, significantly increasing the signal-to-noise ratio (SNR) of the measurement over conventional DC measurements (120 mVdc). In addition, an AC bias is expected to place a lower net driving force on a charged biomolecule, in comparison to that of a DC signal. Indeed, because an AC electrical field with zero offset is alternately driving the biomolecule into and then out of the nanopore over a single cycle, the AC electric field effect on driven translocation is substantially decreased relative to a constant driving force produced by a DC electric field.
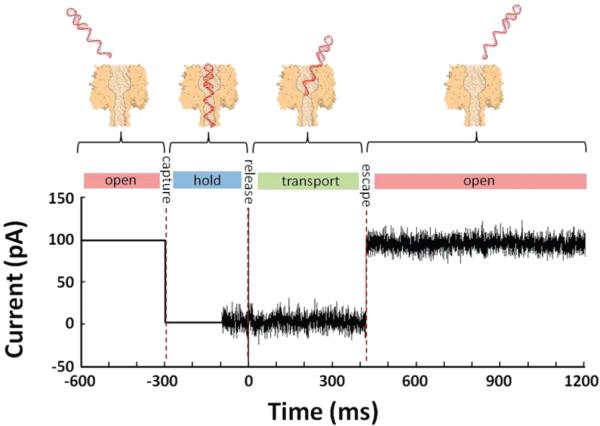
Figure 1 depicts the experimental procedure by which a DC drive voltage is used to capture a DNA molecule within a nanopore while an AC probing signal is used to monitor the conductance of the nanopore once the hairpin is released. Initially, the αHL pore is in an open (unblocked) state, and the DC drive voltage (Vdc) (120 mVdc) drives the DNA molecule into the αHL pore. Once the ssDNA tail has been driven into the pore and captured, as determined by a drop in DC current (idc), the AC probing voltage (Vac) is turned on in order to monitor the conductance of the αHL pore. A short holding time later (th) Vdc is turned off and the DNA molecule is allowed to escape out of the pore. The escape time (tesc), defined as the time it takes from when Vdc is turned off to the time when the DNA molecule leaves the pore, is measured by a step increase in the AC current (iac). This technique allows the escape time of the DNA to be measured in the absence of a DC bias. In addition, instead of setting Vdc to zero, Vdc can be set to a positive or negative value in order to determine the effect of a DC drive bias on the escape times of the DNA molecule.
Figure 1.

(A) Illustration of the capture and subsequent release of a DNA hairpin molecule, by an αHL pore. (B) Time line of the DC drive voltage (Vdc), AC probing signal (Vac), and their associated current responses (idc and iac, respectively) for the DNA capture and release measurement. Initially, only Vdc is on, which drives the DNA hairpin molecule into the αHL pore. Once the DNA hairpin is captured, Vac is turned on and Vdc is turned off, allowing the DNA hairpin to escape from the αHL pore, as indicated by the jump increase in iac.
The escape times of the DNA molecule have been measured as a function of AC bias, temperature, DC bias, and AC frequency. By determining the effect of these parameters, we have been able to obtain a clearer picture of the dynamic polymer/pore interaction. Following the theoretical analysis provided by Lubensky and Nelson,19 our results are consistent with a one-dimensional asymmetric periodic potential model, across which the DNA molecule diffuses in order to escape the pore. In order to exit the αHL pore, the trapped HP-A50 molecule must be thermally activated over the potential barrier presented by the asymmetric periodic potential. A DC bias added to the asymmetric periodic potential serves to tilt the periodic potential up or down, driving the biomolecule into or out of the pore, respectively. By introducing the AC probing signal to oscillate the tilt of the periodic potential, we have determined the asymmetry factor (α) which describes the spatial asymmetry of DNA moving through the pore.
Experimental Section
Chemicals and Materials
NaCl (Alpha Aesar), Tris (Sigma), HCl (Alpha Aesar), and EDTA (Sigma) were used as received. Wild-type α-hemolysin (αHL) (lyophilized powder, monomer) (Aldrich) was used as received. 1,2-Diphytanoyl-sn-glycero-3-phosphocholine (DPhPC) (Avanti) was obtained in powdered form and diluted to a concentration of 10 mg/mL in decane (Aldrich). All solutions were prepared using H2O (18 MΩ·cm) from a Barnstead E-pure water purification system.
PAGE-purified DNA (5′-GGGTCAGCTTGCTTTTGCAAGCTGACCC-A50-3′) (HP-A50) (Sigma-Genosys), was obtained at 100 μM in 10 mM Tris (pH 8.5), 1 mM EDTA. Before each experiment, the HP-A50 solution was heated to 95 °C in a water bath for 10 min, and allowed to cool to 8 °C for 20 min.
Glass Nanopore Membranes and Bilayer Formation
The fabrication of the glass nanopore membrane (GNM), which consists of a single conical nanopore embedded in a thin glass membrane, has previously been reported.21-24 Briefly, the GNM is fabricated by flame sealing the tip (~25–75 μm) of an electrochemically sharpened Pt wire into the end of a glass capillary using a H2 torch. The sealed end of the glass capillary is then polished until a Pt electrode of desired diameter is exposed. The Pt nanodisk is electrochemically etched in a CaCl2 solution, which loosens the sealed Pt inside the glass. The remaining Pt is physically removed from the glass leaving a single conical-shaped nanopore.
Prior to application as a support platform for lipid bilayers, the surface of the GNMs are chemically modified with 3-cyanopropyldimethylchlorosilane (Gelest, Inc.).24 This surface modification allows the deposition of a lipid monolayer on the glass surface in which the lipid hydrophobic alkyl chain tails are oriented in a tails-down configuration. Following surface modification with 3-cyanopropyldimethylchlorosilane, the GNM is filled with 3.0 M NaCl, 10 mM Tris-HCl (pH 7.2), 1.0 mM EDTA. A Ag/AgCl electrode, prepared by oxidizing a 0.25-mm diameter Ag wire in bleach (Clorox) for ~30 min, is placed inside the glass capillary. The capillary is then inserted into a pipet holder (Dagan) that is connected toa5mLgas tight syringe (Hamilton) and a pressure gauge (Fisher). The syringe and pressure gauge are used to control the pressure across the suspended bilayer during ion-channel recordings, as previously described.21,24
The glass capillary is horizontally mounted into a small (~175 μL volume) custom polycarbonate cell, which contains a second Ag/AgCl electrode. The cell is then filled with 3.0 M NaCl, 10 mM Tris-HCl (pH 7.2), 1.0 mM EDTA, so that the height of the electrolyte solution lies above the GNM surface. Bilayers were formed using the painting method as previously described.21,24 Successful lipid bilayer formation was indicated by the formation of a 50–100 GΩ seal, measured between the two Ag/AgCl electrodes. After bilayer formation, αHL and the DNA hairpin were both added to the cell (outside of the GNM) to a final concentration of ~0.5 μM and ~1.0 μM, respectively.
Alternating Current Capture and Release Measurement
The custom instrumentation and apparatus used in the AC DNA hairpin capture and release measurement are depicted in Figure 2. A desktop computer (Dell) is used to control an AC source (National Instruments PCI-6289) producing a bias between a Ag/AgCl electrode outside the GNM and a second Ag/AgCl electrode, which is held at virtual ground inside the GNM. The capacitive current associated with the shunt capacitance of the GNM and bilayer (~1.5 pF) is 50 to 500 nA, depending on the AC source amplitude. To cancel this high current, the AC source is inverted, amplified, and summed at the input of the amplifier through a cancellation capacitance of about 0.25 pF. By adjusting the amplitude and phase of the cancellation signal, the measured AC current can be reduced by over 80 dB or a factor of 10,000. The analog cancellation of the capacitive current reduces the dynamic range requirements of the data acquisition system sufficiently to allow for the use of off-the-shelf data acquisition cards. This instrumentation configuration allows a high-amplitude (up to 500 mVac) high-frequency (up to 250 kHz) AC signal to be monitored. All data were collected at an AC source frequency of 100 kHz except where noted. After band-pass filtering the amplifier output at the AC frequency with a bandwidth of 100 kHz, the signal is digitized (National Instruments PCI-6132) at 800 kHz, digitally demodulated with the simultaneously acquired source AC signal, phase adjusted to separate the in-phase (resistive) and quadrature (capacitive) components, and finally sampled at the AC frequency. The resulting signal has an effective bandwidth of 50 kHz due to the quadrature detection method. The resistive component of the current is of primary interest as it measures the conductance of the αHL pore, and thus, all analysis is performed on this component of the measured signal. For control purposes, the system also measures the DC current, albeit at a bandwidth under 100 Hz. Customized software in National Instruments’ LabVIEW is employed for all system control, data acquisition, and signal processing described above.
Figure 2.

Schematic diagram of the instrumentation used in the AC + DC DNA hairpin capture and release experiment.
In the experiments presented within, the αHL pore conductance is monitored as the 3′ end of the HP-A50 molecule is threaded into the αHL pore from the cis side. Initially, the AC voltage is turned off, and a 120 mV DC bias is used to drive the DNA molecule into the αHL pore. Capture of the DNA molecule is indicated by a decrease in the measured DC current. The AC voltage is turned on 100–250 ms after the DNA molecule has been captured, and the AC current is monitored as shown in Figure 3. Following an additional 100 ms, the DC drive voltage is set to zero, and the DNA molecule is allowed to escape out of the cis side of the pore. The precise moment of escape is measured in the AC current signal as an abrupt increase in current, as shown in the example iac vs t trace presented in Figure 3. Approximately 2 s after the DNA molecule has escaped, the AC voltage is turned off, and the DC drive voltage is again turned on, in order to repeat the measurement cycle. This procedure is computer controlled, allowing thousands of DNA capture and release cycles. In some experiments, after capturing the DNA molecule and turning on the AC probing voltage, the DC drive voltage is set to a positive value in order to drive the DNA molecule out of the αHL pore at an increased rate. The temperature of the system is controlled down to −15 °C using a Neslab RTE 740 refrigerated bath (Thermo Scientific) and custom heat exchanger. Tests were done to verify that the measured temperatures, monitored via a thermocouple inside the Faraday cage, were equal to that of the bath temperature. All reported temperatures have an error of 2 °C. Data analysis was performed using Igor Pro 6 (WaveMetrics).
Figure 3.
Representative plot of iac as a function of time, depicting the capture and subsequent release of the of the HP-A50 molecule by an αHL pore. The HP-A50 molecule is initially drawn into the αHL pore using a DC bias of −120 mV. Once the hairpin is captured, it is held within the αHL pore for ~200 ms before the AC signal (150 mVac for this data) is turned on. Approximately 100 ms later, the DC bias is set to 0 V, allowing the DNA molecule to escape from the αHL pore. The sharp dual directional spike, seen at t = 0 ms, corresponds to the time at which the DC signal is turned off. This data was collected at 0 °C.
Results and Discussion
Lubensky and Nelson have presented a theoretical description of the one-dimensional motion of a biopolymer translocating through a biological pore, assuming a strong interaction between the pore and biopolymer.19 They argued that, as long as the motion of the polymer backbone was sufficiently slow relative to the other degrees of freedom, then motion in the x-coordinate (along the length of the αHL pore) was the only dynamic variable associated with DNA translocation. The remaining degrees of freedom could be described by the free energy of the biopolymer G(x), which includes the contributions associated with the electrostatic interactions between the biopolymer and the pore.
By simplifying the problem in such a manner, Lubensky and Nelson were able to describe the diffusion of the DNA molecule using the Smoluchowski equation. They proposed a sawtooth periodic potential model in which the minimum of the periodic potential had been shifted by the asymmetry factor, α. This asymmetry parameter has a large effect on polymer translocation time because the time required to move over the energy barrier, either into or out of the pore, depends exponentially on the energy barrier height. If the asymmetric potential is tilted up or down in the presence of a driving force, the potential energy barrier in the forward and reverse direction can be significantly different, resulting in different mean drift speeds for the polymer in the forward and reverse direction.
In presenting our results, we first describe the motion of DNA as it escapes from the αHL pore. Initially, the single stranded tail of the HP-A50 molecule is driven into the αHL pore, up to the hairpin, and is captured. The DNA molecule is modeled as a single particle that must be thermally activated to overcome a potential energy barrier in order to take a single step out of or into the pore. Once the HP-A50 molecule is captured in the pore, in order to escape it must take N more steps in the direction out of the pore than it takes into the pore. If the molecule is driven all the way into the pore, N will be equal to the number of nucleotides in the tail, but N could be somewhat less than this if the hairpin prevents the last few nucleotides from entering the constriction. Each one of these steps will be over an energy barrier from one minimum of the asymmetric periodic potential to the neighboring minimum, where the periodicity of the asymmetric periodic potential, defined as the distance (L) between the two minimas, is equal to the base-to-base spacing of the ssDNA tail. We note that this model explicitly includes the possibility that the DNA will take steps back into the pore, in opposition to the driven motion. Any attempt to sequence DNA based on the driven diffusion of DNA through a pore must take this possibility into account.
A schematic of the asymmetric periodic potential that the HP-A50 molecule must overcome in order to move into or out of the αHL pore is presented in Figure 4; a sinusoidal potential is simply used for illustration purposes, and other asymmetric potentials, such as a sawtooth potential, could have also been chosen. This schematic shows the case of an asymmetric periodic potential, α = 0.7 (solid line), compared to a symmetric potential, α = 0.5 (dotted line), in the presence of different bias levels (500 mVdc, 0, and −500 mVdc). An asymmetry parameter of 1 would push the minima in the 0 bias potential left to the point where the minima and maxima occur at the same location. The intermediate asymmetry parameter of 0.7 pushes the minima left by ~40% of the distance to the maxima. A DC bias serves to tilt the asymmetric periodic potential either up or down.
Figure 4.

Schematic representation of the one-dimensional asymmetric periodic potential model (α = 0.7) in the presence of a +500, 0, and −500 mVdc bias, as labeled. The asymmetric periodic potential is shown by the solid line while a symmetric periodic potential is shown by the gray dashed line. a0 and a1 refer to the energy barrier height into the pore (toward the left) and out of the pore (toward the right) in the presence of a −500 mVdc bias, respectively. b0/b1 and c0/c1 have analogous meanings at 0 and 500 mVdc bias.
We have found that by using an AC probing signal to repeatedly tilt the asymmetric periodic potential between the up and down states, we are able to map out the structure of the asymmetric periodic potential by determining the height of the activation energy barrier and the asymmetry parameter associated with a polydeoxyadenosine escaping out of the cis side of an αHL pore. As the asymmetric periodic potential is tilted up and down, the energy barrier into or out of the pore is different. Indeed, in cases where α > 0.5, the energy barrier to escape out of the pore when the asymmetric periodic potential is tilted down (c1) is less than the energy barrier to insert into the pore when the potential is tilted up (a0). Likewise, if α < 0.5, the energy barrier to escape out of the pore, when the asymmetric periodic potential is tilted down, should be greater than the energy barrier to insert into the pore when the potential is tilted up.
We will first introduce our experimental results before outlining the theory of combining an asymmetric periodic potential model with an AC probing signal. The mean escape time of the HP-A50 molecule out of the αHL pore is shown to be a function of AC amplitude, DC amplitude, and temperature, in agreement with theoretical predictions.
AC Effect
Histograms of escape times were constructed by capturing and releasing several hundred HP-A50 molecules. Figure 5 shows three representative histograms of HP-A50 escape times at zero bias, plotted on a semi-logarithmic axis. The escape times were monitored using a 100 kHz AC probing signal with peak amplitudes of 50 mVac, 100 mVac, and 150 mVac, as labeled. These data were collected at 20 °C. The mean escape times in our experiments span 4 orders of magnitude, so we have used log binning to construct our histograms and fit to the theoretical distribution.25
Figure 5.

Time distributions of the HP-A50 molecule escaping from an αHL pore using 50, 100, and 150 mV AC signals, as labeled. Each histogram was constructed from a few hundred events. Each distribution was fit to a one-dimensional periodic potential model described by eq 1. These data were recorded at a temperature of 20 °C.
As seen in Figure 5, increasing the AC monitoring signal amplitude significantly decreases the escape times of the HP-A50 molecule. The mean escape time for each data set in Figure 5 was determined by fitting the theoretical probability distribution of escape times, Ψ(t), developed by Lubensky and Nelson to the experimental histograms.19
| (1) |
In eq 1, ν is the drift velocity of the polymer, D is the diffusion coefficient, t is time, L is the length of the polymer. With ν and D determined by the best fit of eq 1 to the histograms, the mean escape time of the HP-A50 molecule is given by:
| (2) |
As depicted in Figure 5, an increase in the applied AC probing signal amplitude results in shortened mean escape times for the HP-A50 molecule. The mean escape times for the HP-A50 molecule are 7.8 ± 0.5, 3.5 ± 0.5, and 1.7 ± 0.2 ms at 50, 100, and 150 mVac, respectively. These were calculated from best fit drift velocities of (1.51 ± 0.1) × 10−4, (4.7 ± 1.0) × 10−4, and (10.2 ± 1.2) × 10−4 cm/s, respectively; and diffusion constants of (1.51 ± 0.34) × 10−10, (2.33 ± 0.35) × 10−10, and (3.35 ± 0.32) × 10−10 cm2/s, respectively.
In addition to AC amplitude, the mean escape time of the HP-A50 molecule is also a function of temperature. The mean escape time of the HP-A50 molecule, as a function of applied AC bias (peak) at 20, 10, 0, and −10 °C, is depicted in Figure 6. Each value of tesc along with its respective standard deviation was determined by collecting several hundred escape events using a minimum of three different αHL pores and reformed bilayers.
Figure 6.
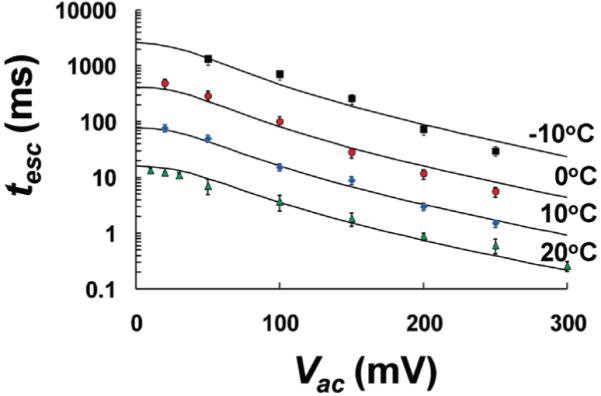
The mean time required for HP-A50 to escape from the αHL pore, as a function of applied AC amplitude (peak height) at four different temperatures (−10, 0, 10, and 20 °C). The solid lines correspond to best fits, using the one-dimensional asymmetric periodic potential model described by eq 5.
As depicted in Figure 6, an increase in AC amplitude results in shorter escape times. Although the AC signal, which is centered at zero, is positive over half of each cycle and negative over the other half of each cycle, the net driving force clearly does not average to zero. At low AC amplitudes (< 30 mVac) the influence of the AC electric field appears to be very weak, while larger applied AC levels produce a marked reduction in the escape time. Escape times can be increased by decreasing the temperature of the system. A 10 °C decrease in temperature results in almost an order-of-magnitude increase in mean escape time. However, a decrease in temperature also results in lower electrolyte conductivity, thus a lower signal-to-noise raio (SNR), and a larger error in escape times.
The extrapolated escape times of HP-A50 at zero AC from Figure 6 can be used to determine the zero-bias diffusion coefficient of HP-A50 as a function of temperature. The diffusion coefficient was determined from a model-based extrapolation to zero Vac, depicted in Figure 6, as detailed below. Diffusion coefficients were calculated from the one-dimensional diffusion equation, L2 = 2Dtesc, where L, the length of HP-A50 tail, is equal to 20 nm, assuming the length of a single nucleotide is 0.4 nm.21,26,27 If we also extrapolate to 15 °C, we obtain a diffusion constant of 0.57 × 10⁻¹⁰ cm2/s, about a factor of 3 lower than the 1.8 × 10⁻¹⁰ cm2/s obtained by Mathé et al.12,13 This difference may be due, in part, to Mathé’s experiments being performed in 1 M KCl, whereas the experiments described within were performed in a more viscous 3 M NaCl, solution.
Figure 7 depicts the natural log of the HP-A50 diffusion coefficient, as it escapes from the cis side of the αHL channel, as a function of inverse temperature. The Arrhenius plot closely follows a straight line with a slope equal to −Ea/kB, (Ea is the Arrhenius activation energy barrier for thermally activated diffusion, and kB is Boltzman’s constant), and an intercept equal to the natural log of the pre-exponential factor. Based on a linear best fit in Figure 7, an Arrhenius energy barrier of 1.78 × 10⁻¹⁹ J must be overcome in order for the HP-A50 molecule to either move one step out of or one step into the αHL pore, in the absence of an applied bias.
Figure 7.

Natural log of the HP-A50 diffusion coefficient within the αHL pore, plotted as a function of inverse temperature. Diffusion coefficients were determined from the extrapolated bias free escape times, determined from the data shown in Figure 5.
DC Effect
The applied DC drive voltage has a large effect on the escape time of the negatively charged HP-A50 molecule. For example, by applying a negative DC drive voltage, the HP-A50 molecule can be driven into and held within the αHL pore. Conversely, a positive DC voltage can be used to drive the HP-A50 molecule out of the pore, after it has been captured. The escape times of the HP-A50 molecule as a function of DC bias and at a fixed temperature of 0 °C are presented in Figure 8. These escape times are monitored using a 100 kHz AC probing signal with a peak height of 50, 150, and 250 mVac, as labeled. The solid lines associated with each data set, correspond to the best fits, using the one-dimensional asymmetric periodic potential model described below.
Figure 8.
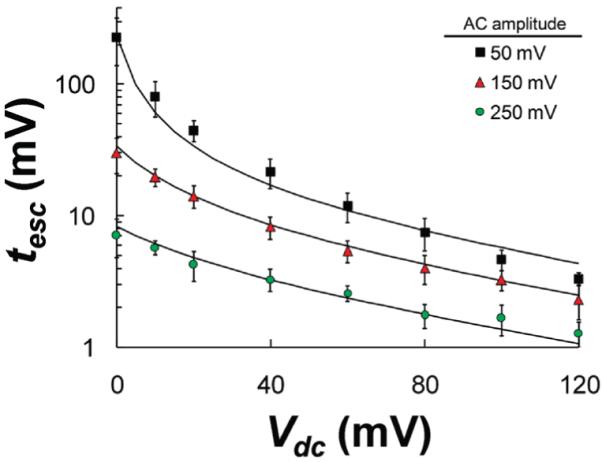
Mean escape time for HP-A50 to escape from the αHL pore, as a function of applied DC bias at three different AC amplitudes (50 mV, 150 mV, 250 mV) and at a temperature of 0 °C. The solid lines correspond to best fits, using the one-dimensional asymmetric periodic potential model described by eq 5.
As expected, the escape times become shorter as the DC voltage used to drive the captured HP-A50 molecule out of the pore becomes larger. The escape times, monitored using a 50 mV AC signal, decrease by well over an order of magnitude as the DC drive voltage is increased from 0.0 to 100 mVdc. This result is in good agreement with the work by Wanunu et al. who demonstrated that a change in DC drive voltage, from 0 to 80 mVdc (15 °C), resulted in an approximately 2 orders of magnitude decrease in escape times for a similar hairpin containing a poly-A50 tail.14
Influence of an AC Bias on the One-Dimensional Asymmetric Periodic Potential
In order to account for the affect of the AC bias and temperature on tesc, we assume the DNA molecule can be modeled as a single particle that must be thermally activated to cross over the potential energy barrier from one minimum of the asymmetric periodic potential to the neighboring minimum. The rates at which the molecule takes one step out of the pore or one step into the pore are κout and κin, respectively. In order for the HP-A50 molecule to escape, it must step out of the pore N times more than it steps into the pore, where N is the number of nucleotides in the HP-A50 tail. When the two escape rates are equal (in the absence of an applied electrical field), the mean number of steps to escape is equal to N2. When the escape rates are unequal, there is a bias toward moving in the direction of the higher rate, and the mean number of jumps to escape changes accordingly.
To calculate the mean number of jumps to escape, let us label the position of the DNA by x, and define n̄x(N,pout) as the mean number of steps to escape. The probability that the DNA steps out of the pore (pout) is given by:
| (3) |
We can now define a recursion relation for n̄x:
| (4) |
For the two end points we have: n̄N−1) = 1 +(1 − pout)n̄N−2 (because n̄N is zero by definition) and n̄0) = 1 + n̄1 (because the presence of the hairpin prevents a jump to x) = −1). Equation 4 can be readily solved by starting at the end (with n̄N−1) and working back to n̄0. Setting n̄0 = 50 we find that for pout = 1, n̄0 = 50; for pout = 0.5, n̄0) 2500; and as pout goes below 0.5, n̄0 rapidly increases.
If the mean number of steps for escape is known, the mean time to escape can be computed, given that the mean time for a single step is the reciprocal of the sum of the rates. Thus, the mean escape time is:
| (5) |
where n̄0(N,pout) is the mean number of steps needed to escape, once the HP-A50 molecule has been fully captured (x = 0). The mean escape time is determined by computing values of the escape rates κout and κin as a function of the applied DC and AC voltages. Equations for κout and κin have been derived on the basis of the Eyring equation,30 and a simple periodic potential model (see Supporting Information file for a detailed derivation of eqs 6 and 7):
| (6) |
| (7) |
In both cases, the exponential is linear in the applied AC voltage.
Consider the ramifications of the simplified expressions in eqs 6 and 7. In the case of a symmetric potential (α = 0.5), κout and κin have the same dependency on Vac, so pout is a constant with respect to changes in Vac. At a fixed DC voltage, the mean escape time will then be exponentially dependent on −Vac for Vac > kBT/nbq ≈ 30 mV (assuming a fractional charge (nb) of 0.4).21,26,27 This result is consistent with the near linear dependence of the log of the mean escape time on Vac at voltages above 30 mVac, as shown in Figure 6. Alternatively, for large DC voltages, κout ⟫ κin, so pout ≈ 1, and the mean escape time is exponentially dependent upon Vdc for Vdc > 2kBT/nbq ≈ 60 mV. As shown in Figure 8, the escape time approaches an exponential dependence above Vdc ≈ 50 mV. These qualitative predictions provide a strong indication that the overall model provides a good description of the physical processes being measured.
Equations 5, 6, and 7 in combination with the results from solving eq 4 can be used to model the mean escape time of the HP-A50 molecule. Using a least-squares regression analysis, these equations were fit to the experimental data presented in Figures 6 and 8 in order to determine the most likely values for the four adjustable parameters: ΔS‡, the change in the entropy between the top and the bottom of the barrier; ΔH‡, the height of the activation enthalpy barrier presented by the periodic potential; nb, the effective number of charges per nucleotide; and α, the asymmetry parameter of the periodic potential. Based on the best fits to the experimentally obtained data, presented in Figure 6 and 8, ΔS‡ = (3.41 ± 0.18) × 10−22 J/K; ΔH‡ = (1.74 ± 0.05) × 10−19 J; nb = 0.473 ± 0.008 charges/base, in good agreement with the reported literature value of 0.4;21,26,27 and α = 0.575 ± 0.009. The value obtained here for ΔH‡ is consistent with the Arrhenius activation energy, determined in Figure 5, where ΔH‡ = Ea − RT. This measurement represents the first such measurement in which α is directly measured. While α = 0.575 represents only a small level of asymmetry (0.5 = symmetric), this asymmetry has a large effect on κout and κin, as depicted in Figure 4, and is the reason why an AC signal has such a significant effect on the escape rate of the HP-A50 molecule. Using the best fit value of 1.74 × 10⁻¹⁹ J for ΔH‡, we can calculate ΔG‡ = ΔH‡ − TΔS‡ = 0.81 × 10⁻¹⁹ J (at 0 °C).
We also investigated the effect of our assumption that all 50 of the nucleotides in the tail have passed through the constriction when the molecule is fully driven into the pore. We performed the fit again under the assumption that only 40 of the bases pass through the constriction, so only 40 net jumps out of the pore are required for escape. The best fit parameters in this case are ΔS‡ = (3.36 ± 0.18) × 10−22 J/K; ΔH‡ = (1.75 ± 0.05) 10−19 J, nb = 0.449 ± 0.015 charges/base, and α = 0.613 ± 0.014. The enthalpy term is essentially unchanged from the 50 base case, as expected due to the strong temperature dependence of this term. With respect to the entropy, the mean number of jumps with no driving force is N2, so the base rate needs to change by this factor to maintain the same resultant low voltage diffusion times. From the low AC and DC voltage behavior, we find that the entropy should change by about kb ln(502/402) = 0.06 × 10⁻²² J/K. The best fit entropy changes by 0.05 × 10⁻²² J/K, in good agreement with this simple analysis. The greatest effect is seen with the estimated charges per base and the asymmetry, although the effect is still less than 7%. A better knowledge of the number of nucleotides that pass the constriction will allow for a reduction in this error.
Recently, Martin et al. used nonequilibrium molecular dynamics simulations to determine free energy profiles for translocation of ssDNA through αHL.31 For a single deoxycytidine (dC) nucleotide, they found a free energy barrier of about 6 kcal/mol (~10 kT at 20 °C) localized to the constriction in the αHL pore. A somewhat lower barrier, 2–4 kcal/mol, is computed for a 25 base pair poly(dC) molecule. Our measured free energy, ~18 kT at 20 °C, is quite large compared to these estimates. Ideally, measurement of the escape time over a range of temperatures should provide the most direct measurement of the activation energy. However, temperature dependent changes in the interaction between the ssDNA, the electrolyte solution, and the protein residues on the interior of the pore could lead to an anomalously large energy barrier. If the estimates that place ΔG‡ at or below 10 kT are accurate, then some factor unrelated to the activational energy barrier, but with an exponential temperature dependence, is dominating the slowing of the ssDNA motion as the temperature is reduced.
Frequency Dependence
As depicted in Figure 9, the frequency of the AC probing signal has little effect on the escape times of the HP-A50 molecule between 60 and 200 kHz. Although, the 200 kHz low amplitude (<100 mV) escape times of the HP-A50 molecule do seem to be shorter than for 100 and 60 kHz, there is no statistically significant difference between these escape times due to the error in the parameter estimate. The lack of frequency dependence suggests that the response time of the HP-A50 molecule is fast (⟪5 μs) relative to the time variation of the electric field used to probe its motion, i.e., HP-A50 has adequate time to react and migrate under the influence of the applied electric field. Higher frequency (⟫200 kHz, low amplitude (<100 mV) probing signals could not be examined, due to the fact that the SNR of the measurement in these regimes is simply too low using the present apparatus. However, we anticipate that there is a frequency regime (.200 kHz) where the AC field variation is faster than the response time of HP-A50. In this regime, the overall effect of the AC field may be reduced.
Figure 9.
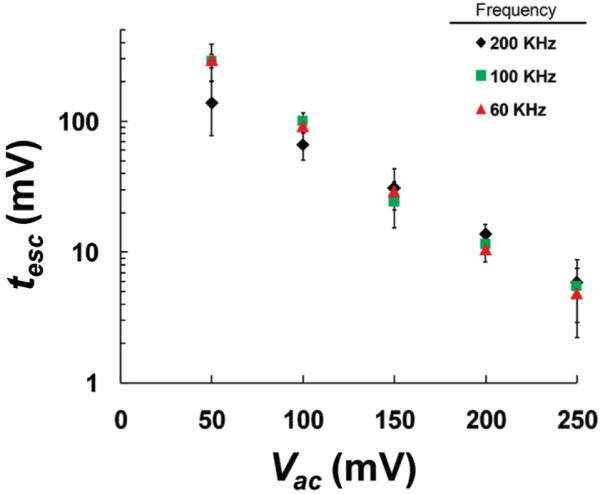
Mean escape time for HP-A50 to escape from the αHL pore, as a function of applied AC amplitude at three different frequencies (60, 100, and 200 kHz). These data were collected at 0 °C.
Conclusion
We have introduced a new AC methodology for monitoring the conductance of an αHL pore as a DNA molecule containing a polydeoxyadenosine tail is driven into and released from the pore. The experimental results presented in this study are well described by a one-dimensional asymmetric periodic potential model, originally described by Lubensky and Nelson.19 By using an AC signal to monitor the DNA-αHL pore interaction, we have been able to directly determine the activation enthalpy energy and asymmetry factor associated with HP-A50-5′ escaping out of the cis side of the αHL pore.
The increase in the escape time with decreasing temperature yields a measured activation energy approximately 2-fold larger than previous estimates.31 Such a large discrepancy is potential evidence that temperature-dependent interactions between the DNA and the protein lumen account for much of the DNA slowing.
The methodology developed here will allow us to map out the structure associated with the periodic potential model for adenines, cytosines, thymines, and guanines exiting both the cis and trans sides of the αHL pore. These studies are currently underway and will be reported in the future. A better understanding of the biopolymer/pore interaction will enable us to better predict the conditions that will allow for controlled DNA translocation.
Supplementary Material
Acknowledgment
This material is based upon work supported by the United States Air Force and the Defense Advanced Research Projects Agency under Contract No. FA9550-06-C-0006, and by the National Institutes of Health under SBIR Grant No. 1R43HG00446601.
Footnotes
Supporting Information Available: Detailed description of the influence of an AC bias on the one-dimensional asymmetric periodic potential. This material is available free of charge via the Internet at http://pubs.acs.org.
References
- (1).Howorka S, Cheley S, Bayley H. Nat. Biotechnol. 2001;19:636–639. doi: 10.1038/90236. [DOI] [PubMed] [Google Scholar]
- (2).Cockroft SL, Chu J, Amorin M, Ghadiri MR. J. Am. Chem. Soc. 2008;130:818–820. doi: 10.1021/ja077082c. [DOI] [PMC free article] [PubMed] [Google Scholar]
- (3).Deamer DW, Akeson M. Trends Biotechnol. 2000;18:147–151. doi: 10.1016/s0167-7799(00)01426-8. [DOI] [PubMed] [Google Scholar]
- (4).Deamer DW, Branton D. Acc. Chem. Res. 2002;35:817–825. doi: 10.1021/ar000138m. [DOI] [PubMed] [Google Scholar]
- (5).Ashkenasy N, Sanchez-Quesada J, Bayley H, Ghadiri MR. Angew. Chem., Int. Ed. 2005;44:1401–1404. doi: 10.1002/anie.200462114. [DOI] [PMC free article] [PubMed] [Google Scholar]
- (6).Portman R. Nanopores: Detecting DNA. Nat. Nanotechnol. 2008 January 18; DOI: 10.1038/nnano.2008.23. [Google Scholar]
- (7).Soni GV, Meller A. Clin. Chem. 2007;53:1996–2001. doi: 10.1373/clinchem.2007.091231. [DOI] [PubMed] [Google Scholar]
- (8).Bates M, Burns M, Meller A. Biophys. J. 2003;84:2366–2372. doi: 10.1016/S0006-3495(03)75042-5. [DOI] [PMC free article] [PubMed] [Google Scholar]
- (9).Kasianowicz JJ, Brandin E, Branton D, Deamer DW. Proc. Natl. Acad. Sci. U.S.A. 1996;93:13770–13773. doi: 10.1073/pnas.93.24.13770. [DOI] [PMC free article] [PubMed] [Google Scholar]
- (10).Sánchez-Quesada J, Saghatelian S, Cheley H, Bayley H, Ghadiri MR. Angew. Chem., Int. Ed. 2004;43:3063–3067. doi: 10.1002/anie.200453907. [DOI] [PMC free article] [PubMed] [Google Scholar]
- (11).Walker B, Krishnasastry M, Zorn L, Kasianowicz J, Bayley H. J. Biol. Chem. 1992;267:10902–10909. [PubMed] [Google Scholar]
- (12).Mathe J, Aksimentiev A, Nelson DR, Schulten K, Meller A. Proc. Natl. Acad. Sci. U.S.A. 2005;102:12377–12382. doi: 10.1073/pnas.0502947102. [DOI] [PMC free article] [PubMed] [Google Scholar]
- (13).Mathe J, Visram H, Viasnoff V, Rabin Y, Meller A. Biophys. J. 2004;87:3205–3212. doi: 10.1529/biophysj.104.047274. [DOI] [PMC free article] [PubMed] [Google Scholar]
- (14).Meni W, Buddhapriya C, Jerome M, David RN, Amit M. Phys. Rev. E: Stat., Nonlinear Soft Matter Phys. 2008;77:031904. [Google Scholar]
- (15).Purnell RF, Mehta KK, Schmidt JJ. Nano Lett. 2008;8:3029–3034. doi: 10.1021/nl802312f. [DOI] [PubMed] [Google Scholar]
- (16).Hu T, Shklovskii BI. Theory of DNA Translocation through Narrow Ion Channels and Nanopores with Charged Walls. Phys. Rev. E: Stat., Nonlinear Soft Matter Phys. 2008;78 doi: 10.1103/PhysRevE.78.032901. [DOI] [PubMed] [Google Scholar]
- (17).Zhang J, Shklovskii BI. Phys. Rev. E: Stat., Nonlinear Soft Matter Phys. 2007;75:21906. doi: 10.1103/PhysRevE.75.021906. [DOI] [PubMed] [Google Scholar]
- (18).Henrickson SE, Misakian M, Robertson B, Kasianowicz JJ. Phys. Rev. Lett. 2000;85:3057. doi: 10.1103/PhysRevLett.85.3057. [DOI] [PubMed] [Google Scholar]
- (19).Lubensky DK, Nelson DR. Biophys. J. 1999;77:1824–1838. doi: 10.1016/S0006-3495(99)77027-X. [DOI] [PMC free article] [PubMed] [Google Scholar]
- (20).Lua RC, Grosberg AY. Phys. Rev. E: Stat., Nonlinear Soft Matter Phys. 2005;72:061918. doi: 10.1103/PhysRevE.72.061918. [DOI] [PubMed] [Google Scholar]
- (21).Ervin EN, Kawano R, White RJ, White HS. Anal. Chem. 2008;80:2069–2076. doi: 10.1021/ac7021103. [DOI] [PubMed] [Google Scholar]
- (22).Zhang B, Galusha J, Shiozawa PG, Wang G, Bergren AJ, Jones RM, White RJ, Ervin EN, Cauley CC, White HS. Anal. Chem. 2007;79:4778–4787. doi: 10.1021/ac070609j. [DOI] [PubMed] [Google Scholar]
- (23).White RJ, Zhang B, Daniel S, Tang JM, Ervin EN, Cremer PS, White HS. Langmuir. 2006;22:10777–10783. doi: 10.1021/la061457a. [DOI] [PubMed] [Google Scholar]
- (24).White RJ, Ervin EN, Yang T, Chen X, Daniel S, Cremer PS, White HS. J. Am. Chem. Soc. 2007;129:11766–11775. doi: 10.1021/ja073174q. [DOI] [PubMed] [Google Scholar]
- (25).McManus OB, Blatz AL, Magleby KL. Eur. J. Physiol. 1987;410:530–553. doi: 10.1007/BF00586537. [DOI] [PubMed] [Google Scholar]
- (26).Nakane J, Wiggin M, Marziali A. Biophys. J. 2004;87:615–621. doi: 10.1529/biophysj.104.040212. [DOI] [PMC free article] [PubMed] [Google Scholar]
- (27).DeGuzman VS, Lee CC, Deamer DW, Vercoutere WA. Nucleic Acids Res. 2006;34:6425–6437. doi: 10.1093/nar/gkl754. [DOI] [PMC free article] [PubMed] [Google Scholar]
- (28).Kramers HA. Physica. 1940;7 [Google Scholar]
- (29).Gardiner CW. Handbook of Stochastic Methods: For Physics, Chemistry, and the Natural Sciences. 3rd ed. Springer; New York, Germany: 2004. [Google Scholar]
- (30).Eyring H. Chem. Rev. 1935;17:65–77. [Google Scholar]
- (31).Martin HSC, Jha S, Howorka S, Coveney PV. J. Chem. Theory Comput. 2009;5:2135–2148. doi: 10.1021/ct9000894. [DOI] [PubMed] [Google Scholar]
Associated Data
This section collects any data citations, data availability statements, or supplementary materials included in this article.