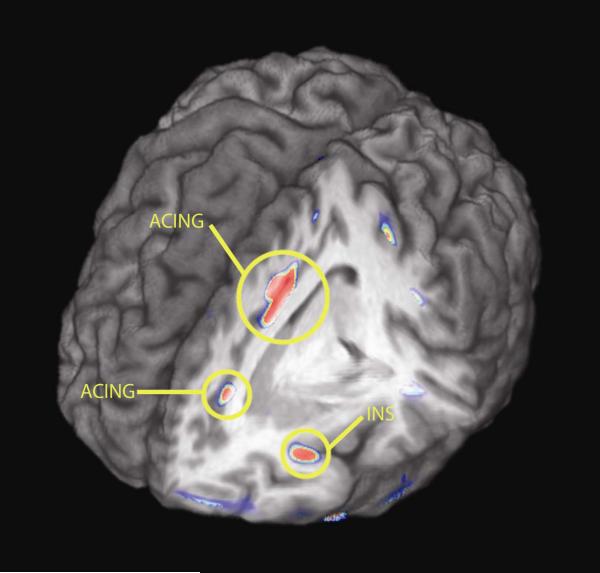
Figure 4.
Brain regions showing reductions in μ-opioid receptor BP after black cohosh treatment, depicted in a 3D view. Standardized Z scores of statistical significance are represented by a pseudocolor scale with the areas in red showing the most significant differences. The most pronounced reductions took place in the anterior insular and cingulate cortex.

